freda williams and susan dreschel, cherokee county school district
TRANSCRIPT

Excel 2010 Take it to the Top
Freda Williams and Susan Dreschel,Cherokee County School District

Why A Spreadsheet?
Incredibly powerfulMore flexible with formulas, lists, sort
and filter optionsPull in data from other programsAnalyze and share informationMake informed decisions Interfaces well with other Office
Products and other spreadsheets

Excel 2010
Lots of new featuresAccess anywhere – even your iPhoneShare Excel with others –
simultaneously!Emphasis on better spreadsheets,
tables and chartsMore professional look and feelBetter analysis = smarter decisionsIntuitive and Real Time!!

Excel – 25 years old!
Celebrate 25 years of Excel with us!
Excel - our beloved app - has reached the ripe old age of 25. In internet years, that's like 200 years old! To celebrate we're kicking off what we hope will be a fun contest centered on fond memories of Excel.
The contest is being run on the Excel Facebook page, so check there for more details on how to enter and get involved.
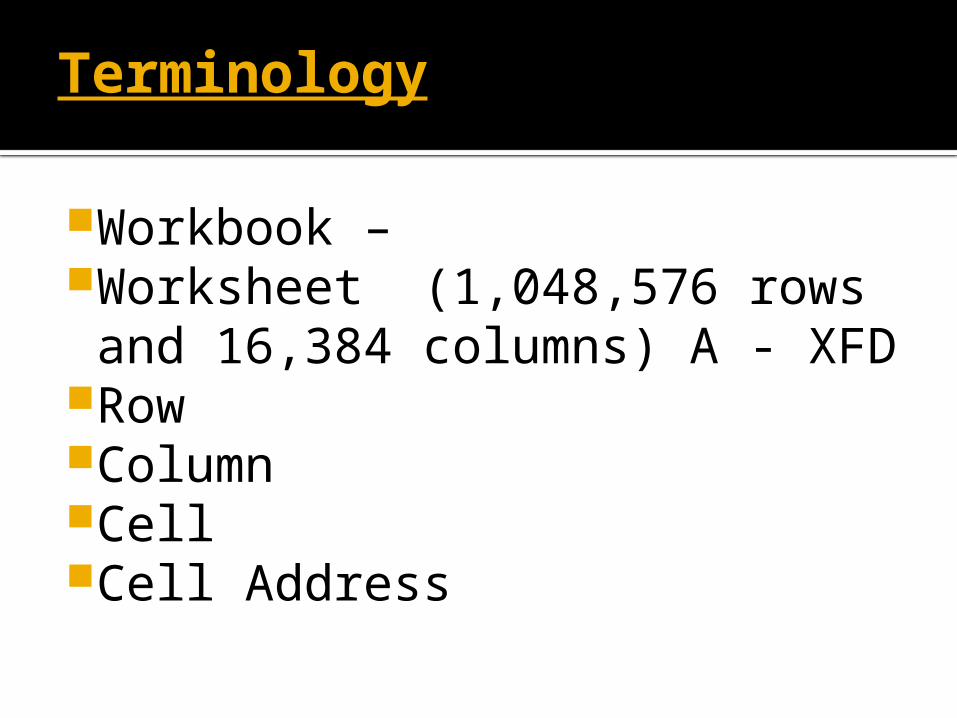
Terminology
Workbook –Worksheet (1,048,576 rows and 16,384 columns) A - XFD
RowColumnCellCell Address
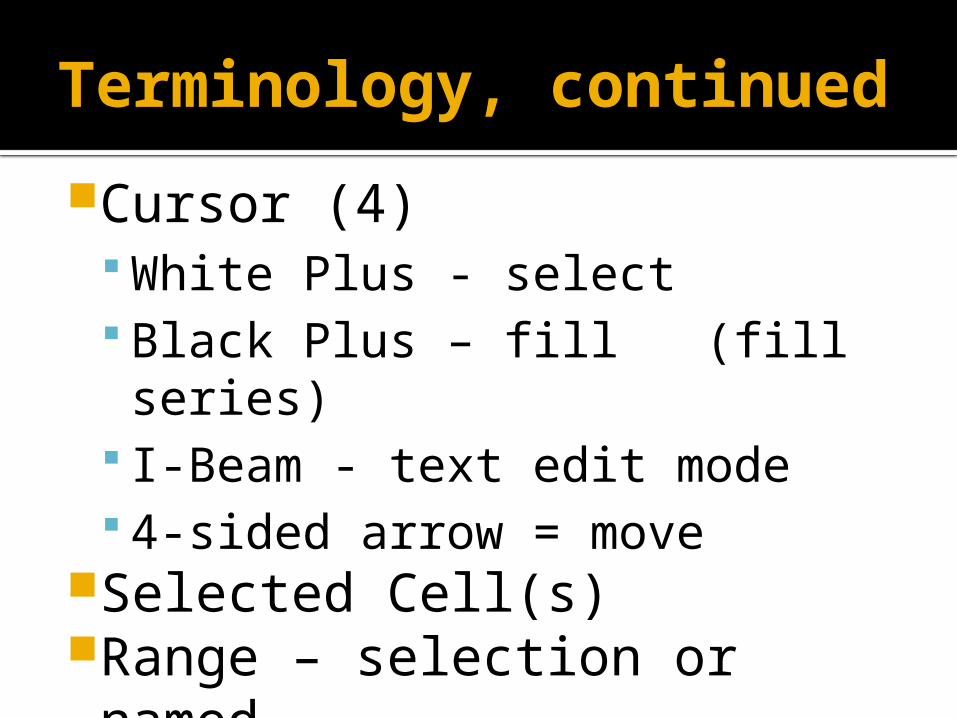
Terminology, continued
Cursor (4) White Plus - select Black Plus – fill (fill series) I-Beam - text edit mode 4-sided arrow = move
Selected Cell(s)Range – selection or namedFormula Bar
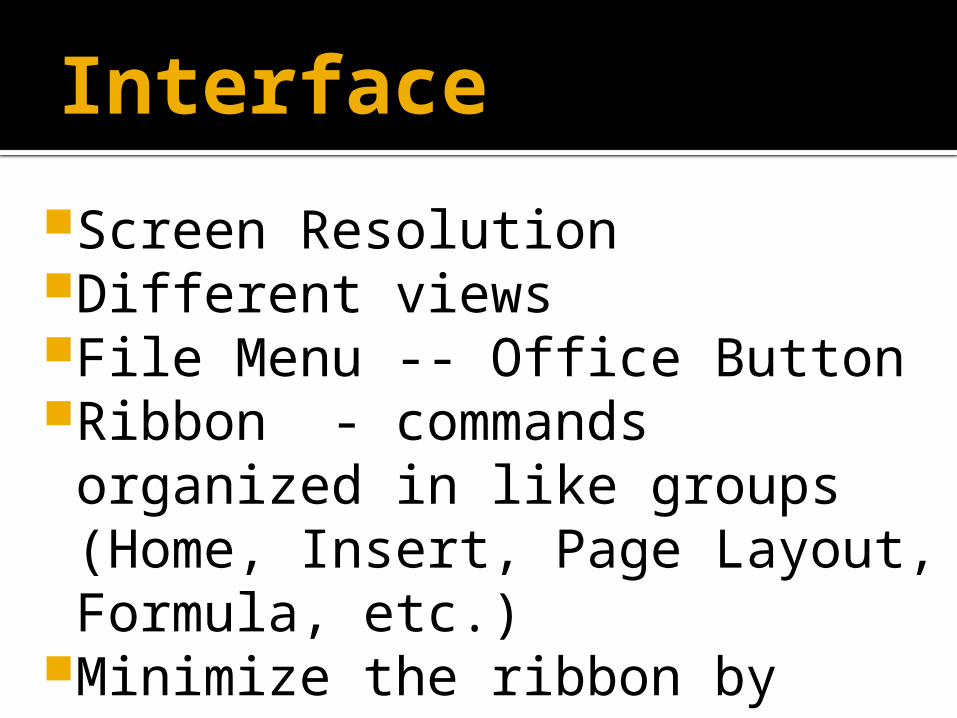
Interface
Screen ResolutionDifferent viewsFile Menu -- Office ButtonRibbon - commands organized in like groups (Home, Insert, Page Layout, Formula, etc.)
Minimize the ribbon by double clicking

Interface,continued
Quick Access Toolbar - Customizable
Key Tips – Alt (screen reminders)Control + X// +C// +VHome, End, Control + Home, etc.Context Menu - right clickMini Toolbar -- accessed through Excel Options
Select cell(s) and right click

Formatting Cells(change the appearance, cell style)
NumberAlignmentFontBorderFill ProtectionMerge and CenterAdjust row and column sizesFit to Column . . .Text Wrap

Formulas and Functions
Must begin with = Sum Average Count Today IF MIN/MAX Show Formulas
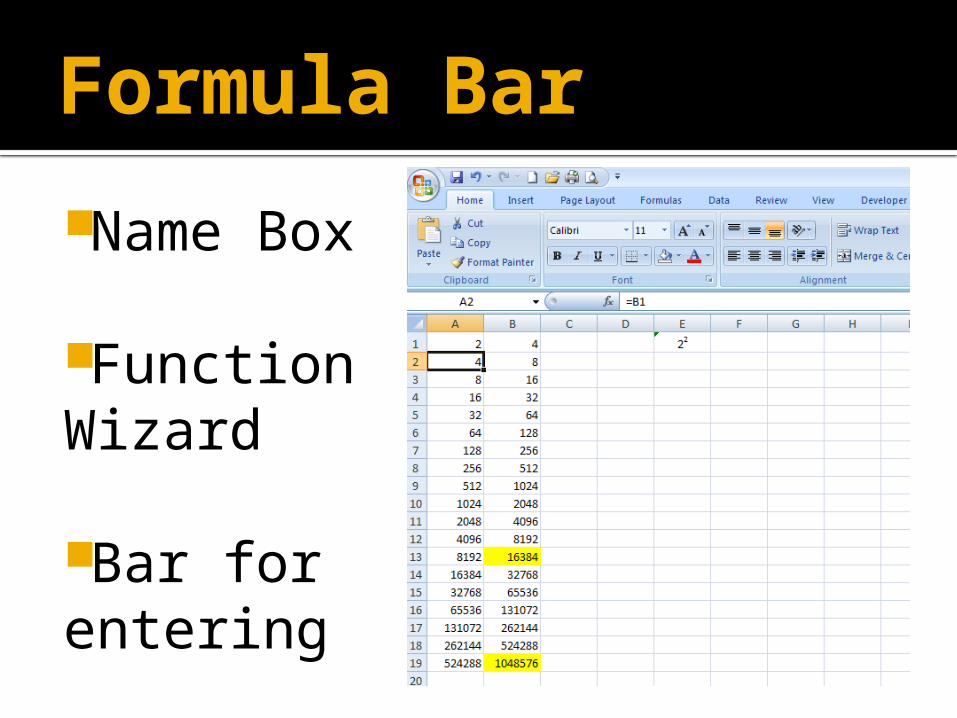
Formula Bar
Name Box
Function Wizard
Bar for entering

Multiple Worksheets
Rename WorksheetRearrange WorksheetsChange ColorsAdd/Delete/Move/CopyProtect Worksheet
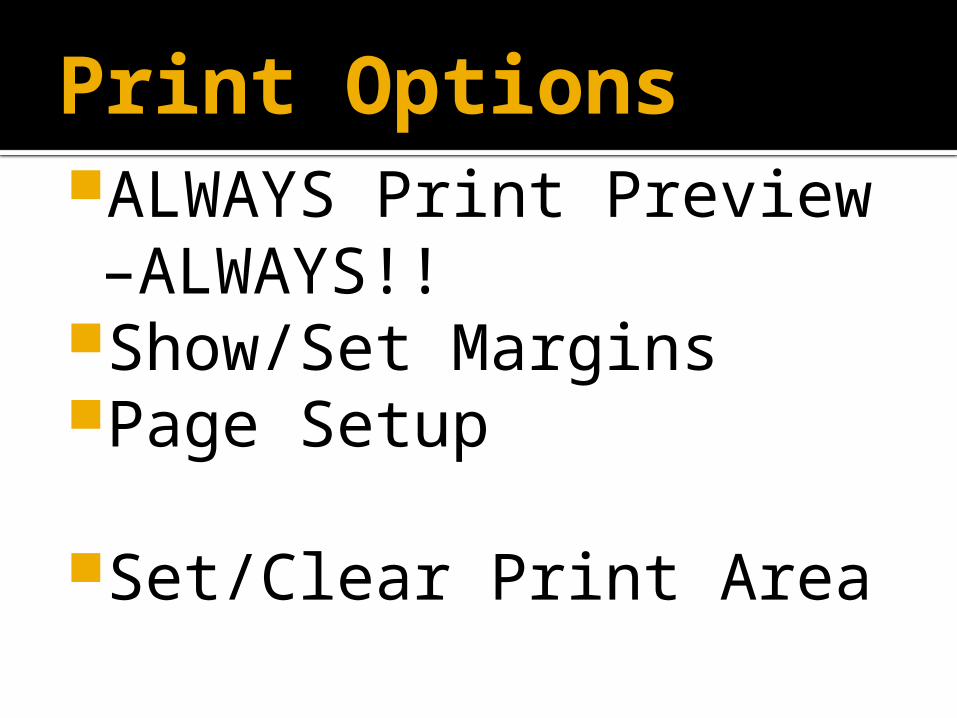
Print OptionsALWAYS Print Preview –ALWAYS!!
Show/Set MarginsPage Setup
Set/Clear Print Area

Excel Charts 101
1. Area selected must be a rectangle
2. No blank rows or columns in selection area
3. Upper left corner must be blank (2003 vs. 2007)
4. Watch out for Totals!!

Choose Chart Type carefully
Move Chart LocationCheck Chart LayoutModify chart elementsGraphing non-contiguous data
Copy into other programs
More Charting Tips:

Homework for next week
Create a Gmail account, if you do not already have one . . .
And now for your TEST!!
Excel for Administrators -Second Session:
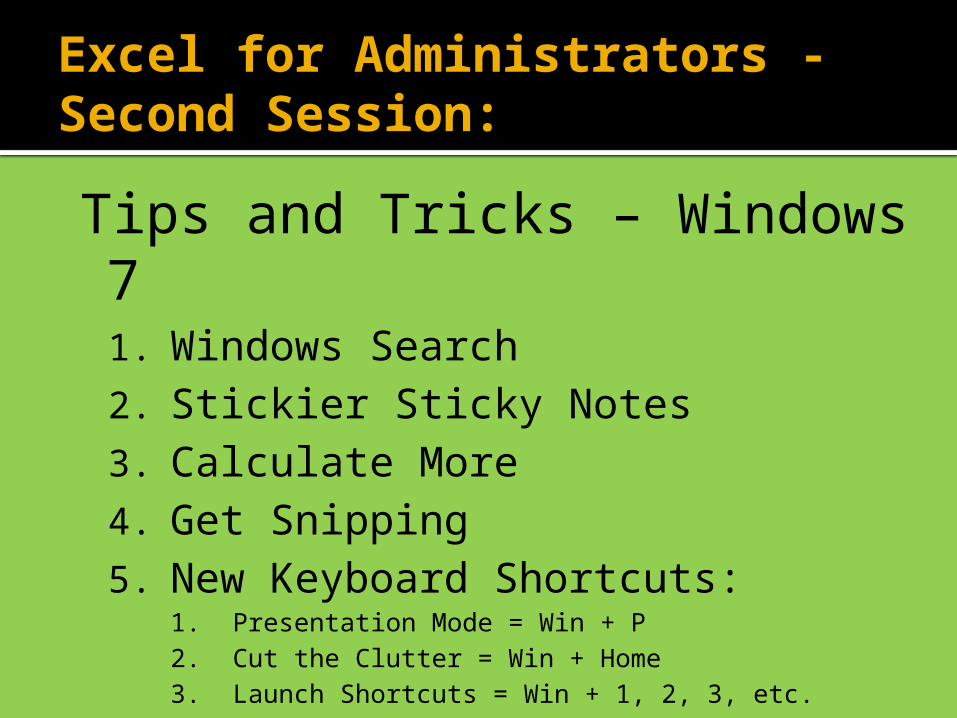
Tips and Tricks – Windows 71. Windows Search2. Stickier Sticky Notes3. Calculate More4. Get Snipping5. New Keyboard Shortcuts:
1. Presentation Mode = Win + P2. Cut the Clutter = Win + Home3. Launch Shortcuts = Win + 1, 2, 3, etc.
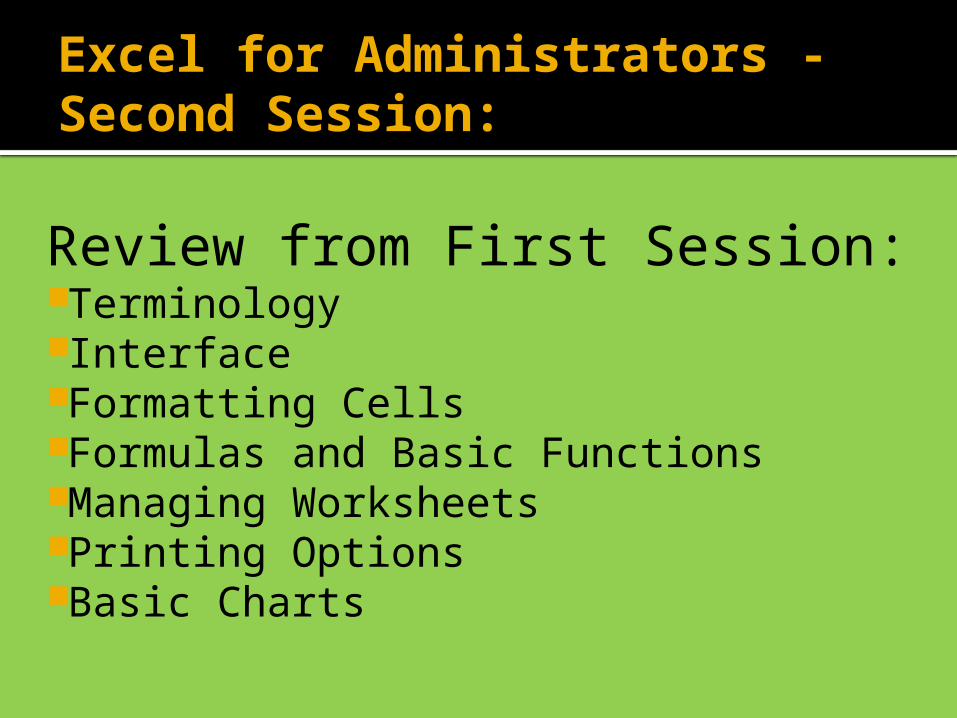
Excel for Administrators -Second Session:
Review from First Session:TerminologyInterfaceFormatting CellsFormulas and Basic FunctionsManaging WorksheetsPrinting OptionsBasic Charts
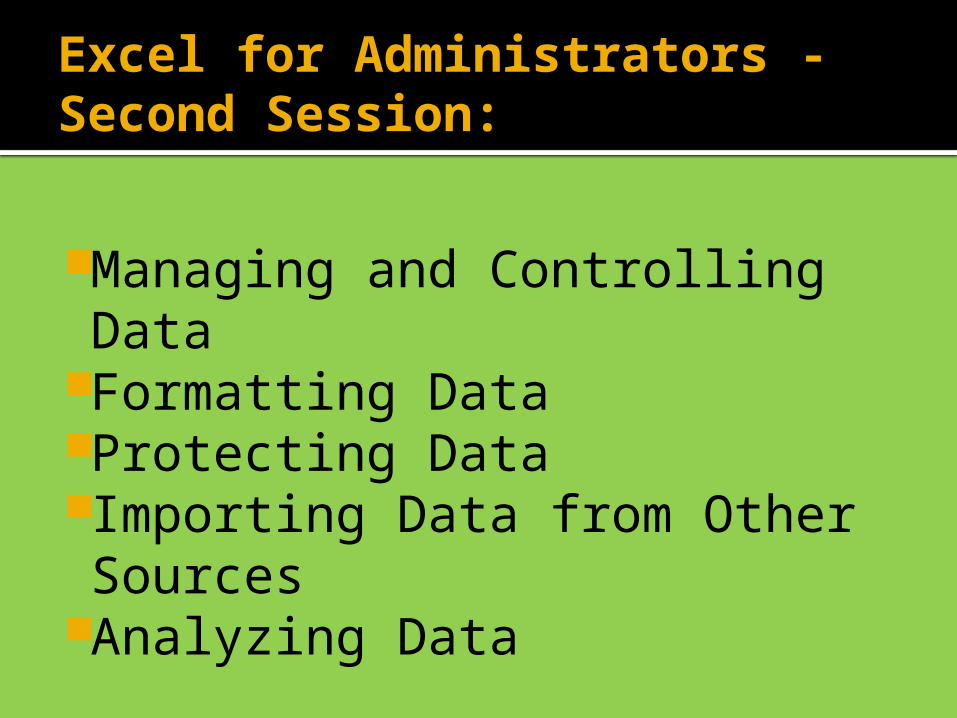
Excel for Administrators -Second Session:
Managing and Controlling DataFormatting DataProtecting DataImporting Data from Other Sources
Analyzing Data
Managing & Controlling Data
Freeze panesHide/Unhide column(s)Add/delete columns and rows
Sorts and custom sortsFilters

Managing & Controlling Data
Conditional FormattingFormat as tableFind and ReplaceConcatenateText to ColumnPaste Special/ Transpose/ Paste Link
Using Formulas/Functions
Review SUM, AVERAGE, COUNT, MAX, MIN
IFCOUNTIFSUMIF
Using Data
Using Excel for SIP Data (pasting links)
Using Google Docs to pull parent information into Excel and Outlook Distribution List
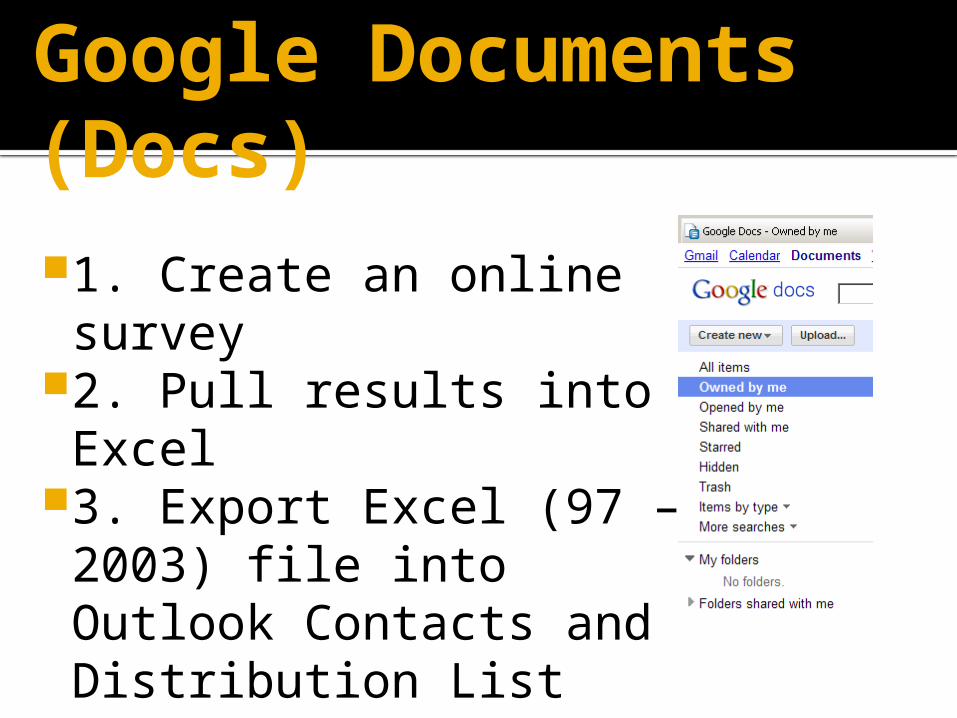
Google Documents (Docs)1. Create an online survey
2. Pull results into Excel
3. Export Excel (97 – 2003) file into Outlook Contacts and Distribution List
Analyzing DataPivot TablesOrganize, summarize and analyze large amounts of data
Updates and revisions are easy and immediate
Pivot Charts – table data in graphic format