free and open source tools to assess software reliability ......free and open source tools to assess...
TRANSCRIPT

Free and Open Source Tools to
Assess Software Reliability and
Security
Vidhyashree Nagaraju, Venkateswaran Shekar, Thierry Wandji2
and Lance Fiondella1
1University of Massachusetts, North Dartmouth, MA 02747
2Naval Air Systems Command, Patuxent River, MD 20670

Questions?

Outline
• Year I deliverables summary
• Guidance
• Software Failure and Reliability Assessment Tool
(SFRAT)
– Architecture
– Review of Year I functionality
– Year II functionality
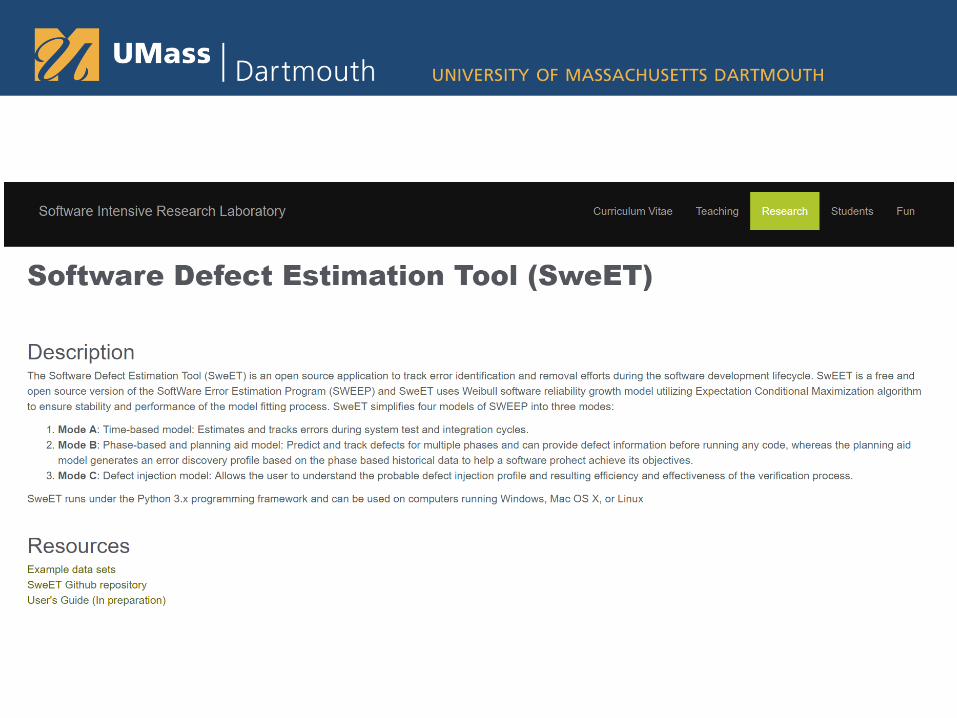
• Software Defect Estimation Tool (SweET)
• Goals

State of software reliability
• Software reliability studied for 50+ years
– Methods have not gained widespread use
• Disconnect between research and practice
• Diverse set of stakeholders
– Reliability engineers
• May lack software development experience
– Software engineers
• May be unfamiliar with methods to predict software reliability

YEAR I (3/15-2/16)
DELIVERABLE SUMMARY

Summary of Year I deliverables
• Implemented open source software reliability tool
– Data conversion routines
– Trend tests for reliability growth
– Two failure rate models
• Assume failure rate decreases as faults detected and removed
– Three failure count models
• Count faults detected as function of time
– Tested on dozens of data sets
– Two goodness of fit measures

Estimates enabled by software
reliability models
• Number of
– Faults detected with additional testing
– Remaining faults
• Mean time to failure (MTTF) of next fault
– Testing time needed to remove next 𝑘 faults
• Probability software does not fail before
completion of fixed duration mission

Failure rate model
Model characterizes decreasing trend in
failure rate
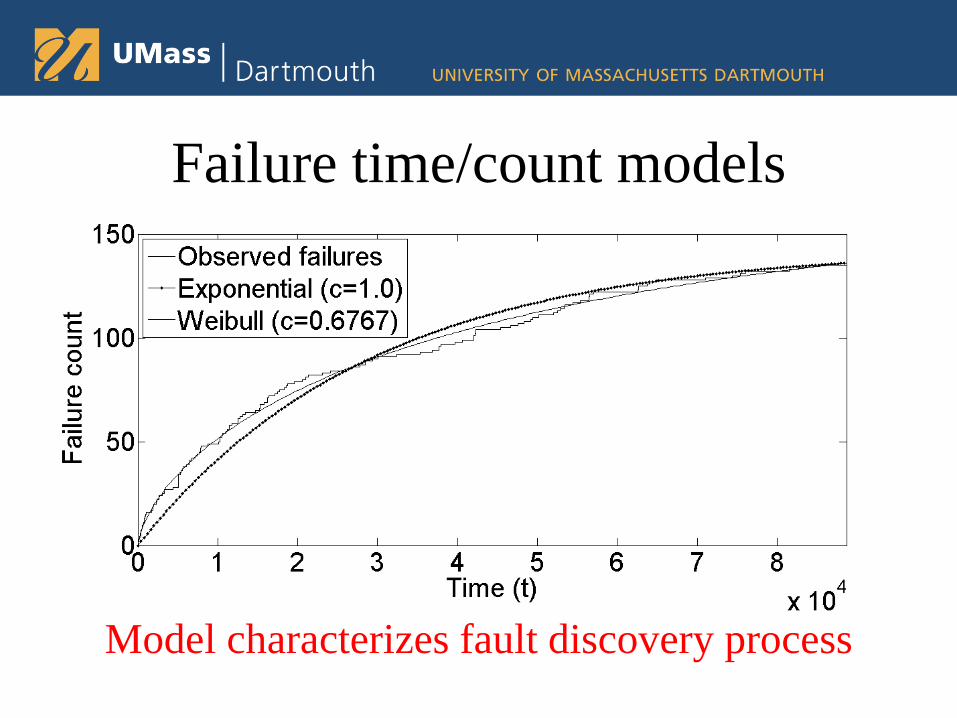
Failure time/count models
Model characterizes fault discovery process

sasdlc.org/lab/projects/srt.html

GUIDANCE

Software Reliability Growth Modeling• No single model characterizes all data sets best
• Models supplementary mathematical guidepost
– Used in conjunction with SDLC activities to identify,
implement, and test functional requirements
• Do not prescribe a single model
• Learn to track before planning in SEPs & TEMPs
• Emphasize
– Effective communication between system, reliability,
and software engineers
– Frequent use of quantitative SRGM throughout DT and
OT to assess progress toward software and system
reliability goals

Software Reliability Growth Tracking• For reliability growth tracking to be effective
– Failures and their severity must be clearly defined
– Impact on mission and end-to-end capability in order to
produce data suitable for reliability growth tracking
– Will be impacted by updates to interacting subsystems
including hardware, mechanical, sensing, and operator
usage

Data formats
• Based on data formats
– Failure Rate models
• Inter-failure times - time between 𝑖 − 1 𝑠𝑡 and 𝑖𝑡ℎ
failure, defined as 𝑡𝑖 = 𝐓𝑖 − 𝐓𝑖−1• Failure times – vector of failure times,
𝐓 =< 𝑡1, 𝑡2, … , 𝑡𝑛 >
– Failure Counting models
• Failure count data - length of the interval and
number failures observed within it,
< 𝐓,𝐊 >=< 𝑡1, 𝑘1 , 𝑡2, 𝑘2 , … , 𝑡𝑛, 𝑘𝑛 >
– Possible to use change requests during DT

Data quality
• Accuracy
– Critically depends on availability of failure data
– Inaccurate records of time make model fitting and
prediction difficult
• Even when data available
– Practitioner must know how to filter and organize data
for use in models
• Filter to exclude: non-software issues, duplicate failures, etc…

SOFTWARE FAILURE AND
RELIABILITY ASSESSMENT
TOOL (SFRAT)

ARCHITECTURE
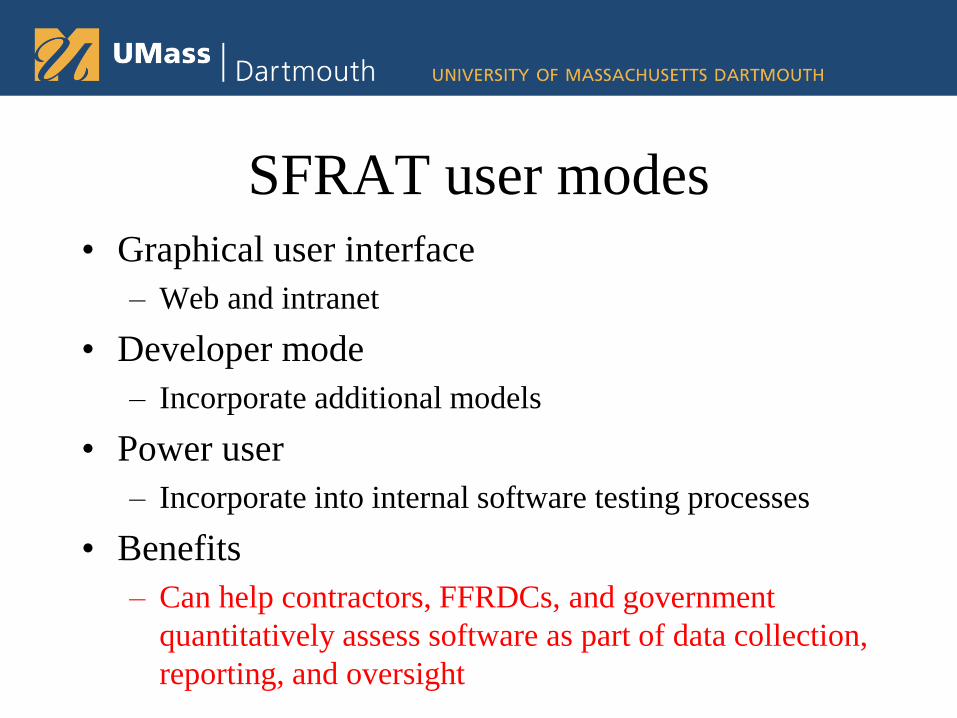
SFRAT user modes
• Graphical user interface
– Web and intranet
• Developer mode
– Incorporate additional models
• Power user
– Incorporate into internal software testing processes
• Benefits
– Can help contractors, FFRDCs, and government
quantitatively assess software as part of data collection,
reporting, and oversight

SFRAT – File structure
server.R
ui.R
trend_tests1. Laplace_trend_test.R
2. RAA.Rinstall_script.R
utilityData
a.Data_Tools.R
Metricsa.GOF.R
Plotsa.PlotModelResults.R
b.Plot_Raw_Data.R
c.Plot_Trend_Tests.R
Predictiona.Detailed_prediction.R
tablesa.DataAndTrendTables.R
b.ModelResultTable.R
RunModels.R
models
GO
DSS
Wei
JM
GM
New models added in the “models” folder

Power user mode
• Code can be tailored for internal use
– Build into existing automated software testing
procedures to provide near real-time feedback
of reliability trends
– Many industry standard programming
languages can call R functions
• Visual Basic, Java, C/C#/C++, and Fortran
• Ensures tool will integrate smoothly

REVIEW OF YEAR I FUNCTIONALITY

SFRAT - Tab view
Evaluate model performance
Detailed model queries
Apply models, plot results
Open, analyze, and subset file

Tab 1
Select, Analyze, and Filter data

Tab 1 – After data upload
Cumulative failure data view

Laplace trend test – SYS1 data
Decreasing trend indicates reliability growth
(Indicates application of SRGM appropriate)

Laplace trend test – J4 data
Does not exhibit reliability growth
(Indicates additional testing required)

Running Arithmetic Average –
SYS1 data
Increasing trend indicates reliability growth

Tab 2
Set Up and Apply Models

Cumulative failures
Plot enables comparison of data and model fits

Time between failures
Times between failures should increase (indicates reliability growth)

Failure intensity
Failure intensity should decrease (indicates reliability growth)

Reliability growth curve
Can determine time to achieve target reliability

Tab 3
Query Model Results

Failure Predictions
Can identify potential schedule overruns

Tab 4
Evaluate Models

AIC and PSSE
Lower values preferred

YEAR II (7/16-7/17) SFRAT
FUNCTIONALITY

• Upper and lower confidence limits
– Graphical and tabular values
• Model Evaluation Criteria
– Prequential likelihood (PL) ratio
• Identify model more likely to produce accurate
estimates
– Higher preferred
– Model bias (MB) and MB trend
• Indicate whether model over/underestimates
times between failures
• Optimal release


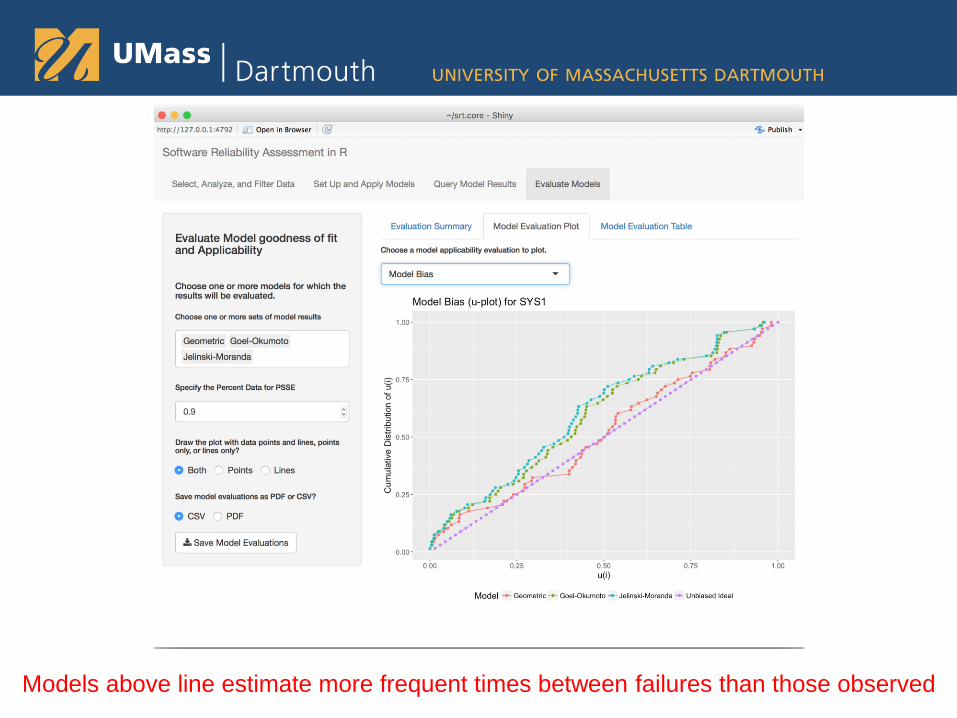
Models above line estimate more frequent times between failures than those observed
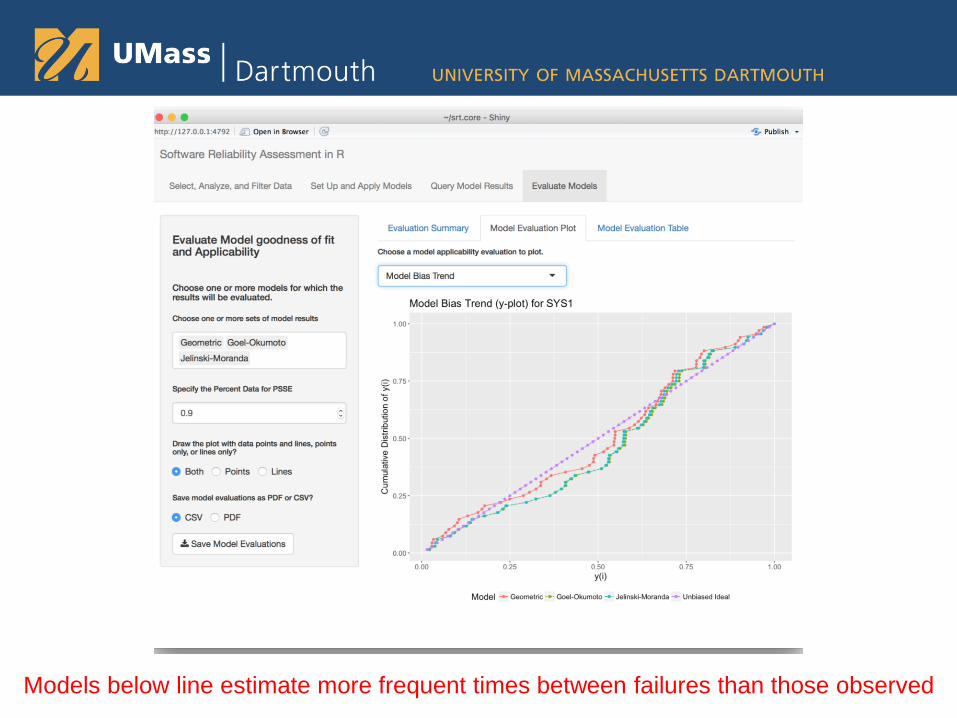
Models below line estimate more frequent times between failures than those observed


SOFTWARE DEFECT
ESTIMATION TOOL (SWEET)

SWEEP (Software Error
Estimation Program)• Implemented four modes
1. Time-based model
• Estimates and tracks errors during system test and integration
cycle
2. Phase-based model
• Provides defect information before running any code
3. Planning aid
• Generates an error discovery profile based on historical data
4. Defect injection model
• Allows user to understand probable defect injection profile

GOALS

Activities
• Update documentation
• Outreach, education, and training
– Visit DoD labs and listen to practical concerns
underlying modeling requirements
– Work with existing users
• Coordinate contributions from developers
– Failure severity decomposition
– Software readiness metrics
– Additional models, Bayesian, covariate
– Expand architecture to additional stages of lifecycle

Covariate data example

Covariate model data fit

Stakeholder outreach

Acknowledgements
• This work was supported by (i) the Naval Air Warfare
Center (NAVAIR) under contract N00421-16-T-0373
and (ii) the National Science Foundation (NSF)
(#1526128).