free calcium in serum. ii.rigor of homeostatic - clinical chemistry
TRANSCRIPT
1.175 to 1.375 mmol/liter
2.275 to 2.575 mmol/Iiter
26 to 44 mg/liter
67 to 81 9/liter
37 to 509/liter
7.33 to 7.45 (serum)
0.2 to 0.7 pig/liter
CLIN. CHEM. 19/6, 575-582 (1973)
CLINICAL CHEMISTRY, Vol. 19, No. 6, 1973 575
Free Calcium in Serum. II.Rigor of Homeostatic Control,Correlations with Total Serum Calcium,and Review ofData on Patients with Disturbed Calcium Metabolism
Jack H. Ladenso& and George N. Bowers, Jr.2
Two hundred and fifteen measurements of free(ionic) and total calcium were performed on serafrom 184 patients in whom some disturbance in cal-cium metabolism was suspected. The correlationCoefficient between free and total calcium was 0.94,but a scattergram indicated that free calcium con-centration cannot be predicted from knowledge oftotal calcium concentration. In “normal” individualsthe correlation coefficient was only 0.45. Homeosta-sis of free and total calcium was examined by mak-ing periodic measurements in seven normal individu-als over a period of eight months; the variabilityaround the individual’s mean value was 1.2% for freecalcium and 1.9% for total calcium. Free calcium,as properly measured by the ion-specific electrode,is a better measure of calcium status than is totalcalcium in the disease states studied, which weremostly hyperparathyroidism, multiple myeloma, andrenal failure.
Additional Keyphrases: diagnostic acid #{149}parathyroidhormone
Materials and Methods
Blood for CaF2 analysis was collectedso as to fill
a red-top Vacutainer tube (Becton-Dickinson Co.,Rutherford, N. J. 07070), the tube was placed on ice,and the sample was brought quickly to the laborato-
ry.Processing of the serum and operation of the elec-trode used for CaF2 measurements are described indetail in the companion paper (14). The methodsused in thisstudy and the reported limitsforhealthy
adults are given inTable 1.
Results
Homeostasis
The long-term precisionand accuracy achieved for
CaF2 (14) and totalcalcium (CaT2) (15, 21) anal-ysis warranted a preliminary study of the calcium
homeostasis in man. Blood was collected from sevenhealthy laboratory workers after an overnight fast at
It is now generally accepted that free calcium(CaF2) isthe physiologicallyactive form of calcium
in the blood (1). Investigationsof CaF2 changes invarious disease stateshave been reported,in which it
was measured by the tetramethylmurexide or mu-rexide methods (2-9), but only a few reports of
CaF2+ measurement in diseaseare availablein whichthe calcium electrode was used (10-13). This paperpresents data on calcium homeostasis; correlation offree calcium with other clinical laboratory measure-ments, especially total calcium; and the results ob-
tained for the first 184 patients for whom CaF2measure ments were requested.
From the Clinical Chemistry Laboratory, Hartford Hospital,Hartford, Conn. 06115.
1 Formerly Postdoctoral Fellow in Clinical Chemistry, HartfordHospital; present address: Washington University School of Med-icine, Division of Laboratory Medicine, Barnes Hospital, St.Louis, Mo. 63110.
2 Reprint requests should be sent to G. N. B., Jr.Received Dec. 7, 1972; accepted Mar. 15, 1973.
Table 1. Methods and Normal ValuesUsed In This Study
Test (reference no.) Limits for healthy adults
1. Free calcium (CaF2i,by electrode (14)
2. Total calcium (Ca’r2),by at. absorp. spectr.(15)
3. Inorganic phosphorus(Ps), by Auto-Analyzer (16)
4. Total protein (T.P.), byrefractometry (17)
5. Albumin, by electro-phoresis (18)
6. pH, by glass electrode(19)
7. Parathormone, byradioimmunoassay’3(20)
“Performed by the Endocrine unit of Massachusetts General Hospitalunder the direction of John Potts, Jr., M.D.

Table 2.
Subject n
Calcium
Mean,mmol/liter
Homeostasis in SevenVariance
about mean(Vuncorr)
Healthy PersonsVariance
about mean”(Vcorr.)
Cv aboutmean (corr.)
Free calcium
ABCDEFG
Median
Total calcium
58764
66
1.2151.2851.2551.221.2351.3251.28
1.255
0.00330.00220.00330.00040.00550.01660.0052
0.0033
0.0009-0.0002
0.0009-0.0020
0.00310.01420.0028
0.0009
1.2%0.01.2%0.02.3%4.5%1.3%
1.2%
3.9%2.8%0.4%2.0%1.0%1.4%1.9%
1.9%
which, for free calcium, is
and for total calcium is
0.03360.02030.0004
0.00840.00230.00480.0086
0.0084
0.10 0.260.63
0.320.59
CaF2+CaT2+
576 CLINICAL CHEMISTRY, Vol. 19, No.6,1973
A 5 2.32 0.0380B 7 2.47 0.0247C 7 2.38 0.0048D 6 2.315 0.0128E 5 2.43 0.0067F 6 2.40 0.0092G 5 2.395 0.01 30
Median 2.395 0.0128“Calculated similarly to Harris et al. (22):
Vcorr = Vuncorr - (Long-term analytical variance) + (1/2) (within-run analytical variance)
Vcorr = Vuncorr - (0.05)2 + (1/2) (0.015)2
Vcorr = Vuncorr - (0.07)2 + (1/2) (0.03)2
intervalsof at leasttwo and usually four to sixweeksfor a total period of about eight months. The correct-ed coefficient of variation about each individual’smean (Table 2) is identical with the “biological vari-ability” of Harris et al. (22). The median variabilityfor free calcium was 1.2%, for total calcium 1.9%.
Correlationbetween CaF2+ and CaT2+,and Data on Patients
Table 3 shows the correlation coefficients for freeand total calcium for the data obtained in this studyand the study of healthy adults described in the pre-vious paper (14). A plot of free calcium vs. total cal-cium found in the 215 analyses on 184 consecutivepatients examined in this study is shown in Figure 1.Most of these analyses were requested for patients inwhom a calcium disturbance was likely, and so wecannot generalize concerning the prevalence of ab-normal CaF2+ concentrations in a general popula-tion. Appendixes 1-4 show the pertinent individuallaboratory data for the patients to be discussed
below. Patients will be referred to by the patientnumber shown in these Appendixes.
Discussion
Homeostasis
The measured median value forthe variabilityof a
healthy individual’sCaF2 (1.2%) is higher than thatsuggested by Harris and DeMets (23), who calculat-
ed a value of 0.5% from CaT2+, pH, and total proteinmeasurements by use of the McLean-Hastings no-mogram applied to 68 normal subjects. The median
Table 3. Correlation Coefficients betweenConcentrations of Total and Free Calcium in
Sera of Groups IndicatedCaT2 pH P Protein Aib.
Healthy group (79 analyses)
CaF2 0.45 0.02
CaT2+
All patients (215 analyses)
CaF2 0.94
Hemodialysis patients (32 patients sampledpre-dialysis)
0.73 0.014 0.070.001 0.06
Hyperparathyroid patients (32 analyses)
CaF2 0.91
value observed for CaT2+ (1.9%) compared well withthe 1.7% reported for the “biological variability” oftotal calcium by Cotlove et al. (24).
Knowledge of this relatively fine homeostasis ofcalcium in healthy individuals is of considerable im-portance when contrasted with the “aberrant ho-meostasis” of total calcium reported by Drach andKing for hyperparathyroid patients (25). Only fur-ther study will reveal the diagnostic utility of mea-surements of the homeostasis of free calcium, but ourstudies do show the need for precise, bias-free ana-lytical methods for these quantities.

1.63
1.50
l.3e
125
t. 1.13
‘1.00
a
I - #{163}
I #{163}aI aI 0 8I#{149} aI a oa
a a #{149}#{149}a #{163}
a aa aa ao ,0
a
0o a
x
xx
0.
ox.
0 o 8OO #{149}0xo
o xo98o88 0e5a oooo
o9 o
0
0 00
0
#{149}Soa
0
0
0 0 ‘‘
8a
0 0 0 0 0 #{149}#{149} 0 OXOX X#{149}0
a0
a0
#{149}0
Fig. 1. Comparison of freeand total calciumA = hyperparathyroidiSm; #{149}=
malignancies; X = renal dis-ease including hemodialysis(pre); 0 = other diagnoses
0
““V
1.75 2.00 2.25 2.50 2.75a
Cop’ (mmol/liter)
3.00
Appendix 1. Laboratory Data and Diagnosis for Patients with High CaF2 a
Date CaF2 CaT2 P PTH Protein Aib pH Diagnosis
Parathyroid adenoma1.48 8.5 4.8 7.41 Parathyroidadenoma,
8.1 4.6 7.34
Patient No.
1
2
3
4567
89
1011
12
13
14
151617181920
21222324
1.25
1.84
1.28
3.06
6.9 3.9 7.41 Parathyroid adenomaParathyroid adenoma
Parathyroid adenomaParathyroid adenomaAdenoma and hyperplasia
8.2 4.2 7.36 Parathyroid hyperplasia
Parathyroid adenoma at postmortemexam
Diagnosed hyperparathyroidism
7.53 Diagnosed hyperparathyroidism7.56 Diagnosed hyperparathyroidism
Diagnosed hyperparathyroidismDiagnosed hyperparathyroidismDiagnosed hyperparathyroidismDiagnosed hyperparathyroidismDiagnosed hyperparathyroidism
7.8 3.9 Diagnosed hyperparathyroidism1.222.53 6.8 2.8 7.44 Diagnosed hyperparathyroidism0.70 6.8 4.3 Diagnosed hyperparathyroidism
<0.45 Diagnosed hyperparathyroidism4.60 Cyst of thyroid (not sectioned),
bladder carcinoma f postmortemexam
CLINICAL CHEMISTRY, Vol. 19, No. 6, 1973 577
25
3/24/721/10/ 721/11/722/1 5/723/31/725/4/724/4/7211/9/727/31/728/1/7211/8/ 714/21/ 727/25/7211/8/7112/10/ 711/7/723/3/724/11/726/28/72
3/23/723/27/724/20/724/19/723/3/723/23/724/19/725/1/724/14/723/8/723/15/722/18/725/12/727/20/723/17/72
2.025 3.525 2.71.62 2.95 2.71.46 2.675 3.31.50 2.80 2.81.425 2.65 2.61.475 2.80 3.51.45 2.75 3.31.39 2.4751.725 3.325 2.61.75 3.40 2.21.255 2.45 2.51.475 2.90 2.91.44 2.525 6.21.47 2.6751.48 2.675 2.41.57 2.7251.50 2.65 3.81.425 2.60 3.01.875 3.825
1.60 2.90 2.91.60 2.95 2.21.575 3.025 2.21.35 2.90 1.71.525 2.675 2.81.475 2.85 3.71.47 2.80 3.21.45 2.80 3.01.45 2.65 2.91.45 2.60 4.01.425 2.725 3.41.475 2.60 5.01.55 2.825 3.11.545 2.925 2.51.95 3.45 2.9
5/17/72 2.205 3.75 3.06/6/72 1.05 2.075 2.6
0.530.830.761.011.44
0.56<0.40 post-op
Parathyroid adenoma
Parathyroid adenomaParathyroid adenoma
Ovarian tumor believed to be secret-
ing PTH-like material
(cont’d)

Patient No. Date CaF2 CaT2 P PTH Protein Alb pH DIagnosis
26 2/3/72 1.415 2.40 2.9 8.3 4.5 7.38 Intermittenthypercalcemia27 1/19/72 1.395 2.525 2.5 <0.50 8.2 5.2 7.40 Renal calculi, hypertension, inter-
5/5/72 1.275 2.525 2.6 mittent hypercalcemia
28 1/6/72 1.455 2.50 7.32 Functional depression, occasional1/10/72 1.305 7.38 increased calcium
phosphatedepletingdiet
11/12/721/13/72
1.3351.355
2.452.475 2.8
<0.507.6 3.5
7.327.40
29 8/8/72 1.40 2.40 3.9 Hematuria, slight bone demineraliza-8/17/72 1.275 2.50 3.5 tion
30 8/25/72 1.40 2.60 3.2 Hypercalcemia,? etiology31 1/11/72 1.785 3.38 2.2 7.6 3.6 7.47 Carcinomaofcervixwith metastases32 2/3/72 1.535 2.66 4.5 7.47 Metastatic breast carcinoma33 2/3/72 1.495 2.575 2.8 7.3 3.4 7.42 Carcinoma of lung with metastases34 1/5/72 1.465 2.775 3.2 <0.50 6.9 3.8 7.41 Anaplastictumorofchestwall35 7/14/72 1.48 2.775 3.7 Malignant lymphoma of prostate36 2/25/72 2.445 4.225 4.1 5.4 2.7 7.51 Lymphosarcoma stage IV37 3/1/72 1.50 2.775 3.1 <0.45 Carcinomaoflungwithmetastases
3/13/72 1.45 2.675 2.77/17/72 1.40 2.325 2.6 <0.35
38 4/19/72 1.40 3.05 4.5 11.3 3.2 IgAmultiplemyeloma39 2/2/72 1.40 2.55 5.2 3.22 7.3 4.3 7.34 Hemodialysis patient, sampled
predialysis40 2/3/72 1.385 2.225 3.0 1.40 7.7 4.1 7.2141 7/10/72 1.46 2.775 2.4 <0.40 Rightthyroidadenoma
7/12/72 1.41 2.75 2.0 0.38 post-op42 2/22/72 1.425 2.675 2.3 <0.45 Follicular adenona of thyroid43 1/19/72 1.43 2.55 2.7 <0.45 8.8 5.3 7.35 Pseudotumorcerebri
1/18/72 2.7251/21/72 2.50
Appendix 1. (continued)
578 CLINICAL CHEMISTRY, Vol. 19, No.6,1973
#{176}In these appendixes, calcium values are in mmol/liter. parathyroid hormone in .tg/liter, protein and albumin in g/dl.
Correlation
The relativelyhigh correlationbetween CaF2+ and
Cav2+ (r = 0.94) in our patients is in agreementwith that found by Wills and Lewin (2) and Moore(10, 26), and the low correlationin normal individu-als (rxy = 0.45) also agrees with the findings of oth-ers (10, 26-29). Correlations between total calciumand either protein or albumin in the healthy groupwere low, in agreement with other reports (10, 26,29-31), and nonexistent in the hemodialysis group.
The correlation between free and total calcium
shown in Table 3 illustrate the pitfalls of over-reli-ance on such quantities as described by Reed (32).While the correlation coefficient (0.94) for the datashown in Figure 1 would be considered good, thescatter around the regression line is plainly largeenough to prelude predictions of the free calciumconcentration from data on the total calcium con-centration. Indeed, the poor correlations betweentotal calcium and protein or albumin and experiencewith the McLean-Hastings nomogram (33) haveshown that it is necessary to measure free calciumrather than use derived or calculated values if one isinterested in assessing this parameter.
Review of Data on PatientsHigh CaF2+ Concentration in Serum
Hyperparathyroidism. One of the diseases in
which one expects most typicallyto find a high valuefor serum calcium ishyperparathyroidism. Previous-
ly considered very rare, the frequency in the generalpopulation is now said to be 1.5:1000 (34, 35).
As seen in Figure 1 (solid triangles) and as listedin Table 4, 34 CaF2+ analyses were performed on 24such patients (Patients 1-24). The diagnosis, givenin the patient’s discharge summary, was supportedby tissue examination in 12 cases (Patients 1-12)and by clinical and laboratory findings (excludingfree calcium) in another 12. An additional five pa-tients (Patients 26-30) in whom hyperparathyroid-ism has not been completely ruled out were alsostudied, as well as one confirmed case (Patient 25) ofparathyroid hormone-like secretion from an ovariantumor.
As grouped in Table 4, 30 paired measurements onthe 24 patients with confirmed or diagnosed hyper-parathyroidism gave a typical high CaF2-highCaT2+ pattern, and four paired measurements onfour patients were not typical. Two of these atypical

PatientNo. Date CaF2 Ca-r2 Pg PTH Protein Aib pH DiagnosIs
44 6/6/72 1.31 2.725 3.1 <0.40 Acute tubular necrosis; normal sized, yellowish-brown parathyroids (not sectioned) post-mortem exam
45 6/9/72 1.31 2.65 4.3 0.40 Chronicpepticulcerdisease6/9/72 1.285 2.60 4.4 0.52
46 3/29/72 1.26 2.60 3.9 8.0 4.7 Chronicobstructivepulmonarydisease47 8/18/72 1.35 2.625 3.348 6/15/72 1.30 2.575 3.9 Acute asthma, bronchitis
6/17/72 1.225 2.50 3.5 7.1 4.0 Pneumonia49 1/13/72 1.21 2.575 3.0 5.24 7.0 4.5 7.38 Hemodialysis, sampled predialysis50 4/28/72 1.31 2.575 3.1 <0.4 Hypercalcemia,? etiologySi 8/24/72 1.35 2.625 4.9 11.1 5.1 Sarcoidosis with pulmonary involvement, renal
failure38 4/19/72 1.40 3.05 4.5 11.3 3.2 IgG multiple myeloma
4/20/72 1.325 2.775 5.0 7.5352 6/6/72 1.215 2.775 5.9 IgA multiple myeloma
11 15 (1 borderline) 3
1 112 14 (2 borderline) 1
1 2
5 58 10 (2 borderline)
23 3
“Increased caFl+ and CaT2+.
Appendix 2. Laboratory Data and Diagnosis for Patients with Normal CaF2, High CaT2
CLINICAL CHEMISTRY, Vol. 19, No. 6, 1973 579
Table 4. High CaF2 Results,Sorted According to Diagnosis
No. Results ResuitsDiagnosis patients typical” atypical
Hyperparathyroid-ism
Surgically con-firmed
Confirmed atautopsy
DiagnosedEctopically pro-
duced para-thyroid hor-mone
Diagnosis notyet ruled out
MalignanciesChronic renal fail-
ureOther
proven cases (Patients 6 and 10) had an elevated
CaF2+ with normal CaT2+ at the time of measure-ment. A third confirmed case (Patient 8) had com-pletely normal CaF2+ and CaT2+ concentrations onone occasion eight months before an adenoma wassurgically removed. No subsequent Ca52+ analysiswere performed on this patient, but the total calci-
um concentration in her serum later became supra-normal before the adenoma was removed. The fourth
atypical result (Patient 14, on 4/19/72) was found inthe case of a patient diagnosed as having hyperpara-thyroidism, and showed a normal CaF2+ and an el-
evated CaT2+. This patient was in acute respiratoryalkalosis (serum pH = 7.56) caused by pulmonaryemboli. We think that the acute alkalosis caused a
change in Ca-protein binding and thus a lower thanexpected CaF2. The next day, the alkalosis contin-ued (pH = 7.53), but the results for C8F2 andCaT2+ were both markedly supranormal. Because
parathyroid hormone presumably controls CaF2+concentrations, we believe that the high concentra-tions of this hormone in this patient succeeded in in-creasing the Car2+ concentrations even though alka-losis continued. (This case is compared with a simi-lar one without hyperparathyroidism later in thisdiscussion).
One patient (Patient 25) had a parathyroid hor-mone-like secretion from an ovarian tumor. Beforethe tumor was removed, the CaF2+ and CaT2+ con-centrations were extremely high, 2.20 and 3.75
mmol/liter, respectively. Both values dropped pre-
cipitously to below normal after the tumor was re-
moved.
2 In five patients (Patients 26-30) hyperparathy-roidism has not been completely ruled out. Four ofthem exhibited increased concentrations of Car2+
with normal concentrations of CaT2+, and in three ofthese patients episodes of high CaT2 had previouslybeen noted. The fifth patient has shown moderatelyincreased concentrations of both CaF2+ and CaT2+.
It is apparent that two confirmed cases fitting thedefinition of normocalcemic hyperparathyroidism(36) were encountered who had high concentrationsof free calcium. One additional surgically confirmed
case (Patient 11) and two clinically diagnosed unop-erated cases (Patients 20 and 21) had borderlinetotal calcium concentrations (2.60 mmol/liter), butvalues for free calcium were clearly elevated.
The only hyperparathyroid patient having a nor-mal CaF2+ and high CaT2+ concentration is readilyexplainable on the basis of acute alkalosis and a re-peat sample the next day showed a high CaF2. It isour opinion, in agreement with another recent report(13), that repeated free calcium measurements will

Date CaF2 CaT2 Pg PTH Protein AIb pH Diagnosis
7.1 4.1 7.340.39 8.4 4.5 7.280.57 7.2
8.3
4.04.1
7.317.29
2.20 8.3
7.95.0
3.57.30
7.288.72 6.5
6.74.0
3.87.35
7.29.93 8.1 4.8 7.27
PatientNo.
53 1/19/7254 1/19/7255 1/19/72
56 1/19/7257 2/2/72
58 1/28/72
59 1/21/7260 2/2/7261 2/2/7262 6/20/72
63 6/20/7264 12/25/7165 2/14/7266 3/15/72
5/5/72
6/10/72
6/13/7267 1/21/7268 4/28/72
69 5/17/726/8/726/22/728/17/72
70 5/18/72
1.211.3151.24
1.20
1.1251.1251.1251.2751.271.1751.201.231.1751.1651.071.14
1.1151.231.175
0.951.201.27
1.20
1.195
2.192.1752.152.1252.1252.2252.202.252.252.1752.152.2252.102.151.8252.252.202.252.225
1.7752.2252.3252.2752.10
6.87.06.3
7.0
5.48.0
7.213.56.24.04.6
3.14.12.35.03.64.2
4.0
5.33.12.9
3.53.8
5.8
7.1 2.4
Hemodialysis patients, sampled predialysis
Adenocarcinoma of large bowelCarcinoma in situ, cervix, uteri
7.50 Multiple myeloma7.28 Chronic pancreatitis
Chronic pancreatitis
7.44 Post-thyroidectomyHypothyroidism, compensated bronchial
asthmaSprue
Appendix 3. Laboratory Data and Diagnosis for Patients with Normal CaF2+, Low CaT2+
580 CLINICAL CHEMISTRY, Vol. 19, No.6,1973
be helpful in most cases of normocalcemic hyper-parathyroidism and finding supranormal values forCaF2 offers significant aid in the diagnosis of hyper-
parathyroidism.Other causes of elevated free calcium. Elevated
CaF2+ with borderline total calcium was found intwo patients with malignancies (Patients 32 and 33)
and with a normal CaT2+ in a case of pseudo tumorcerebri (Patient 43). High CaF2 was encountered intwo patients (Patients 39 and 40) on chronic renalhemodialysis, sampled just before dialysis, one ofwhom had a normal value for Cav2+ and the other aslightly low CaT2. We do not now know whetherthese patients have “tertiary” hyperparathyroidism.
The trend of these results is similar to those al-ready revised for the hyperparathyroid patients,namely, that a normal total calcium concentration in
the serum does not necessarily mean that the freecalcium is also normal.
Normal CaF2+, High CaT2+Concentrations inSerum
If persistently increased free calcium, even whenthe total calcium is normal, suggests functionalhypercalcemia, then the converse should be true. Ex-cept for the one alkalotic patient already mentioned,this situation appears to be supported by our clinicalmaterial. In one patient with high CaT2 in whomthere was a strong question of hyperparathyroidism,the CaF2+ was normal, parathyroid hormone was<0.40 tg/liter, and at autopsy yellowish-brownparathyroids of normal size were seen.
Perhaps the most important identifiable subgroupin this category is those patients in whom excessive
calcium-protein binding was suspected. One patientwith sarcoidosis (Patient 51) had a total protein of
111 g/liter with Car2 of 2.625 mmol/liter and nor-mal CaF2. Two patients with multiple myeloma(Patients 38, 52), one with an IgA-type paraproteinand the other with IgG type, had completely normalvalues for free calcium but a significantly increasedtotal calcium. Patient 38 presented an interestingcontrast to the alkalotic hyperparathyroid case dis-cussed previously. In this myeloma patient, alkalosis(pH, 7.53) was present as in the hyperparathyroidcase, but when a blood sample was drawn the nextday, the free calcium was still within the normalrange, while the pH remained high. We suspect, incontrast to the hyperparathyroid patient, that para-thyroid hormone activity was normal or low, and sothe free calcium remained normal. Calcium bindingin patients with multiple myeloma has been reported(37) and disputed (7, 38). The two patients de-scribed above appear to have had a high concentra-tion of bound calcium, and indicate the need for fur-ther study of the free calcium status of this impor-tant hypercalcemic disease group.
The pattern of high CaT2 and normal CaF2 wasalso found in patients with chronic obstructive pul-monary disease, acute asthma, and chronic renalfailure. In reviewing all of the material in the normalCaF2-high CaT2 category, we find support for thethesis that a repeated normal CaF2 rules out func-tional hypercalcemia even in the presence of an ele-
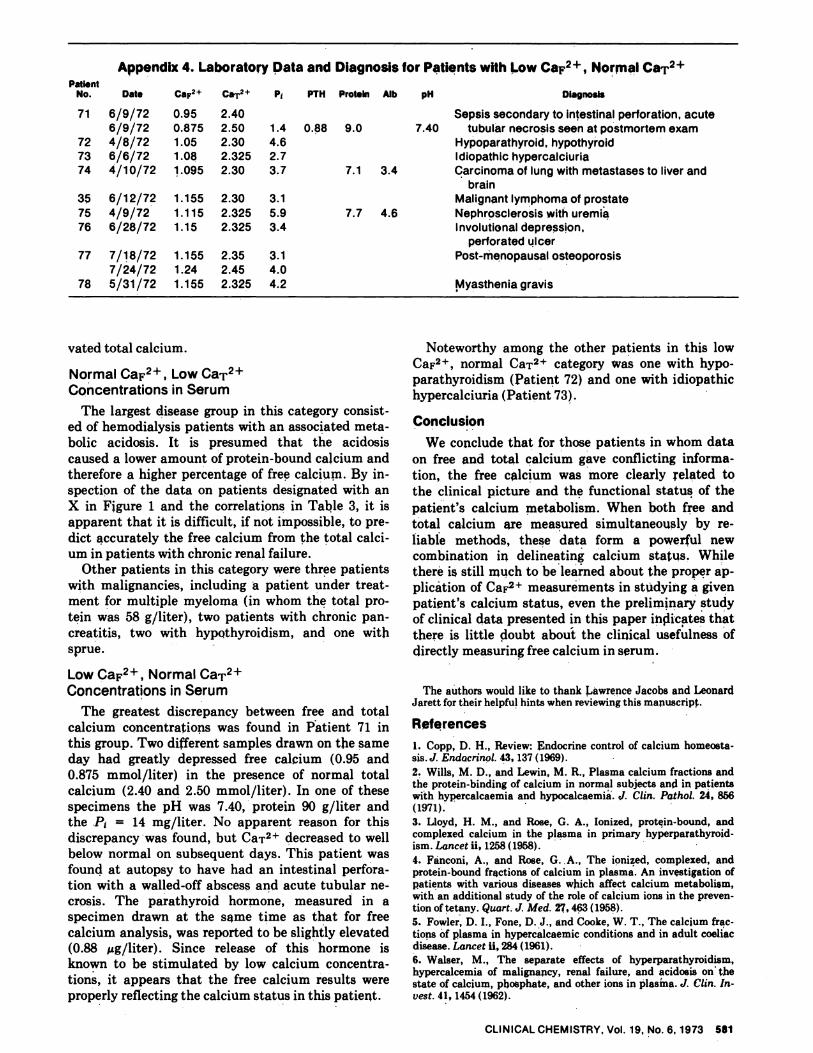
PatientNo. P PTH Protein Aib pH DIagnosisDate CaF2’ CaT2+
71
727374
6/9/726/9/72
4/8/726/6/724/10/72
0.950.875
1.051.081.095
2.402.50
2.302.3252.30
35
75
76
6/12/72
4/9/72
6/28/72
1.155
1.1151.15
2.30
2.3252.325
77
78
7/18/72
7/24/72
5/31/72
1.155
1.24
1.155
2.35
2.45
2.325
0.88 9.0
7.1 3.4
7.7 4.6
1.44.62.7
3.7
3.1
5.93.4
3.14.04.2
Sepsis secondary to intestinalperforation,acute7.40 tubular necrosis seen at postmortem exam
Hypoparathyroid, hypothyroidIdiopathic hypercalciuriaCarcinoma of lung with metastases to liver and
brainMalignant lymphoma of prostate
Nephrosclerosis with uremiaInvolutionaldepression,
perforated ulcer
Post-menopausal osteoporosis
Myasthenia gravis
Appendix 4. Laboratory Data and Diagnosis for Patients with Low CaF2, Normal CaT2
CLINICALCHEMISTRY, Vol. 19, No.6, 1973 581
vated total calcium.
Normal CaF2+, Low CaT2+Concentrations in Serum
The largest disease group in this category consist-ed of hemodialysis patients with an associated meta-
bolic acidosis. It is presumed that the acidosiscaused a lower amount of protein-bound calcium andtherefore a higher percentage of free calcium. By in-spection of the data on patients designated with anX in Figure 1 and the correlations in Table 3, it isapparent that it is difficult, if not impossible, to pre-dict accurately the free calcium from the total calci-um in patients with chronic renal failure.
Other patients in this category were three patientswith malignancies, including a patient under treat-ment for multiple myeloma (in whom the total pro-tein was 58 g/liter), two patients with chronic pan-creatitis, two with hypothyroidism, and one withsprue.
Low CaF2+, Normal CaT2+Concentrations in Serum
The greatest discrepancy between free and totalcalcium concentrations was found in Patient 71 inthis group. Two different samples drawn on the sameday had greatly depressed free calcium (0.95 and0.875 mmol/liter) in the presence of normal totalcalcium (2.40 and 2.50 mmol/liter). In one of thesespecimens the pH was 7.40, protein 90 g/liter andthe P1 = 14 mg/liter. No apparent reason for this
discrepancy was found, but CaT2+ decreased to wellbelow normal on subsequent days. This patient wasfound at autopsy to have had an intestinal perfora-tion with a walled-off abscess and acute tubular ne-crosis. The parathyroid hormone, measured in aspecimen drawn at the same time as that for freecalcium analysis, was reported to be slightly elevated(0.88 zg/liter). Since release of this hormone isknown to be stimulated by low calcium concentra-tions, it appears that the free calcium results wereproperly reflecting the calcium status in this patient.
Noteworthy among the other patients in this lowCaF2, normal CaT2 category was one with hypo-parathyroidism (Patient 72) and one with idiopathichypercalciuria (Patient 73).
Conclusion
We conclude that for those patients in whom dataon free and total calcium gave conflicting informa-tion, the free calcium was more clearly related tothe clinical picture and the functional status of the
patient’s calcium metabolism. When both free andtotal calcium are measured simultaneously by re-liable methods, these data form a powerful newcombination in delineating calcium status. Whilethere is still much to be learned about the proper ap-plic#{225}tionof CaF2 measurements in studying a givenpatient’s calcium status, even the preliminary studyof clinical data presented in this paper indicates that
there is little doubt about the clinical usefulness of
directly measuring free calcium in serum.
The authors would like to thank Lawrence Jacobs and LeonardJarett for their helpful hints when reviewing this manuscript.
References
1. Copp, D. H., Review: Endocrine control of calcium homeosta-sis.J. Endocrinol. 43, 137(1969).
2. Wills, M. D., and Lewin, M. R., Plasma calcium fractions andthe protein-binding of calcium in normal subjects and in patientswith hypercalcaemia and hypocalcaemia. ,J. Clin. Pathol. 24, 856(1971).
3. Lloyd, ii. M., and Rose, G. A., Ionized, protein-bound, andcomplexed calcium in the plasma in primary hyperparathyroid-ism. Lancet ii, 1258(1958).4. Fanconi, A., and Rose, G. A., The ionized, complexed, andprotein-bound fractions of calcium in plasma. An investigation ofpatients with various diseases which affect calcium metabolism,with an additional study of the role of calcium ions in the preven-tion of tetany. Quart. J. Med. 27, 463 (1958).
5. Fowler, D. I., Fone, D. J., and Cooke, W. T., The calcium frac-tions of plasma in hypercalcaemic conditions and in adult coeliacdisease. Lancet ii, 284(1961).
6. Walser, M., The separate effects of hyperparathyroidism,hypercalcemia of malignancy, renal failure, and acidosis on thestate of calcium, phosphate, and other ions in plasma. J. Clin. In-vest. 41, 1454(1962).

582 CLINICAL CHEMISTRY, Vol. 19, No. 6, 1973
7. Dale, N. E., and Kellerman, G. M., The binding of calcium bythe plasma proteins in hyperparathyroidism. Clin. Sci. 32, 433(1967).
8. Kotzaurek, R., Uber Erfahrungen mit neueren Untarsu-chungsmethodens bei Mineralstoffwechselstudien. II. lonisiertes
Calcium in Blutserum. Arch. Kim. Med. 213,96(1967).9. Weeke, E., and Friis, Th., Serum fractions of calcium andphosphorus in uraemia. Acta. Med. ,Scancj. 189,79(1971).
10. Moore, E. W., Studies with ion-exchange calcium electrodesin biological fluids: Some applications in biomedical research andclinical medicine. In Ion-Selective Electrodes, R. A. Durst, Ed.,Nat. Bur. Stand. Spec. PubI. 314, U. S. Government Printing Of-fice, Washington, D. C., 1969, p 215.
11. Moore, E. W., Stqdies with ion-exchange calcium electrodes.III. The state of serum calcium in patients with cirrhosis. Gastro-enterology 60, 43(1971).12. Sachs, C. H., Bourdeau, A. M., Broyer, M., and Balsan, S., Lecalcium ionis#{233},A cours de l’hemodialyse dans l’insuffisance re-nale chronique. Ann. Biol. Clin. 28, 137 (1970).13. Low, J. C., Schaaf, M., Earll, J. M., Piechocki, J. T., and Li,T-K, Ionic calcium determination in primary hyperparathyroid-ism.J. Amer. Med. Ass. 223, 152 (1973).14. Ladenson, J. H., and powers, G. N., Jr., Free calcium inserum. I. Determination with the ion-specific electrode, and fac-tors affecting the results. Clin. Chem. 19, 565(1973).15. Pybus, J., Feldman, F. J., and Bowers, G. N., Jr., Measure-ment of total calcium in serum by atomic absorption spectropho-tometry, with use of a strontium internal reference. Clin. Chem.16,998(1970).
16. Fiske, C. A., and SubbaRow, Y., J. Biol. Chem. 66, 375(1925), as modified for Technicon Method File No. N-4a.
17. T. S. Meter, Model 10401 (American Optical Co., Bpffalo,N.Y.).
18. Methods Manual, Model R-100, Mcrozone ElectrophoresisSystem RM TB 010, Aug. 1967, Beckman Instrument Co.
19. Corning Operational Manual for Model 165 pH/PCO2/PO2Meter, Corning Glass Works, Medfield, Mass. 02052.20. Deftos, L. J., and Potts, J. T., Jr., Radioimmunoassay forparathyroid hormone and calcitonin. Brt. J. Hosp. Med. (Nov.),1813(1969).
21. Cali, J. P., Mandel, J., and Young, D. S., A reference methodfor the determination of calcium in serum. NBS Spec. PubI. 260-36(1972).
22. Harris, E. K., Kanofsky, P., Shakarjii, G., and Cotlove, E.,Biological and analytic components of variation in long-termstudies of serum constituents in normal subjects. II. Estimatingbiological components of variation. Clin. Chem. 16, 1022 (1970).
23. Harris, E. K., and DeMets, D. L., Biological and analyticalcomponents of variation in long-term studies of serum constitu-
ents in normal subjects. V. Estimated biological variations in ion-ized calcium. Clin. Chem. 17,983(1971).
24. Cotlove, E., Harris, E. K., and Williams, G. Z., Biologicaland analytic components of variation in long-term studies ofserum constituents in normal subjects. ffi. Physiological andmedical implication. Gun. Chem. 16, 1028(1970).25. Drach, G. W., and King, J. S., Jr., Estimating aberrant ho-meostasis: Variance in serum calcium concentration as an aid indiagnosis of hyperparathyroidism. Gun. Chem. 16,792(1970).
26. Moore, E. W., Ionized calcium in normal serum, ultrafil-trates, and whole blood determined by ion-exchange electrodes. J.Clin. Invest. 49, 318(1970).
27. Pittinger, C., Chang, P. M., and Faulkner, W., Senm ionizedcalcium; Some factors influencing its level. Southern Med. J. 64,1211 (1971).
28. Lingarde, F., and Zettervall, 0., Serum ionized calcium in anormal population studied with a calcium ion-selective electrode.Isr. J. Med. Sci. 7,510(1971).
29. Seamonds, B., Twofighi, J., and Aryan, D. A., Determinationof ionized calcium in serum by use of an ion-selective electrode. I.Determination of normal values under physiological conditions,with comments on the effects of food ingestion and hyperventila-tion. Clin. Chem. 18, 155 (1972).30. Orrell, D. H., Albumin as an aid to the interpretation ofserum calcium. Gun. Chim. Acta 35,483(1971).
31. Keating, F. R., Jr., Jones, J. D., Elveback, L. R., and Rand-all, R. V., The relation of age and sex to distribution of values inhealthy adults of serum calcium, inorganic phosphorus, magne-sium, alkaline phosphatase, total proteins, albumin, and bloodurea. J. Lab. Gun. Med. 73, 825 (1969).
32. Reed, A. H., Misleading correlations in clinical applications.Clin. Chim. Acta 40,266(1972).
33. McLean, F. C., and Hastings, A. B., The state of calcium inthe fluids of the body I. The conditions affecting the ionization ofcalcium. J. Biol. Chem. 108, 285 (1935).
34. Preisman, R. A., and Mehnert, J. H., A plethora of primaryhyperparathyroidism. Arch. Surg. (Chicago) 103, 12 (1971).
35. Boonstra, C. E., and Jackson, C. E., Serum calcium surveyfor hyperparathyroidism: Results in 50,000 clinic patients. Amer.J. Gun. Pat ho!. 55,524(1971).
36. Wills, M. R., Normocalcaemic primary hyperparathyroidism.Lancet i, 849(1971).
37. Prasad, A. S., and Funk, E. B., The base binding property ofthe serum proteins with respect to calcium. J. Lab. Clin. Med.51,345(1958).
38. Hansen, S. D., and Theodorsen, L., The usefulness of an im-proved calcium electrode in the measurement of ionized calciumin serum. Clin. Chmm. Acta 31, 119(1971).