free chlorine presentation.ppt - c.ymcdn.com · 3 what is a free residual? chlorine in ‘pure’ h...
TRANSCRIPT
1
Breakpoint
Chlorination…
Do you Really
Have a Free
Chlorine
Residual?Chloramination
Nitrification
Disinfection Byproducts
Bob Spon, chemist
Spon Water Consulting
2
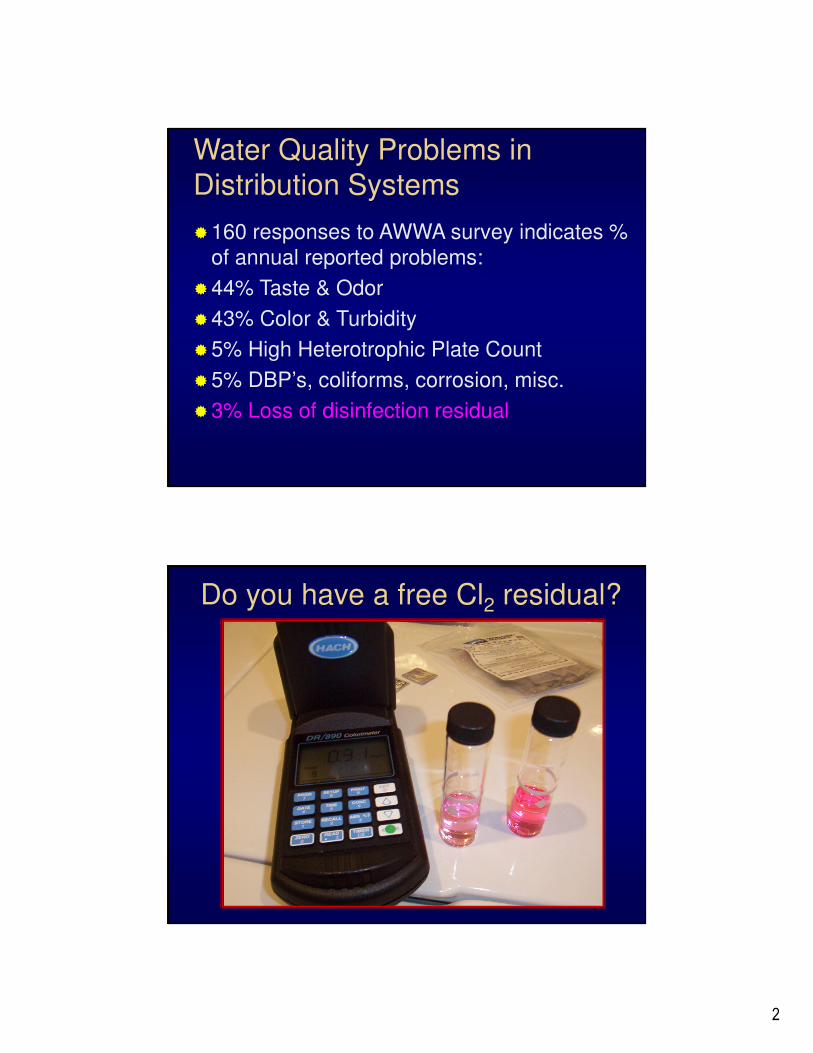
Water Quality Problems in
Distribution Systems
�160 responses to AWWA survey indicates %
of annual reported problems:
�44% Taste & Odor
�43% Color & Turbidity
�5% High Heterotrophic Plate Count
�5% DBP’s, coliforms, corrosion, misc.
�3% Loss of disinfection residual
Do you have a free Cl2 residual?
3
What is a free residual?
� Chlorine in ‘pure’ H2O = HOCl + OCl-
� HOCl = Hypochlorous Acid
� OCl- = Hypochlorite Ion
� Free chlorine residual = HOCl / OCl-
� Free ‘available’ chlorine is very reactive
� Total Chlorine – Free = Combined
� Minimum system chlorine residuals:
� IL EPA: 0.2 free / 0.5 mg/L total
� IA DNR: 0.3 mg/L free / 1.5 mg/L total
� FL DEP: 0.2 mg/L free / 0.6 mg/L total
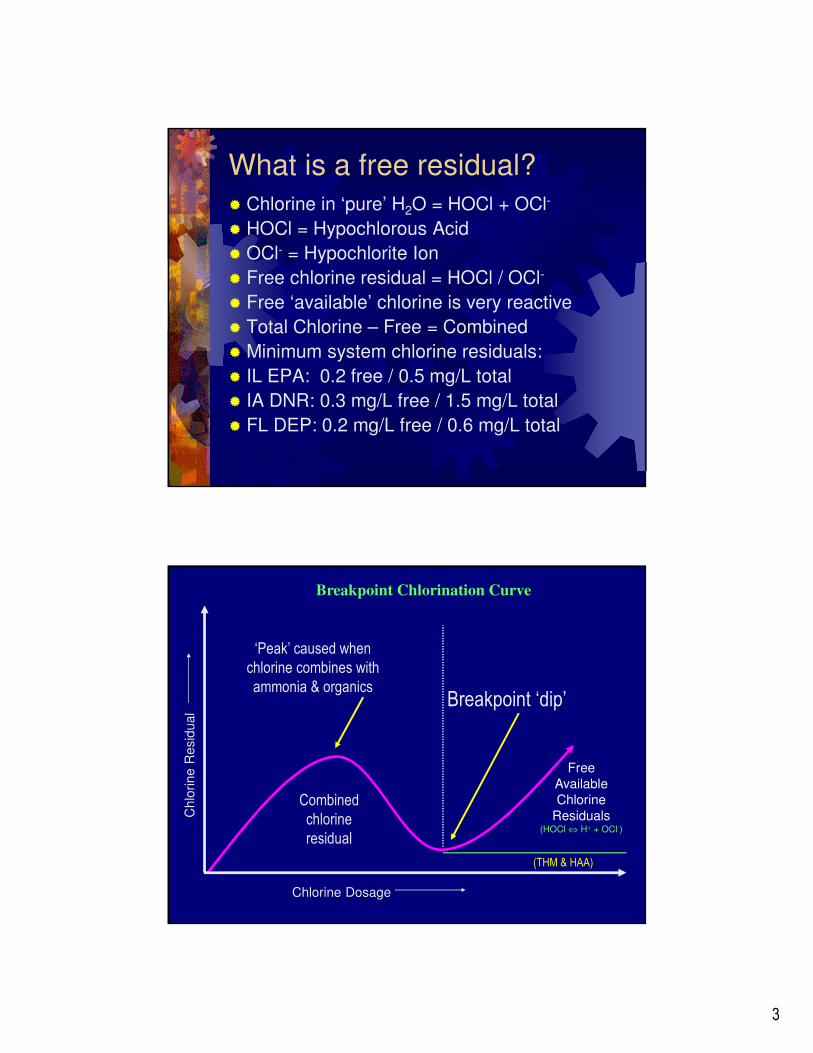
Free
Available
Chlorine
Residuals(HOCl ⇔ H+ + OCl-)
Chlorine Dosage
Chlo
rine R
esid
ual
Breakpoint Chlorination Curve
Breakpoint ‘dip’
‘Peak’ caused when
chlorine combines with
ammonia & organics
Combined
chlorine
residual
(THM & HAA)
4
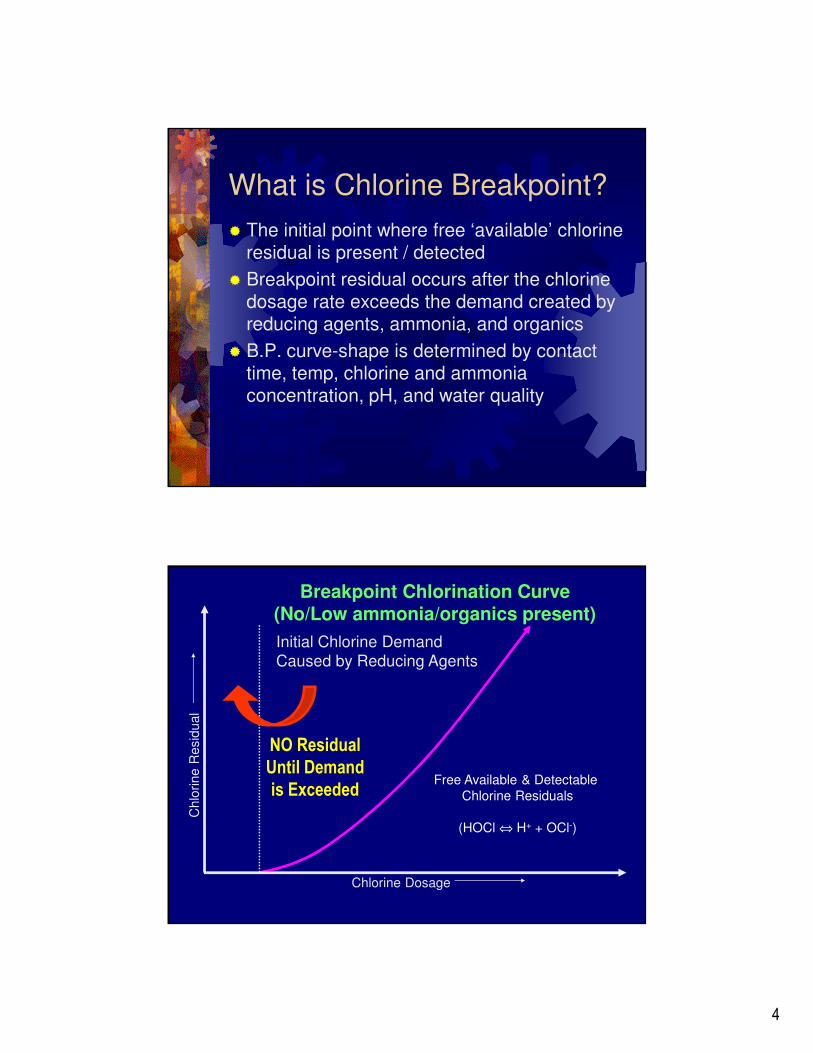
What is Chlorine Breakpoint?
� The initial point where free ‘available’ chlorine residual is present / detected
� Breakpoint residual occurs after the chlorine dosage rate exceeds the demand created by reducing agents, ammonia, and organics
� B.P. curve-shape is determined by contact time, temp, chlorine and ammonia concentration, pH, and water quality
Chlorine Dosage
Chlo
rine R
esid
ual
Breakpoint Chlorination Curve (No/Low ammonia/organics present)
Free Available & Detectable
Chlorine Residuals
(HOCl ⇔ H+ + OCl-)
Initial Chlorine Demand
Caused by Reducing Agents
NO Residual
Until Demand
is Exceeded
5
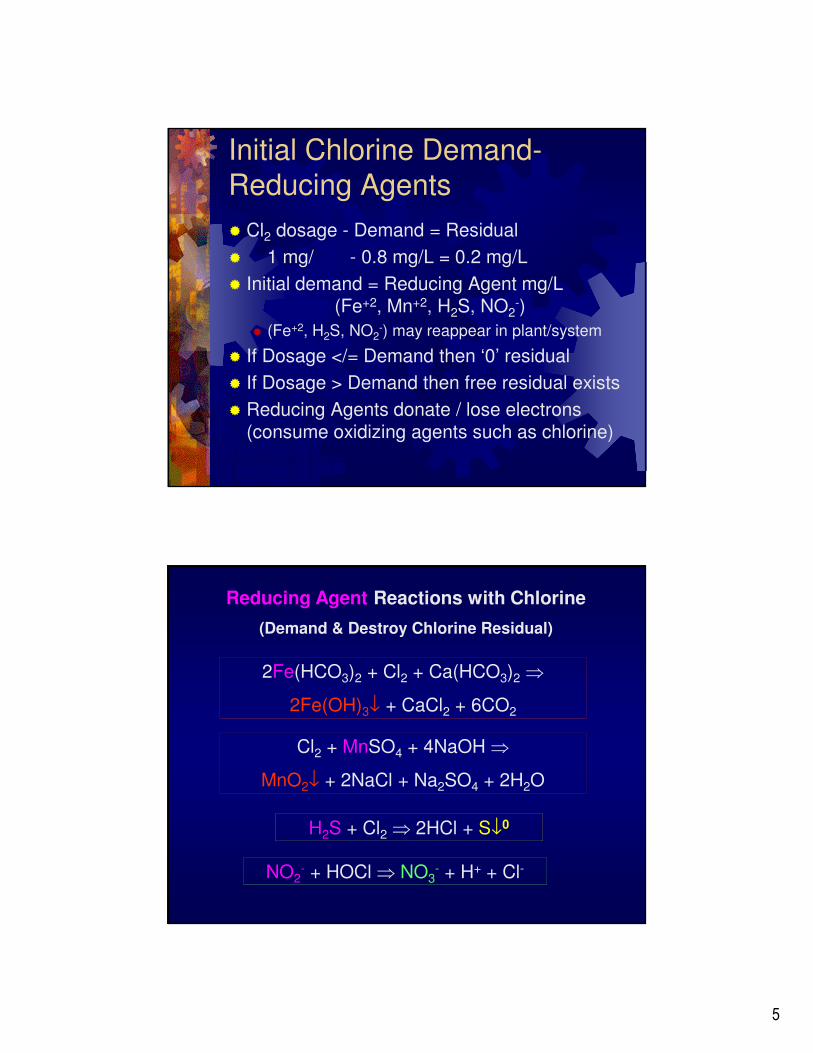
Initial Chlorine Demand-
Reducing Agents
� Cl2 dosage - Demand = Residual
� 1 mg/ - 0.8 mg/L = 0.2 mg/L
� Initial demand = Reducing Agent mg/L (Fe+2, Mn+2, H2S, NO2
-)
� (Fe+2, H2S, NO2-) may reappear in plant/system
� If Dosage </= Demand then ‘0’ residual
� If Dosage > Demand then free residual exists
� Reducing Agents donate / lose electrons (consume oxidizing agents such as chlorine)
Reducing Agent Reactions with Chlorine
(Demand & Destroy Chlorine Residual)
NO2- + HOCl ⇒ NO3
- + H+ + Cl-
H2S + Cl2 ⇒ 2HCl + S↓0
Cl2 + MnSO4 + 4NaOH ⇒
MnO2↓ + 2NaCl + Na2SO4 + 2H2O
2Fe(HCO3)2 + Cl2 + Ca(HCO3)2 ⇒
2Fe(OH)3↓ + CaCl2 + 6CO2
6
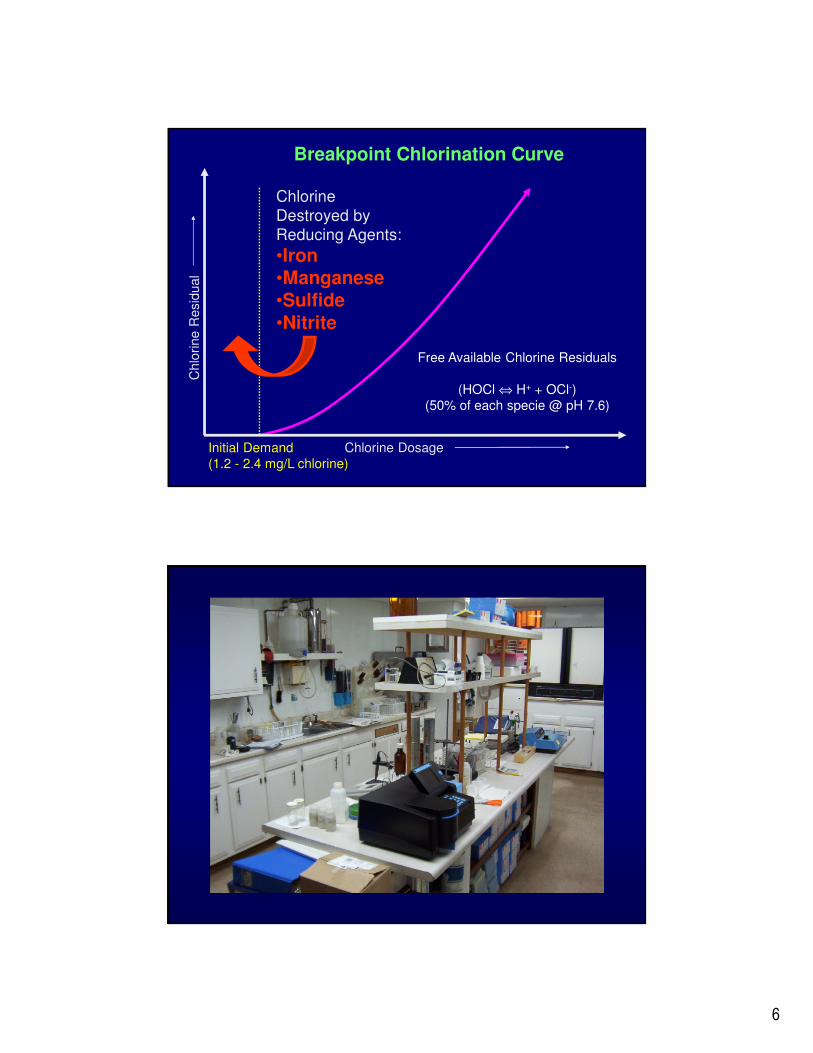
Initial Demand Chlorine Dosage
(1.2 - 2.4 mg/L chlorine)
Chlo
rine R
esid
ual
Breakpoint Chlorination Curve
Free Available Chlorine Residuals
(HOCl ⇔ H+ + OCl-)
(50% of each specie @ pH 7.6)
Chlorine
Destroyed by
Reducing Agents:
•Iron•Manganese•Sulfide
•Nitrite
7
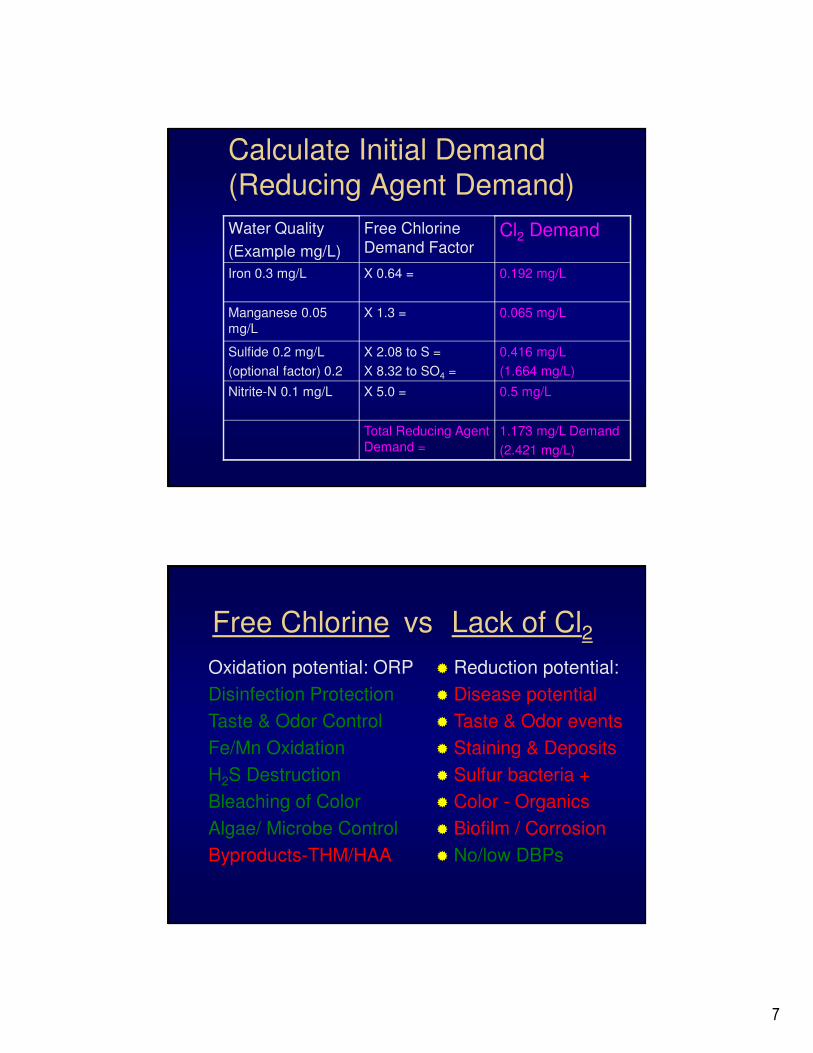
Calculate Initial Demand
(Reducing Agent Demand)
1.173 mg/L Demand
(2.421 mg/L)
Total Reducing Agent
Demand =
0.5 mg/LX 5.0 =Nitrite-N 0.1 mg/L
0.416 mg/L
(1.664 mg/L)
X 2.08 to S =
X 8.32 to SO4 =
Sulfide 0.2 mg/L
(optional factor) 0.2
0.065 mg/LX 1.3 =Manganese 0.05
mg/L
0.192 mg/LX 0.64 =Iron 0.3 mg/L
Cl2 DemandFree Chlorine
Demand Factor
Water Quality
(Example mg/L)
Free Chlorine vs Lack of Cl2Oxidation potential: ORP
Disinfection Protection
Taste & Odor Control
Fe/Mn Oxidation
H2S Destruction
Bleaching of Color
Algae/ Microbe Control
Byproducts-THM/HAA
� Reduction potential:
� Disease potential
� Taste & Odor events
� Staining & Deposits
� Sulfur bacteria +
� Color - Organics
� Biofilm / Corrosion
� No/low DBPs
8
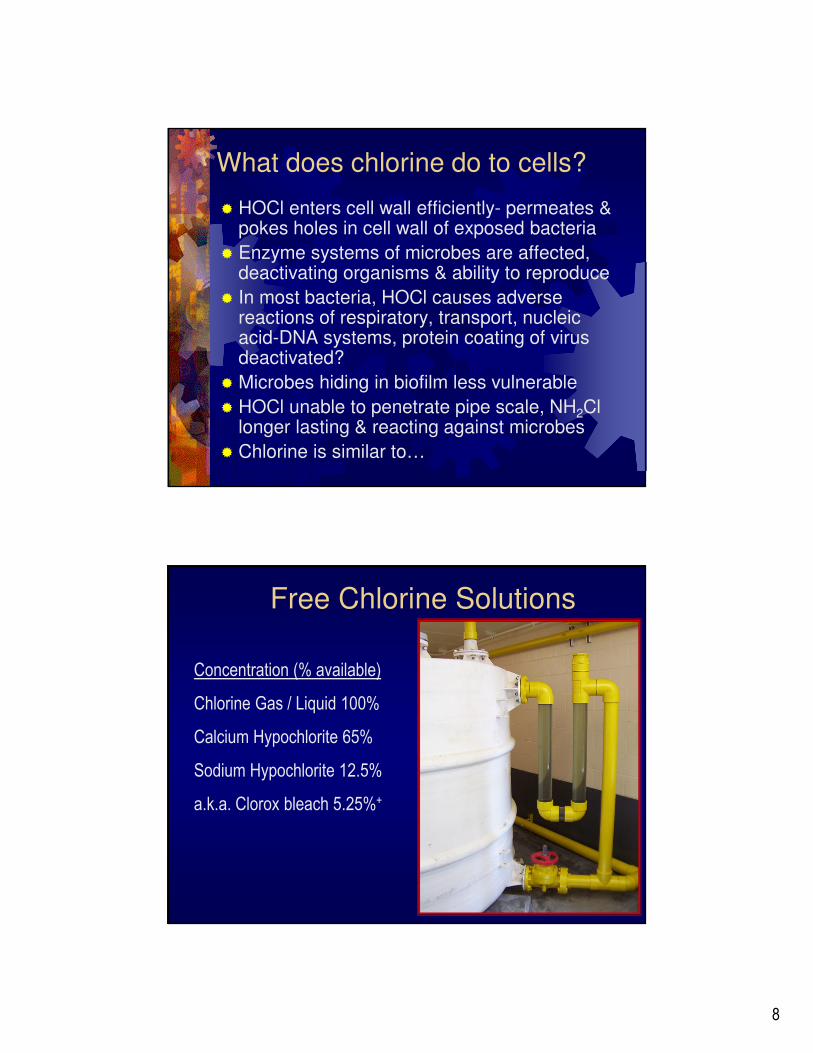
What does chlorine do to cells?
� HOCl enters cell wall efficiently- permeates & pokes holes in cell wall of exposed bacteria
� Enzyme systems of microbes are affected, deactivating organisms & ability to reproduce
� In most bacteria, HOCl causes adverse reactions of respiratory, transport, nucleic acid-DNA systems, protein coating of virus deactivated?
� Microbes hiding in biofilm less vulnerable
� HOCl unable to penetrate pipe scale, NH2Cl longer lasting & reacting against microbes
� Chlorine is similar to…
Free Chlorine Solutions
Concentration (% available)
Chlorine Gas / Liquid 100%
Calcium Hypochlorite 65%
Sodium Hypochlorite 12.5%
a.k.a. Clorox bleach 5.25%+
9
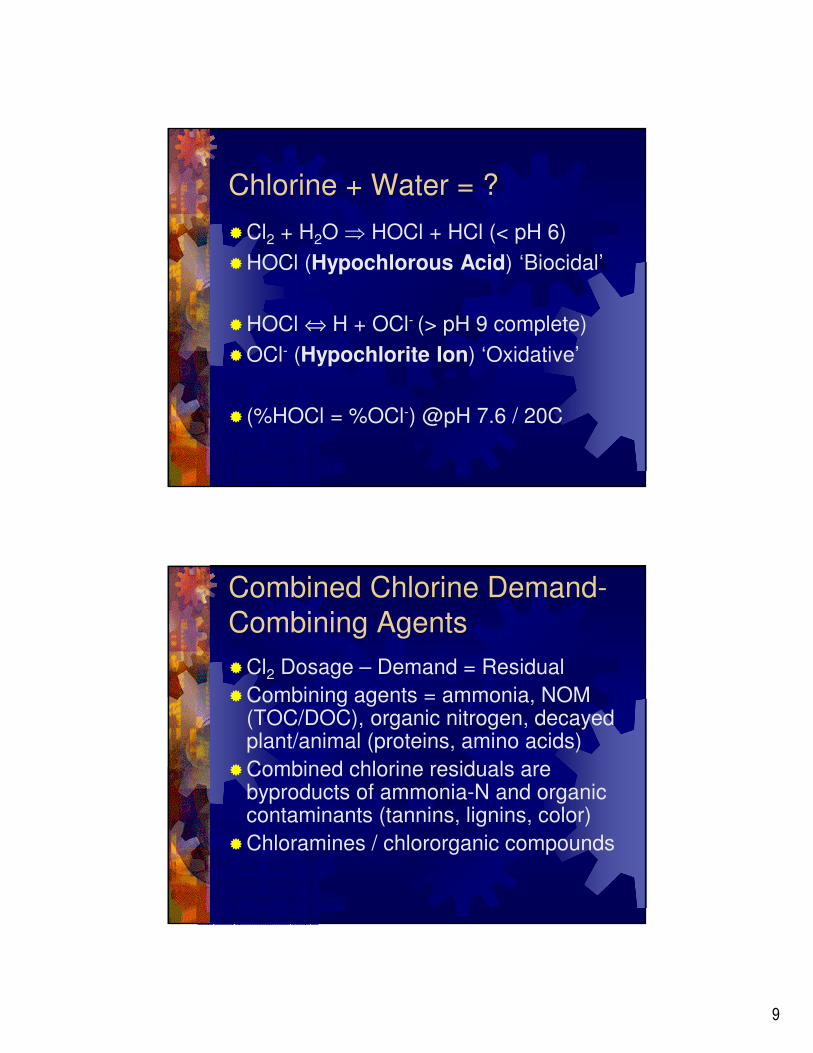
Chlorine + Water = ?
�Cl2 + H2O ⇒ HOCl + HCl (< pH 6)
�HOCl (Hypochlorous Acid) ‘Biocidal’
�HOCl ⇔ H + OCl- (> pH 9 complete)
�OCl- (Hypochlorite Ion) ‘Oxidative’
� (%HOCl = %OCl-) @pH 7.6 / 20C
Combined Chlorine Demand-
Combining Agents
�Cl2 Dosage – Demand = Residual
�Combining agents = ammonia, NOM (TOC/DOC), organic nitrogen, decayed plant/animal (proteins, amino acids)
�Combined chlorine residuals are byproducts of ammonia-N and organic contaminants (tannins, lignins, color)
�Chloramines / chlororganic compounds
10
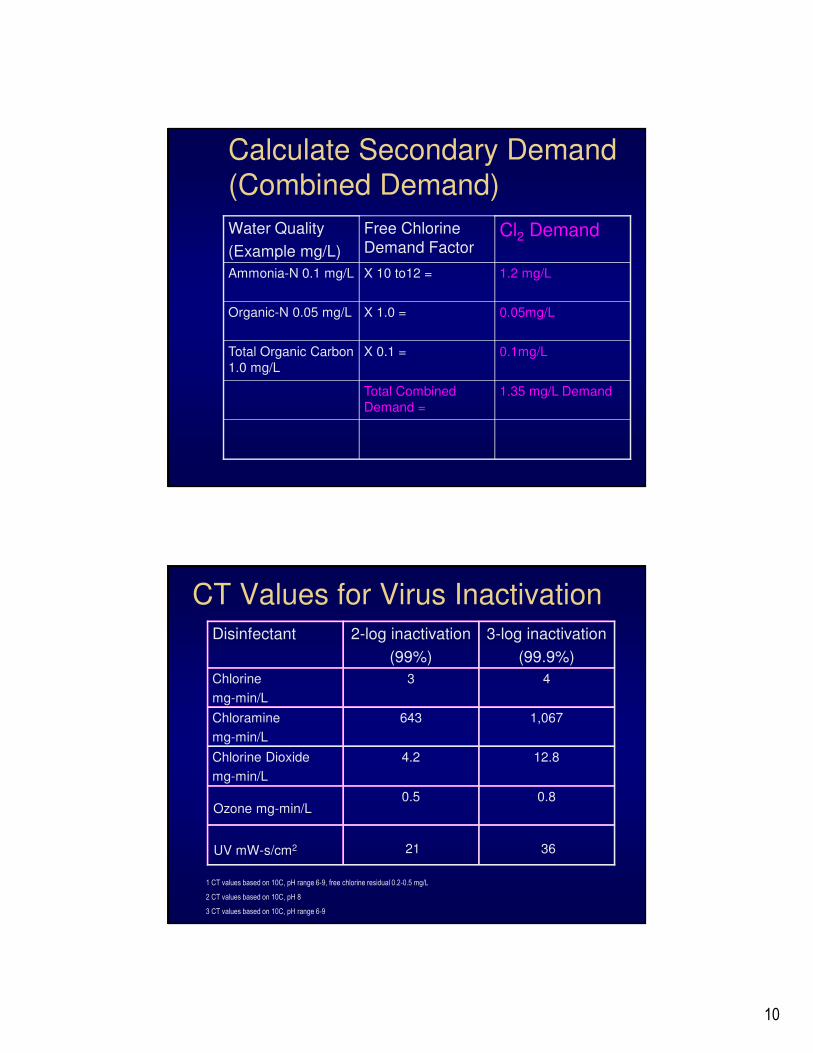
Calculate Secondary Demand
(Combined Demand)
1.35 mg/L DemandTotal Combined
Demand =
0.1mg/LX 0.1 =Total Organic Carbon
1.0 mg/L
0.05mg/LX 1.0 =Organic-N 0.05 mg/L
1.2 mg/LX 10 to12 =Ammonia-N 0.1 mg/L
Cl2 DemandFree Chlorine
Demand Factor
Water Quality
(Example mg/L)
CT Values for Virus Inactivation
0.80.5
12.84.2Chlorine Dioxide
mg-min/L
1,067643Chloramine
mg-min/L
43Chlorine
mg-min/L
3-log inactivation
(99.9%)
2-log inactivation
(99%)
Disinfectant
UV mW-s/cm2
Ozone mg-min/L
21 36
1 CT values based on 10C, pH range 6-9, free chlorine residual 0.2-0.5 mg/L
2 CT values based on 10C, pH 8
3 CT values based on 10C, pH range 6-9
11
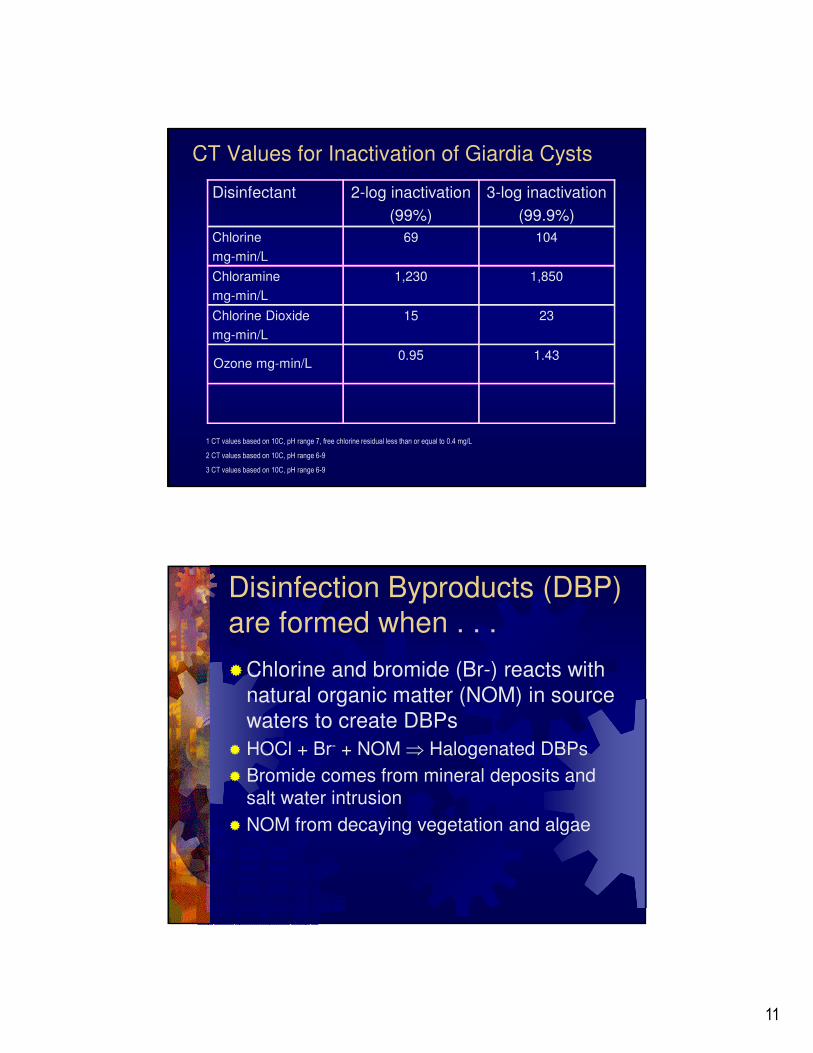
CT Values for Inactivation of Giardia Cysts
1.430.95
2315Chlorine Dioxide
mg-min/L
1,8501,230Chloramine
mg-min/L
10469Chlorine
mg-min/L
3-log inactivation
(99.9%)
2-log inactivation
(99%)
Disinfectant
Ozone mg-min/L
1 CT values based on 10C, pH range 7, free chlorine residual less than or equal to 0.4 mg/L
2 CT values based on 10C, pH range 6-9
3 CT values based on 10C, pH range 6-9
Disinfection Byproducts (DBP)
are formed when . . .
�Chlorine and bromide (Br-) reacts with
natural organic matter (NOM) in source
waters to create DBPs
� HOCl + Br- + NOM ⇒ Halogenated DBPs
� Bromide comes from mineral deposits and salt water intrusion
� NOM from decaying vegetation and algae
12
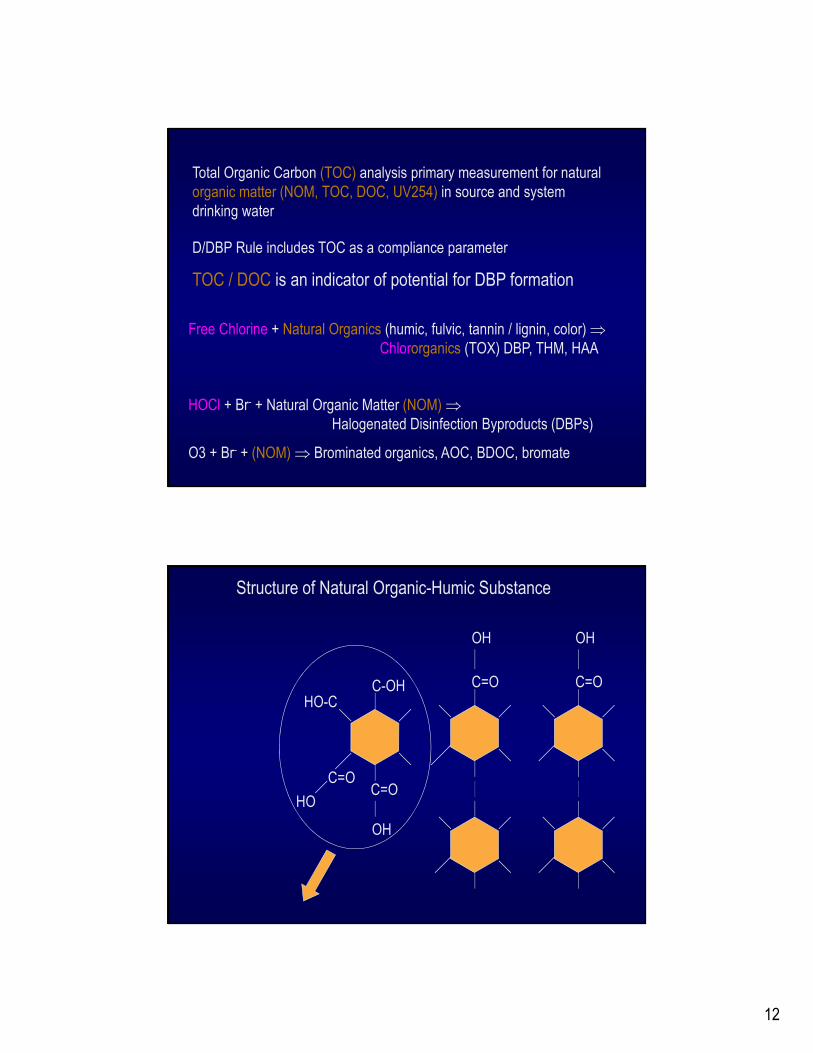
Free Chlorine + Natural Organics (humic, fulvic, tannin / lignin, color) ⇒
Chlororganics (TOX) DBP, THM, HAA
HOCl + Br- + Natural Organic Matter (NOM)⇒
Halogenated Disinfection Byproducts (DBPs)
O3 + Br- + (NOM)⇒ Brominated organics, AOC, BDOC, bromate
Total Organic Carbon (TOC) analysis primary measurement for natural
organic matter (NOM, TOC, DOC, UV254) in source and system
drinking water
D/DBP Rule includes TOC as a compliance parameter
TOC / DOC is an indicator of potential for DBP formation
Structure of Natural Organic-Humic Substance
C=O C=O
C=OC=O
OH
HO
C-OH
OH OH
HO-C
13
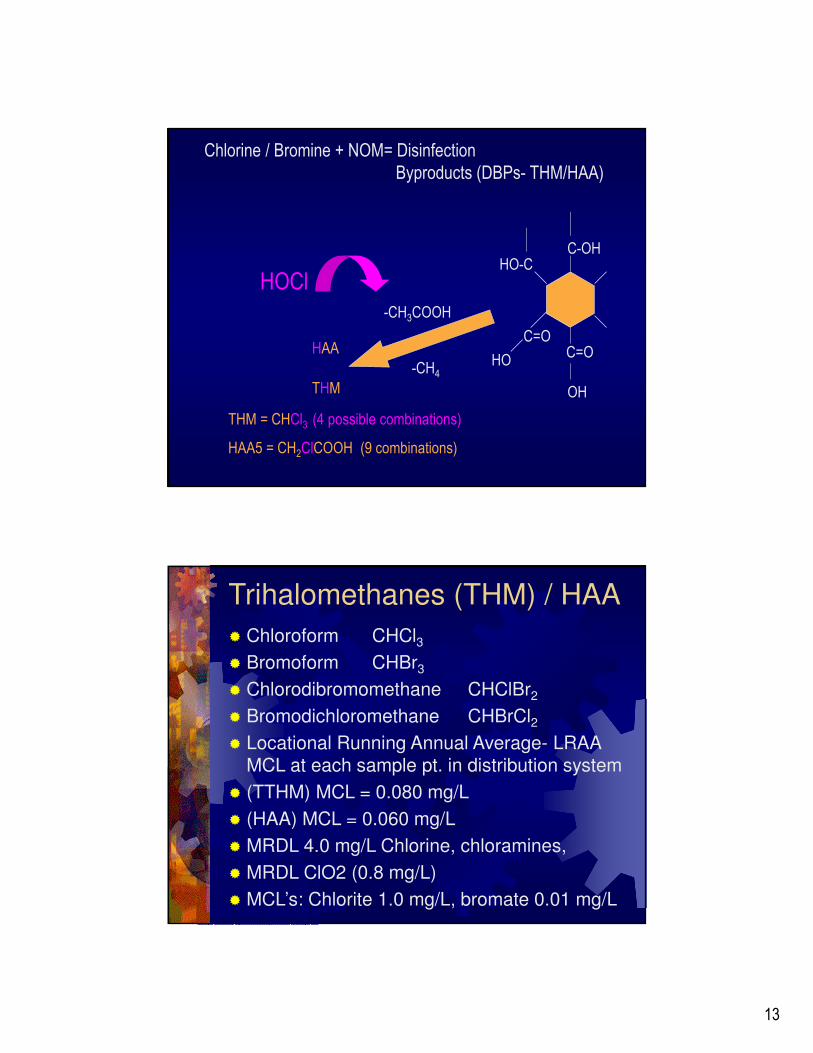
Chlorine / Bromine + NOM= Disinfection
Byproducts (DBPs- THM/HAA)
C=OC=O
OH
HO
C-OHHO-C
THM
HAA
HOCl
-CH4
-CH3COOH
THM = CHCl3 (4 possible combinations)
HAA5 = CH2ClCOOH (9 combinations)
Trihalomethanes (THM) / HAA
� Chloroform CHCl3� Bromoform CHBr3
� Chlorodibromomethane CHClBr2
� Bromodichloromethane CHBrCl2� Locational Running Annual Average- LRAA
MCL at each sample pt. in distribution system
� (TTHM) MCL = 0.080 mg/L
� (HAA) MCL = 0.060 mg/L
� MRDL 4.0 mg/L Chlorine, chloramines,
� MRDL ClO2 (0.8 mg/L)
� MCL’s: Chlorite 1.0 mg/L, bromate 0.01 mg/L
14
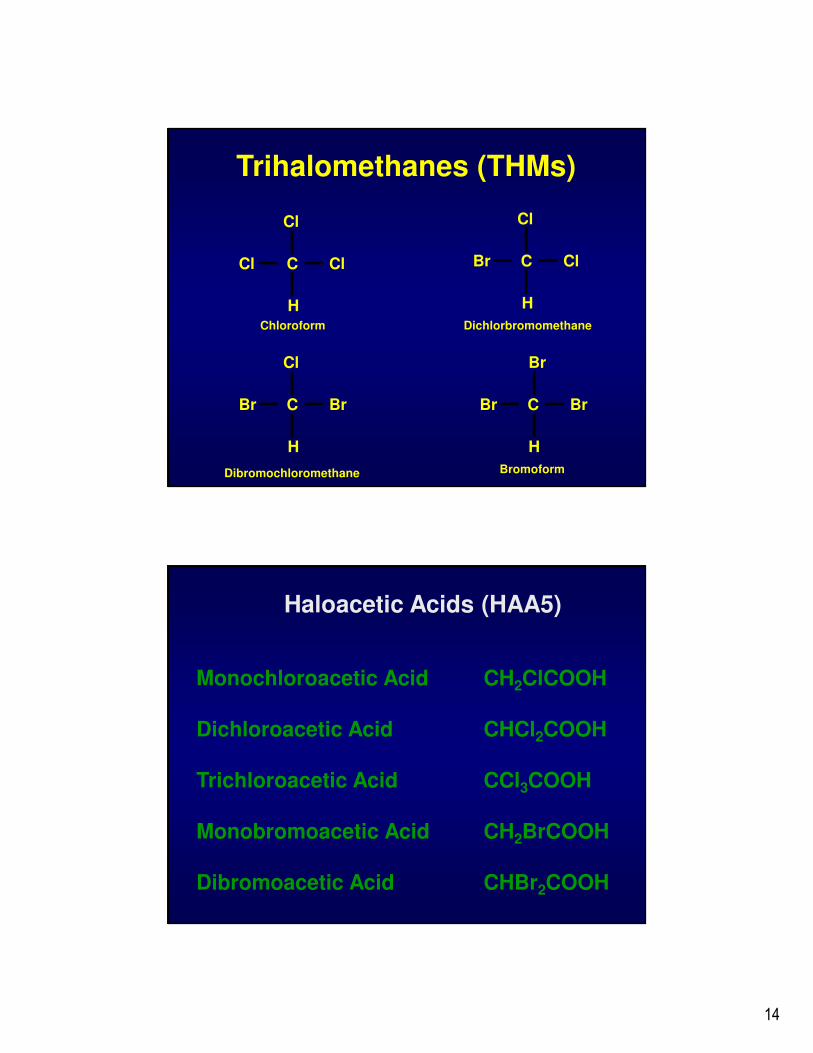
Trihalomethanes (THMs)
Cl
Br C Br
H
Cl
Br C Cl
H
Br
Br C Br
H
Cl
Cl C Cl
HChloroform
BromoformDibromochloromethane
Dichlorbromomethane
Haloacetic Acids (HAA5)
Monochloroacetic Acid CH2ClCOOH
Dichloroacetic Acid CHCl2COOH
Trichloroacetic Acid CCl3COOH
Monobromoacetic Acid CH2BrCOOH
Dibromoacetic Acid CHBr2COOH
15
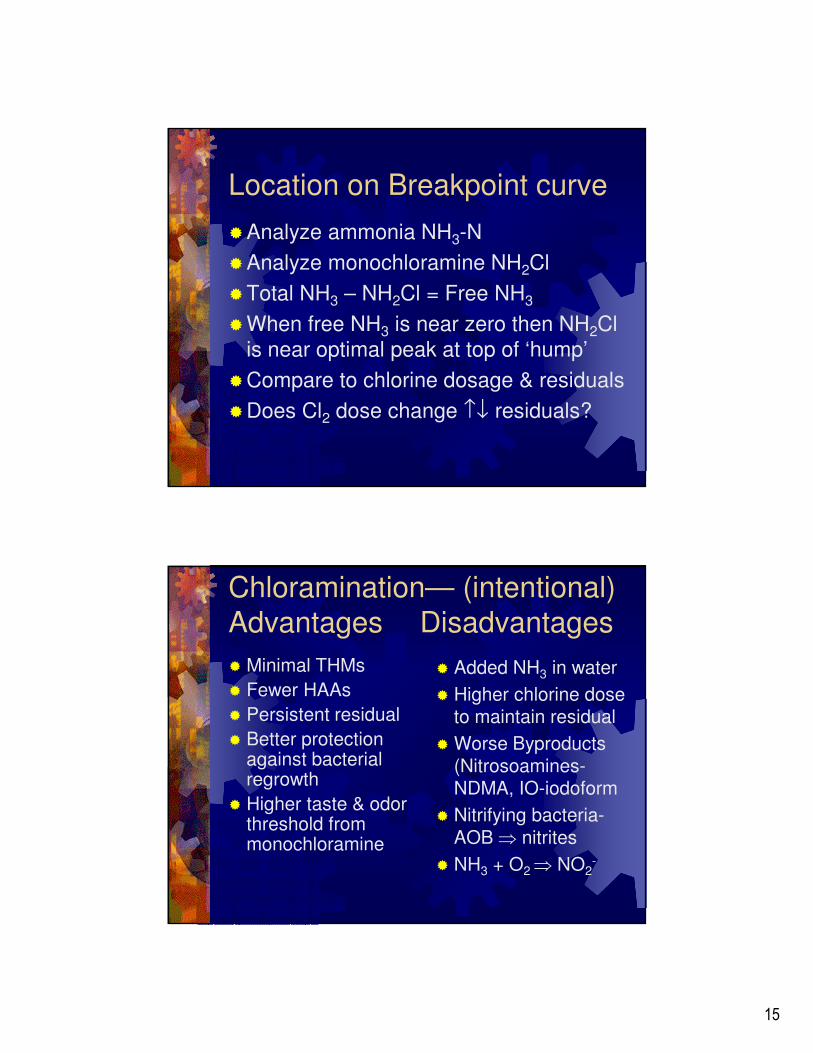
Location on Breakpoint curve
�Analyze ammonia NH3-N
�Analyze monochloramine NH2Cl
�Total NH3 – NH2Cl = Free NH3
�When free NH3 is near zero then NH2Cl
is near optimal peak at top of ‘hump’
�Compare to chlorine dosage & residuals
�Does Cl2 dose change ↑↓ residuals?
Chloramination— (intentional)
Advantages Disadvantages
� Minimal THMs
� Fewer HAAs
� Persistent residual
� Better protection against bacterial regrowth
� Higher taste & odor threshold from monochloramine
� Added NH3 in water
� Higher chlorine dose to maintain residual
� Worse Byproducts (Nitrosoamines-NDMA, IO-iodoform
� Nitrifying bacteria-
AOB ⇒ nitrites
� NH3 + O2 ⇒ NO2-
16
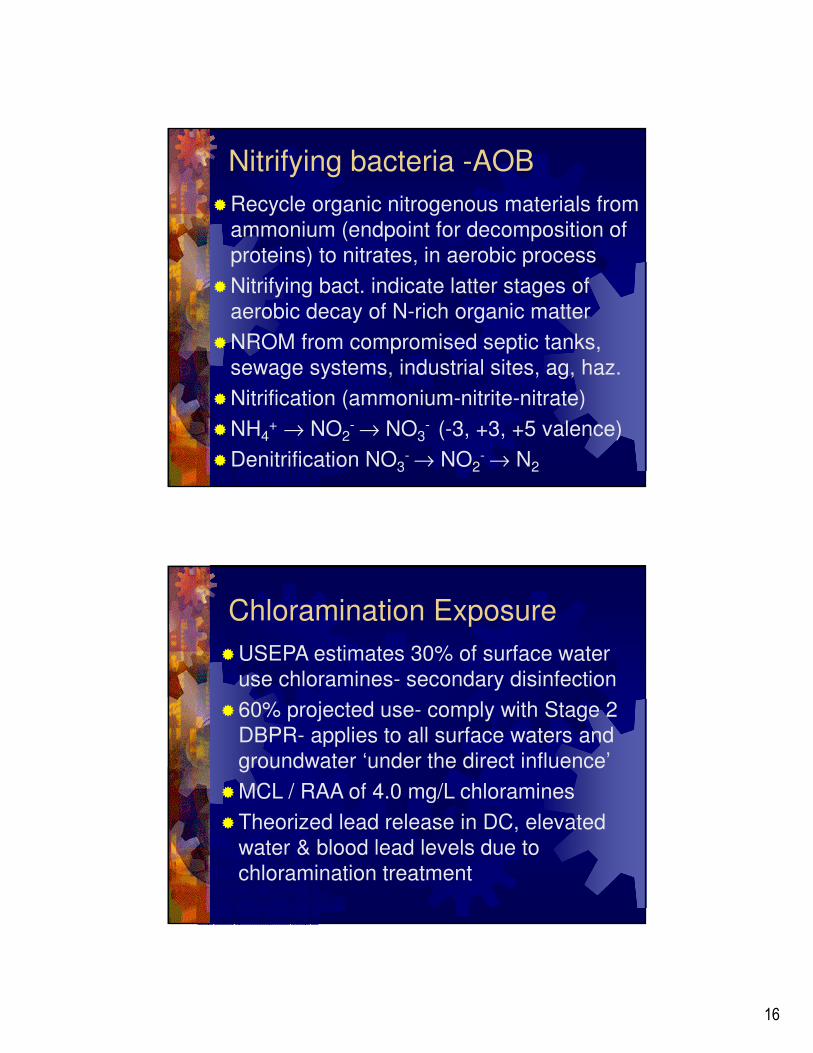
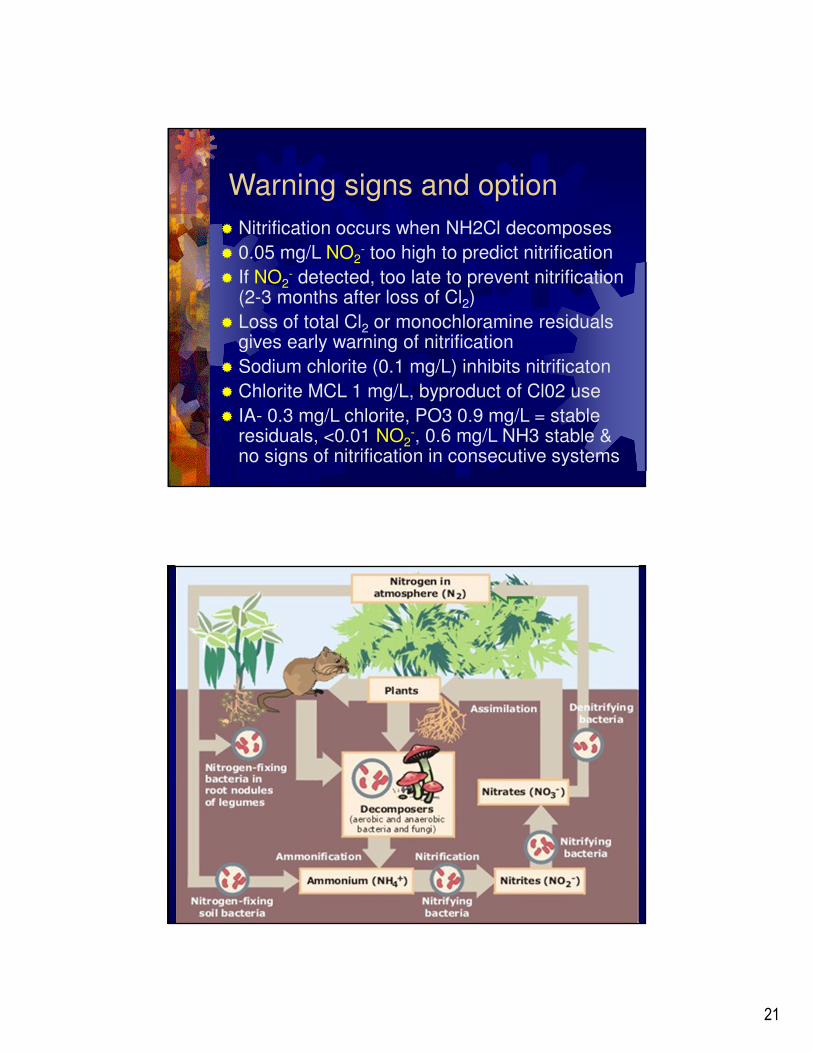
Nitrifying bacteria -AOB
�Recycle organic nitrogenous materials from
ammonium (endpoint for decomposition of
proteins) to nitrates, in aerobic process
�Nitrifying bact. indicate latter stages of
aerobic decay of N-rich organic matter
�NROM from compromised septic tanks,
sewage systems, industrial sites, ag, haz.
�Nitrification (ammonium-nitrite-nitrate)
�NH4+ → NO2
- → NO3- (-3, +3, +5 valence)
�Denitrification NO3- → NO2
- → N2
Chloramination Exposure
�USEPA estimates 30% of surface water
use chloramines- secondary disinfection
�60% projected use- comply with Stage 2
DBPR- applies to all surface waters and
groundwater ‘under the direct influence’
�MCL / RAA of 4.0 mg/L chloramines
�Theorized lead release in DC, elevated
water & blood lead levels due to
chloramination treatment
17
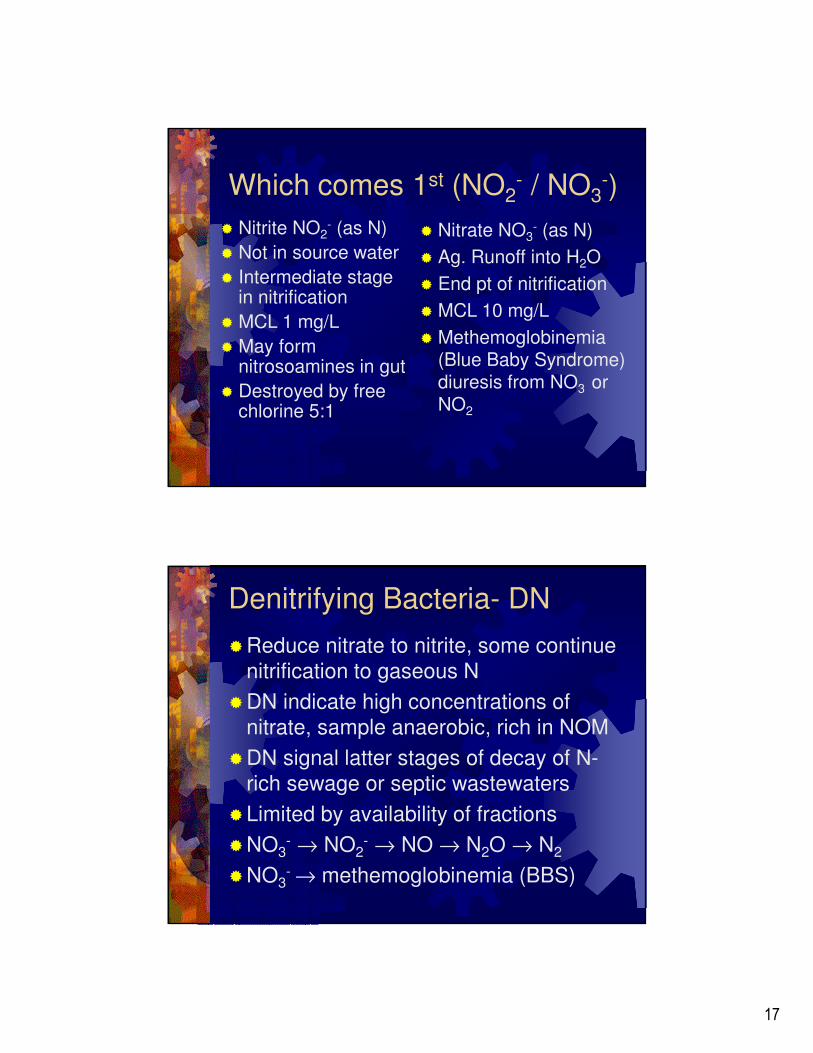
Which comes 1st (NO2- / NO3
-)
� Nitrite NO2- (as N)
� Not in source water
� Intermediate stage in nitrification
� MCL 1 mg/L
� May form nitrosoamines in gut
� Destroyed by free chlorine 5:1
� Nitrate NO3- (as N)
� Ag. Runoff into H2O
� End pt of nitrification
� MCL 10 mg/L
� Methemoglobinemia (Blue Baby Syndrome) diuresis from NO3 or NO2
Denitrifying Bacteria- DN
�Reduce nitrate to nitrite, some continue
nitrification to gaseous N
�DN indicate high concentrations of
nitrate, sample anaerobic, rich in NOM
�DN signal latter stages of decay of N-
rich sewage or septic wastewaters
�Limited by availability of fractions
�NO3- → NO2
- → NO → N2O → N2
�NO3- → methemoglobinemia (BBS)
18
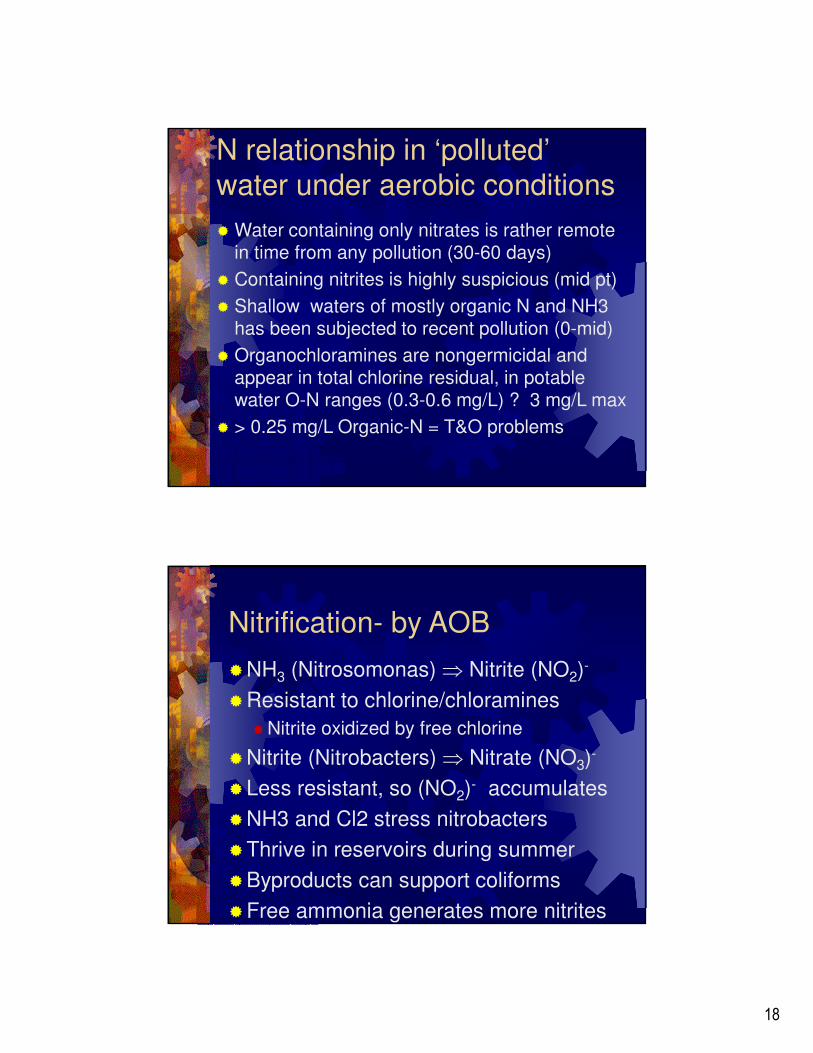
N relationship in ‘polluted’
water under aerobic conditions
� Water containing only nitrates is rather remote in time from any pollution (30-60 days)
� Containing nitrites is highly suspicious (mid pt)
� Shallow waters of mostly organic N and NH3 has been subjected to recent pollution (0-mid)
� Organochloramines are nongermicidal and appear in total chlorine residual, in potable water O-N ranges (0.3-0.6 mg/L) ? 3 mg/L max
� > 0.25 mg/L Organic-N = T&O problems
Nitrification- by AOB
�NH3 (Nitrosomonas) ⇒ Nitrite (NO2)-
�Resistant to chlorine/chloramines
� Nitrite oxidized by free chlorine
�Nitrite (Nitrobacters) ⇒ Nitrate (NO3)-
�Less resistant, so (NO2)- accumulates
�NH3 and Cl2 stress nitrobacters
�Thrive in reservoirs during summer
�Byproducts can support coliforms
�Free ammonia generates more nitrites
19
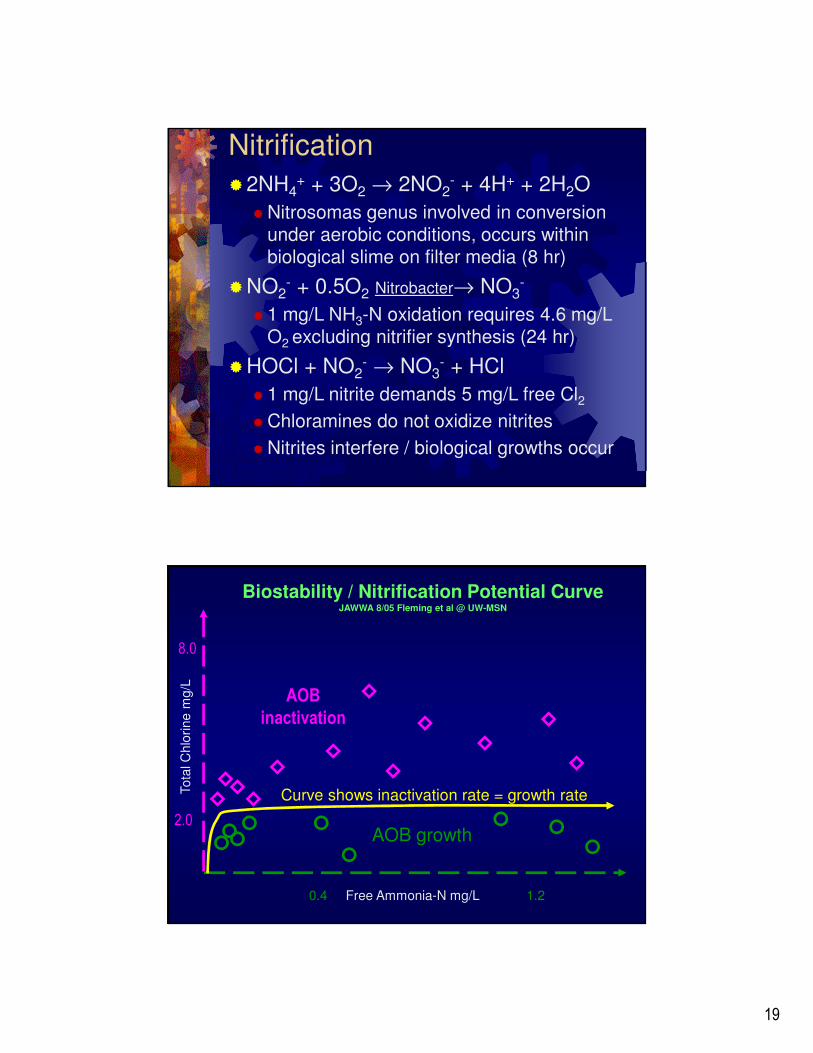
Nitrification
�2NH4+ + 3O2 → 2NO2
- + 4H+ + 2H2O
� Nitrosomas genus involved in conversion under aerobic conditions, occurs within biological slime on filter media (8 hr)
�NO2- + 0.5O2 Nitrobacter→ NO3
-
� 1 mg/L NH3-N oxidation requires 4.6 mg/L O2 excluding nitrifier synthesis (24 hr)
�HOCl + NO2- → NO3
- + HCl
� 1 mg/L nitrite demands 5 mg/L free Cl2� Chloramines do not oxidize nitrites
� Nitrites interfere / biological growths occur
0.4 Free Ammonia-N mg/L 1.2
Tota
l C
hlo
rine m
g/L
Biostability / Nitrification Potential CurveJAWWA 8/05 Fleming et al @ UW-MSN
AOB growth
AOB
inactivation
Curve shows inactivation rate = growth rate
2.0
8.0
20
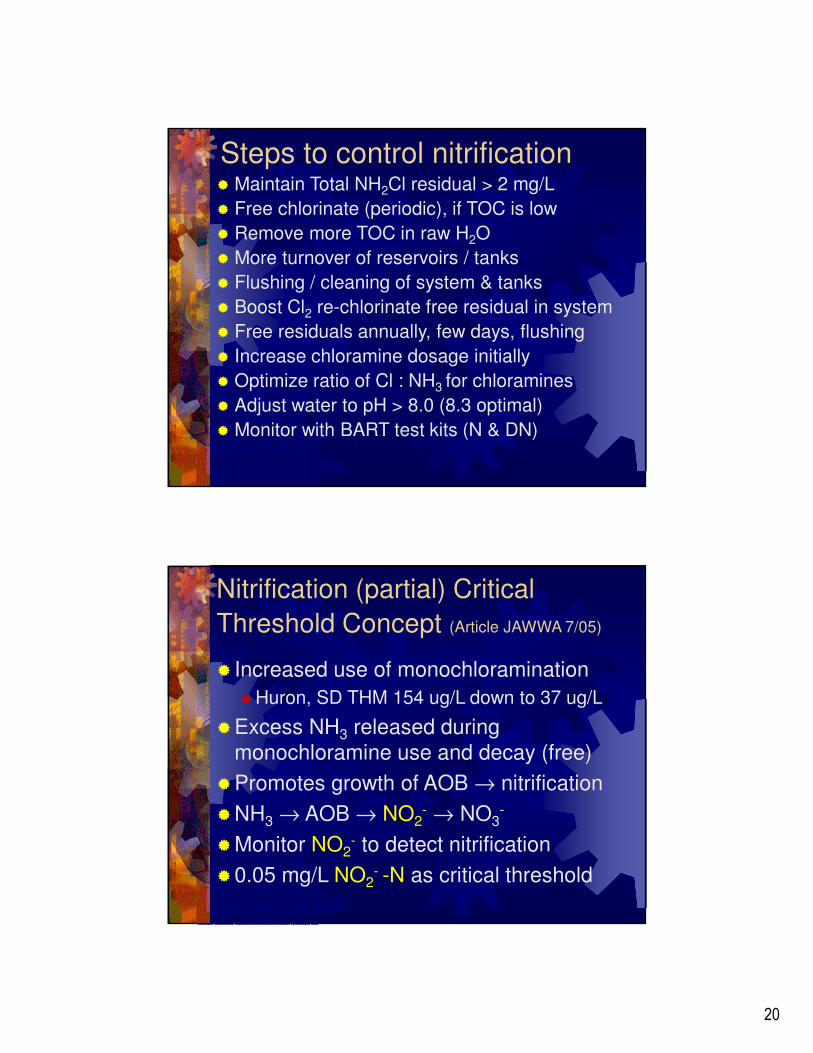
Steps to control nitrification� Maintain Total NH2Cl residual > 2 mg/L
� Free chlorinate (periodic), if TOC is low
� Remove more TOC in raw H2O
� More turnover of reservoirs / tanks
� Flushing / cleaning of system & tanks
� Boost Cl2 re-chlorinate free residual in system
� Free residuals annually, few days, flushing
� Increase chloramine dosage initially
� Optimize ratio of Cl : NH3 for chloramines
� Adjust water to pH > 8.0 (8.3 optimal)
� Monitor with BART test kits (N & DN)
Nitrification (partial) Critical
Threshold Concept (Article JAWWA 7/05)
� Increased use of monochloramination
� Huron, SD THM 154 ug/L down to 37 ug/L
�Excess NH3 released during
monochloramine use and decay (free)
�Promotes growth of AOB → nitrification
�NH3 → AOB → NO2- → NO3
-
�Monitor NO2- to detect nitrification
�0.05 mg/L NO2- -N as critical threshold
21
Warning signs and option
� Nitrification occurs when NH2Cl decomposes
� 0.05 mg/L NO2- too high to predict nitrification
� If NO2- detected, too late to prevent nitrification
(2-3 months after loss of Cl2)
� Loss of total Cl2 or monochloramine residuals gives early warning of nitrification
� Sodium chlorite (0.1 mg/L) inhibits nitrificaton
� Chlorite MCL 1 mg/L, byproduct of Cl02 use
� IA- 0.3 mg/L chlorite, PO3 0.9 mg/L = stable residuals, <0.01 NO2
-, 0.6 mg/L NH3 stable & no signs of nitrification in consecutive systems
22
Nitrogen fertilizer- NH3 / NO3-
� Des Moines river in Ottumwa, IA yields springtime NH3 & summer NO3
-
� Anhydrous NH3 converts to NO3- runs off or
into aquifer if ground (frozen), cool soil hold tends to hold N, too hot evaporates (IA State) 55F soil temp
� NH3 /NH4+ bonds to soil, NO3
- repels charge
� Soil microbes convert N to NO3- (water
soluble used by plants)
� Fall fertilizer application up to 70% N loss
� IA DNR has opinions on fall NH3 applications
Chloramination Controls
�Maintain 3-4 mg/L chloramine at plant
�Keep chlorine / ammonia 4-5:1
�Minimize free ammonia < 0.1 mg/L
�Keep filter media clean, shock Cl2 + PP� Unless media is bioactive NH3 → NO3
�Monitor chlorine / chloramine, ammonia, nitrite, biofilm, water quality
�Keep residuals or boost up in system
23
Demand versus Decay
�Demand = loss of residual after
chloramine reaction with reducing agents
(iron, manganese, sulfide, nitrite)
and NOM in distribution system
�Decay = loss of chloramine residual due
to automatic decomposition as follows:
�3NH2Cl ⇒ N2 + NH3 + 3HCl
� (NH3↑ as pH ↓ (8.3 optimal), T ↑, CO3↑,
DO↓
Polyphosphate treatment
� Sequesters iron Fe+2 (rusty water control)
� Reduces apparent color/turbidity of Fe+3 particles
� Suspends manganese Mn+2 (black/brown water)
� May sequester/chelate metal from pipes
� Overdose disrupts pipe surface & byproducts
� Prevents scale formation
� ‘Thresholding’ calcium Ca+2 carbonate formation
� Removes existing scale and corrosion deposits
reducing chlorine demand & regrowth potential
� Reduced THM’s (HOCl demand & pH operation)
� Less chlorine available for THM formation and
less byproducts NOM in distribution system
24
Effects of Polyphosphate
� Study examined disinfection ability of free chlorine and monochloramine for controlling biofilm and effect on corrosion control
� Application of corrosion inhibitors improved chlorine disinfection, allowing for penetration of pipe scale and biofilm removal
� Polyphosphate application resulted in 1,000
fold decrease of biofilm counts (∴ reduces DBP precursors and formation potential)
� Chlorine alone reacts with surface of scale
LeChevallier, Mark W.;Lowry, Cheryl D.;Lee, Ramon G., Disinfecting Biofilms in a Model Distribution
System, JAWWA Vol. 82 - No. 7, 1990
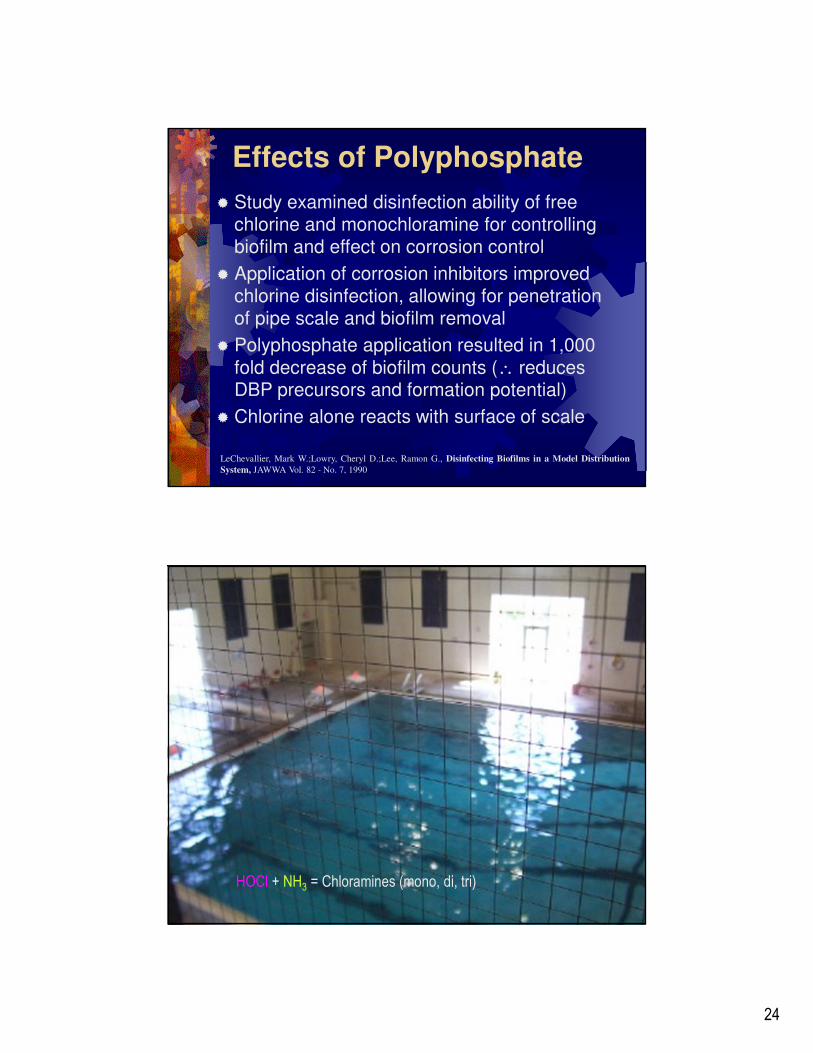
HOCl + NH3 = Chloramines (mono, di, tri)
25
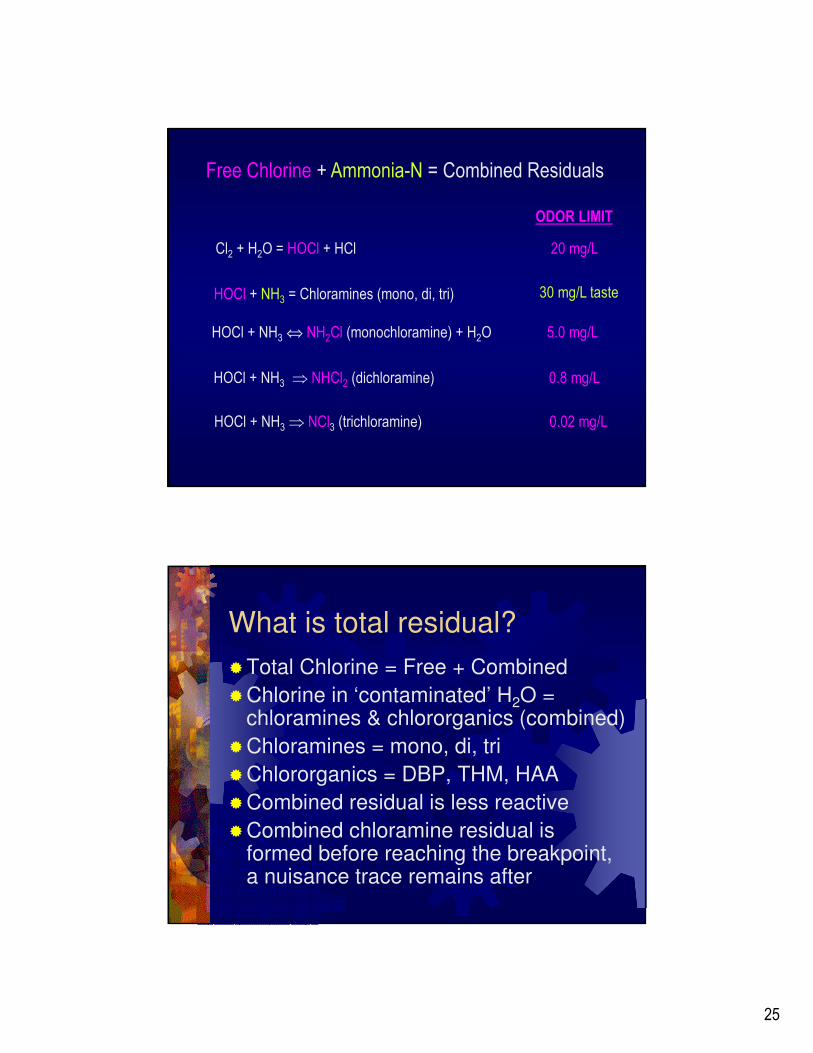
Free Chlorine + Ammonia-N = Combined Residuals
HOCl + NH3 = Chloramines (mono, di, tri)
Cl2 + H2O = HOCl + HCl 20 mg/L
HOCl + NH3 ⇔ NH2Cl (monochloramine) + H2O 5.0 mg/L
HOCl + NH3 ⇒ NHCl2 (dichloramine) 0.8 mg/L
HOCl + NH3⇒ NCl3 (trichloramine) 0.02 mg/L
30 mg/L taste
ODOR LIMIT
What is total residual?
�Total Chlorine = Free + Combined
�Chlorine in ‘contaminated’ H2O = chloramines & chlororganics (combined)
�Chloramines = mono, di, tri
�Chlororganics = DBP, THM, HAA
�Combined residual is less reactive
�Combined chloramine residual is formed before reaching the breakpoint, a nuisance trace remains after
26
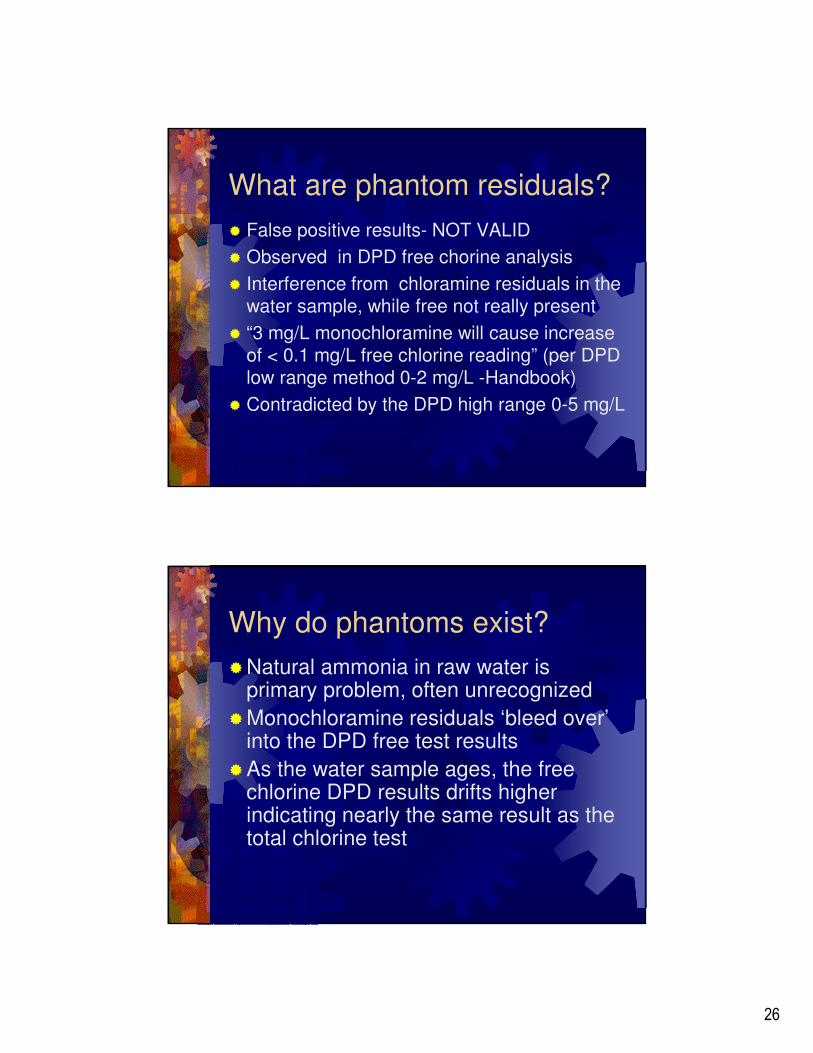
What are phantom residuals?
� False positive results- NOT VALID
� Observed in DPD free chorine analysis
� Interference from chloramine residuals in the water sample, while free not really present
� “3 mg/L monochloramine will cause increase of < 0.1 mg/L free chlorine reading” (per DPD low range method 0-2 mg/L -Handbook)
� Contradicted by the DPD high range 0-5 mg/L
Why do phantoms exist?
�Natural ammonia in raw water is primary problem, often unrecognized
�Monochloramine residuals ‘bleed over’ into the DPD free test results
�As the water sample ages, the free chlorine DPD results drifts higher indicating nearly the same result as the total chlorine test
27
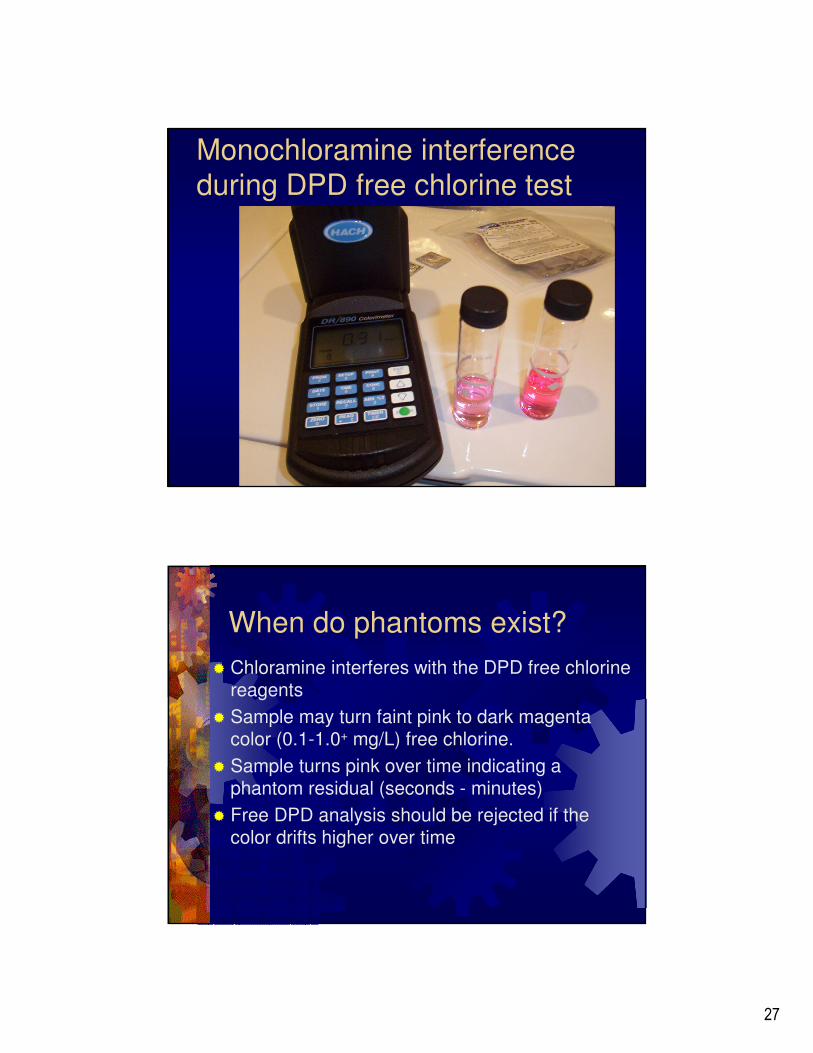
Monochloramine interference
during DPD free chlorine test
When do phantoms exist?
� Chloramine interferes with the DPD free chlorine reagents
� Sample may turn faint pink to dark magenta color (0.1-1.0+ mg/L) free chlorine.
� Sample turns pink over time indicating a phantom residual (seconds - minutes)
� Free DPD analysis should be rejected if the color drifts higher over time
28
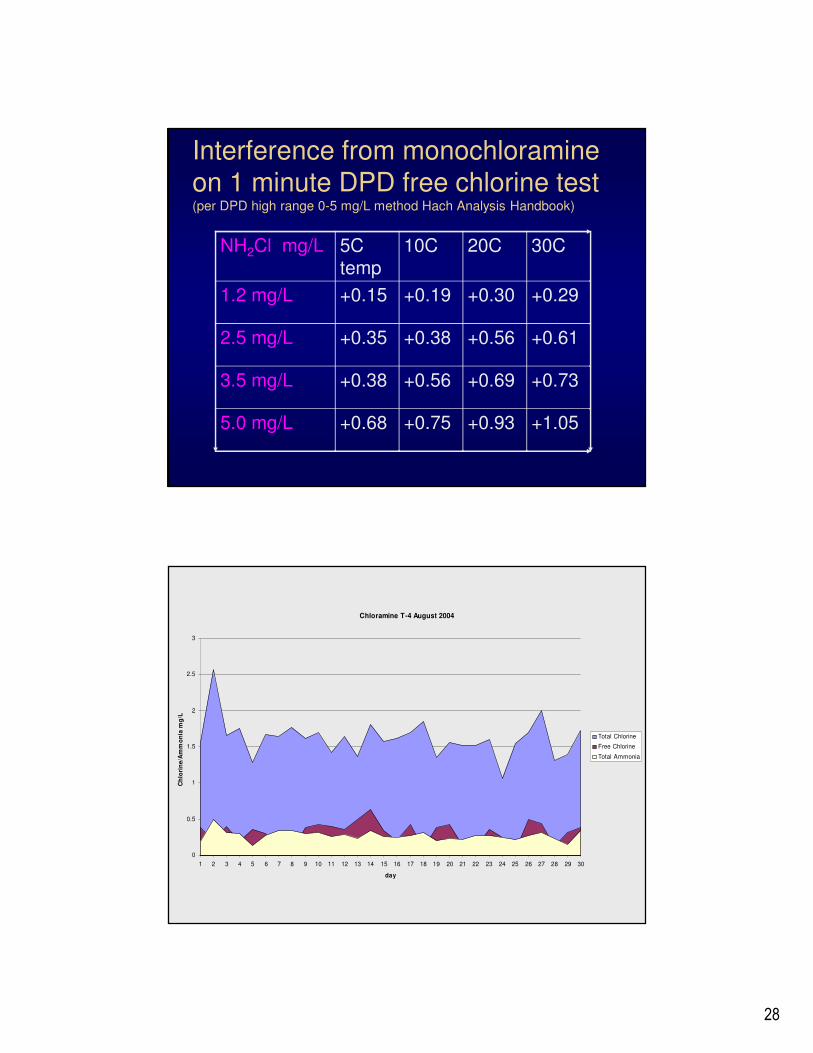
Interference from monochloramine on 1 minute DPD free chlorine test(per DPD high range 0-5 mg/L method Hach Analysis Handbook)
NH2Cl mg/L 5C temp
10C 20C 30C
1.2 mg/L +0.15 +0.19 +0.30 +0.29
2.5 mg/L +0.35 +0.38 +0.56 +0.61
3.5 mg/L +0.38 +0.56 +0.69 +0.73
5.0 mg/L +0.68 +0.75 +0.93 +1.05
Chloramine T-4 August 2004
0
0.5
1
1.5
2
2.5
3
1 2 3 4 5 6 7 8 9 10 11 12 13 14 15 16 17 18 19 20 21 22 23 24 25 26 27 28 29 30
day
Ch
lori
ne
/Am
mo
nia
mg
/L
Total Chlorine
Free Chlorine
Total Ammonia
29
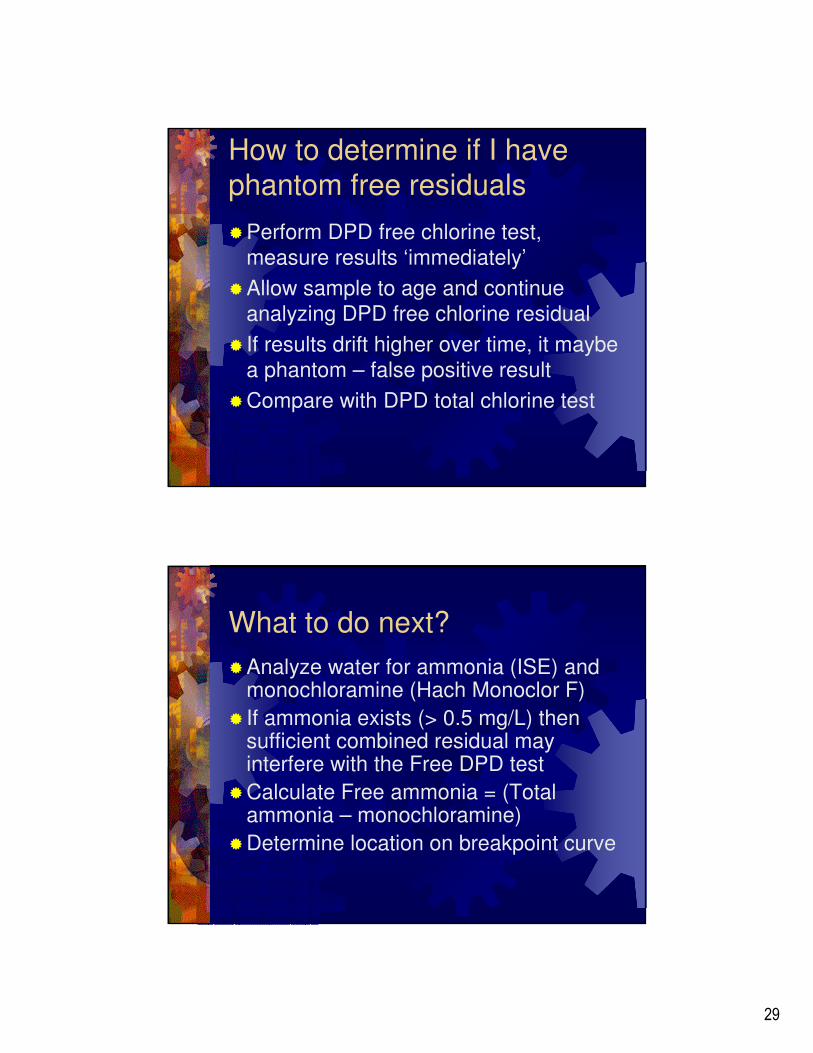
How to determine if I have
phantom free residuals
�Perform DPD free chlorine test,
measure results ‘immediately’
�Allow sample to age and continue
analyzing DPD free chlorine residual
� If results drift higher over time, it maybe
a phantom – false positive result
�Compare with DPD total chlorine test
What to do next?
�Analyze water for ammonia (ISE) and monochloramine (Hach Monoclor F)
� If ammonia exists (> 0.5 mg/L) then sufficient combined residual may interfere with the Free DPD test
�Calculate Free ammonia = (Total ammonia – monochloramine)
�Determine location on breakpoint curve
30
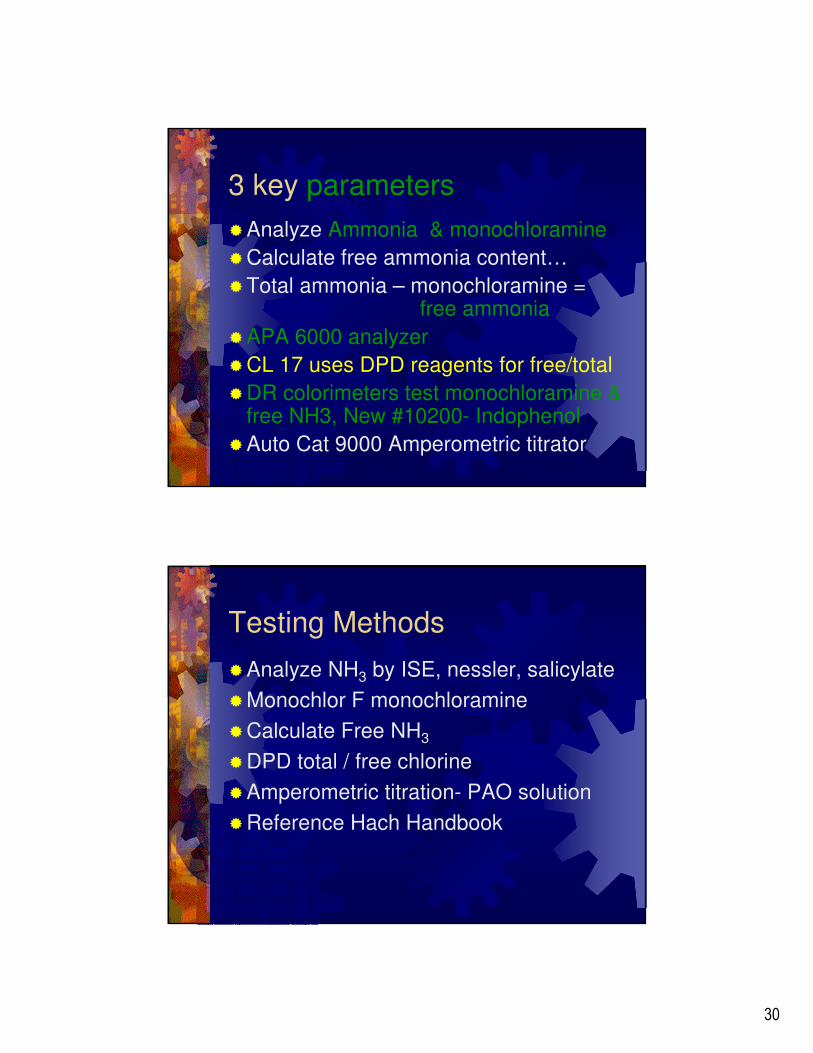
3 key parameters
�Analyze Ammonia & monochloramine
�Calculate free ammonia content…
�Total ammonia – monochloramine = free ammonia
�APA 6000 analyzer
�CL 17 uses DPD reagents for free/total
�DR colorimeters test monochloramine & free NH3, New #10200- Indophenol
�Auto Cat 9000 Amperometric titrator
Testing Methods
�Analyze NH3 by ISE, nessler, salicylate
�Monochlor F monochloramine
�Calculate Free NH3
�DPD total / free chlorine
�Amperometric titration- PAO solution
�Reference Hach Handbook
31
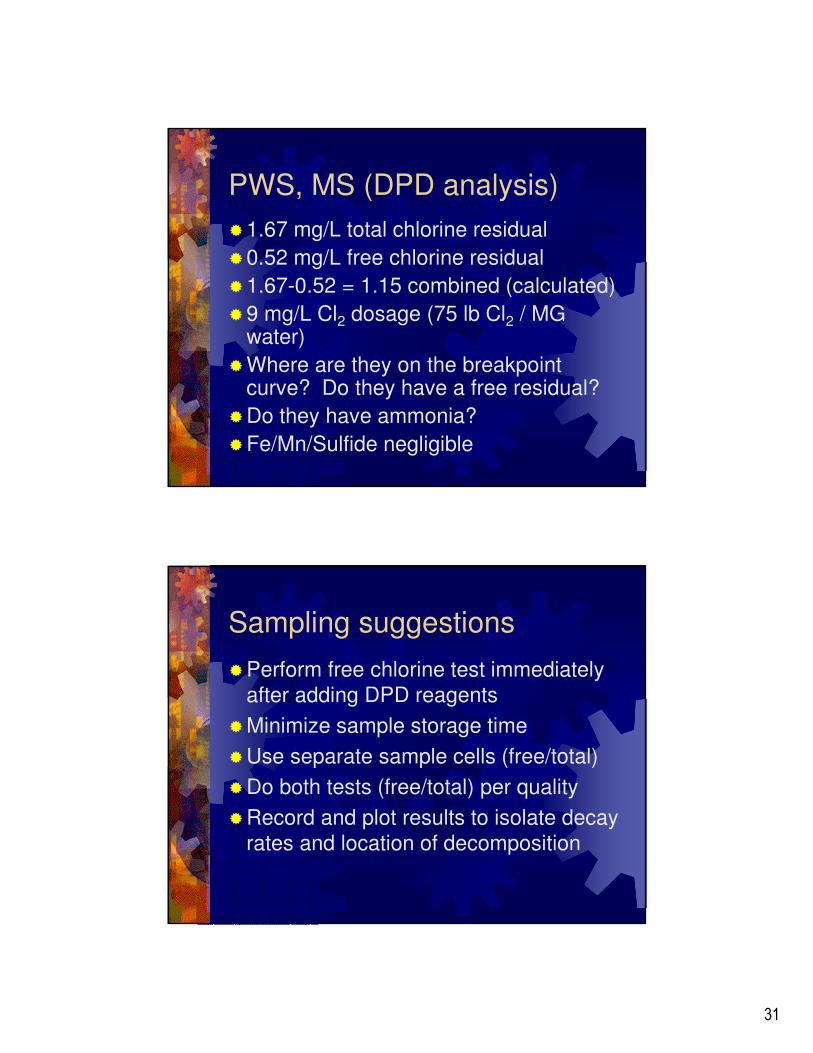
PWS, MS (DPD analysis)
�1.67 mg/L total chlorine residual
�0.52 mg/L free chlorine residual
�1.67-0.52 = 1.15 combined (calculated)
�9 mg/L Cl2 dosage (75 lb Cl2 / MG water)
�Where are they on the breakpoint curve? Do they have a free residual?
�Do they have ammonia?
�Fe/Mn/Sulfide negligible
Sampling suggestions
�Perform free chlorine test immediately
after adding DPD reagents
�Minimize sample storage time
�Use separate sample cells (free/total)
�Do both tests (free/total) per quality
�Record and plot results to isolate decay
rates and location of decomposition
32
Treatment steps to improve
system chlorine residuals
�Remove Fe/Mn, organics, precursors
�Sequester Fe/Mn with polyphosphate
�Corrosion control keeps pipes cleaner and free of biofilm, byproducts, organics
�Pre-oxidize with permanganate / ozone to destroy DBP precursors and demand
�Pre-aerate to release hydrogen sulfide
�Consider Chloramination (Cl2 + NH3-N)
Contact Information:
�Phone: 815.389.0126
�www.SponWater.com
33
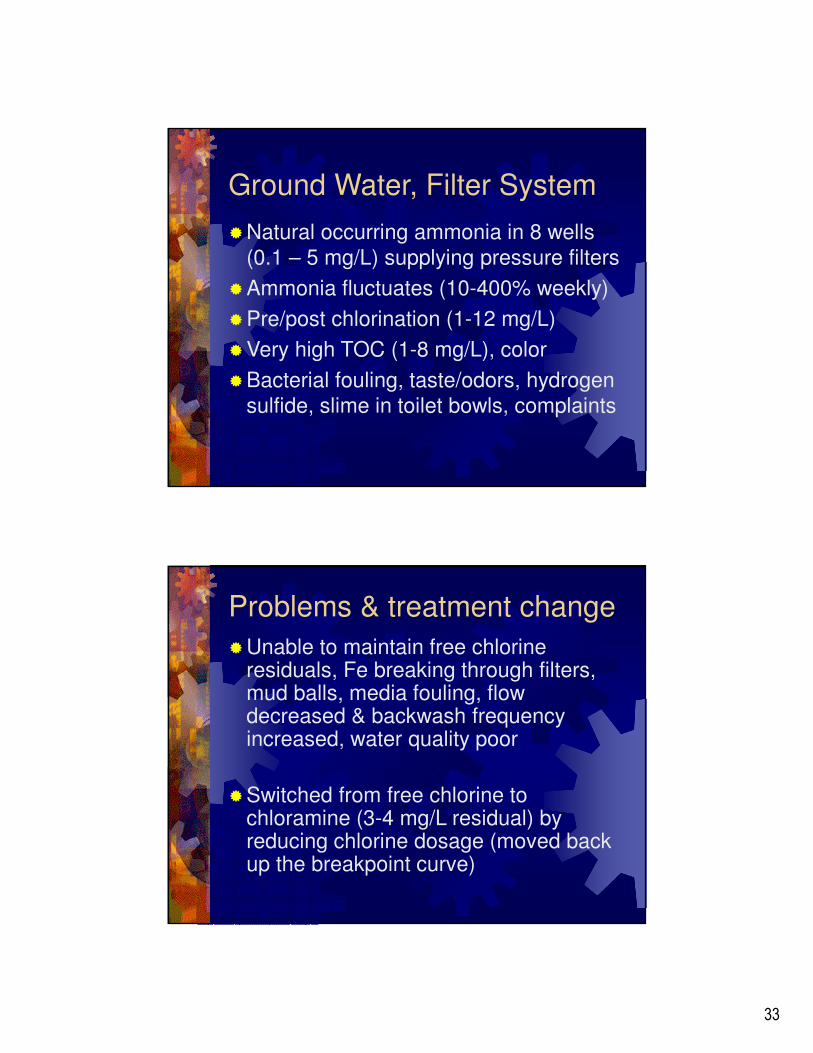
Ground Water, Filter System
�Natural occurring ammonia in 8 wells
(0.1 – 5 mg/L) supplying pressure filters
�Ammonia fluctuates (10-400% weekly)
�Pre/post chlorination (1-12 mg/L)
�Very high TOC (1-8 mg/L), color
�Bacterial fouling, taste/odors, hydrogen
sulfide, slime in toilet bowls, complaints
Problems & treatment change
�Unable to maintain free chlorine residuals, Fe breaking through filters, mud balls, media fouling, flow decreased & backwash frequency increased, water quality poor
�Switched from free chlorine to chloramine (3-4 mg/L residual) by reducing chlorine dosage (moved back up the breakpoint curve)
34
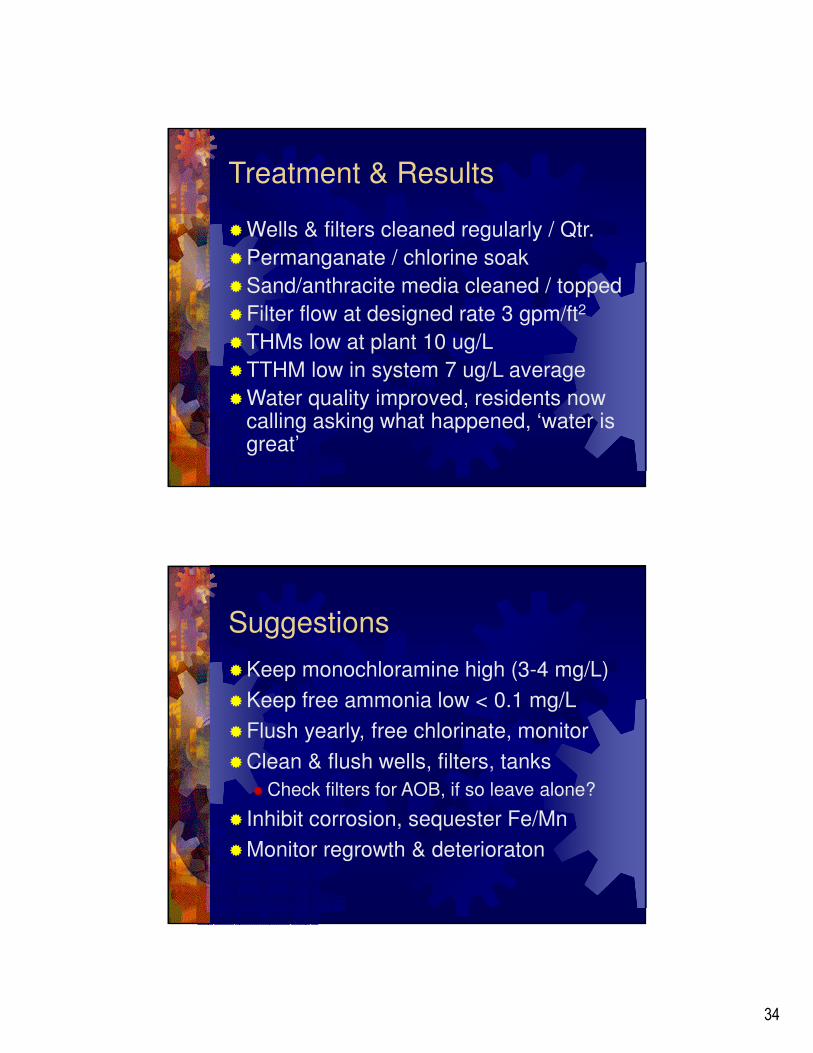
Treatment & Results
�Wells & filters cleaned regularly / Qtr.
�Permanganate / chlorine soak
�Sand/anthracite media cleaned / topped
�Filter flow at designed rate 3 gpm/ft2
�THMs low at plant 10 ug/L
�TTHM low in system 7 ug/L average
�Water quality improved, residents now calling asking what happened, ‘water is great’
Suggestions
�Keep monochloramine high (3-4 mg/L)
�Keep free ammonia low < 0.1 mg/L
�Flush yearly, free chlorinate, monitor
�Clean & flush wells, filters, tanks
� Check filters for AOB, if so leave alone?
� Inhibit corrosion, sequester Fe/Mn
�Monitor regrowth & deterioraton
35
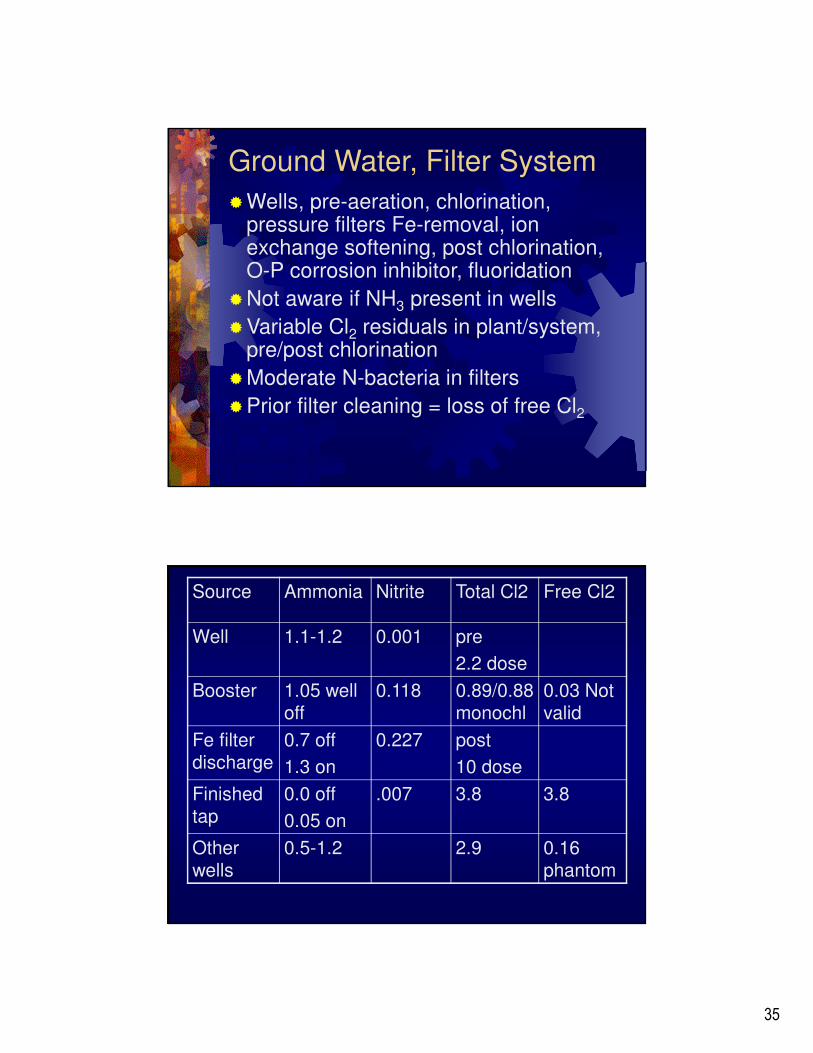
Ground Water, Filter System
�Wells, pre-aeration, chlorination, pressure filters Fe-removal, ion exchange softening, post chlorination, O-P corrosion inhibitor, fluoridation
�Not aware if NH3 present in wells
�Variable Cl2 residuals in plant/system, pre/post chlorination
�Moderate N-bacteria in filters
�Prior filter cleaning = loss of free Cl2
Source Ammonia Nitrite Total Cl2 Free Cl2
Well 1.1-1.2 0.001 pre
2.2 dose
Booster 1.05 well off
0.118 0.89/0.88 monochl
0.03 Not valid
Fe filter discharge
0.7 off
1.3 on
0.227 post
10 dose
Finished tap
0.0 off
0.05 on
.007 3.8 3.8
Other wells
0.5-1.2 2.9 0.16 phantom
36
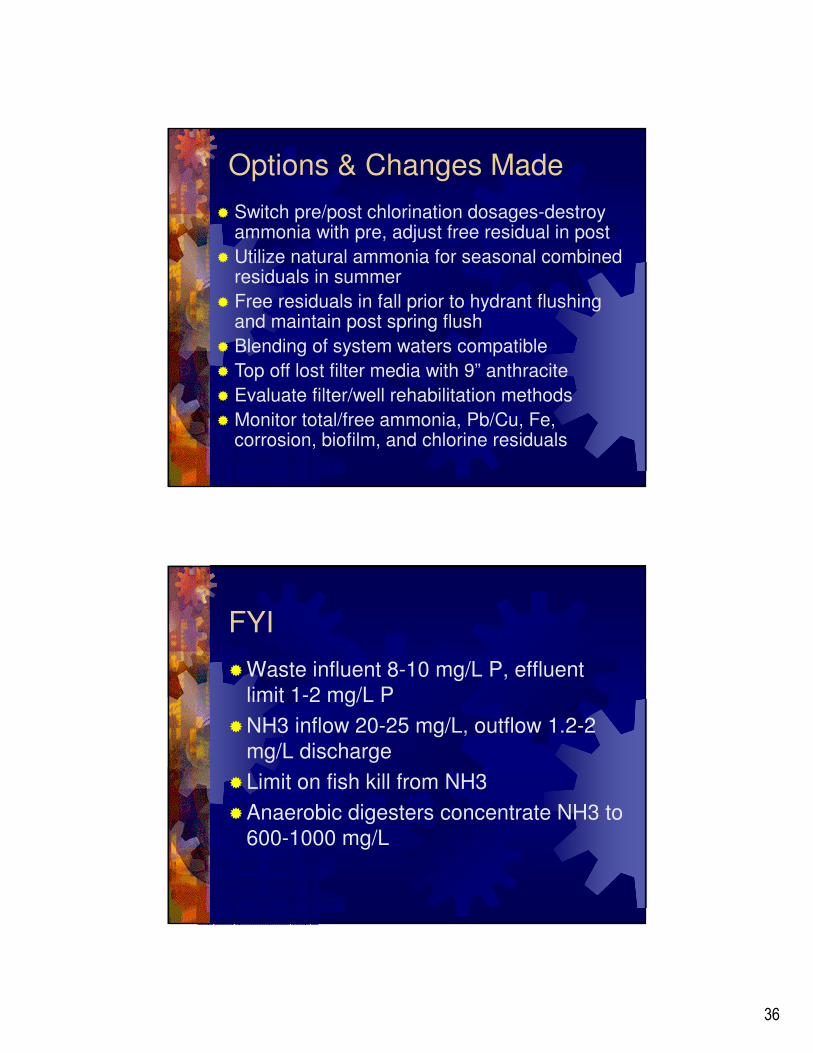
Options & Changes Made
� Switch pre/post chlorination dosages-destroy ammonia with pre, adjust free residual in post
� Utilize natural ammonia for seasonal combined residuals in summer
� Free residuals in fall prior to hydrant flushing and maintain post spring flush
� Blending of system waters compatible
� Top off lost filter media with 9” anthracite
� Evaluate filter/well rehabilitation methods
� Monitor total/free ammonia, Pb/Cu, Fe, corrosion, biofilm, and chlorine residuals
FYI
�Waste influent 8-10 mg/L P, effluent
limit 1-2 mg/L P
�NH3 inflow 20-25 mg/L, outflow 1.2-2
mg/L discharge
�Limit on fish kill from NH3
�Anaerobic digesters concentrate NH3 to
600-1000 mg/L
37