free enterprise curriculum
TRANSCRIPT

Comprehensive Curriculum
Free Enterprise
Cecil J. Picard State Superintendent of Education
© April 2005

Free Enterprise
Table of Contents
Unit 1: Scarcity, Choice, and Opportunity Cost ........................................................................1 Unit 2: Production......................................................................................................................7 Unit 3: Markets and Entrepreneurs ..........................................................................................13 Unit 4: Supply and Demand.....................................................................................................22 Unit 5: Money, Banking and the Federal Reserve...................................................................28 Unit 6: Measuring the Economy ..............................................................................................37 Unit 7: Inflation and Unemployment.......................................................................................42 Unit 8: Government Policy and Taxation ................................................................................48 Unit 9: The Global Economy...................................................................................................56 Unit 10: Personal Economics...................................................................................................63

Free Enterprise Unit 1 Scarcity, Choice, and Opportunity Cost 1
Free Enterprise Unit 1: Scarcity, Choice, and Opportunity Cost
Time Frame: Approximately one week Unit Description This unit is a study how insufficient resources to meet needs and wants influence economic decisions based on four fundamental economic questions. Student Understandings Students understand that scarcity influences the economic choices at the personal, family, and societal levels. Students learn how to apply the four basic economic questions in analyzing economic choices. Guiding Questions
1. Can students identify an economic choice and its opportunity cost? 2. Can students define scarcity and how the concept of scarcity drives economic
decisions? 3. Can students explain the four fundamental economic questions associated with the
circular flow of goods/services? Unit 1 Grade Level Expectations (GLEs)
GLE # GLE Text and Benchmarks Economics: Fundamental Economic Concepts 1. Apply fundamental economic concepts to decisions about personal finance
(E-1A-H1) 2. Define scarcity (E-1A-H1) 3. Identify factors that drive economic decisions (e.g., incentives, benefits, costs,
trade-offs, consequences) (E-1A-H1) 4. Analyze an economic choice at the personal, family, or societal level to
determine its opportunity cost (E-1A-H1) 6. Identify the four basic economic questions (E-1A-H1) 29. Explain the role of factors of production in the economy. (E-1B-H2) 32. Analyze the circular flow of goods and services and money payments from a
diagram (E-1B-H2)

Free Enterprise Unit 1 Scarcity, Choice, and Opportunity Cost 2
Sample Activities Activity 1: Analyzing the Impact of Scarcity (GLE: 2) Once upon a time we said that air and water were “free” goods. Ask students why water and air are no longer free goods (e.g., bottled water can cost more per gallon than gasoline). Ask students to explain how scarcity impacts the price of a good. Define scarcity with the class (e.g., all things are limited while consumers have unlimited desires for more goods/services). Trace the history of gold as a scarce element. Have students take notes on a discussion of the following:
• Why do we demand gold (e.g., jewelry, money, electronics)? • What happened when we discovered gold in California? • What happened to the value of gold when the supply of gold increased? • What happens if people buy gold in large quantities (more jewelry, for
example)? Have students introduce different products, applying scarcity as a determinate of cost, price, and the choices buyers have to make. Have students explain how a need is impacted by scarcity (e.g., the limited supply of fuel oil and families that are dependent upon fuel oil for heat). Have students explain a want and determine what would happen if that product became scarce. Activity 2: “There is No Such Thing as a Free Lunch” (GLE: 2) Have students name products that they think they might be able to get for free. (Students may mention coupons for free food or drinks at fast food restaurants or buy-one—get-one-free gimmicks). Ask students to think about how a restaurant or other place of business would be able to pay for that product. Discuss how no product is really free, how producers may raise the price of other items to pay for the so-called free items. Introduce the term many economic educators use: TINSTAAFL. TINSTAAFL is an acronym for There Is No Such Thing As A Free Lunch. Explain that nothing in life is free because there is scarcity and each society must deal with this scarcity. Activity 3: The Factors of Production (GLE: 29) Explain to students that the factors of production are these: land, labor, capital, and entrepreneurs. Explain how those factors of production are used in making a particular product. For example in order to make tennis shoes we might need the following factors of production:
Land: area for the factory Labor: workers with their physical labor and ideas Capital: Tools in the factory needed as well as the money needed for the business

Free Enterprise Unit 1 Scarcity, Choice, and Opportunity Cost 3
Entrepreneur: An entrepreneur may come up with ideas on how to combine the above factors of production.
After this discussion, provide students with old magazines and have them cut out examples of land, labor, and capital. The students should take the role as an entrepreneur and determine how those three factors of production might be combined to produce a good or service. Activity 4: Working with the Circular Flow of Goods and Services (GLE: 32) Introduce the Circular Flow of Goods and Services graphic that illustrates what happens in an economic system. Most textbooks have a good example of this graphic, but the site http://www.socialstudieshelp.com/Economics Circular Flow.htm contains one, if needed. Go over the graphic carefully with the class, identifying and defining terms (e.g., consumers and producers). Have students explain the roles of consumers and producers. Have students trace the flow of money and goods/services. Have students describe the market for factors of production and define each factor (i.e., labor, land, capital, and management/entrepreneurship). Have each student write an explanation of the Circular Flow Chart. Then have them exchange explanations with at least two other students, making additions/corrections to each other’s as needed. Assess these individually against a class-generated rubric. Activity 5: Questions Every Economy Must Answer (GLE: 6) Review these questions carefully with students, illustrating how price impacts money and goods/service flows in the Circular Flow chart.
• What should the economy produce? Market economies use price to answer this question. For example, Product X at a very high price may not sell, thus producers may stop making the product.
• How should goods/services be produced? Producers combine resources (consumers sell factors of production) to make products they can sell. Price of factors of production influence producer decisions to make or not to make a product
• Who should receive the goods/services produced? Incomes limit choices and decisions of consumers as they respond to price in the marketplace. Consumers earn incomes based on their contributions (factors of production) to production of goods/services.
• How should the economy provide for growth? Producers increase the supply of goods and services in response to price in the marketplace. Consumers earn increased incomes as they respond (offer their labor or capital) to the price of factors of production.

Free Enterprise Unit 1 Scarcity, Choice, and Opportunity Cost 4
Divide the chart into two sides (a line drawn through both markets.) Ask students to determine which side is the supply side and which is the demand side. Have students explain the decisions that are made on the supply side (e.g., producers decide what factors of production to buy and decide what to produce for sale). Have students explain the decisions that are made on the demand side (e.g., consumers choose what products to buy based on their price and their income). Have students note that consumer income is decided by the price for factors of production. All four questions are answered by prices in the market. Ask students to use their charts to explain (1) what happens when the price of goods rises, and (2) what happens when the price of wages declines. Activity 6: Analyzing Choices and Making Decisions (GLEs: 1, 3) Divide the class into small groups. Give a dollar figure (e.g., $500) with which they have to collectively decide on a product for each of them (e.g., athletic shoes). After students come to a decision, have them discuss what choices they made about what to buy in the market. Have them discuss how their opportunities change if the dollar figure provided is cut in half, and/or doubled. Ask students to analyze how the following actions would impact consumer decisions and/or choices:
• Seller offers a discount (incentive) on something you want to buy • Advertising informs that a product has special benefits over other products • One product among similar products has the highest cost • Buying product A means giving up product B (opportunity cost–trade-off) • Buying product X (car) places stress on income (consequences)
Ask students to explain how name brands, cheaper alternative products, the difficulty of the trade-off, and family income influence choices and decisions in the marketplace with a specific product, either real or imagined. Ask students how they might market both a name brand and a cheaper alternative product. Activity 7: Analyzing Economic Choices (GLE: 4) Simulate a situation where a family or an individual has $100 left over at the end of the pay period. They have choices to make because they have opportunities to spend or save the money:
• Option 1: family attends a baseball game—costing $95 • Option 2: family saves the money—costing $100 • Option 3: family can eat out—costing $75 • Option 4: family can purchase DVD player—$98
(If the family saves the money, they give up the opportunity to buy the DVD player—thus the opportunity cost of saving is $98.) Have students define opportunity cost with a specific example of their own creation, like the one in the above scenario. Have students design a scenario in which a parish has a surplus of dollars in the budget at the end of the fiscal year and some opportunities to spend or save the money that might be present for a

Free Enterprise Unit 1 Scarcity, Choice, and Opportunity Cost 5
community. Have students present a case for the option that they could defend as the best option. Sample Assessments General Guidelines
• Students should be monitored on all activities via teacher observation, report writing, class discussion, and journal entries.
• Use a variety of performance assessments to determine student comprehension. • Select assessments consistent with the type of products that result from the
student activities. General Assessments
• Students should answer an in-class essay question on how scarcity is seen in our society and how American society answers the four economic questions to deal with that scarcity.
• Students should write journal issues throughout the unit to write their opinions on questions posed by teacher as well as for other issues discussed in class.
• Students should label the exchange of money and factors of production on a blank diagram of the circular flow chart.
Activity-Specific Assessments
• Activity 1: Have students bring in coupons or ads for free products, then have students write a journal entry on how the company who wrote the ad would pay for the product.
• Activity 2: Current Events Article: Have students find a news article which
demonstrates the concept of scarcity. In their summary of the article, they should write how the concept of scarcity is shown in the article. Use the following rubric for grading:
Writing—organized, clear, and grammatically correct 10% Article—current and attached
10%
Summary—Makes specific reference to the concept of scarcity
40%
Information is accurate and complete
40%

Free Enterprise Unit 1 Scarcity, Choice, and Opportunity Cost 6
• Activity 7: Have students interview a parent or other family member and then write a short essay on the types of trade-offs this person made in his/her life and how it has impacted his/her achievement of goals.

Free Enterprise Unit 2 Production 7
Free Enterprise Unit 2: Production
Time Frame: Approximately two weeks Unit Description Students study the factors of production in an economy and the conditions that affect the productivity. Student Understandings Students understand that production in an economy is affected by factors of production and by labor and management conditions and practices. Students learn that the productivity of an economy affects the standard of living. Guiding Questions
1. Can students explain the relationship between productivity and standard of living?
2. Can students identify factors of production? 3. Can students explain the importance of labor-management relations and how
labor relations affect the productivity and profits of business? Unit 2 Grade Level Expectations (GLEs) GLE # GLE Text and Benchmarks Economics: Fundamental Economic Concepts 7. Define productivity and characterize the relationship between productivity
and standard of living (E-1A-H2) 9. Identify actions or conditions that increase productivity or output of the
economy (E-1A-H2) 19. Analyze the importance of labor-management relations and the effects of
given labor and management practices on productivity or business profitability (E-1A-H6)
Individuals, Households, Businesses, and Governments 29. Explain the role of factors of production in the economy (E-1B-H2) 30. Identify factors affecting production/allocation of goods/services and
characterize their effects (E-1B-H2) The Economy as a Whole 48. Define productivity and characterize the relationship between productivity
and standard of living (E-1C-H1)

Free Enterprise Unit 2 Production 8
Sample Activities Activity 1: Relating Productivity to Consumer Incomes (GLEs: 7, 9, 29, 48) Define producer, production, and productivity with the students to generate working definitions for all. Inductively, discuss the following conclusions: production is the process by which the factors of production are employed to make a product; productivity is the measure (value) of a given factor of production in making a product; a producer makes decisions about what to make or produce. Review with students that this is the supply side of the circular flow of goods and services. Ask students to explain how decisions are made in the following situation: Using the Circular Flow of Goods and Services chart, ask students to explain what happens in each case to money and product flows. Activity 2: Analyzing the Market for Factors of Production (GLEs: 29, 30) Review student knowledge of the roles producers and consumers play in the market for factors of production by returning to the Circular Flow chart. Ask students to articulate definitions of land, labor, capital, and management. Have students discuss types of incomes that result from each factor: rent, interest, wages, and profits. Have students determine numerous examples to ensure student comprehension. Explain that all factors of production may be employed (used) to produce a product. How much of a given factor is used depends upon its productivity and its price in the market for factors of production. Secure copies of the Wall Street Journal or other newspaper and ask students to examine the numerous markets for raw materials, machinery, laborers and managers (e.g., soybeans, crude oil, pork bellies, cacao beans). Using the Circular Flow chart, ask students to do the following (teachers may want to add more examples):
• Explain how declining prices for a factor of production (e.g., crude oil) impacts the price of goods/services.
• Explain how declining prices for a factor of production (e.g., wage) impacts the money flow to consumers.
Product A is being made by combining two workers, a manager, a building, and two machines: 1. If adding another worker increases production, what will the producer do? What will
happen to wages and worker incomes? 2. If adding one more machine increases production using one less worker, what will the
producer do? What will happen to wages and worker incomes?

Free Enterprise Unit 2 Production 9
Ask students to summarize by explaining how factors of production produce consumer incomes and how factors of production are combined to determine the level of output. Activity 3: Dynamics in Marketplace (GLEs: 7, 9) Using a specific historical case study, Eli Whitney’s cotton gin, have students work in small groups or pairs to complete a brainstorming chart after reading or listening to a summary of this piece of American history. This chart should attempt to explain the impact of Eli Whitney’s cotton gin on each of the following topics:
• the price of cotton goods and the price of woolen goods • production of cotton goods and production of woolen goods • production of cotton • cost of labor (slavery) • price of land to grow cotton • quality of family clothing
After students work in groups to complete the charts, use these charts to facilitate a whole-class discussion during which students may add to their own charts and make adjustments in notes for understanding. Next, have students follow the same process of chart completion as they did with the cotton gin, but this time toward a more recent time period and invention—the computer chip. Ask students to explain and describe the impact of the personal computer on the following:
• electric typewriters • correspondence • technicians • print media • record-keeping in homes and businesses • home/family environment
Activity 4: Relating Productivity and Labor-Management Relations (GLE: 19) Ask students to analyze and present their findings on how productivity is impacted when robotic arms (machines) are employed to weld body parts on automobiles. Have students address all of the following questions:
• What happens to welders no longer needed on the assembly line (unemployed)?
• What happens to workers building robotic arms? • What happens to the price of automobiles? • Would consumers buy more automobiles? • Has the output of the economy increased or decreased? • What happens to the standard of living of welders (labor no longer
employed)?
Free Enterprise Unit 2 Production 10
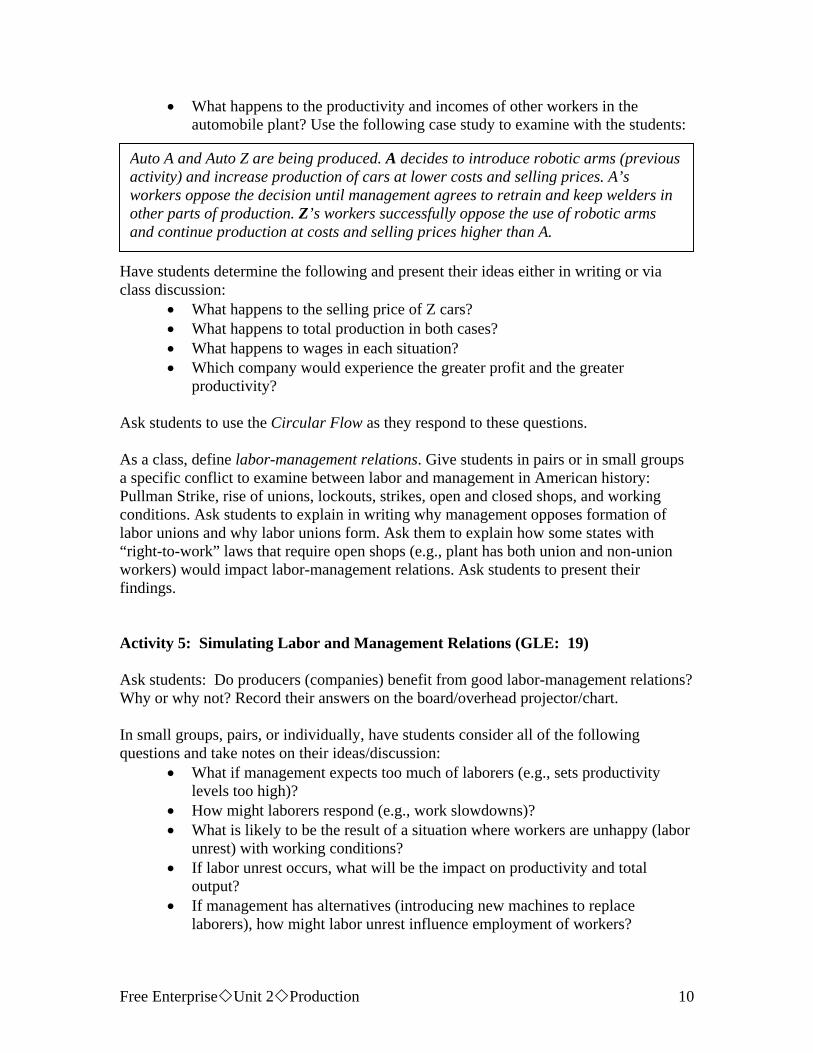
• What happens to the productivity and incomes of other workers in the automobile plant? Use the following case study to examine with the students:
Have students determine the following and present their ideas either in writing or via class discussion:
• What happens to the selling price of Z cars? • What happens to total production in both cases? • What happens to wages in each situation? • Which company would experience the greater profit and the greater
productivity?
Ask students to use the Circular Flow as they respond to these questions. As a class, define labor-management relations. Give students in pairs or in small groups a specific conflict to examine between labor and management in American history: Pullman Strike, rise of unions, lockouts, strikes, open and closed shops, and working conditions. Ask students to explain in writing why management opposes formation of labor unions and why labor unions form. Ask them to explain how some states with “right-to-work” laws that require open shops (e.g., plant has both union and non-union workers) would impact labor-management relations. Ask students to present their findings. Activity 5: Simulating Labor and Management Relations (GLE: 19) Ask students: Do producers (companies) benefit from good labor-management relations? Why or why not? Record their answers on the board/overhead projector/chart. In small groups, pairs, or individually, have students consider all of the following questions and take notes on their ideas/discussion:
• What if management expects too much of laborers (e.g., sets productivity levels too high)?
• How might laborers respond (e.g., work slowdowns)? • What is likely to be the result of a situation where workers are unhappy (labor
unrest) with working conditions? • If labor unrest occurs, what will be the impact on productivity and total
output? • If management has alternatives (introducing new machines to replace
laborers), how might labor unrest influence employment of workers?
Auto A and Auto Z are being produced. A decides to introduce robotic arms (previous activity) and increase production of cars at lower costs and selling prices. A’s workers oppose the decision until management agrees to retrain and keep welders in other parts of production. Z’s workers successfully oppose the use of robotic arms and continue production at costs and selling prices higher than A.

Free Enterprise Unit 2 Production 11
Divide students into two groups—workers and managers. (It may be appropriate to make the workers the larger of the two groups.) Simulate an environment where workers are unhappy with their working conditions and wages. Assign students to roles as workers and managers confronting this problem. Ask students to come to a consensus or compromise to resolve conflict by a specific time deadline, or explain why a conflict resolution is not possible by the deadline and give a specific plan for continuing attempts at resolution. Activity 6: Relating Productivity to Incomes (GLE: 30) Return to the Circular Flow, asking students to explain how goods/services are allocated to consumers by their price (what they are willing to pay) in the marketplace. Ask students to explain why consumers spend (or save) their incomes to buy what they need and want. Ask students to explain why consumer incomes are determined by the amount of factors of production that producers offer for sale and consumers are willing to purchase. Ask students to explain how the allocation of goods/services (price of goods and incomes) is correlated to the productivity of factors of production (price of factors and incomes). Ask students to explain this with a specific example(s) of goods/services. Ask students to explain the proposition that “as productivity increases so do incomes and the availability of goods/services.” Ask students to determine a specific industry that supports this proposition (e.g., auto industry, Microsoft, etc.)
Sample Assessments General Guidelines
• Students should be monitored on all activities via teacher observation, report writing, class discussion, and journal entries.
• Use a variety or performance assessments to determine student comprehension. • Select assessments consistent with the type of products that result from the
student activities. General Assessments
• Students should write a report explaining how productivity, income, and standard of living are related.
• Students should complete journal entries on teacher-selected topics during the unit.

Free Enterprise Unit 2 Production 12
• Students should find a current events article on labor-management relations, productivity, or standard of living. The students should summarize the article and write how this article is related to what they have learned in class.
Activity-Specific Assessments
• Activity 1: In groups or pairs, ask students to come up with a definition of standard of living and explain in a statement or two how it is related to incomes and wages. Ask students to apply this definition as they explain how the standard of living of Americans is linked to the productivity of each factor of production (e.g., land, labor, capital, and management).
• Activity 3: Ask students to review what they have learned from examining the
cotton gin and the computer chip and then formulate a thorough summary statement of how a new product impacts the sale of similar products, production of the new and similar products, and the prices of the new and similar products. Have students present these summary statements to the class.
• Activity 4: Ask students to choose a new invention, either real or imagined, and create a forecasting chart that addresses the possible effects the new invention might have on productivity and standard of living. Allow students to use poster boards or large sheets of bulletin board paper to complete this assessment activity. Use the following rubric for reference:
20% Name of Invention/ Explanation of what the new
invention will do 10% Picture of Invention 35% Explanation of how the new invention might increase
productivity 35% Three (3) ways in which the new invention might affect
standard of living.
Free Enterprise Unit 3 Markets and Entrepreneurs 13
Free Enterprise Unit 3: Markets and Entrepreneurs
Time Frame: Approximately two weeks Unit Description Students study the market economy system and the role entrepreneurs play in making it work. Student Understandings Students understand that a market economy depends on a free enterprise system where entrepreneurs make economic decisions. Students evaluate economic systems in the past and present for their advantages, disadvantages, and effectiveness in achieving given social goals. Students learn how economic incentives can change economic behavior and the role of competition in making a market economy work. Students understand how an economy works through the study of the flow of goods and services and money payments. Guiding Questions
1. Can students explain why interdependence is linked to scarcity of natural resources?
2. Can students explain the purpose and importance of marketing in the economy?
3. Can students explain factors that affect competition and why competition is important to the economy?
4. Can students identify different types of business ownership and the importance of each?
Unit 3 Grade-Level Expectations (GLEs) GLE # GLE Text and Benchmarks Economics: Fundamental Economic Concepts 5. Explain how the scarcity of natural resources leads to economic
interdependence (E-1A-H1) 8. Explain the role of marketing and channels of distribution in economic
decisions (E-1A-H)

Free Enterprise Unit 3 Markets and Entrepreneurs 14
GLE # GLE Text and Benchmarks 13. Compare contemporary and historic economic systems (e.g., ownership
and control of production and distribution, determination of wages) (E-1A-H4)
14. Explain the advantages and disadvantages of given market structures (E-1A-H5)
15. Explain factors affecting levels of competition in a market (e.g., number of buyers and sellers, profit motive, collusion among buyers or sellers, presence of cartels) (E-1A-H5)
16. Explain the effects of competition on producers and consumers (E-1A-H5)
20. Compare and contrast characteristics of various forms of business ownership (E-1A-H6)
26. Interpret information about a current economic system undergoing change from a largely command or traditional system to a more mixed system (e.g., Eastern European countries, China, other developing economies) (E-1A-H8)
Individuals, Households, Businesses, and Governments 31. Identify the difference between monetary and non-monetary incentives
and how changes in incentives cause changes in behavior (E-1B-H2) 32. Analyze the circular flow of goods and services and money payments from
a diagram (E-1B-H2)
Sample Activities Activity 1: Introducing Different Economic Systems (GLE: 13) Students take notes on the following concepts delivered orally with appropriate visuals created by instructor:
a. All economies are driven by economic wants and needs (e.g., consumer demand). Humans have needs and wants that are unlimited. At the same time, resources to make products and provide services are limited (scarce). Producers in every society try to meet the demand of its members.
b. All economic systems must answer four basic questions for society:
1. What goods and services will the economy produce? 2. How are goods and services produced? 3. How are goods and services distributed in the economy? 4. How does the economy expand?
c. How these questions are answered defines differences between free market and command economies. See chart on next page.

Free Enterprise Unit 3 Markets and Entrepreneurs 15
BASIC QUESTIONS
FREE MARKET ECONOMY
MIXED ECONOMY
COMMAND ECONOMY
What goods and services will the economy produce?
Prices of goods and services provide incentives to producers to supply goods. Prices of goods and services provide incentives to consumers to choose goods. Market prices determine what goods will be produced and sold.
Taxes and price supports might be used at times to encourage the production of a good or to discourage the production of a good. Market prices determine most of the goods that are produced and sold.
Central authority decides what goods and services will be produced and how they will be priced.
How are goods and services produced in the economy?
Market prices for factors of production shape the decisions that producers make. When the price of one factor (resource) increases in value, producers find ways to use other factors to make the good.
The government may act to protect the value of a resource (e.g., minimum wage). Generally prices in the market for factors of production determine how goods are produced.
Central authority decides how factors of production will be used to make products.
How does the economy provide for growth?
Consumers save and invest in production to make more goods and services.
Government stimulates production by offering incentives, and subsidies. Government increases the money supply increasing buyer incomes and demand for goods and services.
Growth depends on the ability of the central authority to encourage worker productivity and producer efficiency. Incentives may be directed.
How are goods and services distributed to members of the society?
Consumer incomes are determined by their contribution of factors of production. Consumer incomes determine what goods and how much goods individuals receive. Market prices provide incentives for the production and purchase of goods and services.
Government may use taxes and transfer payments to influence the distribution of incomes (e.g., social security). Most of the time the free market determines how goods and services are distributed.
Central authority decides the price of factors of production and the price of goods and services. Central authority creates markets to distribute goods they have decided should be produced.

Free Enterprise Unit 3 Markets and Entrepreneurs 16
Ask students to perform a quick check for understanding following the 3-2-1 strategy. They should write down three things they know they understand, two questions they have, and one way in which they can apply this information. Use student-generated 3-2-1 as a basis for class discussion and adjustment of student comprehension as needed.
Ask students to identify and describe two economies throughout world history—one as an example of free market and one as an example of command economies. Have the students use a Venn diagram to compare/contrast the different economies. Next, guide the discussion to include the following:
• theocracies (traditional economies) such as ancient Egypt. • totalitarian regimes such as the former Soviet Union. • socialist economies such as Sweden and France.
Ask the students to present their findings to the class or to each other. (If available, have students use PowerPoint® presentations to show their findings.) Activity 2: Comparing Economic Systems (GLEs: 13, 14) Revisit Activity 1, asking students to explain how market, mixed, and command economies compare. Ask them to compare these economies regarding the following factors:
• ownership of property • control of production • control of distribution • determination of wages • determination of prices
After students demonstrate knowledge of the different economic systems, ask students to decide which system provides the greater freedom of choice and the greater likelihood that consumers will be satisfied. Ask them to defend their decision in an oral or written argument as an individual, pair, or group. Ask students to assess how free market and command economies achieve or fail to achieve the following social and economic goals via a comparison chart:
• Equity (How does the economic system deliver goods/services that people want? How does the economic system produce what people want? Do people share equally in the economic system?)
• Efficiency (Which economic system is most efficient in the use of factors of production? Which economic system allocates goods/services most efficiently?)
• Security (Which economic system guarantees workers employment? Which economic system guarantees production to producers?)
• Growth (Compare how each system deals with growth.) • Protection of the Environment

Free Enterprise Unit 3 Markets and Entrepreneurs 17
Ask students to explain how and why the free market economy champions efficiency while command economies champion security in a summary statement to their comparison chart. Activity 3: Command Economies Undergoing Change (GLE: 26) Present a scenario where Czechoslovakia has just emerged from Soviet domination (1990) and a command economy. Communism dominated the Czechs for about 50 years during which time there was no unemployment and competition in the marketplace. What did the Czechs have to learn when the country shifted to a free market economy? Ask students, in groups or as a whole class, to take turns analyzing what they would need to learn about the following:
• employment (competition for jobs) • prices (competition among buyers) • risk (investments and savings) • banking (writing checks) • competition
Provide readings from news accounts, regional geography textbooks, and/or the Internet describing how the People’s Republic of China under a command economy has created free enterprise zones with free markets. Distribute the readings and ask students to describe what is likely to happen in China in a detailed statement about each of the following:
• As producers expand their factories in free enterprise zones, what will happen to wages?
• What happens to workers laboring in state-owned factories? • Explain why workers would/would not migrate to free enterprise zones. • How will incomes differ between free enterprise zones and the command
economy? With increased incomes how will workers impact free markets and command markets?
Ask students to write an opinion paper predicting how China will be changed through the use of free enterprise zones. Activity 4: Incentives and Market Behavior (GLE: 31) Define market incentives with the class. Ask students to identify examples of monetary incentives (e.g., subsidy, coupons, discounts) for consumers and producers. Ask them to draw upon their family’s experience with coupons, rebates, and discounts to explain how monetary incentives influence consumer behavior.
Free Enterprise Unit 3 Markets and Entrepreneurs 18
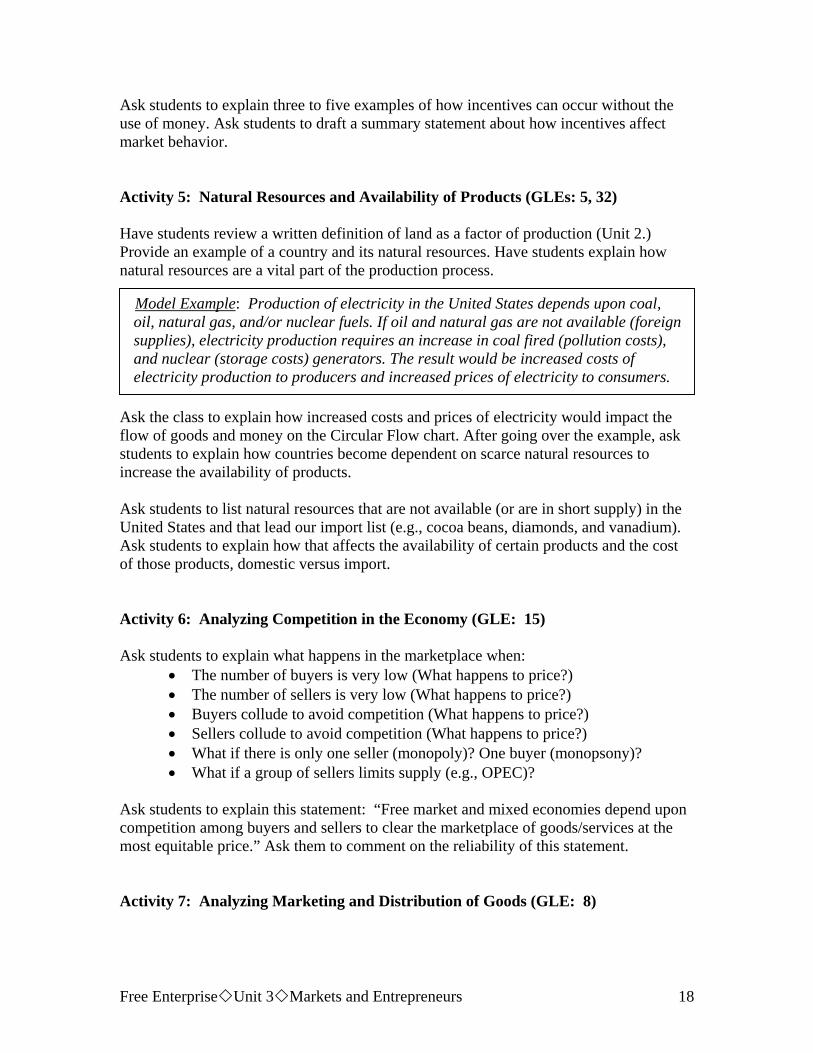
Ask students to explain three to five examples of how incentives can occur without the use of money. Ask students to draft a summary statement about how incentives affect market behavior. Activity 5: Natural Resources and Availability of Products (GLEs: 5, 32) Have students review a written definition of land as a factor of production (Unit 2.) Provide an example of a country and its natural resources. Have students explain how natural resources are a vital part of the production process.
Ask the class to explain how increased costs and prices of electricity would impact the flow of goods and money on the Circular Flow chart. After going over the example, ask students to explain how countries become dependent on scarce natural resources to increase the availability of products. Ask students to list natural resources that are not available (or are in short supply) in the United States and that lead our import list (e.g., cocoa beans, diamonds, and vanadium). Ask students to explain how that affects the availability of certain products and the cost of those products, domestic versus import. Activity 6: Analyzing Competition in the Economy (GLE: 15) Ask students to explain what happens in the marketplace when:
• The number of buyers is very low (What happens to price?) • The number of sellers is very low (What happens to price?) • Buyers collude to avoid competition (What happens to price?) • Sellers collude to avoid competition (What happens to price?) • What if there is only one seller (monopoly)? One buyer (monopsony)? • What if a group of sellers limits supply (e.g., OPEC)?
Ask students to explain this statement: “Free market and mixed economies depend upon competition among buyers and sellers to clear the marketplace of goods/services at the most equitable price.” Ask them to comment on the reliability of this statement. Activity 7: Analyzing Marketing and Distribution of Goods (GLE: 8)
Model Example: Production of electricity in the United States depends upon coal, oil, natural gas, and/or nuclear fuels. If oil and natural gas are not available (foreign supplies), electricity production requires an increase in coal fired (pollution costs), and nuclear (storage costs) generators. The result would be increased costs of electricity production to producers and increased prices of electricity to consumers.

Free Enterprise Unit 3 Markets and Entrepreneurs 19
Have students create a list of 3 examples of how producers (entrepreneurs) decide what to produce in response to price and anticipated wants of consumers. Ask students to examine three to five different print ads and explain how advertising provides information to consumers and creates demand (wants) for goods and services. Simulate a marketing and distribution situation and ask student teams to form a marketing plan for a new product, a Woggle. The Woggle is similar to some other products, but it has unique qualities that might interest consumers. Have students determine exactly what their Woggle is—what it does, how it works, who needs it, and why—in order to know their product. Have students develop a marketing plan for Woggle, Inc., that creates and expands the market for Woggles to cover its manufacturing costs (e.g., costs of the factors of production). Guide their work so that their plans include the following:
• advertising (Is this a cost of production?) • transportation routes to reach markets (consider speed, cost, and reliability) • packaging the product
Have teams present their marketing plans in class for peer evaluation. Activity 8: Competition and Consumers and Producers (GLE: 16) Ask students to explain why they would choose a certain product from a variety of competitive products: Coke vs. Pepsi, Dell vs. Macintosh, Ford vs. Chevrolet, etc. Ask students to explain how competition for goods/services forces consumers to make wise choices as they expend their incomes in a list of ways, using the products they have already discussed. Ask students to explain how, at the same time, competition for factors of production forces producers to combine factors in the most efficient way, using the producers they have already discussed. Ask students to describe how competition forces choices by consumers and producers and explain how competition results in the most efficient allocation of resources. Activity 9: Comparing Business Organizations (GLE: 20) Provide readings illustrating the characteristics of single proprietors, partnerships, and corporations as business organizations, using specific examples of these types. Have students record data about each type on a graphic organizer. Ask students to explain how each type of business organization:
• distributes risk • makes decisions • treats competition • influences markets (factors and products)

Free Enterprise Unit 3 Markets and Entrepreneurs 20
Ask students in a small group to come up with a list of 5-7 items that they would like to see available to them as a consumer. Then, have students use these lists to “go into business” for themselves and articulate which type of organization they would use and why. Students may choose to form one corporation for all of these products, partnerships, or be single proprietors. It is up to them to determine outcome, but it must be based on their explanation of how they plan to do the following:
• distribute risk • make decisions • treat competition • influence markets (factors and products)
Sample Assessments General Guidelines
• Students should be monitored on all activities via teacher observation, report writing, class discussion, and journal entries.
• Use a variety of performance assessments to determine student understanding of content. Select assessments that are consistent with the types of products that result from the student activities and develop a scoring rubric collaboratively with other teachers or students. The following are samples of assessments that could be used for the unit:
General Assessments
• Students will complete journal entries on teacher-selected topics. • Students will write or give an oral explanation of how a lack of certain natural
resources affects the availability of certain products and the costs of those products.
• Students will bring examples of market incentives cut out from the local newspaper. This may include sale papers, coupons, and rebates. Have students explain to the class how each one of their examples might affect consumer behavior.
Activity-Specific Assessments
• Activity 1: Have students write summary statements on the strengths/weaknesses of a free market economy versus the strengths/weaknesses of a command economy. Students should explain why a free market economy champions efficiency while command economies champion security.
• Activity 6: Ask students to define cartel and monopoly. Ask students to explain
how each impact the marketplace. Ask students to write a rationale to explain why

Free Enterprise Unit 3 Markets and Entrepreneurs 21
(1) collusion and cartels are illegal and (2) monopolies are regulated by government.
• Activity 8: Give the students the following scenario:
Your favorite store at which you purchase ________________ has decided to stock only one brand of that item. Have students decide what that particular item is and draft a letter to the manager of that store explaining why, from an economic perspective, this might be a poor decision. Use the following rubric for providing guidelines and for grading this assessment:
10% Letter identifies product 20% Letter is clear, organized, and grammatically correct 25% Correct business letter format is used; letter is typed and signed 45% Reasons for not stocking only one brand are based on economic
theory
Free Enterprise Unit 5 Supply and Demand 22
Free Enterprise Unit 4: Supply and Demand
Time Frame: Approximately two weeks Unit Description Students study how the principles of supply and demand determine price in a market economy. Student Understandings Students will understand that supply and demand determines price. Students use economic tools to explain and analyze how changes in supply and demand impact price, incentives and profit. Guiding Question
1. Can students explain the factors that affect supply and demand? Unit 4 Grade Level Expectations (GLEs) GLE # GLE Text and Benchmarks Individuals, Households, Businesses, and Governments 27. Explain, analyze, and apply principles of supply and demand, including
concepts of price, equilibrium point, incentives, and profit (E-1B-H1) 28. Identify factors that cause changes in supply or demand for a product (e.g.,
complements, substitutes) (E-1B-H1)
Sample Activities Activity 1: Supply and Demand (GLE: 27) Have students explain supply and demand sides of the Circular Flow. Ask students to explain how competition among producers (supply side) leads to efficient use of factors of production and determines the sellers’ price in the marketplace. Ask students to explain how competition and consumer incomes (demand side) determine what buyers are willing to pay (price) in the marketplace.

Free Enterprise Unit 5 Supply and Demand 23
Without graphs, ask students to reason out via a clear statement, written or orally delivered, what happens if the selling price of a good is too high (e.g., inventories, sellers lower prices, inefficient producers reduce production or leave the market, buyers’ demand is not adequate to clear the market). Students must address the following:
• What do they think will happen to prices? • What happens if a market price is too low (e.g., sellers reduce production, price
encourages (incentive) buyers to demand more goods)? • Competition by buyers and sellers force an equilibrium price (anticipated price) in
the marketplace. Give students historical information about the gas lines and skyrocketing prices of gasoline during the Carter administration and have them explain supply and demand. Have students examine prices of gas in three different geographical locations over a period of time and come to some conclusions about fluctuations in pricing, applying what they understand about supply and demand. Have students articulate a prediction about what would happen to the market should an alternative fuel source be made readily available to consumers. Activity 2: Supply and Demand (GLE: 27) Help students get a clear definition of what demand is by first having them give their own definitions of demand; write those definitions on the board or overhead. Then tell students that demand is defined as the desire, willingness, and ability to purchase something. Have students give examples of items they might have a desire for, yet they do not have the ability to purchase those items. Create a chart on the board or overhead and allow students to answer the following. How many of you would have the desire, willingness, and ability to purchase a slice of pizza during lunch if the price were $.25? $.50? $1? $1.50? $2? $2.50? $3? $3.50? Have the students respond by raising their hands. (The student should raise his hand for every price he would demand the slice of pizza; if at $.25, he would purchase 2 slices, then account for those extra slices in your tally.) The following is an example of what should be placed on board or overhead.
Price Quantity Demanded$.25 $.50 $1.00 $1.50 $2.00 $2.50 $3.00 $3.50

Free Enterprise Unit 5 Supply and Demand 24
Note to students that there is an inverse relationship between price and quantity demanded. As price goes up, quantity demanded goes down, and vice versa. Next have students graph this curve, with price on the vertical axis and quantity on the horizontal axis. Next, introduce the concept of supply to students. Have students take on the role as a pizza supplier. Ask them how many slices of pizza would they be willing to supply for the following prices. Explain the amount of work and expenses that might go in to making the pizza, then ask student how many slices they would supply at the following prices. Use the following graphic to demonstrate.
Price Quantity Supplied $.25 $.50 $1.00 $1.50 $2.00 $2.50 $3.00 $3.50
Note to students that there is a direct relationship between price and quantity supplied. Have students graph the results on the same graph they used for their demand results. Define equilibrium price, and point out to students that the equilibrium price is where the two lines intersect. Define incentive. Ask students to explain what incentive they might have for buying or supplying (selling) more pizza. Activity 3: Applying Principles of Supply and Demand (GLE: 27) Define demand, demand schedule, supply, supply schedule, surplus, and shortage with the students. Provide the premise that the principles of demand and supply are abstract laws governing human behavior and that we cannot know exact values of demand or supply at any given time. Provide imaginary demand and supply schedules for a product and ask students to graph the data using a vertical axis for price and a horizontal axis for supply. After they have plotted two intersecting lines, ask them to explain why the lines slope as they do (e.g., the supply line slopes upward to the right while the demand line slopes downward to the right). Ask them why price is an important influence on the lines (e.g., that buyers buy less as price increases). Demonstrate surplus and shortage on the graph. In small groups or as individuals, ask students to explain what happens if there is interference in the market as follows:

Free Enterprise Unit 5 Supply and Demand 25
• Sellers collude and fix prices at a high level (How does this impact consumption? Would consumers be satisfied? Would there be a surplus or shortage of product? Would the collusion work? Explain your answer.)
• Government gives a subsidy to sellers (How does this impact consumption? Would consumers be satisfied? Would there be a surplus or shortage of product? Explain your answer.)
• Government sets price above the equilibrium price (Would there be a surplus or shortage of product? How does this impact consumption?)
• Government sets price below the equilibrium price (Would there be a surplus or shortage of product? How does this impact consumption?)
Activity 4: Characteristics of Demand and Supply Curves (GLE: 27) Ask students to explain how they probably know the equilibrium price of a soft drink (e.g., the price is known to most consumers and does not change much over time). Define equilibrium price. Ask students to imagine a situation where consumers would demand (purchase) a product regardless of its price (e.g., batteries during a hurricane; insulin for a diabetic). Ask students to think of other products where inelastic demand may apply (e.g., emergency medical services, liability auto insurance). Have students place outline graphs on their own paper, following a whole-class model via projector, etc. Draw an extremely inelastic demand curve and ask students to imagine a situation where producers would supply (sell) a product almost regardless of price (e.g., tomato farmer when tomatoes are fully ripe). Ask them to think about what happens to the price of tomatoes in the growing season versus the winter. Draw an extremely elastic demand curve and ask students why substitute products (see above) have elastic demand (e.g., a small change in price encourages consumers to substitute products). Draw an extremely elastic supply curve and ask students to explain why suppliers would be so sensitive to price (e.g., little profitability and producers leave the industry). Activity 5: Complementary and Substitute Goods (GLE: 28) Ask students to explain what happens to the demand, supply, price, and sale of cars if the price of tires increases or decreases and record/have them record their responses. (Note that every new car sold has five new tires.) Define complementary goods. Point out to students that they have probably seen producers take advantage of their knowledge of complementary goods in the sale of razor handles and razor blades. Ask students if they ever noticed that the price of razor handles is relatively inexpensive, yet the price of the blades is usually expensive. Explain to students that the two are complementary goods and that the demand for razor blades goes up when the price for razor handles drops. Ask students to consider what happens to the price of butter if the price of margarine decreases. Butter and margarine are substitute goods. What happens if the price of butter decreases? Define substitute goods. With the graphical analyses in the previous activity in mind, ask students to consider what effect complementary goods would have on demand and supply. Ask them to note that the

Free Enterprise Unit 5 Supply and Demand 26
prices of complementary goods move in the same directions. The prices of substitutes move in opposite directions. Provide graphic examples so students can manipulate the data.
Sample Assessments
General Guidelines
• Use a variety of performance assessments to determine student comprehension. • Select assessments consistent with the type of products that result from the student
activities. General Assessments
• Students will verbally state their conclusions about the nature of supply and demand through the activities in this unit.
• Students will create graphs of supply and demand given a list of prices and quantity supplied or demanded at each price.
• Students will write journal entries throughout this unit on their understanding of supply and demand.
Activity-Specific Assessments
• Activity 1: Students should find a current events article that illustrates the law(s) of supply and/or demand. Use the following rubric for assessment.
Title and date of article 10% Article attached to paper 10 %
Summary of article 30% Explanation of how article relates to law(s) of supply and or demand.
50%
• Activity 2: In small groups or as individuals, students will create a cause and effect
graphic on the effects of the following scenarios. If possible, students should use computers to generate the graphics.
Sellers collude and fix prices at a high level (How does this impact consumption? Would consumers be satisfied? Would there be a surplus or shortage of product? Would the collusion work? Explain your answer.) Government gives a subsidy to sellers (How does this impact consumption?
Would consumers be satisfied? Would there be a surplus or shortage of product? Explain your answer.)

Free Enterprise Unit 5 Supply and Demand 27
Government sets price above the equilibrium price (Would there be a surplus or shortage of product? How does this impact consumption?) Government sets price below the equilibrium price (Would there be a surplus
or shortage of product? How does this impact consumption?)
• Activity 4: Have students find examples from newspapers or magazines of complementary and substitute goods. Students should write an explanation for each pair why they are substitute or complimentary goods and how the price of one affects the demand for the other.
Free Enterprise Unit 5 Money, Banking, and the Federal Reserve 28
Free Enterprise Unit 5: Money, Banking and the Federal Reserve
Time Frame: Approximately three weeks Unit Description Students study the role of economic institutions in the U.S. economy. Student Understandings Students will understand that the banking system regulates the supply of money and provides services to consumers. Students will learn that financial markets provide capital for economic growth. Students will learn that interest rates impact both business and consumers. Students will understand the role of regulatory agencies in managing the U.S. economy. Students will apply their knowledge of the role of economic institutions to an historical economic issue or situation. Guiding Questions
1. Can students explain the purpose and importance of banks to economic systems? 2. Can students identify the purpose and importance of financial markets? 3. Can students explain the role and importance of the Federal Reserve System? 4. Can students identify the purpose and importance of the FDIC? 5. Can students explain the role of interest and interest rates on the economy?
Unit 5 Grade-Level Expectations (GLEs) GLE # GLE Text and Benchmarks Economics: Fundamental Economic Concepts 17. Analyze the role of various economic institutions in economic systems
(E-1A-H6) 22. Analyze the role of banks in economic systems (e.g., increasing the money
supply by making loans) (E-1A-H7) 23. Describe the functions and purposes of the financial markets (E-1A-H7) 24. Compare and contrast credit, savings, and investment services available to the
consumer from financial institutions (E-1A-H7) 25. Apply an economic concept to analyze or evaluate a given economic issue or
situation (e.g., causes of the Great Depression, how the New Deal changed the role of the federal government) (E-1A-H8)

Free Enterprise Unit 5 Money, Banking, and the Federal Reserve 29
GLE # GLE Text and Benchmarks The Economy as a Whole 53. Describe the effects of interest rates on businesses and consumers (E-1C-H2) 63. Explain the role of the Federal Reserve System as the central banking system
of the United States (E-1C-H4) 64. Explain the role of regulatory agencies in the U.S. economy (E-1C-H4) 65. Explain the role of the Federal Deposit Insurance Corporation (FDIC) (E-1C-
H4)
Sample Activities Activity 1: Financial Institutions (GLE: 17) Introduce the class to the Stock Market Game operated under the direction of the Securities and Exchange Commission and the Joint Council for Economic Education. Explain to students what the Securities and Exchange Commission is, then assign students in pairs to research the role of the following institutions in the American economy: [add others]
• Department of the Treasury • Local banks • Federal Reserve System • Securities and Exchange Commission • Rural Electrification Association • Interstate Commerce Commission • Federal Trade Commission
Have students present their information in class discussion. Relate how each institution promotes money and product flows in the economy. Activity 2: Analyzing Banks and the Supply of Money (GLE: 22) Ask students to explain what happens when a bank loans money (credit) to a customer to purchase a new car. Have the whole class define money.
The supply of money has been expanded since the demand deposit is still a matter of record and the car dealer has a check equaling the purchase. At the same time banks can reduce the supply of money by calling loans—e.g., demanding repayment of a loan. Banks also exchange foreign monies for a fee facilitating foreign trade and tourism. Note: Recent legislation has permitted insurance companies and other financial institutions to perform banking functions

Free Enterprise Unit 5 Money, Banking, and the Federal Reserve 30
Review the impact of Andrew Jackson’s war against the National Bank to illustrate the impact banks can have in the economy. Ask students to recall what Jackson did and how it impacted the supply of money, inflation, and ultimately recession. Return to the Circular Flow, asking students to consider what happens in the markets for goods/services and factors of production when the supply of money exceeds the amount of products available for sale. Have students explain what happens to the price of goods. What happens to the cost of wages? Define inflation as a persistent rise in prices. How did Jackson’s bank policies create an inflationary spiral in the western states? When the state banks called loans to pay depositors, what happened to the supply of money? If there is too little money for purchasing goods, what happens to prices and wages? Divide students into pairs. One partner will be the knowledgeable member of the banking establishment. One partner will be the savvy consumer inquiring about the following:
• competition in bank services • online banking • electronic transfers • coin and currency • credit (bank loans) • credit cards • checks
Students should come up with a list of questions for each other. Allow students to use sources, such as the Internet, to complete their list of questions. Students should ask each other these questions and record the details of their conversation. Activity 3: Exploring Financial Markets (GLE: 23) Ask students to list the stock markets in the United States. Ask them to explain if stock is traded on small local markets. Have students explain why demand for shares and the supply of shares offered for sale establish the market price. Ask students to follow the Dow Jones average for a few days to determine the answer to the following question:
• What does it tell us about the value of corporate stock? [If you have your class playing the Stock Market Game, they will learn how to use this information as they play.]
Ask students to review the founding of Jamestown colony by a joint-stock company. Ask students to discuss the following:
• Why people invested (purchased stock) in the Jamestown adventure? • Why did the company spread risk among several investors?
Discuss money as something accepted as a medium of exchange and have students note that banks began as a place to deposit money for safekeeping. Deposits could be claimed on demand. Banks loaned demand deposits to individuals needing money to purchase products or to invest—a fee was charged called interest.

Free Enterprise Unit 5 Money, Banking, and the Federal Reserve 31
Ask students to explain how, considering the large number of corporations (joint-stock companies) today, investors know when and at what price shares are available?
Have students examine markets for currencies (see foreign exchange rates in a national paper) handled by banks and articulate a “90-second report” on the World Markets. Activity 4: Financial Institutions and Savings (GLE: 24) Ask students to recall, with guided reading, what happened during the run on banks that precipitated the Great Depression.
• Why did the banks have to close when they ran out of money to pay out demand deposits?
• Did they fail to have adequate money in reserve? • Did they have too much money on loan?
Ask students to explain differences between demand and savings deposits.
Ask students to research and articulate what Savings and Loan institutions do. Guiding Questions:
• Why is it important to have consumer savings available to be loaned to other consumers?
• How does this process maintain an adequate supply of money? • How does it improve demand for goods/services? • How does the process stimulate production?
Have students explain why corporations and businesses borrow money. Have students explain why proprietorships and partnerships borrow money from lenders (banks) while corporations are more likely to issue and sell stock (shares) to finance expansion through stock markets. Have students explain why investors purchase stock. Activity 5: Other Financial Institutions (GLE: 24)
Like all commodities and goods, there is a market for buying and selling shares in corporations.
Demand deposits mean that the customer can write a check demanding use of any or all monies in that account. Banks keep reserves of money to meet customer demand for their money. Savings deposits are considered long-term deposits. That is you have to give notice of your intention to withdraw funds (this is changing today). Banks can more safely loan these funds (keep less funds in reserve) to earn interest thus they pay a small rate of interest to the depositor.
Free Enterprise Unit 5 Money, Banking, and the Federal Reserve 32
Invite an insurance broker or agent to visit class and explain services they offer consumers and investors. Have students prepare written questions in advance. Ask students to make comparisons between new financial institutions (credit, savings, and investment institutions) and traditional banks through a chart or Venn diagram. Have every student assume that they have a sum of money (determined by the class) for which they have to make a decision between financial institutions. Have the students articulate what their decision would be at this time and why in a statement of intent and rationale. Activity 6: Analyzing Business Cycles (GLEs: 25, 65) Review historical events that produced the Great Depression in 1929. Discuss the following:
• Why did the supply of money (credit) continue to grow? • Why did stock prices rapidly escalate and what was the role of banks in that
escalation? • Why did the stock market crash (rapidly falling prices)? • Why were banks forced to close their doors? • What happened to bank deposits? • What happened to the supply of money after 1929?
Have students define recession and depression. Have students explain how a depression can happen. Ask students to construct graphic models of a business cycle using economic terms appropriately: inflation, boom, prosperity, high employment, deflation, recession, bust, and high unemployment. Ask each student to explain stages in the business cycle model. The failure of banks in 1929 caused many depositors to lose their money. People became skeptical of bank safety. Ask students to research the origin and purpose of the Federal Deposit Insurance Corporation (FDIC) created under the New Deal. The law was established that the government insures (guarantees) all demand deposits up to $100,000 in any one bank. Ask students to explain how an individual could insure more than $100,000. Should these limits be changed? Articulate a rationale for why or why not. Activity 7: Judging the Impact of Interest Rates (GLE: 53) Create a simulated company and ask students what happens if interest rates rise:
• Will the company be more or less likely to borrow? • Will the company be more or less likely to increase the price of their product? • Will the economy be more or less likely to expand or contract? • How will consumption of the product be altered?

Free Enterprise Unit 5 Money, Banking, and the Federal Reserve 33
Ask students to answer the same questions if interest declines. Define interest and capital with the class.
Ask students what types of goods are too large to buy outright with the average income (e.g., houses, cars, and boats)? Ask them what consumers do in order to purchase such large items (e.g., borrow from a financial institution such as a bank or savings and loan). Simulate a case study of a family borrowing $100,000 at prevailing interest rates and compute monthly payments and the cost of the loan over 15 and 30 years. Students can compute these elements using the Internet. Ask students to compute and describe the impact of increases and decreases in the interest rate. Have students articulate how increased interest rates influence the family’s desire to purchase other goods/services. Activity 8: The Federal Reserve System (GLE: 63) Return to previous discussions of Andrew Jackson’s war on the National Bank. Jackson deposited the national treasury in state banks without banking controls, thus banks were able to make loans without adequate reserves. The result was a rapid increase in the supply of money, inflated prices, and expansion of individual debt. Lacking adequate reserves, banks were unable to pay and depositors demanded their money. Debtors defaulted as loans were recalled and deflated prices followed. Provide the class with a graphic display of business cycles in American history. Ask students to identify and describe the causes for booms and panics. Have students note the following: The Federal Reserve System (FRS) was created in 1913 to provide stability in banking practices (e.g., require members to hold fractional reserves, serve as the banker’s bank by providing loans at discounted rates). After the Great Depression, the New Deal increased the powers of the FRS. Federal Reserve Banks provide free copies detailing their history, influence on the supply of money, discount rates, open market operations, and the history of money. Lead a discussion on what happens to the supply of money if banks must hold specific reserves for each dollar in deposits. Ask students to consider how bank loans are held in check with high reserve requirements (50%) and how bank loans expand with low reserve requirements (10%.) The FRS sets the reserve requirements for all member banks. Illustrate this with chalkboard models. Define fractional reserves together. Lead a discussion on what happens when banks do not have adequate reserves, they must borrow to replace the reserves. FRS banks (12 districts) loan funds to member banks to cover reserves at an established interest rate (discount rate). Define discount rate together. Provide a series of simulated situations:
American businesses combine factors of production in making a good/service. The productivity of capital goods is rewarded by the payment of interest. If a business procures a bank loan to purchase capital, the loan becomes a cost (factor) in making a good. The level of the interest rate (cost of capital) influences the price of the good in the marketplace.
Free Enterprise Unit 5 Money, Banking, and the Federal Reserve 34
Situation A FRB rate=4% Bank Loan Market rate=8% Situation B FRB rate=8% Bank Loan Market rate=8% Situation C FRB rate=6% Bank Loan Market rate=7%
Ask students to explain what the bank will do in each situation (e.g., borrow reserves and continue to make loans, maintain reserves and reduce loan amounts, maintain loans but loan only to the very best customers). Explain how banks make loans (e.g., best customers get lowest (prime) rate, high-risk borrowers pay high interest rates). Is this a fair practice? What does credit rating mean? Why is a good credit rating worth money to a consumer? Lead a discussion on how the FRS is also the country’s banker. The federal government receives tax and fee income and expends monies to pay bills. When the federal government borrows money to pay its bills, the government issues treasury bills (borrows) that it sells at a discount to the FRB, banks, businesses and/or individuals. Explain what happens if the FRS controls the purchase of all treasury bills (i.e., only FRS banks can purchase the treasury bills). Is the money supply expanded? Illustrate this using the Circular Flow model. Define open market operations together. Lead a discussion about what happens if individuals and banks are permitted to purchase treasury bills (i.e., they withdraw deposits to buy government paper reducing the supply of money). Ask students to explain conditions that would encourage the FRS to increase the supply of money (e.g., inadequate demand (not enough money to purchase goods/services) and when they would act to reduce the supply of money). Reviewing the previous activity, ask students to explain the difference between the discount rate the FRS charges banks to borrow and the prime rate banks charge their best customers. Activity 9: Analyzing Regulatory Processes and Utilities (GLE: 64) Review inelastic demand for basic needs such as water and electricity. Identify agencies that regulate such public utilities in Louisiana and in your parish. Why is it important to control prices when a necessity is controlled by a monopoly or near monopoly? Invite a public utility representative (they normally have public information officers) to appear in class. Students ask questions about monopolies, inelastic demand, profits, and prices. Invite someone from a regulatory agency to explain how that agency determines prices of the good when competition among suppliers is absent. Ask students to research several federal regulatory agencies—include the EPA, FCC, ICC, SEC. Have students report their findings to the class:
• Why was the agency created? • How does the agency protect businesses and/or consumers? • Does the work of the agency enhance or weaken the circular flow? • Does the work of the agency provide equity in the economy?
Activity 10: Investigating Regulatory Costs (GLE: 64)
Free Enterprise Unit 5 Money, Banking, and the Federal Reserve 35
Ask students to explain the impact of an EPA regulation requiring all coal-fired electric plants to place expensive scrubbers on smokestacks to clean the air. What happens to the cost of producing electricity at that plant? Have students explain what the company can do, if a state commission, to recover costs, controls the price of electricity. Have students explain how consumers are impacted by this action. Have students articulate a position statement and rationale on this topic: “Is reducing pollution at old coal-fired plants a good thing?”
Sample Assessments General Guidelines
• Use a variety of performance assessments to determine student understanding of content.
• Select assessments that are consistent with the types of products that result from the student activities.
• Develop a scoring rubric collaboratively with other teachers or students. General Assessments
• Students should complete journal entries throughout the unit in which they relate the topics discussed to their own personal experiences. These journals may also be reflections of what they learned by the end of the period. For instance, students might answer, “What I learned,” “What I would like to know more about,” and “What I don’t understand” after a concept has been taught in order to better evaluate student understanding.
• Students should work in pairs to teach a particular concept from the unit to the class. The group should be knowledgeable on their assigned topic. They should provide visuals to aid their classmates in learning, and they should make a short quiz for the class to take on that particular topic.
• Students should contact one of the financial institutions discussed in class by email, telephone, or regular mail. Students should request information from one of these institutions then present their findings to the class.
Activity-Specific Assessments

Free Enterprise Unit 5 Money, Banking, and the Federal Reserve 36
• Activity 4: Have students complete a report in which they research a particular stock and decide whether or not they would invest in it. Have them articulate what they feel the risks and the potential profits might be. In this report, students should state what percentage of their available investment dollars would be invested and what percentage they would hold back for another source. Have them articulate why they would invest as such.
Risks of stock listed, explained, and analyzed
50%
Reasons for choosing this particular stock 15%
Percentage of available investment dollars invested
15%
Explanation and analysis of other use of investment dollars
20%
• Activity 7: Simulate a case study family borrowing $100,000 at prevailing interest rates and compute monthly payments and the cost of the loan over 15 and 30 years. Ask students to compute and describe the impact of increases and decreases in the interest rate. Have students articulate how increased interest rates influence the families desire to purchase other goods/services.
• Activity 8: Working in pairs or small groups, students should create their own
graphics or cartoon to show how the Federal Reserve can affect the money supply in the economy. Students should also show in this graphic what happens to interest rates when money supply expands or contracts. Students should explain their graphics to the class.

Free Enterprise Unit 6 Measuring the Economy 37
Unit 6: Measuring the Economy
Time Frame: Approximately one week Unit Description This unit is a study of how economic measurement tools are used to interpret and explain the condition of the U.S. and international economy. Student Understandings Students will understand that economic indicators are used to measure the well being of an economy. Students will learn to use economic indicators in charts, tables, or graphs to compare different economies, interpret income distributions, and explain economic concepts such as inflation and deflation. Guiding Questions
1. Can students identify the purpose and importance of economic indicators and how they provide information on different types of economies?
2. Can students define inflation and deflation? 3. Can students interpret economic information from charts and graphs?
Unit 6 Grade-Level Expectations (GLEs) GLE # GLE Text and Benchmarks The Economy as a Whole 47. Explain the meaning or use of various economic indicators and their
implications as measures of economic well-being (E-1C-H1) 49. Interpret various economic indicators used in a chart, table, or news article
(E-1C-H1) 50. Draw conclusions about two different economies based on given economic
indicators (E-1C-H1) 51. Explain how inflation and deflation are reflected in the Consumer Price Index
(E-1C-H2) 61. Interpret a chart or graph displaying various income distributions (e.g., in the
United States vs. the Third World, various groups within a country) (E-1C-H3)

Free Enterprise Unit 6 Measuring the Economy 38
Sample Activities Activity 1: Measuring Economic Performance (GLEs: 47, 49, 50) Provide articles published in the local newspaper or newsmagazines that report on the health of the American or world economy. Have students read the articles to detect political bias. Guide discussion of the materials by asking students to identify and explain evidence of economic performance in the articles. How appropriate are the measurements (e.g., workers claim wages are falling behind prices)? Are some measurements of the economy better than other measurements? What would you want to know if you had responsibility for assessing the health and performance of the economy? Ask students to create a list of important indicators of economic health from student comments. Introduce Gross National Product (GNP) as a total of all goods/services exchanged at market prices in one year—this also includes government purchases of goods/services. Ask students to explain how GNP can be used as a measure of economic performance. Could we compare this year to last year? What if prices were inflated or deflated between years? Introduce the concept of a constant dollar—dollar values adjusted for inflation or deflation. If GNP is measured in constant dollars, could we use it to measure growth or retraction of the economy? Introduce Gross National Income (GNI) as a measure of consumer incomes for the year. Ask students to consider how GNI can be used as a measure of economic performance. Would we need to adjust the GNI for inflation or deflation? One way to change the emphasis of the measurement is to divide GNP and/or GNI by the population (e.g., GNP per capita). Ask students to describe how individuals might gain a measure of their personal well being from this measure. Ask students to cut out articles from the Wall Street Journal (or other papers) that include GNP, GNI, Consumer Price Index (CPI) or other measures of the economy. Ask them to include tables and graphs that illustrate economic performance. Ask students to explain how the performance measure(s) are being used. Select clippings from the collection and ask students to interpret the information. Per capita measures are the easiest way to compare two or more economies. Ask students to locate economic data on 3-4 countries in the World Almanac (e.g., GNP per capita, GNI per capita). Are constant dollars important? Ask them to construct comparative charts and interpret the data. Provide GNP per capita data and a world political map. Ask students to record the data for several countries on the map and draw conclusions about the location of the best and worst performing economies. In India and Africa people often build their own homes. Would the value of their homes be included in GNP or GNI? Why? Activity 2: Gross Domestic Product v. Gross National Product (GLE: 47) Ask students to explain what they believe is the difference between Gross Domestic Product (GDP) and Gross National Product (GNP). Explain to students that Gross Domestic Product includes only those goods and services produced within the nation. Even though a plant

Free Enterprise Unit 6 Measuring the Economy 39
outside the U.S. is still an American plant, it is not considered part of the GDP because GDP includes only things made within the country. Ask students why intermediate products are not included in the GDP (e.g., windshield wipers on a new car sold is not counted in the GDP, but replacement wipers are counted). Have students give examples of other intermediate products. Explain to students that secondhand products are also not counted in GDP. Explain to students that GNP does include American plants in other countries, but does not include foreign plants in our country. (GDP does include foreign plants in our country) Ask students to explain what they believe is the better measure of economic well being in our country (GDP or GNP) and give an explanation why they believe this is so. Activity 3: Computing Inflation/Deflation Indices (GLE: 51) Ask the class why the Consumer Price Index (CPI) is used to determine how much Social Security payments should be increased from year to year. Challenge the class to construct a market basket that can be used to measure price levels from year to year. Divide the class into teams, with each trying to solve the problem. Ask each team to think about and try to answer the following questions:
• What do we need to know about the price of products? • What products should be put into the measure (e.g., luxury boats versus basic
cars)? • What happens when a new product is introduced or a product no longer exists? • Where will we get the pricing information?
Ask students to define CPI in their own words. Explain the problem in creating a market basket for the average American (e.g., how much insurance, medical expenses, food, electronics, etc., do you put into the basket?). How much does each item in the basket cost the average consumer? After students work at the task for a while, use direct instruction to explain how the CPI is computed. The government establishes a base year and places a value of 100 on the market basket. The next year they determine the price of the market basket as more than 100 (inflation in prices) or less than 100 (deflation in prices). Give students the total cost of the market basket for three different years. Have students figure out the inflation or deflation in prices in that three-year period. Allow students to practice figuring inflation and deflation by giving them different market basket prices for three-year periods. Next, discuss with students what are some of the causes of inflation and deflation. Ask students to explain how the CPI might be used by:
• Government to determine increases in Social Security checks • Labor to determine reasonable requests for wage increases • Federal Reserve Board to decide to increase or decrease the supply of money

Free Enterprise Unit 6 Measuring the Economy 40
Activity 4: Interpreting Income Data (GLEs: 49, 61) Allow students to use the Internet or other reference sources to obtain information on the average income of the United States in a specified year. Next have students, in small groups or pairs, collect similar data from African or South Asian countries. The students should then construct charts and/or graphs comparing that data with United States data. With this information, students should write summary statements on what these numbers state about the economic well-being of the countries. Next, provide population pyramids for each of the countries selected. Ask students to compare the age distribution of each of the countries with its income data and interpret their findings.
Sample Assessments General Guidelines
• Use a variety of performance assessments to determine student understanding of content.
• Select assessments that are consistent with the types of products that result from the student activities and develop a scoring rubric collaboratively with other teachers or students.
General Assessments
• Students should predict what country is represented when given different GDP figures. Give students a list of GDPs of several different countries. With that information give students a list of the different countries from which they will match the GDP with the country. Students should provide written explanations in their journals of why they matched certain GDPs with particular countries.
• Students should interview family members and create a list of products that might have been included in a market basket 30 years ago that would probably not be included in a market basket today. Students should write explanations for their choice of products.
• Students should find conflicting reports on the health of the American economy. They should write an explanation of why they believe these reports are conflicting (e.g., political bias) and provide evidence to support their thoughts.
Summary of how the reports/articles portray the health of the American economy
35%
Analysis of why the reports/articles are conflicting
45%
Reports or articles of American economy are attached to student analysis
20%

Free Enterprise Unit 6 Measuring the Economy 41
Activity-Specific Assessments
• Activity 1: Ask students to locate economic data on 3-4 countries in the World Almanac (e.g., GNP per capita, GNI per capita). Are constant dollars important? Ask them to construct comparative charts and interpret the data. Provide GNP per capita data and a world political map. Ask students to record the data for several countries on the map and draw conclusions about the location of the best and worst performing economies. In India and Africa people often build their own homes. Would the value of their homes be included in GNP or GNI? Why?
• Activity 3: After constructing their own market baskets, have students provide a
written explanation of why they chose those particular items. Then have students compare the lists they created with the actual list of products from the market basket. Students should record the products that they listed that are not listed on the actual market basket.
• Activity 4: Students should compile data on average incomes for different regions in
the world. With that information, students should construct a thematic map on average world incomes. After students complete this activity, students should create a computer generated bar graph. (They may use such programs as Excel to create such graphs.)
Free Enterprise Unit 7 Inflation and Unemployment 42
Free Enterprise Unit 7: Inflation and Unemployment
Time Frame: Approximately one week Unit Description This unit is a study of the impact of inflation and employment in a market economy. Student Understandings Students understand that inflation impacts the well-being of economies and influences economic decisions. Students understand the reasons for unemployment and “underemployment” in a market economy and its relationship to business cycles. Students learn that the rate of unemployment varies regionally and demographically. Guiding Questions
1. Can students explain the effect and importance of inflation and deflation on economic decisions of individuals, nations and the world?
2. Can students define the role of unemployment and underemployment in the economy?
Unit 7 Grade-Level Expectations (GLEs) GLE # GLE Text and Benchmarks The Economy as a Whole 47.
Explain the meaning and use of various economic indicators and their implications as measures of economic well-being. (E-1C-H1)
52. Explain the impact of inflation/deflation on individuals, nations, and the world, including its impact on economic decisions. (E-1C-H2)
56. Explain various causes and consequences of unemployment in a market economy (E-1C-H3)
57. Analyze regional, national, or demographic differences in rates of unemployment (E-1C-H3)
58. Analyze the relationship between the business cycle and employment (E-1C-H3)
59. Explain the meaning of “underemployment” and analyze its causes and consequences (E-1C-H3)

Free Enterprise Unit 7 Inflation and Unemployment 43
Sample Activities Activity 1: The Problems of Inflation/Deflation (GLE: 52) Review the American business cycle of the 1920’s and 1930’s. Provide historical descriptions of the Great Depression and ask students to explain how the following elements contributed to prosperity in the 1920’s and depression in the 1930’s:
• The farm depression following WWI • The boom in business activity • The euphoria of full employment and good markets • Rising stock prices (e.g., buying on margin) • A growing money supply and individual debt • Problems in the world economy
Ask students to describe what happened when investors decided that stocks had risen beyond their value. What was the impact on borrowers? What are and why do runs on banks occur? Ask students to explain the spiraling downward of prices, supply of money, foreclosures on debt, employment of factors of production, and product flows. Ask individual students to explain in writing what was happening to prices, production, employment, consumption, and the money supply during this time period by using the Circular Flow diagram. Next, ask students to explain how inflation impacts the following:
• Individuals (pay higher prices for goods, lowers cost of debt repayment, incomes lag behind prices reducing consumption)
• Businesses (pay higher prices for factors, may cover inefficiencies in production as the product is priced higher, inventories increase as goods may not be sold)
• Countries (debtor nations have an easier time paying off debts, creditor nations suffer as money loses value)
Replay the same exercise with deflation. Activity 2: Analyzing Inflation (GLE: 52) Return to the Circular Flow chart. Ask students to look at the upper left quadrant and imagine that consumers have excess money (incomes) to spend while there is no appreciable increase in available goods/services. What will consumers do to acquire goods? Does demand exceed supply? Why will prices increase? Ask students to look at the lower right quadrant and imagine that producers need to increase production, but the factors of production are fully employed. What will happen to wages if producers expand? What will an increase in wages do to the cost of goods/services? Why will the price of products increase?

Free Enterprise Unit 7 Inflation and Unemployment 44
As a class, define cost-push as a cause for inflation. As a class, define demand-pull as a cause for inflation. Ask students, in small groups, to explain the effects of inflation in the following brief scenarios:
• A producer’s costs are so high that profits are squeezed by more efficient competitors.
• A consumer lives on a fixed income. • A consumer holds a 30-year mortgage on his/her home. • A banker has made low-interest-rate loans on home mortgages.
Ask students to generate other scenarios individually, providing more detail, and explain inflation. Activity 3: Unemployment (GLEs: 56, 57, 58, 59) Ask students to explain the cause of unemployed factors of production in the following situation: Automated switchboards are introduced in the 1950s. Telephone companies purchase large quantities of new switchboards creating production by companies making automated switchboards. Companies producing regular switchboards experience little demand for their product. Using the Internet and/or reference materials, ask students to collect current U.S. unemployment data for different regions, for different racial groups, and for different age groups. Ask them to construct graphical displays of the data illustrating region, race, and age differences. Ask the class to interpret the data and explain: Why do some groups have higher rates of unemployment? Why are there regional differences in unemployment? Write an analysis as a group of why and how business cycles influence rates of employment. Ask students to define underemployment and add to this example their own:
• Corporations in 2001 had to release skilled and knowledgeable middle managers to achieve profitability. With demand for middle managers low, these individuals accepted jobs requiring less skill and knowledge.
Ask students to explain what is happening when
• Older people are working at fast food restaurants • Highly educated citizens drive taxis
Activity 4: (GLEs: 47, 56, 58) Explain to students that there are different types of unemployment and that not all unemployment is necessarily negative. First, ask students to give their own reasons why people might be employed. Next, point out to students that a person is only considered unemployed if he/she works less than one hour a week. Go through with students the different types of unemployment—frictional, structural, cyclical, seasonal, and technological.

Free Enterprise Unit 7 Inflation and Unemployment 45
Frictional unemployment is caused by workers between jobs. Is this type of unemployment always bad? When could this type of unemployment be seen as a positive? Structural unemployment occurs when consumers no longer demand a product; those who make that product are no longer employed (e.g., typewriter producers). How might the causes of structural unemployment mean something positive for the economy? (Country might be becoming more technologically advanced.) Cyclical unemployment is unemployment caused by changes in the business cycle. (People are less likely to buy luxury items in times of a recession; industries that produce those items may lay off workers). Seasonal unemployment is unemployment caused by changes in the season. For example, one who owns a Christmas store will need more workers in the holiday season than in the off-season. Technological unemployment is caused when workers are replaced by automation. Have students give examples of each type of unemployment. Have students work in pairs to explain how each type of unemployment may indicate other positive occurrences in society at that time period. Explain to students why a society that is improving technologically could never have 0% unemployment. Students should also explain how a low unemployment, however, indicates economic well-being. Have students find news articles of how politicians might quote unemployment figures to gain an advantage in an election. (Students may use older news magazines if necessary.)
Sample Assessments
General Guidelines
• Use a variety of performance assessments to determine student understanding of content.
• Select assessments that are consistent with the types of products that result from the student activities.
• Develop a scoring rubric collaboratively with other teachers or students.

Free Enterprise Unit 7 Inflation and Unemployment 46
General Assessments
• Students should create a graph of stock prices from 1920-35. If available, students should use a computer program such as Excel to create the graph. If computers are not available, have students create their own graphs.
• Students should find articles in a newspaper or news magazine that discuss unemployment of a particular group of people, or of a group of people formerly employed in the same industry. Students should classify what type of unemployment is being discussed. Students should also analyze the causes of unemployment for this group.
• Students should write a journal entry on how inflation could possibly affect their families. Students should consider paying higher prices for goods, lagging incomes, and reducing consumption. Students should also answer in these entries how inflation could directly affect their lives.
Activity-Specific Assessments
• Activity 2: Ask students, in small groups, to write a rationale to explain the effects of inflation in the following brief scenarios:
a. A producer’s costs are so high that profits are squeezed by more efficient competitors.
b. A consumer lives on a fixed income. c. A consumer holds a 30-year mortgage on his/her home. d. A banker has made low-interest-rate loans on home mortgages.
Students should create at least 5 more scenarios and explain the effects of inflation in the new scenarios created. Students should present their new scenarios to the class.
• Activity 3: Have students write a definition of underemployment. In groups, students should create scenarios when underemployment might occur. The following is an example of the type of scenarios students should write:
Corporations in 2001 had to release skilled and knowledgeable middle managers to achieve profitability. With demand for middle managers low, these individuals accepted jobs requiring less skill and knowledge.
Rationale for each of the teacher-generated scenarios is accurate and complete
35%
Five new scenarios created in which the effects of inflation are analyzed
35%
New scenarios are clearly articulated to the class
30%
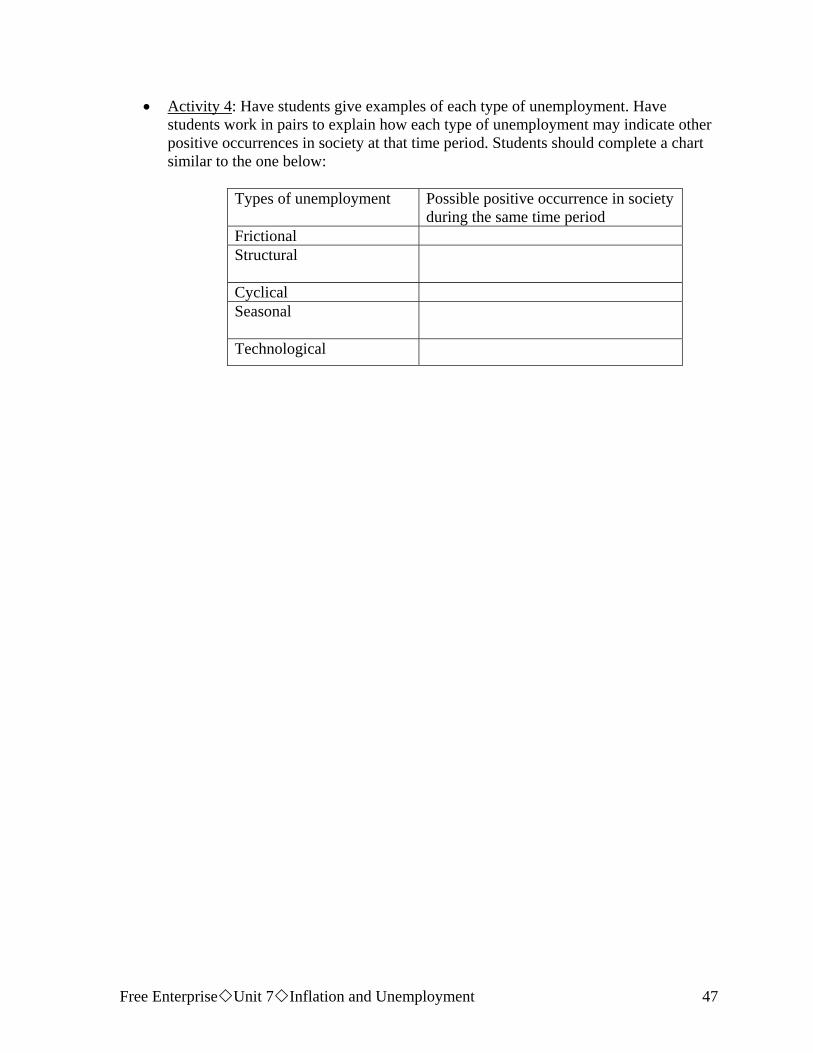
Free Enterprise Unit 7 Inflation and Unemployment 47
• Activity 4: Have students give examples of each type of unemployment. Have students work in pairs to explain how each type of unemployment may indicate other positive occurrences in society at that time period. Students should complete a chart similar to the one below:
Types of unemployment Possible positive occurrence in society
during the same time period Frictional Structural
Cyclical Seasonal
Technological

Free Enterprise Unit 8 Government Policy and Taxation 48
Free Enterprise Unit 8: Government Policy and Taxation
Time Frame: Approximately two weeks Unit Description This unit focuses on the role of government in a market economy in establishing fiscal and taxation policy. Student Understandings Students understand that government impacts an economic system as producer, employer, and consumer. Students understand that government establishes economic policies for the purpose of regulating economic behavior. Students learn that government is financed through various forms of taxation. Students learn how tax policy affects the U.S. economy. Guiding Questions
1. Can students identify the purpose and importance of different types of taxes and how they impact individuals and businesses?
2. Can students explain how and why government intervention has an effect on the economy?
3. Can students explain how federal spending and taxation are related to budget deficits, national debt and surpluses?
4. Can students distinguish between fiscal and monetary policy and explain the role of government policy on the economy?
Unit 8 Grade-Level Expectations (GLEs) GLE # GLE Text and Benchmarks Economics: Fundamental Economic Concepts 18. Explain the role of government as producer, employer, and consumer in
economic systems (E-1A-H6) Individuals, Households, Businesses, and Governments 33. Identify various forms of taxation (E-1B-H3) 34. Describe the impact of given forms of taxation (E-1B-H3) 35. Analyze the effects of governmental action or intervention in a market
economy (E-1B-H3) 36. Describe major revenue and expenditure categories and their respective
proportions of local, state, and federal budgets (E-1B-H3)

Free Enterprise Unit 8 Government Policy and Taxation 49
GLE # GLE Text and Benchmarks 37. Predict how changes in federal spending and taxation would affect budget
deficits and surpluses and the national debt (E-1B-H3) 38. Evaluate the impact of policies related to the use of resources (e.g., water use
regulations, policies on scarce natural resources) (E-1B-H3) The Economy as a Whole 60. Explain factors contributing to unequal distribution of income in a market
economy (E-1C-H3) 62. Distinguish monetary policy from fiscal policy (E-1C-H4)
Sample Activities Activity 1: Introducing Government in the Economy (GLE: 18) Inform the class that it is time to consider the role government plays in the Circular Flow of Goods and Services. Begin by asking students how governments obtain income (taxes, fees, borrowing). Using the Circular Flow, ask students to trace the impact government (local, state, and federal) taxes and fees would have on the flow of money, goods, levels of consumption and production, and incomes. Ask students to suggest ways in which government is a producer and an employer (e.g., schools and teachers). Then ask how government is a consumer (e.g., purchases military equipment). Ask students to explain how government taxes impact the flow of money and goods. How does government—as consumer, employer, and producer—impact the flow of money and goods in the economy? Explain withholding taxes to the class (e.g., Social Security, Medicare, and income taxes). Ask students to discuss the following:
• How does this tax impact consumer income? • How does this tax and its collection impact producer costs?
Case Study: In the 1950s the federal government purchased large amounts of farm products
at market prices and stored the goods in storage facilities. Ask students to determine how this government spending impacts producers (farmers). How would it impact consumers? What happens to the price of farm products? Ask students to generate another example of government intervention and how it affects the economy.
Activity 2: Government Tax Credits and Economic Flows (GLE: 33) Rather than taxing and/or spending, suppose that government gives a tax credit to an industry. For example, Congress passed a law that gives tax exemptions to investor partnerships who agree to build and operate low cost housing units for a period of ten years. How would the tax credit influence the supply of housing in a community? What would be

Free Enterprise Unit 8 Government Policy and Taxation 50
the impact on the cost of housing in the community? How would this activity impact private citizens offering housing for rent? Consider a proposed tax cut for a particular group—exemptions to teachers with ten or more years of continuous service. What would the impact be on teachers? On the community? On education? What would be an argument against this proposed tax credit for teachers and why? Activity 3: Analyzing Government Tax Impacts and Government Intervention in the Economy (GLEs: 34, 35, 36) Ask students to create a list of all the taxes their family pays and post the list on the board. Add taxes that are often hidden or disguised (e.g., license fees, soft drink taxes). Given the Circular Flow, ask students to explain the impact of each of those taxes on consumers and producers: (Teachers may add more examples.)
• Real estate taxes—reduces expendable consumer income by the amount of the tax; adds to cost of production as taxes are paid on capital (e.g., buildings).
• Sales tax—increases the price of products to the consumer; has less impact on the production process.
• Consumption taxes on cigarettes and liquor (sin tax)—tax on an inelastic demand produces a lot of government revenue while reducing consumption of an undesirable product; severely reduces the sales and production levels of producers.
As a class, reach a consensus to define taxation inductively as a transfer of money from individual incomes to government—or a transfer in purchasing power. Taxes transfer purchasing power to government to provide schools (local), roads (state), and a military (national). Government may also intervene in the economy to correct perceived problems. Ask students to analyze the following governmental actions and predict their effect on the economy (add other examples):
• Government agrees to maintain the price of milk and butter by buying surplus supplies of dairy products.
• Government creates public works projects to employ laborers who have been unemployed.
Assign student teams to research the annual budgets of the parish, Louisiana, and federal governments. Ask them to create circle graphs illustrating the major categories of expenditures and revenues for each level of government (e.g., show raw numbers and percentages). When comparing expenditures and revenues, ask students to explain debt and service on debt:

Free Enterprise Unit 8 Government Policy and Taxation 51
• Do governments operate a balanced budget? • Is governmental borrowing (i.e., borrowing purchasing power now for repayment
in the future) a good thing? • When is a deficit a problem?
Activity 4: Analyzing Federal Budgeting, Responsibilities and the Economy (GLEs: 37, 38) Using data produced in the previous activity, ask students to explain the impact on the economy if the government balanced budgets and avoided deficits or surpluses. Provide students with a 50-year history of national debt in the United States. Ask them to respond to the following questions:
• When do we seem to incur debt (run deficits) and when do we pay the debt down (run surpluses)?
• What would be the impact of a tax increase to pay down the national debt? • What would be the impact if government cut expenditures to pay down the
national debt? • If the country had high levels of unemployment, how would paying down the
national debt create more problems? • What if the country had low levels of unemployment?
Ask students to use the Circular Flow as they prepare their responses.
Government is obligated to provide for the general welfare of its citizens. Sometimes that means ignoring economic impacts of a governmental policy to protect the public health. For example, the government promises protection against polluted water and air. Regulatory agencies set standards for businesses using and returning water to streams used for public water. Ask students to analyze the economic impact in each of the following situations:
• Imagine that a business is polluting a stream. How will government fines levied against the business impact costs of production, employment, and prices?
• If the business voluntarily cleans up its water discharge, what will be the impact on production, employment, and prices?
Ask students to challenge or defend the following statement: The best argument for government regulations of natural resource use is that the private cost to businesses should be equal to or less than the social benefits to the public. Activity 5: Assessing Problems of Income Inequality and Savings, Investment, and Incomes (GLE: 60) Discuss with students the following terms: progressive taxes, proportional/flat taxes, regressive taxes.

Free Enterprise Unit 8 Government Policy and Taxation 52
Ask students to debate the merits of income inequality. • Are NBA stars overpaid? • How do people who save and earn from investments benefit others? • Should consumers who have wealth gain more because they invest more in the
economy? How do income taxes (progressive tax) serve to reduce income inequality?
• Is an income tax fair? • How are sales taxes regressive taxes? (Lower income people pay a higher
percentage of taxes on sales taxes than those who make a higher income.) • Given the above facts on sales taxes, explain whether or not they are fair taxes.
Consumers have a choice with regard to spending and saving their income. Those consumers who save and invest portions of their income earn more shares (income) in the economy. Provide a graphic of average incomes of Americans for discussion of:
• Savings and investment in the economy • Consumption • Productive capacity
Ask students to explain how disparity of income impacts the economy. Then ask students to consider how government can and does reduce income disparity (e.g., progressive income taxes, capital gains tax). Ask students to debate the following: What if the government did not transfer (social welfare) income from the highest income groups to the lowest income groups? Why do some people say that the rich get richer? Ask students to make one suggestion for income tax reform that they could defend. Activity 6: Our Progressive Income Taxes (GLE: 33)
Explain to students that we pay progressive income taxes in the United States. The more money one makes, the greater percentage he/she pays in income taxes. Some argue that a flat/proportional tax would be a better tax because everyone would be taxed the same percentage. People would still pay different amounts in taxes, but the percentage would be
From the Circular Flow chart, students know that consumers (all people are consumers) earn their incomes by selling their ownership (factors of production) to producers. (Example: One of the factors of production that consumers sell is their labor, including their skills, knowledge, talent, and abilities.) Individual consumers own different amounts of these productive factors. Individual laborers possess different skill levels, producing different incomes—e.g., skilled NBA player. In a capitalist economy, individuals earn an income equal to their contributions to the production process and unequal incomes are the result.

Free Enterprise Unit 8 Government Policy and Taxation 53
the same. For example, a 10% flat tax would require one who makes $20,000 a year to pay $2,000 a year, while someone who made $200,000 a year would pay $20,000 in taxes. Provide students with information on tax brackets so they may see the percentage of income taxes people pay with varying incomes. Provide students with 1040EZ forms and sample W-2s. Instruct the students to complete the 1040EZ forms following the instructions provided. Allow students to use the tax tables so they may see the progressive nature of taxes paid. Activity 7: Monetary and Fiscal Policy (GLE: 62) Revisit the Circular Flow of Goods and Services and ask students to explain demand- and supply-side economics. If we were experiencing demand-pull inflation, the Federal Reserve Board (FRB) might reduce the money supply (ask students to explain) by raising the discount rate and/or selling Treasury Notes to individuals. If we were experiencing deflated prices, the FRB could increase the money supply (ask students to explain) by reducing the discount rate and purchasing Treasury Notes. Define monetary policy collectively. Define fiscal policy collectively. Ask students to explain
• government revenues exceed expenditures = government surplus • government expenditures exceed revenues = government deficit
Review: Whenever the economy is experiencing full employment, the government can
increase taxes and/or reduce spending to avoid inflation. Whenever the economy is experiencing unemployment, the government can decrease taxes and/or increase spending to avoid deflation. Using the Circular Flow, ask students to explain how actions would alter economic flows (e.g., supply of goods available to consumers). Ask students to explain what monetary and fiscal policies are in place at the present date, using the Circular Flow.
When Franklin D. Roosevelt was elected president in 1932, the country was in the throes of a depression (e.g., deflated prices, bankruptcies, inadequate demand, little incentive for investment, and low incomes). Provide readings describing New Deal policies Roosevelt enacted to stimulate the economy. (Add to the below list.) Ask students to analyze each program and explain how it would impact the economy:
• Agricultural Adjustment Act • Works Progress Administration • Civilian Conservation Corps • National Industrial Recovery Act • Emergency Relief Act • Emergency Banking Act
Why did Roosevelt repeatedly say, “We have nothing to fear but fear itself”? Complete recovery from the Depression did not occur until World War II began. Why would preparations for war stimulate an economy? Some people argue that Roosevelt interfered too

Free Enterprise Unit 8 Government Policy and Taxation 54
much in the economy and spent too much government money. Others argue that Roosevelt failed to spend enough money to get the economy moving. Ask students to debate informally the success and/or failure of New Deal policies.
Sample Assessments
General Guidelines
• Use a variety of performance assessments to determine student understanding of content.
• Select assessments that are consistent with the types of products that result from the student activities.
• Develop a scoring rubric collaboratively with other teachers or students. General Assessments
• Students should look at the following case study, then write their responses and their own example in their journals.
Case Study: In the 1950s the federal government purchased large amounts of farm
products at market prices and stored the goods in storage facilities. Determine how this government spending impacts producers (farmers). How would it impact consumers? What happens to the price of farm products? Generate another example of government intervention and how it affects the economy.
• Students should make a list of the pros and cons of proportional/flat taxes versus the pros and cons of progressive taxes. Have students prepare a persuasive paper citing which type of tax is fairer. Students should include calculations and specific examples within their papers.
Clear statement and analysis of what type of tax is fairer—progressive or proportional
20%
Calculations or other evidence to support your point of view
50%
Organization and grammar 15% Clarity 15%
• Students will informally debate whether or not the government should intervene in
the economy during tough economic times. Students should consider examples from history. For example, students should consider the fact that Roosevelt intervened

Free Enterprise Unit 8 Government Policy and Taxation 55
during the Great Depression and consider that some argue he interfered too much while others say he failed to spend enough money to get the economy moving
Activity-Specific Assessments
• Activity 2: Have students prepare an oral or written debate explaining why a particular group of people should receive a tax cut. Consider a proposed tax cut for a particular group—exemptions to teachers with 10 or more years of continuous service. What would the impact be on teachers? On the community? On education?
• Activity 3: Assign student teams to research the annual budgets of the parish,
Louisiana, and federal governments. Ask them to create circle graphs illustrating the major categories of expenditures and revenues for each level of government (e.g., show raw numbers and percentages). When comparing expenditures and revenues, ask students to explain debt and service on debt.
• Activity 6: Provide students with 1040EZ forms and sample W-2s. Instruct the
students to complete the 1040EZ forms following the instructions provided. Allow students to use the tax tables so they may see the progressive nature of taxes paid.

Free Enterprise Unit 9 The Global Economy 56
Free Enterprise Unit 9: The Global Economy
Time Frame: Approximately two weeks Unit Description This unit emphasizes how nations, businesses, and individuals participate in a global interdependent economy. Student Understandings Students understand that the world is a globally interdependent economy. Students learn how currency and trade policy affect the global economy. Students learn the benefits and costs of economic interdependence. Students learn how nations, institutions and economic trends affect the global economy. Students understand that Louisiana is a part of a global economy. Guiding Questions
1. Can students identify the causes of economic interdependence? 2. Can students explain how businesses have changed to be competitive in a global
market? 3. Can students explain how economies of different countries affect one another? 4. Can students explain the International Monetary Fund and how currency
valuations and exchange rates affect the global economy? 5. Can students explain the purpose and role of policies and international agreements
on the ability to trade internationally? Unit 9 Grade-Level Expectations (GLEs) GLE # GLE Text and Benchmarks Economics: Fundamental Economic Concepts 21. Explain ways in which businesses have changed to meet rising production costs
or to compete more effectively in a global market (E-1A-H6) Individuals, Households, Businesses, and Governments 39. Explain the causes of global economic interdependence (E-1B-H4) 40. Describe the worldwide exchange of goods and services in terms of its effect in
increasing global interdependence and global competition (E-1B-H4) 41. Examine fundamental concepts of currency valuation and foreign exchange and
their role in a global economy (E-1B-H4)
Free Enterprise Unit 9 The Global Economy 57
GLE # GLE Text and Benchmarks 42. Explain how the economy of one country can affect the economies of other
countries or the balance of trade among nations (E-1B-H4) 43. Explain the role of the International Monetary Fund in supporting world
economies (E-1B-H4) 44. Identify and evaluate various types of trade barriers among nations (E-1B-H5) 45. Take and defend a position on a trade policy or issue (e.g., NAFTA, G8,
European Union) (E-1B-H5) 46. Evaluate the role and importance of Louisiana ports and products in the
national and international economy (E-1B-H6)
Sample Activities Activity 1: Interdependence and Global Competition (GLEs: 21, 44) Introduce the concept of interdependence by asking students to list all of the products their families purchase that are made outside the United States. Then list all of the products and services they purchase that are made inside the U.S. Ask them what would happen if Congress constructed a tariff wall around the United States? Would we be better off without imports? Would our wealth as a nation be lesser or greater? Conduct a class discussion about the use of protective tariffs. Ask teams of students to research some historical actions on trade and assess their effectiveness:
• Jefferson’s use of embargoes in 1807 • Abominable Tariff of 1828
Simulate a business (sports shoes might be good) where competition in the market for goods/services has kept prices low, while the factors of production are costly. Provide alternatives for a business that is losing money in this context: find new technologies increasing the productivity of factors (labor), relocating production overseas where factors of production are less expensive (labor). Ask students to explain why businesses make these decisions and how those decisions impact employment (wages, costs), communities in which the plants were located (e.g., Rust Belt), and tax revenues for governments. Activity 2: Causes for Global Interdependence, World Trade and Interdependence (GLEs: 39, 40) Provide a map of the world’s natural resources. (Maps of world resources may be found in a world atlas.) Discuss with students the products that different countries specialize in and how many products would not be available to us if it were not for international trade. Ask students to explain why it is impossible for any one country to maintain a modern economy, independent of the world.
Free Enterprise Unit 9 The Global Economy 58
Provide a case study of Japan. The country has little or no oil, coal, iron or rubber resources but produces a large quantity of the world’s cars. The case study should include data on the top ten Japanese imports and exports. Ask students to study the case and explain how Japan is successful in world trade. Using the World Almanac and/or World Bank publications, ask students to research the volume of world trade between some selected number of countries. Ask them to create graphs illustrating how the volume of trade among countries is expanding. Do these data indicate that interdependence is likely to grow rather than decline? What would happen if countries or blocs of countries created barriers (e.g., tariffs) to trade? Returning to the example of businesses relocating overseas to reduce costs, ask students to explain why labor and labor unions might oppose free trade and economic interdependence (at least in the short run). Would economic interdependence cause our standard of living to increase or decrease? Why? Is it possible that economic interdependence might increase living standards in the United States while some groups might suffer a loss in wages and incomes? When businesses go abroad to produce goods, what happens to wages at home? Activity 3: Currency Exchange Rates and Effects of Global Trade on Domestic Economies (GLEs: 41, 42) Provide a current table of exchange rates from a daily newspaper and ask students to examine the dollar against the Yen, Euro, Pound, etc. Students may also use the internet to make conversions from the dollar to other currencies. (One available website that may be used for these conversions is www.oanda.com/convert/classic.) Simulate a situation where the class is considering taking a trip to Italy. Characteristics of the simulation might include the following:
• Assume that both countries permit their currency (money) to float freely on the world market (e.g., the governments do not fix the value of their currency at some prescribed level).
• There is a world market for currencies in which demand and supply determine the value of each currency.
• These tourists need to have Italian Euros to spend in Italy, creating a demand for Euro currency.
• Department stores buying shoes in Italy also demand Euros to buy goods. • Italians also have a demand for American currency for travel and trade. • Credit card use is another form of demand for a currency when used overseas. • The more a currency is demanded, the greater its value.
Ask students to explain how an increase or decrease in the value of a currency would impact a country’s economy. Ask students to explain what happens to domestic economies in the following scenarios:
• Congress places a tariff on steel products from Germany. • Congress subsidizes farm products regularly shipped to France.

Free Enterprise Unit 9 The Global Economy 59
• The United States runs a deficit, leading to devaluation of the dollar against the yen.
• The United States experiences a recession, reducing importation of oil from Saudi Arabia.
Ask the students to trace impacts of each situation on wages, prices, production, and consumption in each country. Activity 4: The IMF and Global Investment; Applying Concepts of International Trade (GLE: 43) Provide an organizational chart of the International Monetary Fund (IMF), listing its goals. Ask students to explain the role of creditor nations (depositors) and debtor nations (borrowers) in maintaining the circular flow of international trade. Ask students to apply the Circular Flow as if there were no country boundaries.
• Why does the IMF place restrictions on domestic economic decisions that debtor nations can make?
• How does borrowing by debtor nations increase employment, production, and consumption in their domestic economy?
Compare this with how borrowing in the United States increases consumption by individuals. How does stimulation of a debtor’s economy improve the flow of world trade? Discuss the following: The United States has the world’s largest economy (i.e., we produce more and consume more goods/services, valued at market prices, than any other country). We are dependent upon other countries for vital natural resources (e.g., oil, minerals). At the same time, we have a skilled labor source that is the most productive in the world. Our productivity occurs, in part, because of advancements in and investment in technologies. Ask students to explain how differences between the United States and its trading partners affect wages, costs, and prices (e.g., prices of natural resources in underdeveloped countries versus prices of finished products in developed countries). Conclude with the question: Is a market economy for the world (global markets) a good thing for the United States? Is it good for developing countries? Who benefits and who loses? Choose any one of several trends that impact international trade and ask students to trace the impact of each on currency and product flows.
• For example, the policy in Europe is to place high use taxes on gasoline, and that trend is growing in other countries. How would such taxation impact oil- producing nations, oil-consuming nations, and oil-related industries (cars)?
• Define tariff, subsidy, cartel (OPEC), and embargoes. Ask students to explain how each affects the performance of international trade.
• Ask students to write a domestic policy for a nation that has determined it must restrict trade. The policy statement must include reasons for placing limits on international trade.

Free Enterprise Unit 9 The Global Economy 60
• Ask other students to evaluate the impact of the domestic policy written by their peers. The evaluation must include effects on imports and exports, wages and prices in the domestic economy, and the standard of living in the domestic economy.
Activity 5: Trade Barriers, Free Trade, and Defending a Trade Policy (GLEs: 44, 45) Review with students such barriers to trade as tariffs and quotas. Have students brainstorm arguments for maintaining trade barriers, (e.g., protecting domestic jobs and maintaining the balance of payments between our nation and other nations). Explain to students what the North American Free Trade Agreement (NAFTA) is. Discuss the pros and cons of NAFTA from the perspectives of the three countries involved: US, Canada and Mexico. Give each student a slip of paper which describes a business or person who might have been affected by NAFTA (e.g., textile worker in Louisiana, small corn farmer in Mexico). Have students write the position of these different people/businesses; then have them explain their positions to the class. The North American Free Trade Agreement (NAFTA) has been praised and opposed by different labor and business groups in the United States. Ask students to research the arguments for and against NAFTA, and prepare a paper defending their position on this trade agreement. In groups, have students research the European Union and G8. Students should write what countries are included in these free trade agreements; then students should write a list of pros and cons for these trade agreements. Activity 6: Louisiana in World Trade (GLE: 46) Using government data on export and import volume, ask students to evaluate the monetary importance (exports and imports) of Louisiana ports relative to other primary trading ports in the United States. How is this trade volume related to barge and rail connections to the port? Select the top ten products exported by Louisiana firms and describe transportation routes and systems used to export the goods.
Sample Assessments General Guidelines
• Use a variety of performance assessments to determine student understanding of content.

Free Enterprise Unit 9 The Global Economy 61
• Select assessments that are consistent with the types of products that result from the student activities.
• Develop a scoring rubric collaboratively with other teachers or students. General Assessments
• Students should research the different views on outsourcing as stated by our country’s main political parties. Have students write a paper explaining what outsourcing is, how it might be harmful or beneficial, and how different groups (i.e., political parties) might view outsourcing.
Explanation of outsourcing 20% Analysis of outsourcing-who it benefits/harms
30%
Explanation and analysis of how different political parties view outsourcing
30%
Grammar, organization, clarity
20%
• Students should write journal entries throughout the unit on topics discussed in class.
For example, students might use their journals to explain how an increase or decrease in the value of a currency would impact the economy or to explain why labor and labor unions might oppose free trade and economic interdependence. Allow students to use their journals in order to better evaluate their understanding of topics.
• Students should create a list of the pros and cons of protective tariffs. Students should be able to explain verbally their reasoning for each choice.
Activity-Specific Assessments
• Activity 2: Using the World Almanac and/or World Bank publications, ask students to research the volume of world trade between some selected number of countries. Ask them to create graphs illustrating how the volume of trade among countries is expanding. After creating the graphs, students should then answer the following:
a. Does this information indicate that interdependence is likely to grow rather than decline? Explain. b. What would happen if countries or blocs of countries created barriers (e.g., tariffs) to trade?
• Activity 4: Ask students to write a domestic policy for a nation that has determined it
must restrict foreign trade. The policy statement must include reasons for placing limits on international trade. Ask other students to evaluate the impact of the domestic policy written by their peers. The evaluation must include effects on imports and
Free Enterprise Unit 9 The Global Economy 62
exports, wages and prices in the domestic economy, and the standard of living in the domestic economy.
• Activity 5: Have students write their positions on NAFTA, assuming the role given to
them by the teacher. First, give each student a slip of paper which describes a business or person who might have been affected by NAFTA (e.g., textile worker in Louisiana, a farmer who raises corn on a small farm in Mexico). Have students write the position of these different people/businesses; then have them explain their positions to the class.

Free Enterprise Unit 10 Personal Economics 63
Free Enterprise Unit 10: Personal Economics
Time Frame: Approximately one week Unit Description This unit shows students how economic choices and opportunities affect their roles in the U.S. economy. Student Understandings Students understand that career choice and preparation affects their success in finding employment and job satisfaction. Students learn about career opportunities in Louisiana. Students learn how their knowledge and application of fundamental economic understandings helps them to analyze economic issues and make personal economic decisions. Guiding Questions
1. Can students identify factors that affect successful acquisition of jobs? 2. Can students explain how interest rates affect saving and borrowing? 3. Can students identify the types, purpose, and importance of specific jobs needed
in Louisiana? Unit 10 Grade Level Expectations (GLEs) GLE # GLE Text and Benchmarks Economics: Fundamental Economic Concepts 1. Apply fundamental economic concepts to decisions about personal finance
(E-1A-H1) 10. Explain the skills, knowledge, talents, personal characteristics, and efforts
likely to enhance prospects of success in finding a job in a particular field (E-1A-H3)
11. Explain the types of jobs important to meeting the needs of Louisiana industries and an information-based society (E-1A-H3)
12. Evaluate various careers in terms of availability, educational and skill requirements, salary and benefits, and intrinsic sources of job satisfaction (E-1A-H3)

Free Enterprise Unit 10 Personal Economics 64
GLE # GLE Text and Benchmarks The Economy as a Whole 54. Predict the consequences of investment decisions made by individuals,
businesses, and government (E-1C-H2) 55. Predict how interest rates will act as an incentive for savers and borrowers
(E-1C-H2)
Sample Activities Activity 1: Personal Spending Saving and Credit (GLE: 1) Introduce the lesson by having students describe various ways they can pay for a particular purchase. On an overhead projector or chalkboard write PROS and CONS and have students explain what is advantageous and what is detrimental about their payment choices. Use the following terms to help guide the discussion: checks, debit cards, cash, bank loans, credit cards, lay-away programs, and personal loans. Emphasize the problems many young people have with credit cards. Show students how a purchase can end up costing several times its original cost. Have students make a list of purchases they will make in their future (e.g., education, car, home, furniture) and write beside each item how they imagine they will pay for these items. Establishing sound credit is important in our modern economy. Discuss with students what lenders look for in potential borrowers: character, capacity, and collateral. Provide students with a blank credit application for an imaginary/real credit card for a bank or business. Have students review the information requested (e.g., employment history, salary, references). Ask students to answer the following questions:
• Why do lenders require particular information? • Is it important to have steady employment history? • Why do lenders want to issue credit? • How can too much credit lead to serious debt? • How does debt affect future employment and purchasing possibilities?
Discuss with students how creditors and employers check on the credit history of potential borrowers, future employees? Explain to students the purpose and importance of credit reporting institutions and how credit ratings are assigned. Bankruptcy in the United States is a serious problem. Discuss with students what it means to become bankrupt. Explain to students the long-term ramifications of bankruptcy and steps people can take to avoid bankruptcy.

Free Enterprise Unit 10 Personal Economics 65
Activity 2: The Louisiana Economy (GLEs: 10, 11, 12) Create a list of industries in Louisiana. Create a list of various careers associated with those industries. Evaluate those careers with a detailed chart utilizing a 1-5 rating system for the following criteria:
• availability • educational and skill requirements • salary and benefits • intrinsic sources of job satisfaction
Explain how industries in Louisiana can continue to make an impact in a global, information-based society. Describe how potential new industries could affect the economy in Louisiana. What are the skills, knowledge, talents, personal characteristics, and efforts likely to enhance prospects of success in finding a job in a particular field? Ask students to create a future resume applying for a position in a specific place and business in Louisiana. Ask students to act as interviewers/prospective employers as they share resumes. Activity 3: Consequences of Saving and Investment and Perspective on Interest Rates (GLEs: 54, 55) Ask students to explain why savings are important to individuals and businesspersons via a chart that identifies at least three to five reasons. Discuss with students how savings provide a safety net in the event of unexpected events (e.g., sickness, layoffs, natural disasters). Discuss with students different types of savings instruments and accounts (e.g., 401K plans, savings bonds, passbook savings accounts, retirement accounts). Have students write a brief saving plan for their future that includes regular and retirement savings. Ask students to explain how individual and business savings plans may affect government. Explain the importance of savings in a market economy. Ask students to explain (and graph) how the principle of demand and supply determines the equilibrium interest rate. How will interest rates act as an incentive for savers and borrowers? Ask students to create a consumer help brochure outlining the value of saving for the individual, the business, and the market economy.

Free Enterprise Unit 10 Personal Economics 66
Sample Assessments General Guidelines
• Use a variety of performance assessments to determine student understanding of content.
• Select assessments that are consistent with the types of products that result from the student activities.
• Develop a scoring rubric collaboratively with other teachers or students. General Assessments
• Students should write a journal entry on what they see as their own skills and interests. Students should write what career would be best suited for them, considering their own skills and interests. Allow students to research the requirements of occupations with the Internet or other resource materials.
• Students should look through the fine print in credit card advertisements and applications to find information that consumers might need when opening a credit card account (e.g., annual fees, APR, late fees). The teacher should provide students with a variety of these advertisements and applications that come in the mail. Students should write a list of the pros and cons of each credit card advertisement they reviewed.
• Students should create a “best financial advice” list. Students should ask several adults to give them their five best financial tips. Students should compile all the tips into a best financial advice list. Students should be able to explain why the adult they interviewed believed that it was good financial advice.
Activity-Specific Assessments
• Activity 1: Have students write a future household budget. First, students should research their anticipated career and find out what their monthly salary will be. Next, provide students with a list of expenses, such as housing, electricity, car note, food, medical care, entertainment, savings, and taxes. Students should write how much they will spend on each item, then calculate the total expenses. Students should research what their expenses will be for each item by using the internet, contacting business, or speaking to adults.
• Activity 2: Ask students to create a future resume applying for a position in a specific
place and business in Louisiana. Ask students to act as interviewers/prospective employers as they share resumes.

Free Enterprise Unit 10 Personal Economics 67
• Activity 3: Ask students to explain (and graph) how the principle of demand and
supply determines the equilibrium interest rate. In their journals, students should answer, How will interest rates act as an incentive for savers and borrowers? Next, have students create a consumer help brochure outlining the value of saving for the individual, the business, and the market economy. Students may use computer graphics to make this brochure. Rubric for brochure:
Neat and uses pictures (either hand-drawn or computer- generated)
15%
Accurately outlines the benefits of saving for the individual, business, and market economy (at least 3 benefits for each)
60%
Grammar and spelling 25%