free fall - determining the acceleration of...
TRANSCRIPT
Physics 211 Experiment 1: Free Fall - Determining the acceleration of gravity
Prior to Lab: Derive the numbered equations (Equations 1, 2 and 3) in the lab instructions using the definitions of velocity and acceleration (a=dv/dt and v=dy/dt).
Object: The object of this experiment is to determine the value of the acceleration of gravity by measuring the rate of acceleration of a freely falling object. In addition, one will be able to compare theory with experiment for constantly accelerated motion.
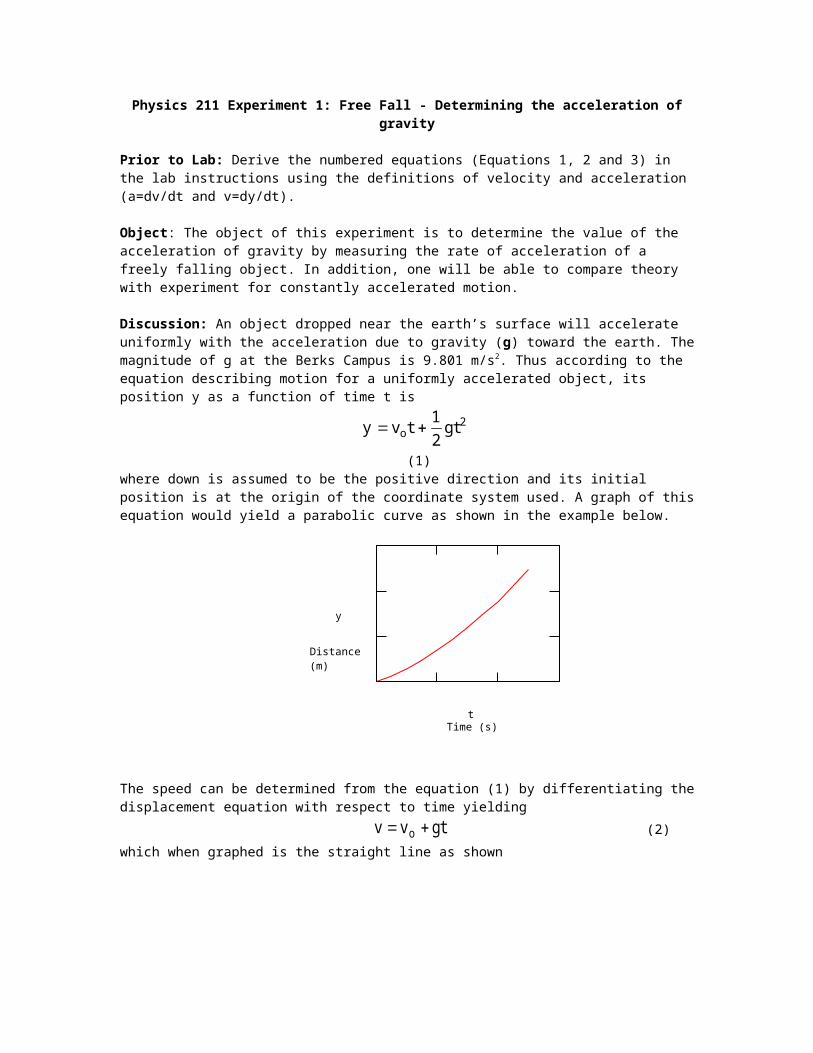
Discussion: An object dropped near the earth’s surface will accelerate uniformly with the acceleration due to gravity (g) toward the earth. The magnitude of g at the Berks Campus is 9.801 m/s2. Thus according to the equation describing motion for a uniformly accelerated object, its position y as a function of time t is
y v t gto 12
2 (1)where down is assumed to be the positive direction and its initial position is at the origin of the coordinate system used. A graph of this equation would yield a parabolic curve as shown in the example below.
The speed can be determined from the equation (1) by differentiating the displacement equation with respect to time yielding
v v gto (2)which when graphed is the straight line as shown
Time (s)
Speed (m/s)
v
t
where the y-intercept is the initial speed vo and the slope of the line is the acceleration g.
Time (s)
Distance (m)
y
t
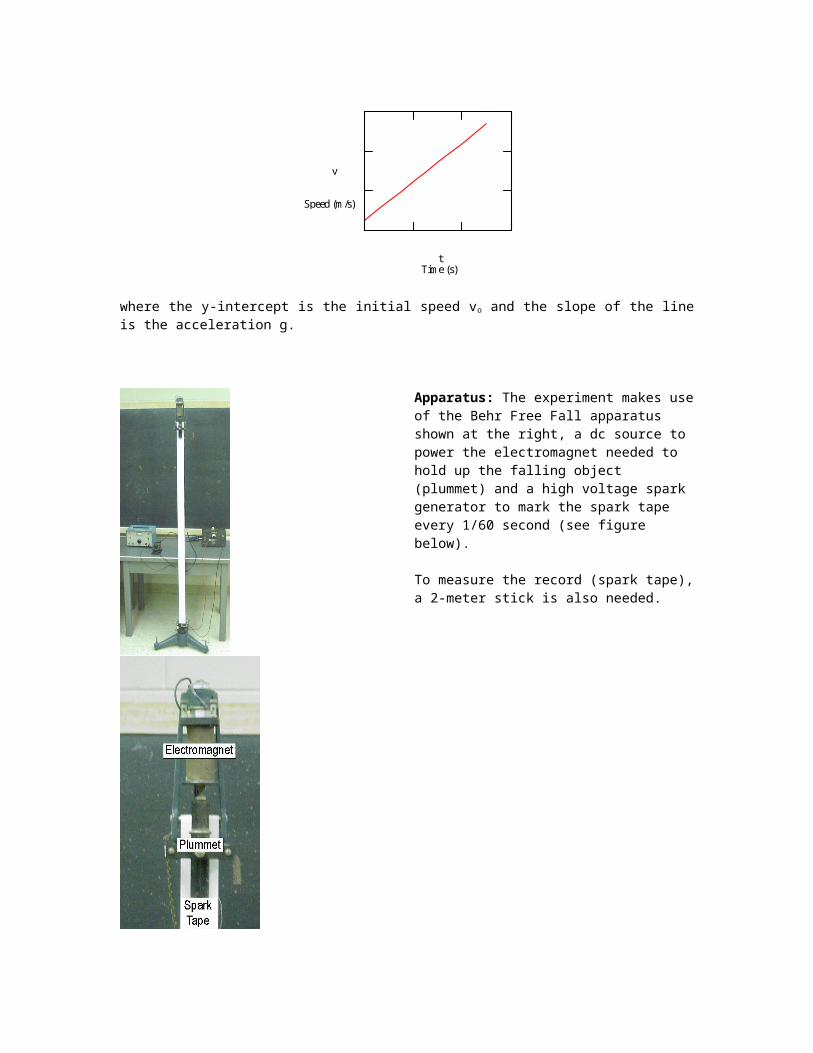
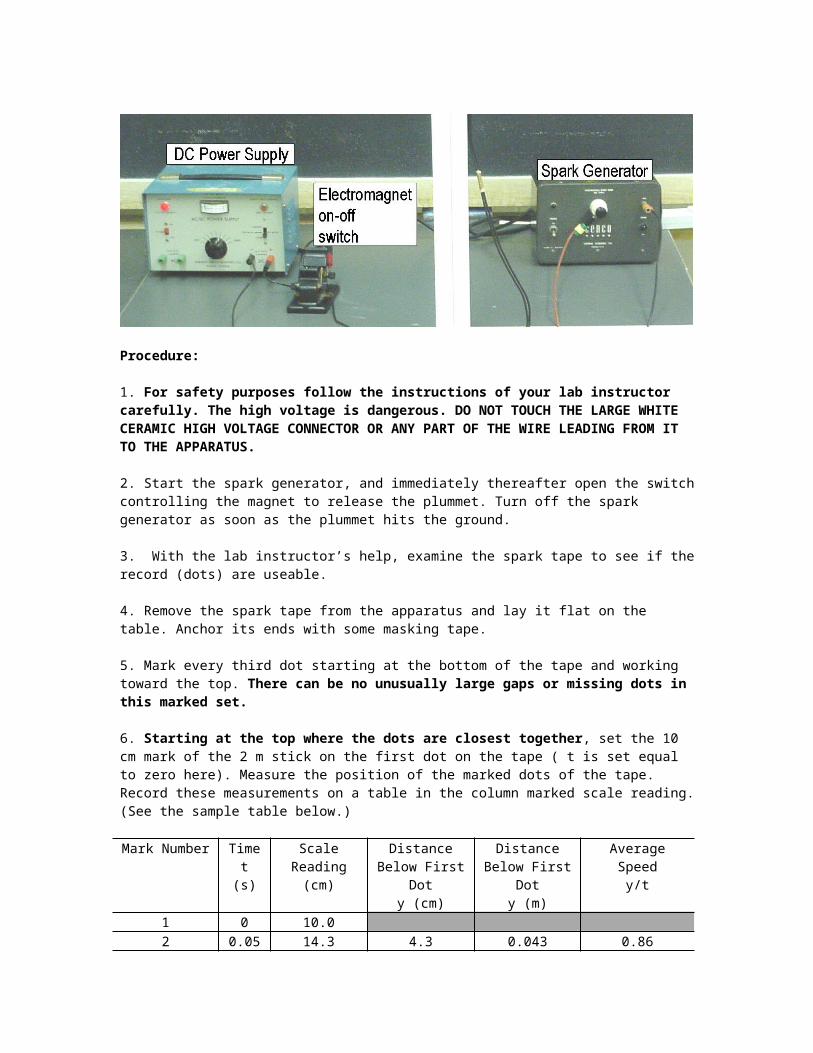
Apparatus: The experiment makes use of the Behr Free Fall apparatus shown at the right, a dc source to power the electromagnet needed to hold up the falling object (plummet) and a high voltage spark generator to mark the spark tape every 1/60 second (see figure below).
To measure the record (spark tape), a 2-meter stick is also needed.
Procedure:
1. For safety purposes follow the instructions of your lab instructor carefully. The high voltage is dangerous. DO NOT TOUCH THE LARGE WHITE CERAMIC HIGH VOLTAGE CONNECTOR OR ANY PART OF THE WIRE LEADING FROM IT TO THE APPARATUS.
2. Start the spark generator, and immediately thereafter open the switch controlling the magnet to release the plummet. Turn off the spark generator as soon as the plummet hits the ground.
3. With the lab instructor’s help, examine the spark tape to see if the record (dots) are useable.
4. Remove the spark tape from the apparatus and lay it flat on the table. Anchor its ends with some masking tape.
5. Mark every third dot starting at the bottom of the tape and working toward the top. There can be no unusually large gaps or missing dots in this marked set.
6. Starting at the top where the dots are closest together, set the 10 cm mark of the 2 m stick on the first dot on the tape ( t is set equal to zero here). Measure the position of the marked dots of the tape. Record these measurements on a table in the column marked scale reading. (See the sample table below.)
Mark Number Timet (s)
Scale Reading
(cm)
Distance Below First
Doty (cm)
Distance Below First
Doty (m)
Average Speed
y/t
1 0 10.02 0.05 14.3 4.3 0.043 0.863 0.10 23.4 13.4 0.134 1.34
The first three columns are to be recorded at the time of reading the spark tape. Calculate the last three columns using a spread sheet program. The distance/time column may be determined theoretically by dividing y/t yielding
yt v g to 2 (3)
which is the equation of a straight line with a y intercept of vo and a slope of g/2.
7. With the data entered into a spread sheet, calculate the last three columns.
Analysis:1. Plot a graph of distance in meters vs. time in seconds. Fit a quadratic (polynomial, order = 2) to the data points. What is the shape of the curve? Is the graph and equation of the trendline consistent with theory? What value of g is indicated by the fit to the data?
2. Plot a graph of average speed (y/t) vs. time and determine its y intercept and slope using a linear trendline. Is the shape of the curve consistent with theory? The acceleration of gravity can be determined from the slope of the graph; what is this value?
3. What is the meaning of the y intercept on the graph plotted in step 2 of the analysis? What is its value? What does this value tell you about the motion of the plummet?
4. How does the value of g compare with the standard value of g given in these instructions?