free sample - hedge fund wisdom
TRANSCRIPT

1
hedge fund wisdom Table of Contents
p.02 Baupost Group
Hedge Fund Portfolio Updates:
Q1 2012
a quarterly publication by marketfolly.com
Q1 2012 www.hedgefundwisdom.com
Each quarter, hedge funds and institutional managers are required to disclose their portfolios to the SEC via 13F filing. These filings disclose long U.S. equity positions, American Depositary Receipts (ADRs), stock options (puts/calls), as well as convertible notes. The 13F filing does not disclose positions in other asset classes (such as commodities, currencies, or debt). It also does not reveal short sales or cash positions.
Hedge Fund Wisdom, a quarterly publication by MarketFolly.com, updates and analyzes the latest portfolios of prominent investment managers. The positions herein represent a hedge fund’s first quarter holdings as of March 31st, 2012. Keep in mind these updates are not reflective of a fund’s entire overall portfolio.
Background:
First Quarter Summary:
!"#$%#$&$'(&)*+,,-'!
"##$%&!'"((")!
*++%&!'**,-)!
./+0&11!2304+51!'.267)!
804+*9:41#0!'86;,)!
<0#=>!<?15%&!'<<;)!
!
!"#$%#$&$'.%//*0%,&1%-'!
@43A?&%!B#01!'B(62)!
@?0:&%%!8&3A>#%#$C!'@6D-)!
D4?3#E!'D;*FG)!
G?49H!'G;IJ)!
<?0&KH14#>!'<KL)!
In This Issue:
Next Page: Baupost Group’s Updated Portfolio
- Portfolio updates on 25 prominent hedge fund managers - Equity analysis written by hedge fund analysts that examines
the investment thesis behind 3 stocks hedgies were buying - Expert commentary on each fund’s portfolio moves
The table below outlines the most frequent buys & sells this quarter among the 25 prominent hedge funds profiled in this issue.
p.04 Berkshire Hathaway
p.06 Greenlight Capital
p.08 Lone Pine Capital
p.11 Appaloosa Management
p.14 Pershing Square Capital
p.16 Maverick Capital
p.19 Third Point
p.22 Blue Ridge Capital
p.25 Paulson & Co
p.28 Tiger Management
p.30 Soros Fund Management
p.33 Bridger Management
p.36 Omega Advisors
p.39 Coatue Management
p.41 Fairholme Capital
p.43 Tiger Global Management
p.46 Passport Capital
p.51 Perry Capital
p.54 Glenview Capital
To navigate through the newsletter, simply click on a page number in the Table of Contents to go to that page.
p.57 Viking Global
p.60 Farallon Capital
p.63 Icahn Capital
Equity Analyses: p.69 Equinix (EQIX)
p.75 Tempur-Pedic (TPX)
p.80 AutoZone (AZO)
p.65 JANA Partners
p.67 Pennant Capital

2 Q1 2012 www.hedgefundwisdom.com
Baupost Group was recently listed as one of the top 10 hedge funds by net gains since inception. Coming in at number four on the list, it’s no surprise that investors are always looking to see where Seth Klarman has been investing. Baupost Group’s first quarter 13F filed with the SEC shows that they had $2.96 billion allocated to long US equity positions. Assuming Baupost’s assets under management (AUM) are around ~$22 billion, this means only just over 13% of their AUM is tied up in US equity exposure. Given Baupost’s distressed focus, that’s just something worth keeping in mind. Additionally, the firm typically holds around a ~20% cash position as a natural hedge as they wait for compelling opportunities. Lastly, be aware that Baupost has a stake in foreign traded Vivendi as well. As of February 29th, Baupost owned 25.5 million shares in the company. At that time, the stake was worth over $400 million. But since then, shares have decreased in value and their stake is now worth around $323 million (assuming they still hold the entire position). Comparing this amount to Baupost’s disclosed US positions, this would slot Vivendi in around their fourth largest disclosed holding, behind the likes of ViaSat (VSAT), BP (BP), and Hewlett Packard (HPQ).
In terms of US equity additions and
subtractions, Baupost Group completely exited three stakes including PDL BioPharma (PDLI), Genworth Financial (GNW), and Targacept (TRGT). They also trimmed two previously sizable positions: Microsoft (MSFT) and BP (BP). While they still hold these names, they’ve certainly allocated less capital to them (especially in MSFT’s case).
On the buying side of the portfolio, Baupost continued to purchase shares of Idenix Pharmaceuticals (IDIX) and NovaGold Resources (NG) during the first quarter. These two stocks were flagged in the last issue of Hedge Fund Wisdom (HFW). Baupost continued to add to its stake in Idenix by 45% and NovaGold by 33%. Since the close of the first quarter, NG shares have fallen even further below where Klarman’s shop was purchasing them. Given his propensity to scoop up shares when valuation is cheap, it will be interesting to see if he picks up even more gold exposure via this miner.
Apart from these maneuvers, Klarman left his equity book largely unchanged. The only other activity was largely selling out of his previously smaller stakes in Multimedia Games (MGAM) and Alere (ALR).
For some recent resources on this legendary investor, head to notes from Seth Klarman’s Margin of Safety as well as an interview Klarman did with Charlie Rose.
Seth Klarman
Graduated from Harvard Business School & regarded as one of the best
investors of all time
Author of Margin of Safety
View Seth Klarman’s Recommended Reading List
Baupost Group
View Baupost Group’s Updated Portfolio on the Next Page
Key Takeaways 2%3'4"$565"#$'7#-'>M?!
!
."/,'!"89/%6%/)':&6':;-',I-!G4#,A?0E?!',I-;)!
"&>=#05A!K4>?>34?%!'"LN)!
8?0$?3&+5!'86"8)!

3
Baupost Group
Next Page: Berkshire Hathaway
First Quarter 2012 Portfolio:
Q1 2012 www.hedgefundwisdom.com
Rank Company Name Ticker Put/Call % of Portfolio Activity
Value x $1000 # of Shares
1 ViaSat Inc. VSAT
17.1% Unchanged $506,205 10,499,992 2 BP plc BP
14.2% Cut -22% $419,441 9,320,900
3 Hewlett-Packard Co HPQ
13.9% Cut -8% $411,068 17,250,000 4 News Corp. NWSA
10.0% Unchanged $296,471 15,041,665
5 Theravance Inc. THRX
9.6% Added 2% $283,799 14,553,800 6 Microsoft Corporation MSFT
7.6% Cut -42% $225,785 7,000,000
7 News Corp. NWS
7.2% Unchanged $212,847 10,658,335 8 Allied Nevada Gold ANV
4.4% Unchanged $130,535 4,012,750
9 Idenix Pharmaceuticals IDIX
2.7% Add 46% $80,758 8,249,000 10 NovaGold Resources NG
2.4% Add 34% $71,800 10,000,000
11 AVEO Pharmaceuticals AVEO
2.1% Unchanged $63,101 5,084,652 12 Enzon Pharmaceuticals ENZN
2.1% Unchanged $61,566 9,000,878
13 THERAVANCE NOTE THRX
1.8% Unchanged $52,211 51,000,000 14 Syneron Medical Ltd. ELOS
1.5% Unchanged $42,880 4,000,000
15 Alliance One Intl AOI
1.1% Unchanged $33,126 8,786,700 16 Central Pacific Financial CPF
0.8% Unchanged $23,310 1,800,000
17 IturanLocation&Control ITRN
0.8% Unchanged $22,655 1,685,666 18 Sycamore Networks Inc. SCMR
0.3% Unchanged $9,418 530,871
19 Multimedia Games Inc. MGAM
0.2% Cut -77% $6,396 583,538 20 Alere Inc. ALR
0.1% Cut -93% $3,582 137,700
21 Genworth Financial Inc. GNW
Sold
- 22 PDL BioPharma, Inc. PDLI
Sold
-
23 Targacept, Inc. TRGT
Sold
-

4 Q1 2012 www.hedgefundwisdom.com
Berkshire Hathaway’s portfolio continues to be dominated by smaller activity by its new portfolio managers: Todd Combs and Ted Weschler. Last quarter’s newsletter highlighted how Berkshire initiated stakes in Liberty Media (LMCA) and DaVita (DVA). Both of these stakes are assumed to be attributed to Ted Weschler given that they were both past holdings at his old hedge fund, Peninsula Capital Advisors. He continued to buy shares of both for Berkshire in the first quarter, boosting his holdings in Liberty Media by 76% and DaVita by 123%. And given the style of portfolio Weschler ran at his old shop, it’s not out of the question to attribute Berkshire’s new buy of Viacom (VIA.B) to him as well. But despite which manager may have initiated each stake, the main takeaways here are the fact that the Berkshire crew also started a brand new position in General Motors (GM) and heavily added to its stake in The Bank of New York Mellon (BK).
During Berkshire’s recent annual meeting in Omaha, Buffett and Charlie Munger commented that they are very happy with the new managers and are pleased with their returns. Both Combs and Weschler receive a base salary of $1 million as well as a performance incentive for 10% of outperformance versus the S&P 500 (on a rolling basis of 3 years). What’s also interesting is that 80% of their performance bonus will be based on the manager’s own return, while 20% is based on the return of the other manager.
Buffett also shed some light as to how much money each gentleman is managing. They each started with a portfolio of $1.75 billion, but they are now managing $2.75 billion each.
In terms of portfolio activity directly attributable to Buffett, there doesn’t seem to be much apart from adding ever so slightly to his pre-existing Wells Fargo (WFC) position and adding to his stake in Walmart (WMT) by 19%. It is worth noting, however, that Buffett has once again been granted confidentiality by the SEC regarding some of his activity. The fine print of the 13F filing says that, “confidential information has been omitted from the Form 13F and filed separately with the Commission.” Buffett has done this numerous times in the past, typically when he is building a position and doesn’t want to publicly reveal it before he’s done buying. At Berkshire’s recent annual meeting, he did mention that he was considering a $22 billion deal a few months ago. He said that in order to get the deal done, he would have had to sell some stocks to get it done and he didn’t want to do that. It will be interesting to see what (if anything) Buffett has been buying in the disclosure next quarter.
On the selling end of the portfolio, Berkshire reduced its position in Intel (INTC) by 32%, Verisk Analytics (VRSK) by 35%, and Dollar General (DG) by 19%.
For recent resources on this legendary investor, be sure to check out notes from Buffett’s meeting with MBA students, where he mentioned he had been buying Korean equities for his personal portfolio. Also check out key takeaways from Buffett’s 2011 annual letter and a tour of Buffett’s office.
Warren Buffett
Mentored by Benjamin Graham in the ways of value investing
Third richest person in the world
according to Forbes
View Buffett’s Recommended Reading List
Berkshire Hathaway
View Berkshire Hathaway’s Updated Portfolio on the Next Page
Key Takeaways '2%3'4"$565"#$-'"&>&0?%!@#5#01!'"@)!
D4?3#E!'D;*FG)!
!
."/,'!"89/%6%/)':&6':;-'<#E9413#!'<I<(F(G)!

5
Berkshire Hathaway First Quarter 2012 Portfolio:
Next Page: Greenlight Capital
Q1 2012 www.hedgefundwisdom.com
Rank Company Name Ticker Put/Call % of Portfolio Activity
Value x $1000 # of Shares
1 The Coca-Cola Company KO
19.7% Unchanged $14,802,000 200,000,000 2 Wells Fargo & Company WFC
17.9% Added 3% $13,462,596 394,334,928
3 IBM IBM
17.8% Added 1% $13,436,163 64,395,700 4 American Express Co AXP
11.7% Unchanged $8,772,196 151,610,700
5 Procter & Gamble Co. PG
6.5% Cut -5% $4,923,411 73,254,136 6 Kraft Foods Inc. KFT
3.9% Cut -10% $2,965,432 78,017,165
7 Wal-Mart Stores Inc. WMT
3.8% Added 20% $2,858,538 46,708,142 8 ConocoPhillips COP
2.9% Unchanged $2,211,963 29,100,937
9 U.S. Bancorp USB
2.9% Cut 0% $2,187,165 69,039,326 10 Johnson & Johnson JNJ
2.5% Unchanged $1,914,036 29,018,127
11 Moody's Corp. MCO
1.6% Unchanged $1,196,282 28,415,250 12 DIRECTV DTV
1.5% Added 13% $1,134,800 22,999,600
13 The Washington Post WPO
0.9% Unchanged $645,441 1,727,765 14 DaVita, Inc. DVA
0.7% Add 124% $541,020 6,000,000
15 M&T Bank Corp. MTB
0.6% Unchanged $467,591 5,382,040 16 Costco Wholesale Corp COST
0.5% Unchanged $393,469 4,333,363
17 Visa, Inc. V
0.5% Unchanged $338,071 2,865,008 18 CVS Caremark Corp CVS
0.4% Unchanged $318,371 7,106,500
19 USG Corp. USG
0.4% Unchanged $293,642 17,072,192 20 General Dynamics Corp. GD
0.4% Unchanged $284,503 3,877,122
21 Liberty Media LMCA
0.4% Added 76% $264,450 3,000,000 22 General Motors GM
0.3% New $256,500 10,000,000
23 Intel Corporation INTC
0.3% Cut -33% $217,751 7,745,000 24 Torchmark Corp. TMK
0.3% Unchanged $211,156 4,235,818
25 Mastercard Incorporated MA
0.2% Unchanged $170,319 405,000 26 Dollar General Corp DG
0.2% Cut -19% $168,037 3,637,164
27 General Electric Co. GE
0.2% Unchanged $156,102 7,777,900 28 Sanofi-Aventis SNY
0.2% Unchanged $157,467 4,063,675
29 Bank of New York Mellon BK
0.2% Add 213% $135,308 5,607,466 30 United Parcel Service UPS
0.2% Unchanged $115,365 1,429,200
31 Verisk Analytics, Inc. VRSK
0.1% Cut -35% $104,750 2,230,148 32 Viacom Inc 6.85% Pfd VIAB
0.1% New $75,541 1,591,670
33 GlaxoSmithKline plc GSK
0.1% Unchanged $67,837 1,510,500 34 Gannett Co., Inc. GCI
0.0% Unchanged $26,678 1,740,231
35 Ingersoll-Rand Plc IR
0.0% Cut 0% $26,299 636,000 36 Comdisco Holding Co CDCO
Sold
-

6 Q3 2010 www.hedgefundwisdom.com
The first thing worth highlighting with Greenlight Capital’s portfolio is the fact that Apple (AAPL) now represents almost 16% of their reported US equity longs. A lot of this seems to be tied to price appreciation as Einhorn’s allowed the position size to grow as well. After all, past newsletter issues have highlighted that he bought the bulk of his AAPL at $248 per share. But despite the fact that shares now trade north of $500, Einhorn recently reiterated his conviction in the name at the Ira Sohn Conference in New York. He said that many people have miscategorized the company as a hardware play. Instead, he says it’s a software company that happens to sell high margin hardware, calling their iOS platform “sticky” as it “captured the customer.” While many detractors say that a trillion dollar market cap for a company is absurd, Einhorn says it’s obviously not prohibited and anything can happen. To combat another bear argument that everyone already owns Apple, Einhorn argued that hedge funds actually have less than 2% of assets. He simply thinks the company is cheap and will continue to
grow. Dan Loeb of Third Point agrees with him and his thoughts on the stock are outlined a few pages down.
At the Ira Sohn event, Einhorn also made numerous other comments worth highlighting, including the fact that he said to short Martin Marietta Materials (MLM), arguing that at a 35 P/E ratio, the stock is overvalued. He thinks that a one time fiscal stimulus has goosed earnings. Additionally, he mentioned that Dick’s Sporting Goods (DKS) would suffer due to Amazon.com’s (AMZN) entrance into the sporting goods category. The Greenlight manager also had negative comments about Amazon, saying that the company grows revenue, but criticzed their weak profit growth. However, he did not say he was shorting them. He did say to short US Steel (X) as well as Zara/Inditex.
In terms of notable first quarter portfolio activity, Greenlight cut its stakes in Microsoft (MSFT) and Research in Motion (RIMM) in half. The hedge fund also completely exited shares of Yahoo! (YHOO) for the second time as Dan Loeb continues his activist fight there. Apart from three smaller new buys, Einhorn wasn’t doing much purchasing at all. This could be a function of his view on valuations at the time given that he’s a long-term value oriented investor. Regardless, he was reducing position sizes across the portfolio, that’s for certain.
David Einhorn will be presenting investment ideas at the Value Investing Congress in NYC in October and newsletter readers can receive a discount to the event by clicking here and using discount code: N12MF3
David Einhorn
Has returned 21.5% annualized
Predicted & profited from the demise of Lehman Brothers
Author of Fooling Some of the
People All of the Time
Greenlight Capital
Key Takeaways 2%3'4"$565"#$-'<#E+H5&0!234&>3&1!<#0+!'<2<)!
./+&94?!'.7,.)!
6#H>9CO1!'6LIP)!
'."/,'!"89/%6%/)':&6':;-'(E>4D414#>!8&3A!'(D8;)!
G0#?9049$&!K4>?>34?%!2#%H54#>1!'G6)!
P?A##Q!'PR(()!
80?:&%&01!'86D)!
KH04&/!,A?0E?!'KJ67)!
K4015!2#%?0!'K2-6)!,H51!
.>&0$C!,?05>&01!'.,-)!
View Greenlight Capital’s Updated Portfolio on the Next Page

7
Greenlight Capital First Quarter 2012 Portfolio:
Q1 2012 www.hedgefundwisdom.com
Next Page: Lone Pine Capital
Rank Company Name Ticker Put/Call % of Portfolio Activity
Value x $1000 # of Shares
1 Apple Inc. AAPL
15.9% Unchanged $877,445 1,463,700 2 Seagate Technology PLC STX
7.1% Added 1% $391,803 14,538,126
3 General Motors Company GM
6.9% Cut -22% $379,957 14,813,163 4 Gold Miners ETF GDX
6.5% Unchanged $360,125 7,264,971
5 Marvell Technology MRVL
5.2% Added 6% $288,995 18,372,247 6 CareFusion Corporation CFN
4.9% Cut -14% $269,994 10,412,441
7 DELPHI AUTOMOTIVE DLPH
4.6% Unchanged $252,633 8,194,661 8 Microsoft Corporation MSFT
4.4% Cut -51% $241,465 7,487,295
9 Ensco plc ESV
3.7% Cut -24% $203,377 3,842,365 10 Dell Inc. DELL
3.6% Cut -15% $198,610 11,964,405
11 Sprint Nextel Corp. S
3.5% Cut -7% $194,555 68,265,000 12 Best Buy Co. Inc. BBY
3.3% Unchanged $182,676 7,714,375
13 NCR Corp. NCR
3.3% Cut -13% $182,093 8,387,490 14 Einstein Noah Restaurant BAGL
2.9% Unchanged $160,143 10,733,469
15 CBS CORP CL B CBS
2.8% Cut -24% $153,568 4,528,681 16 Xerox Corp. XRX
2.3% Cut -9% $124,373 15,392,717
17 Aspen Insurance Holdings AHL
2.1% Cut -9% $114,581 4,101,000 18 HUNTINGTON INGALLS HII
2.0% Cut -15% $110,700 2,750,995
19 HCA HLDGS INC COM HCA
1.9% Cut -26% $103,290 4,175,000 20 Legg Mason Inc. LM
1.7% Unchanged $94,962 3,400,000
21 Liberty Media LMCA
1.6% Unchanged $86,387 980,000 22 DST Systems Inc. DST
1.5% Added 39% $85,018 1,567,734
23 Computer Sciences Corp CSC
1.3% New $71,856 2,400,000 24 CA Technologies CA
1.3% Cut 0% $69,878 2,535,472
25 NVR Inc. NVR
0.8% Cut -37% $46,521 64,050 26 Barrick Gold Corporation ABX
0.8% Cut -25% $44,024 1,012,500
27 Compuware Corporation CPWR
0.7% Unchanged $40,979 4,459,027 28 STATE BANK FINANCIAL STBZ
0.7% Unchanged $36,771 2,100,000
29 Expedia Inc. EXPE
0.6% New $33,440 1,000,000 30 Junior Gold Miners ETF GDXJ
0.5% Cut -37% $29,460 1,200,000
31 Research In Motion RIMM
0.4% Cut -45% $23,536 1,600,000 32 Fifth Street Finance Corp. FSC
0.4% Unchanged $19,508 1,998,692
33 BioFuel Energy Corp. BIOF
0.3% Unchanged $17,660 27,168,879 34 Republic Airways RJET
0.3% Unchanged $16,859 3,412,800
35 Tessera Tech TSRA
0.2% Unchanged $11,999 695,580 36 SYMMETRICOM, INC. SYMM
0.2% Unchanged $9,866 1,709,846
37 ROUNDY'S, INC. RNDY
0.1% New $6,013 561,934 38 OmniVision Tech OVTI
Sold
-
39 Broadridge Financial BR
Sold
- 40 Yahoo! Inc. YHOO
Sold
-
41 The Travelers Co TRV
Sold
- 42 Furiex Pharma FURX
Sold
-
43 First Solar, Inc. FSLR PUT
Sold
- 44 Energy Partners Ltd. EPL
Sold
-

8 Q1 2012 www.hedgefundwisdom.com
Steve Mandel spoke at the Ira Sohn Conference a few days ago where he mentioned that he had recently gone long department store Kohl’s (KSS). He also said he likes the “tech leader” companies. He’s obviously referring to his large positions in Apple (AAPL), Priceline.com (PCLN), and Google (GOOG). He would have also been referring to Baidu (BIDU), except for the fact that Lone Pine completely exited shares in the first quarter. This name had previously been lumped in with the others under the “tech leader” theme.
Shifting to Lone Pine’s latest portfolio disclosure, it’s quite evident the hedge fund is playing the El Paso (EP) merger arbitrage as the company was their top holding at the end of the first quarter after they boosted their position by
a whopping 382%. The top of their portfolio was slightly changed as they also took profits in highfliers like Apple (AAPL) and Priceline.com (PCLN), cutting each by 41% and 26% respectively. In terms of new purchases, there are six worth highlighting due to their size: AutoZone (AZO), Gap (GPS), Walt Disney (DIS), Ross Stores (ROST), BE Aerospace (BEAV) and Estee Lauder (EL) ~ the last of which was a previously longstanding holding for the firm. They exited shares in Q4 of 2011, only to turn around and re-establish their stake in Q1 of 2012.
Lone Pine’s portfolio is centered on a few key themes. The rise of the emerging market consumer is certainly a big one as they’ve been long casinos like Las Vegas Sands (LVS) with its Singapore and Cotai exposure, fine retail goods such as Ralph Lauren (RL) and additionally they’ve disclosed positions in Esprit (traded in Hong Kong: 0330). They’ve played the rise of outsourcing via Cognizant Technology Solutions (CTSH) and Michael Page in the UK. It’s clear they see internet plays as worthwhile, investing in dominant companies such as Google (GOOG) and Priceline.com (PCLN). Lastly, the rise of mobile computing is another theme you see in their portfolio via Apple (AAPL), Qualcomm (QCOM), and Crown Castle (CCI).
On the short side of the portfolio, it’s been revealed that Lone Pine has been short Neopost SA in France. Their thesis there seems to be that with the profliferation of digital content, people are printing and mailing items less and less. As such, there’s less demand for mailing and postage equipment.
Stephen Mandel
Seeks to identify companies with good management teams that are
trading below intrinsic value
Previously a consumer analyst at Julian Robertson’s hedge fund Tiger
Management
Lone Pine Capital
Key Takeaways 2%3'4"$565"#$-'*H5#S#>&!'*S()!
"?+!'",2)!
N?%5!I41>&C!'I;2)!
6#11!25#0&1!'6(28)!
G.!*&0#1+?3&!'G.*D)!
.15&&!-?H9&0!'.-)!
J%5?!2?%#>!'J-8*)!
G?>3#!2?>5?>9&0!G0?14%!'G2G6)!
(=&>1!<#0>4>$!'(<)!
NC>>!6&1#051!'NPLL)!
804+*9:41#0!'86;,)!
N&C&0A?&H1&0!'NP)!,H51!
!
."/,'!"89/%6%/)':&6':;-'L&5*++!'L8*,)!
G?49H!'G;IJ)!
N4%%4?E1!2#>#E?!'N2@)!
K@<!8&3A>#%#$4&1!'"8;)!
N4%%41!"0#H+!'N2R)!
&G?C!'.G*P)!
*E&04+041&!'*@,)!
View Lone Pine Capital’s Updated Portfolio on the Next Page

9
Lone Pine Capital First Quarter 2012 Portfolio:
Continued on next page…
Q1 2012 www.hedgefundwisdom.com
Rank Company Name Ticker Put/Call % of Portfolio Activity
Value x $1000 # of Shares
1 El Paso Corp. EP
5.7% Added 382% $934,838 31,635,809 2 Google Inc. GOOG
5.1% Cut -3% $838,301 1,307,312
3 Priceline.com Inc PCLN
4.7% Cut -26% $775,681 1,081,089 4 Apple Inc. AAPL
4.6% Cut -41% $754,800 1,258,944
5 Dollar General Corp DG
3.8% Cut -12% $621,237 13,446,688 6 SPDR Gold Shares GLD
3.7% Unchanged $608,081 3,750,348
7 Visa, Inc. V
3.3% Cut -5% $535,294 4,536,386 8 Polo Ralph Lauren RL
3.2% Cut -35% $527,179 3,024,031
9 QUALCOMM Inc QCOM
3.2% Added 21% $522,588 7,678,339 10 Monsanto Co. MON
3.2% Added 10% $519,075 6,507,957
11 NETEASE INC NTES
3.2% Added 20% $520,384 8,956,696 12 Equinix, Inc. EQIX
3.0% Added 14% $498,192 3,164,127
13 Teradata Corporation TDC
3.0% Added 4% $492,599 7,228,162 14 LAS VEGAS SANDS CORP LVS
2.8% Cut -17% $465,345 8,083,114
15 Cognizant Tech Solutions CTSH
2.7% Cut -12% $447,132 5,810,687 16 Crown Castle Intl CCI
2.7% Cut -22% $439,368 8,237,127
17 Express Scripts Inc. ESRX
2.5% Cut -45% $410,378 7,574,345 18 Oceaneering Intl OII
2.5% Cut -4% $404,051 7,497,700
19 AutoZone Inc. AZO
2.4% New $395,781 1,064,500 20 TransDigm Group TDG
2.4% Added 7% $385,696 3,331,859
21 Wyndham Worldwide WYN
1.9% Cut -18% $314,806 6,768,567 22 Gap Inc. GPS
1.8% New $293,055 11,210,965
23 Lululemon Athletica Inc. LULU
1.7% Cut -16% $284,639 3,808,895 24 Green Mountain Coffee GMCR
1.7% Added 115% $280,406 5,986,474
25 New Oriental Education EDU
1.6% Cut -2% $268,180 9,766,210 26 Walt Disney Co. DIS
1.6% New $257,987 5,892,808
27 WABCO Holdings Inc. WBC
1.5% Cut -15% $252,222 4,170,336 28 Fossil, Inc. FOSL
1.5% Cut -37% $248,795 1,885,095
29 MICHAEL KORS KORS
1.5% Added 44% $245,059 5,259,900 30 Ross Stores Inc. ROST
1.4% New $231,081 3,977,296
31 Liberty Media Corp LMCA
1.2% Unchanged $199,507 2,263,262 32 Sensata Technologies ST
1.2% Cut -4% $197,962 5,912,845
33 BE Aerospace Inc. BEAV
1.2% New $197,950 4,259,738 34 Estee Lauder EL
1.2% New $195,956 3,163,643
35 V.F. Corporation VFC
1.2% Cut -3% $192,803 1,320,750 36 W.R. Grace & Co. GRA
1.2% Added 68% $192,562 3,331,525
37 Accretive Health, Inc. AH
1.1% Cut -2% $176,984 8,862,492 38 KINDER MORGAN KMI
1.0% Added 130% $163,856 4,239,475
39 Ulta Salon ULTA
0.8% New $123,568 1,330,266 40 Sears Holdings Corp SHLD PUT 0.7% Added 40% $121,443 1,833,100 41 Banco Santander BSBR
0.7% New $114,806 12,519,785
42 Ctrip.com International CTRP
0.7% Cut -44% $113,401 5,240,339 43 VanceInfo Technologies VIT
0.6% Cut -3% $91,717 7,617,690
44 Owens Corning OC
0.5% New $89,597 2,486,720 45 Wynn Resorts Ltd. WYNN
0.5% New $86,817 695,207

10
Next Page: Appaloosa Management
First Quarter 2012 Portfolio: …Continued
Lone Pine Capital
Q1 2012 www.hedgefundwisdom.com
Rank Company Name Ticker Put/Call % of Portfolio Activity
Value x $1000 # of Shares
46 MedcoHealth MHS CALL 0.5% Unchanged $77,330 1,100,000 47 TRIPADVISOR TRIP
0.4% New $66,546 1,865,613
48 iPath S&P 500 VIX VXX PUT 0.3% Cut -67% $53,698 3,200,000 49 Ariba Inc. ARBA
0.3% New $50,839 1,554,231
50 Weyerhaeuser Co. WY PUT 0.3% New $47,566 2,170,000 51 ISOFTSTONE HOLDINGS ISS
0.3% Unchanged $46,391 5,253,739
52 Intel Corporation INTC PUT 0.2% Unchanged $26,569 945,000 53 Tractor Supply Company TSCO
0.1% New $21,492 237,326
54 7 Days Group Holdings SVN
0.1% Cut -19% $13,888 1,108,375 55 China Lodging Group HTHT
0.1% Cut -44% $11,110 950,364
56 Baidu, Inc. BIDU
Sold
- 57 ARCOS DORADOS ARCO
Sold
-
58 eBay Inc. EBAY
Sold
- 59 Willis Group Holdings WSH
Sold
-
60 Tesla Motors, Inc. TSLA PUT
Sold
- 61 FMC Technologies, Inc. FTI
Sold
-
62 Home Inns & Hotels HMIN
Sold
- 63 Green Mountain Coffee GMCR CALL
Sold
-
64 NetApp, Inc. NTAP
Sold
- 65 Williams-Sonoma Inc. WSM
Sold
-
66 Ameriprise Financial Inc. AMP
Sold
- 67 YANDEX N V YNDX
Sold
-
68 News Corp. NWSA
Sold
- 69 Fossil, Inc. FOSL CALL
Sold
-
70 SolarWinds, Inc. SWI
Sold
- 71 Bed Bath & Beyond, Inc. BBBY PUT
Sold
-
72 NetApp, Inc. NTAP CALL
Sold
-

11
Key Takeaways
2%3'4"$565"#$-',#=&01A?0&1!TTT!'TTT)!
<454$0#H+!'<)!
"##$%&!'"((")!
TH?%3#EE!'T<(@)!
G0#?93#E!'G6<@)!
K#09!@#5#0!'K)!
RH>51E?>!'RJL)!
G?>U!#V!*E&043?!'G*<)!
I&%5?!*40!-4>&1!'I*-)!
R?05V#09!K4>?>34?%!'R;")!
"&>&0?%!@#5#01!'"@)!
(=&>1!<#0>4>$!'(<)!
.@<!'.@<)!
@?0:&%%!8&3A>#%#$C!'@6D-)!
2?>I41U!'2LIB)!
KH14#>W;(!'K;()!
8=#!R?0X#01!'8N()!
LH?>3&!<#EEH>43?54#>1!'LJ*L)!
2,I6!2Y,!Z[[!'2,P)!
!
."/,'!"89/%6%/)':&6':;-'G#15#>!234&>54V43!'G27)!
View Appaloosa Management’s Updated Portfolio on the Next Page
After largely selling a lot of names for the past two quarters, David Tepper’s hedge fund firm Appaloosa Management waded into the buying pool in the new year. In fact, Appaloosa only completely exited one name: Boston Scientific (BSX). Tepper’s latest portfolio activity can be easily summarized with one word: technology. Last quarter’s issue highlighted how Tepper’s firm had almost quadrupled its stake in Apple (AAPL). Well, the hedge fund was out buying even more shares in the first quarter, boosting its position size by 277%. At the end of the quarter, AAPL was their second largest disclosed holding. But if you
David Tepper
Has compounded 30% for investors over 17 years
Takes concentrated positions in
distressed debt & equity
Profiled in the new book: The Alpha Masters
Q1 2012 www.hedgefundwisdom.com
examine their portfolio closer, you’ll see that they technically have even more gross exposure to AAPL. Appaloosa started a massive new stake in the PowerShares QQQ (QQQ) during the first quarter, bringing it all the way up to their top holding as they allocated over $1.2 billion to the exchange traded fund. Examining the QQQ’s top ten holdings, you’ll see that its top holding is Apple at 18.57% of the index. The exact same thing can be said about Appaloosa’s gross exposure to Google (GOOG) as well. While they bought the stock outright in the quarter (new position), Google is also 5.5% of the QQQ. Lastly, they gained a lot of exposure to Qualcomm (QCOM) the same way: buying the stock outright and then via the QQQ’s 3.82% allocation to the company.
So while Tepper was out buying technology in size during the first quarter, his purchases in the financial sector weren’t far behind. Citigroup (C) garnered the most capital from the hedge fund in the sector as this new position is now Appaloosa’s third largest disclosed holding. They also decided to allocate capital to Bank of America (BAC) as well.
The last major takeaway here is that Appaloosa Management was also out buying airlines in size during the quarter. They increased their United Continental (UAL) stake by 571%, US Airways (LCC) position by 229%, and started a new stake in Delta Air Lines (DAL).
For an in-depth look at Appaloosa, David Tepper is profiled and interviewed in the new book The Alpha Masters along with numerous other famous hedge fund managers, so definitely check it out.
Appaloosa Management

12 Q1 2012 www.hedgefundwisdom.com
Appaloosa Management
Continued on next page…
First Quarter 2012 Portfolio:
Rank Company Name Ticker Put/Call % of Portfolio Activity
Value x $1000 # of Shares
1 PowerShares QQQ QQQ
31.4% New $1,273,602 18,854,218 2 Apple Inc. AAPL
10.1% Added 277% $410,637 685,000
3 Citigroup, Inc. C
5.5% New $222,747 6,094,305 4 United Continental UAL
4.2% Added 571% $171,313 7,968,035
5 Google Inc. GOOG
2.6% New $103,969 162,137 6 QUALCOMM Incorporated QCOM
2.5% New $102,947 1,513,486
7 Goodyear Tire & Rubber Co. GT
2.4% Added 43% $97,070 8,651,496 8 Broadcom Corp. BRCM
2.3% New $95,009 2,417,523
9 CVR Energy, Inc. CVI
2.1% Cut -36% $85,865 3,209,911 10 Ford Motor Co. F
2.0% New $81,631 6,535,715
11 US Airways Group, Inc. LCC
2.0% Added 229% $80,888 10,657,243 12 Huntsman Corporation HUN
1.8% New $71,980 5,137,764
13 Bank of America Corp BAC
1.8% New $71,358 7,456,408 14 Oracle Corp. ORCL
1.7% Added 92% $68,056 2,333,883
15 Delta Air Lines Inc. DAL
1.7% New $66,795 6,740,189 16 Financial Select Sector XLF
1.6% Added 96% $66,532 4,216,200
17 Valero Energy Corp. VLO
1.6% Added 181% $65,769 2,552,161 18 Hartford Financial HIG
1.5% New $60,199 2,855,744
19 General Motors GM
1.4% New $56,485 2,202,153 20 Masco Corporation MAS
1.4% Added 2755% $55,502 4,151,256
21 Dean Foods Co. DF
1.3% Cut -28% $53,612 4,427,112 22 Owens Corning OC
1.3% New $52,938 1,469,279
23 EMC Corporation EMC
1.2% New $49,011 1,640,261 24 RBS Pfd N RBS-PN
1.2% Cut -13% $47,108 2,915,072
25 Marvell Technology MRVL
1.0% New $41,378 2,630,524 26 Microsoft Corporation MSFT
1.0% Added 72% $40,313 1,250,000
27 RBS Pfd S RBS-PS
0.9% Cut -2% $35,663 2,135,514 28 Calumet Specialty Products CLMT
0.8% Unchanged $34,054 1,288,944
29 SanDisk Corp. SNDK
0.8% New $33,772 681,021 30 FUSION-IO FIO
0.8% New $32,782 1,153,879
31 RBS Pfd T RBS-PT
0.8% Cut -10% $32,775 1,725,014 32 Mueller Water Products MWA
0.8% Unchanged $31,441 9,441,736
33 Two Harbors Investment TWO
0.8% New $30,420 3,000,000 34 RBS Pfd Q RBS-PQ
0.6% Cut -8% $24,943 1,468,102
35 Nuance Communications NUAN
0.6% New $24,093 941,869 36 SPDR S&P 500 SPY
0.5% New $21,682 154,079
37 RBS Pfd M RBS-PM
0.5% Cut -3% $21,457 1,305,196 38 International Paper Co. IP
0.5% Cut -24% $19,350 551,287
39 Macy's, Inc. M
0.5% Cut -37% $18,554 467,001 40 Hartford Financial Warrant HIG/WS
0.4% Unchanged $16,989 1,275,475
41 CF Industries Holdings, Inc. CF
0.3% Added 41% $12,663 69,332 42 Chimera Investment Corp CIM
0.3% New $12,505 4,418,884
43 RBS Pfd L RBS-PL
0.3% Cut -19% $10,872 582,962 44 MPG Office Trust, Inc. MPG
0.3% Unchanged $10,044 4,292,354
45 MFA Financial, Inc. MFA
0.2% New $7,691 1,029,583

13
Q1 2012 www.hedgefundwisdom.com
Appaloosa Management First Quarter 2012 Portfolio: …Continued
Next Page: Pershing Square
Rank Company Name Ticker Put/Call % of Portfolio Activity
Value x $1000 # of Shares
46 DELPHI DLPH
0.2% Unchanged $7,244 229,236 47 Boyd Gaming Corp. BYD
0.1% New $5,456 695,975
48 DowJonesConstruction ITB
0.1% New $4,734 321,595 49 NetApp, Inc. NTAP
0.1% New $4,477 100,000
50 General Motors Warrant GM/WS/A
0.1% Unchanged $2,920 175,561 51 General Motors Warrant GM/WS/B
0.1% Unchanged $1,966 175,561
52 Beazer Homes USA Inc. BZH
0.0% Unchanged $931 286,614 53 Oracle Corp. ORCL CALL 0.0% New $189 20,100 54 Boston Scientific Corp BSX
Sold
-

14
View Pershing Square’s Updated Portfolio on the Next Page
Key Takeaways '2%3'4"$565"#$-'>M?!
'."/,'!"89/%6%/)':&6':;-'\F<F!,&>>&C!'\<,)!<?%%1!
Bill Ackman’s Pershing Square did practically no buying during the first quarter and the only notable activity from this hedge fund came on the selling side. Pershing sold 27% of its stake in Kraft (KFT), which is interesting considering that there’s a catalyst on the horizon as the company will be splitting up later into a North American grocer specialist and an emerging snacks business.
Ackman also cut his stake in Fortune Brands Home & Security (FBHS) by 36% during the first quarter. And in a recent 13G filed with the SEC in early May, Pershing has actually disclosed that they no longer own a stake in FBHS at all. This company came to be as a result of Fortune Brands’ split into FBHS and Beam Inc (BEAM). It’s worth noting that Pershing continues to hold a sizable chunk of BEAM as they clearly favor one split entity over the other.
The biggest sale Ackman made in the quarter, though, involved his stake in Family Dollar (FDO). He drastically reduced his position by almost 70%. And again, by way of recent 13G filed with the SEC, Ackman has actually disclosed that he no longer owns FDO as of the middle of May.
The Pershing Square founder also recently gave a presentation at the Ira Sohn Conference in New York where he touched on
his investment in J.C. Penney (JCP). He says that the best ideas are often contrarian, just like his old play of buying GGP right before bankruptcy and his short of MBIA back in the day. JCP’s recent comps came out worse than expected but Ackman says the company is still moving ahead with the turnaround and that the customer is starting to understand the process. Ackman tried to focus on the cost savings, saying JCP spends 31% on SG&A while Kohl’s (KSS) spends only about 21%. Comparing ads, Ackman points to JCP spending 6% of revenue on ads while KSS only 4.5%. He said, “Not a lean company trying to cut costs, they are running fat.” He also pointed out that at JCP, employees used 20% of corporate bandwidth for Netflix and need to re-focus.
In general, Ackman’s thesis on J.C. Penney is that you can invest in a cyclically depressed national retailer at a discount to fair value. Here are some excerpts from Ackman’s presentation: “Cheap relative to trailing earnings (adjusted for year end cash and non-store real estate portfolio … Sales productivity and margins remain depressed creating material leverage to a recovery … Company’s reported pension expense masks true cash flow … JCP owns substantial core and non-core fee and long-term leasehold real estate interests.”
Ackman has also been involved with Justice Holdings, a specialty purpose acquisition company (SPAC) that recently took a stake in Burger King with plans to bring the company public again.
The brand new book The Alpha Masters features an in-depth profile of Ackman along with many other managers this newsletter covers and it’s definitely a must-read.
View a profile of Pershing Square
Subject of the book Confidence
Game: How a Hedge Fund Manager Called Wall Street’s Bluff
Bill Ackman
Q1 2012 www.hedgefundwisdom.com
Pershing Square Capital

15
Pershing Square
Next Page: Maverick Capital
First Quarter 2012 Portfolio:
Q1 2012 www.hedgefundwisdom.com
Rank Company Name Ticker Put/Call % of Portfolio Activity
Value x $1000 # of Shares
1 Canadian Pacific Rail CP
22.7% Added 0% $1,834,943 24,159,888 2 J. C. Penney Company JCP
17.2% Added 1% $1,384,454 39,075,771
3 General Growth Properties GGP
15.2% Unchanged $1,227,250 72,233,712 4 Beam, Inc. BEAM
15.1% Unchanged $1,219,342 20,818,545
5 Citigroup, Inc. C
11.8% Added 0% $954,854 26,124,594 6 Kraft Foods Inc. KFT
7.3% Cut -27% $589,390 15,506,172
7 FortuneBrands Home&Security FBHS
3.6% Cut -36% $294,044 13,323,249 8 Howard Hughes Corporation HHC
2.8% Unchanged $227,889 3,568,017
9 Alexander & Baldwin, Inc. ALEX
2.2% Added 2% $176,594 3,644,870 10 Family Dollar Stores Inc. FDO
2.1% Cut -69% $165,468 2,614,863
11 J. C. Penney Company, Inc. JCP CALL
Sold
-

16
Lee Ainslie’s Maverick Capital was out trimming quite a few positions by the end of the first quarter. One theme that’s quite evident is their desire to reduce financials exposure. They sold 72% of their massive stake in JPMorgan Chase (JPM) during the quarter. And even after that, it’s still their seventh largest holding. But they also completely exited shares of US Bancorp (USB), Wells Fargo (WFC), and sold almost 90% of their Citigroup (C) stake. The wave of selling literally affected Maverick’s top
Key Takeaways !
2%3'4"$565"#$-'2UC=#0U1!2#%H54#>1!'2NB2)!
@?3CO1!'@)!
,043&%4>&F3#E!',<-L)!
I40&38D!'I8D)!
D?%&?>5!,A?0E?3&H543?%1!'D67)!
./+0&11!2304+51!'.267)!
"0&&>!@#H>5?4>!<#VV&&!'"@<6)!
K#E&>5#!.3#>!'K@7)!
-4X&05C!"%#X?%!'-G8P*)!
2&?01!R#%94>$1!'2R-I)!
*&5>?!'*.8)!
RY6!G%#3U!'R6G)!
!
."/,'!"89/%6%/)':&6':;-'J2!G?>3#0+!'J2G)!
@?0:&%%!8&3A>#%#$C!'@6D-)!
N&%%1!K?0$#!'NK<)!
*E?]#>F3#E!'*@SL)!
K4015!2#%?0!'K2-6)!
R#E&!;>>1!Y!R#5&%1!'@;L)!
*+#%%#!"0#H+!'*,(-)!
<#0>4>$!'"-N)!
804>?!2#%?0!'82-)!
R<*!'R<*)!
G?>3#!2?>5?>9&0W<A4%&!'G2*<)!
6#C?%!G?>U!#V!23#5%?>9!,0&V&00&91!!
thirteen disclosed holdings. Last quarter, Tyco (TYC) and Corning (GLW) were Maverick’s top two disclosed positions. This time around, both are nowhere to be found in their top 20 holdings. Maverick dumped its GLW position entirely and sold 82% of its TYC stake after buying it hand over fist the past two quarters.
After all the selling in the first quarter, Maverick’s top five holdings are now Cigna (CI), Avago Technologies (AVGO), Qualcomm (QCOM), Apple (AAPL), and Google (GOOG). The last two were consensus buys among hedge funds profiled in this issue (even though Ainslie’s firm was reducing their stakes in each).
The hedge fund had a rough 2011 and Ainslie addressed this in his year-end letter to investors, writing: “While the environment for fundamental investing was certainly unfavorable last year, such factors do not fully account for our results. Maverick’s poor performance was primarily driven by a handful of individual mistakes and insufficient risk constraints.” In order to address risk management, they’ve implemented MavRank, a quantitative system driven by fundamental inputs that helps make recommendations for position sizing. The manager also touched on the investment environment, writing, “(Last year) stocks moved in tandem with one another to a degree never before seen and were less responsive to idiosyncratic risks, such as fundamental factors, than ever before … equities have maintained correlation above the long-term average for almost six years now, creating a sustained, unfavorable headwind for fundamental investors.”
View Maverick Capital’s Updated Portfolio on the Next Page
Lee Ainslie
Q1 2012 www.hedgefundwisdom.com
Maverick Capital 14.0% annualized returns since
inception in 1995
Compares a company’s enterprise value to sustainable free cash flow
View a profile of Maverick Capital

17
Maverick Capital First Quarter 2012 Portfolio:
Continued on next page…
Q1 2012 www.hedgefundwisdom.com
Rank Company Name Ticker Put/Call % of Portfolio Activity
Value x $1000 # of Shares
1 CIGNA Corporation CI
4.6% Cut -49% $321,728 6,532,539 2 Avago Technologies AVGO
4.5% Cut -41% $314,147 8,061,247
3 QUALCOMM QCOM
4.5% Cut -11% $311,357 4,574,744 4 Apple Inc. AAPL
4.4% Cut -63% $308,608 514,733
5 Google Inc. GOOG
4.0% Cut -3% $279,786 436,320 6 CareFusion Corp CFN
3.2% Cut -46% $220,962 8,521,463
7 JPMorgan Chase & Co. JPM
3.1% Cut -72% $214,971 4,675,308 8 CVS Caremark CVS
3.1% Cut -16% $213,718 4,770,502
9 Endo Pharma ENDP
3.1% Cut -7% $213,357 5,508,833 10 McKesson Corporation MCK
3.1% Cut -51% $213,615 2,433,806
11 YOUKU.COM INC. YOKU
2.9% Cut -50% $203,918 9,273,198 12 Sara Lee Corp. SLE
2.9% Cut -58% $203,292 9,442,246
13 Pfizer Inc. PFE
2.4% Cut -60% $163,647 7,226,628 14 Skyworks Solutions Inc. SWKS
2.3% New $161,684 5,847,539
15 Dollar General Corp DG
2.3% Cut -37% $161,540 3,496,541 16 Macy's, Inc. M
1.9% New $130,824 3,292,818
17 Amdocs Ltd. DOX
1.9% Cut -68% $130,621 4,136,208 18 Priceline.com Inc PCLN
1.8% New $126,926 176,900
19 Credicorp Ltd. BAP
1.8% Cut -20% $121,654 922,880 20 DIRECTV DTV
1.7% New $120,108 2,434,300
21 NetApp, Inc. NTAP
1.7% Cut -81% $118,646 2,650,118 22 Tyco International Ltd. TYC
1.7% Cut -82% $118,860 2,115,703
23 Oracle Corp. ORCL
1.7% Cut -26% $118,877 4,076,728 24 Valeant Pharma VRX
1.7% New $116,720 2,175,793
25 Avery Dennison Corp AVY
1.7% Cut -63% $115,464 3,832,190 26 TransDigm Group TDG
1.6% Cut -16% $113,113 977,138
27 Express Scripts Inc. ESRX
1.6% New $112,539 2,077,140 28 Green Mountain Coffee GMCR
1.5% New $107,381 2,292,500
29 GROUPON INC GRPN
1.5% Unchanged $104,729 6,331,120 30 Aeropostale, Inc. ARO
1.5% Cut -65% $102,536 4,742,623
31 SLM Corporation SLM
1.4% Cut -76% $99,771 6,330,638 32 Fomento Econ FMX
1.4% New $98,659 1,199,215
33 News Corp. NWSA
1.4% Cut -74% $96,965 4,919,590 34 Comcast Corporation CMCSA
1.4% Cut -68% $96,943 3,230,372
35 Owens Corning OC
1.1% Cut -73% $75,864 2,105,582 36 Liberty Global Inc. LBTYA
1.1% New $73,202 1,461,709
37 Sears Holdings SHLD
1.0% New $72,395 1,092,755 38 Anheuser-Busch InBev BUD
1.0% Cut -25% $66,289 911,568
39 Citigroup, Inc. C
0.9% Cut -89% $60,266 1,648,854 40 Comcast Corporation CMCSK
0.8% Cut -78% $58,267 1,974,497
41 CognizantTechSolutions CTSH
0.8% Cut -55% $56,579 735,265 42 Aetna Inc. AET
0.8% New $56,652 1,129,430
43 Progressive Corp. PGR
0.8% Cut -86% $56,245 2,426,447 44 Teradata Corporation TDC
0.8% Cut -81% $55,005 807,120
45 Sirona Dental Systems SIRO
0.8% Cut -70% $55,236 1,071,713

18
Next Page: Third Point
First Quarter 2012 Portfolio: …Continued
Maverick Capital
Q1 2012 www.hedgefundwisdom.com
Rank Company Name Ticker Put/Call % of Portfolio Activity
Value x $1000 # of Shares
46 H&R Block, Inc. HRB
0.8% New $53,531 3,250,208 47 DaVita, Inc. DVA
0.8% New $52,805 585,616
48 Citrix Systems, Inc. CTXS
0.7% New $49,682 629,598 49 Family Dollar Stores FDO
0.6% New $42,569 672,712
50 Urban Outfitters Inc. URBN
0.6% Cut -91% $38,553 1,324,400 51 J. C. Penney Co JCP
0.5% Cut -75% $35,044 989,118
52 CARBO Ceramics Inc. CRR
0.5% New $32,186 305,223 53 Six Flags Entertainment SIX
0.4% Cut -51% $29,246 625,315
54 Capital One Financial COF
0.4% Cut -78% $28,781 516,348 55 Ironwood Pharma IRWD
0.4% Cut -50% $27,974 2,101,695
56 HSN, Inc. HSNI
0.3% Cut -60% $20,866 548,679 57 Caribou Coffee Co CBOU
0.3% Add 206% $18,786 1,007,828
58 Sanderson Farms, Inc. SAFM
0.3% Cut -50% $17,558 331,088 59 China Lodging Group HTHT
0.3% Cut -55% $17,086 1,461,549
60 RENREN INC RENN
0.2% New $16,940 3,068,829 61 BANKRATE INC RATE
0.2% Cut -50% $14,869 600,764
62 TriQuint Semi TQNT
0.2% New $14,466 2,097,981 63 SolarWinds, Inc. SWI
0.2% New $13,874 358,968
64 Pacific Biosciences PACB
0.2% Cut -50% $12,118 3,543,333 65 BRIGHTCOVE INC BCOV
0.2% New $11,210 502,252
66 RBSPfd Q RBS-PQ
0.2% Cut -79% $11,180 658,031 67 Signet Jewelers Limited SIG
0.2% Cut -74% $10,678 225,840
68 RBS Pfd M RBS-PM
0.2% Cut -58% $10,634 646,839 69 RBS Pfd S RBS-PS
0.1% Cut -84% $7,671 459,329
70 MEDLEY CAPITAL MCC
0.1% Cut -59% $7,747 687,420 71 Bluefly Inc. BFLY
0.1% Cut -50% $6,853 3,704,101
72 Wet Seal Inc. WTSLA
0.1% Cut -58% $6,059 1,756,106 73 icad Inc. ICAD
0.0% Cut -62% $80 184,141
74 RBS Pfd N RBS-PN
Sold
- 75 Banco Santander-Chile BSAC
Sold
-
76 RBS Pfd T RBS-PT
Sold
- 77 HCA HLDGS HCA
Sold
-
78 Trina Solar Ltd. TSL
Sold
- 79 Par Pharma PRX
Sold
-
80 ETFS Physical Platinum PPLT
Sold
- 81 U.S. Bancorp USB
Sold
-
82 Marvell Technology MRVL
Sold
- 83 Wells Fargo & Co WFC
Sold
-
84 Amazon.com Inc. AMZN
Sold
- 85 Corning Inc. GLW
Sold
-
86 Apollo Group Inc. APOL
Sold
- 87 Home Inns & Hotels HMIN
Sold
-
88 First Solar, Inc. FSLR
Sold
- 89 Yingli Green Energy YGE
Sold
-
90 Citigroup Dividend C/PH
Sold
- 91 AMBEV ABV
Sold
-
92 Cardiovascular Systems CSII
Sold
- 93 Las Vegas Sands LVS
Sold
-

19
Third Point continues to lead the activist charge in Yahoo! (YHOO) and they were out buying even more shares in the first quarter. Third Point won their proxy contest and ousted the CEO. But now the problem still remains: how do you fix the company?
Loeb’s firm started a sizable new position in Apple (AAPL) during the first quarter. He purchased shares at $445 and wrote his thoughts on the company in his Q1 letter: “Currently, Apple is trading at 13.4x CY2012 EPS of $45, and 11.6x CY2013 EPS of $52 … Adjusting for cash, Apple’s valuation drops to 11.1x CY2012 EPS and 9.6x C2013, leaving it inexpensive relative to the S&P 500.” He points to the product ‘halo’ effect as more users become entrenched in the company’s operating system as well as growth in China as key drivers
Key Takeaways
2%3'4"$565"#$-'I&%+A4!'I-,R)!^!#=>&9!+0&W;,(!
*++%&!'**,-)!
J>45&9!8&3A>#%#$4&1!'J87)!
"##$%&!'"((")!
./+0&11!2304+51!'.267)!
K?E4%C!I#%%?0!'KI()!
<?+45?%!(>&!'<(K)!
<413#!2C15&E1!'<2<()!
*X&030#EX4&!Y!K453A!'*LK)!
N&%%1!K?0$#!'NK<)!
8&0?9C>&!'8.6)!
,4#>&&0!L?5H0?%!6&1#H03&1!',7I)!
I&:#>!.>&0$C!'IDL)!
!
."/,'!"89/%6%/)':&6':;-'G4$!-#51!'G;")!
,%?4>1!./+%#0?54#>!',7,)!
-4X&05C!;>5&0?354:&!'-;L8*)!
./+&94?!'.7,.)!
2H>#3#!'2JL)!
2UC=#0U1!2#%H54#>1!'2NB2)!
L&=&%%!6HXX&0E?49!'LN-)!
going forward. Third Point also started new stakes in
Medco Health and Express Scripts (ESRX) during the quarter, playing the merger arbitrage. Express Scripts received regulatory approval to acquire Medco and the deal went through. Post-merger, Loeb continues to like the combined entity, writing, “Based on our analysis of the combined MHS/ESRX entity, we believe that Express Scripts remains an attractive investment candidate, combining 15+% EPS growth, the opportunity for accelerated synergy realization, and a reasonable forward PE multiple (13x 2013 EPS).”
The hedge fund continued to add to its position in Sara Lee (SLE) during the quarter. This should come as no surprise given the catalysts ahead. The company has announced a special dividend of $3 per share after the tea & coffee division is spun-off in June. Existing shareholders of SLE will receive shares in the new company, which plans to list in the Netherlands.
When viewing Third Point’s equity portfolio on the next page, just remember they also invest in debt and other asset classes as well. Third Point’s actual top five holdings as of the end of April are: Yahoo (YHOO), gold, Delphi (DLPH), Apple (AAPL), and Eksportfinans ASA. Also, Delphi shows up as a ‘new’ stake on the next page, but that’s only because the company completed its IPO. In reality, Third Point owned it beforehand.
Loeb is also profiled in the excellent new book The Alpha Masters along with numerous other top managers.
View Third Point’s Updated Portfolio on the Next Page
Dan Loeb
Q1 2012 www.hedgefundwisdom.com
Third Point Offshore fund has returned 18.4% annualized since inception
Focuses on event-driven and
distressed plays
View his recommended reading list

20
Third Point First Quarter 2012 Portfolio:
Continued on next page…
Q1 2012 www.hedgefundwisdom.com
Rank Company Name Ticker Put/Call % of Portfolio Activity
Value x $1000 # of Shares
1 Yahoo! Inc. YHOO
26.42% Add 26% $1,073,016 70,500,400 2 DELPHI DLPH
10.29% New $417,990 13,339,711
3 Sara Lee Corp. SLE
5.45% Add 32% $221,221 10,275,000 4 Apple Inc. AAPL
5.34% New $217,037 362,000
5 United Technologies UTX
4.49% New $182,468 2,200,000 6 Google Inc. GOOG
4.42% New $179,547 280,000
7 Marvell Technology MRVL
3.58% Cut -8% $145,503 9,250,000 8 MedcoHealth Solutions MHS
3.46% New $140,600 2,000,000
9 Family Dollar Stores FDO
3.35% New $136,052 2,150,000 10 Capital One Financial COF
2.95% New $119,841 2,150,000
11 El Paso Corp. EP
2.91% Cut -28% $118,200 4,000,000 12 Cisco Systems, Inc. CSCO
2.60% New $105,750 5,000,000
13 Abercrombie & Fitch ANF
2.26% New $91,778 1,850,000 14 Wells Fargo & Co WFC
2.14% New $87,057 2,550,000
15 Teradyne Inc. TER
2.08% New $84,450 5,000,000 16 Express Scripts ESRX
2.00% New $81,270 1,500,000
17 Pioneer Natural PXD
1.79% New $72,534 650,000 18 Devon Energy Corp DVN
1.75% New $71,120 1,000,000
19 Weatherford WFT
1.71% New $69,414 4,600,000 20 DISH NETWORK DISH
1.62% Cut -50% $65,860 2,000,000
21 Ivanhoe Mines Ltd. IVN
1.26% New $51,155 3,250,000 22 Liberty Media LMCA
1.19% Added 10% $48,482 550,000
23 McKesson Corporation MCK
1.19% New $48,274 550,000 24 Teva Pharmaceutical TEVA
0.89% New $36,048 800,000
25 SPDR Gold Shares GLD
0.64% Unchanged $25,939 160,000 26 Goldman Sachs GS
0.61% Cut -33% $24,874 200,000
27 Genworth Financial Inc. GNW
0.51% Cut -29% $20,800 2,500,000 28 RBS Pfd T RBS-PT
0.45% New $18,335 965,000
29 Liberty Global Inc. LBTYA
0.44% New $17,964 358,700 30 Thoratec Corp. THOR
0.42% New $16,855 500,000
31 Mead Johnson Nutrition MJN
0.41% Cut -85% $16,496 200,000 32 Barrick Gold Corporation ABX
0.26% Adde49% $10,609 244,000
33 RBS Pfd S RBS-PS
0.25% New $10,020 600,000 34 Xerium Technologies Inc. XRM
0.22% Cut -20% $8,733 1,354,000
35 RBS Pfd Q RBS-PQ
0.22% New $9,005 530,000 36 RBS Pfd N RBS-PN
0.10% New $4,040 250,000
37 BioFuel Energy Corp. BIOF
0.09% Unchanged $3,626 5,578,800 38 RBS Pfd M RBS-PM
0.09% New $3,452 210,000
39 McKesson Corporation MCK CALL 0.04% New $1,512 500,000 40 KINDER MORGAN KMI CALL 0.04% New $1,625 2,500,000 41 RBS Pfd P RBS-PP
0.03% New $1,304 80,000
42 QUESTCOR PHARMA QCOR PUT 0.01% New $484 510,000 43 Qihoo 360 Technology QIHU PUT 0.01% New $458 228,900

21
Third Point
Next Page: Blue Ridge Capital
Q1 2012 www.hedgefundwisdom.com
First Quarter 2012 Portfolio: …Continued
Rank Company Name Ticker Put/Call % of Portfolio Activity
Value x $1000 # of Shares
44 Potash Corp POT
Sold
- 45 Newell Rubbermaid Inc. NWL
Sold
-
46 HOLLYFRONTIER HFC
Sold
- 47 Gilead Sciences Inc. GILD
Sold
-
48 Liberty Media Interactive LINTA
Sold
- 49 Crexus Investment Corp. CXS
Sold
-
50 MGIC Investment Corp. MTG
Sold
- 51 Gardner Denver Inc. GDI
Sold
-
52 ABRAXAS PETROLEUM AXAS
Sold
- 53 MEMC Electronic WFR
Sold
-
54 SanDisk Corp. SNDK
Sold
- 55 Big Lots Inc. BIG
Sold
-
56 Plains Exploration PXP
Sold
- 57 Celanese Corp. CE
Sold
-
58 FMC Corp. FMC
Sold
- 59 Williams Companies, Inc. WMB
Sold
-
60 GrafTech Intl GTI
Sold
- 61 WPX ENERGY INC WPX
Sold
-
62 SUNCOKE ENERGY SXC
Sold
- 63 ETRADE Financial ETFC
Sold
-
64 EAGLE ROCK ENERGY EROCW
Sold
- 65 Skyworks Solutions Inc. SWKS
Sold
-
66 Sunoco Inc. SUN
Sold
- 67 YPF S.A. YPF
Sold
-
68 Yahoo! Inc. YHOO CALL
Sold
- 69 Expedia Inc. EXPE
Sold
-
70 Diamond Foods, Inc. DMND PUT
Sold
-

22
Blue Ridge Capital made a few significant sells during the first quarter. They liquidated their longstanding position in Valeant Pharmaceuticals (VRX), previously their sixth largest holding. They also completely exited shares of Level 3 Communications (LVLT). While they expected the company to further its market position after the acquisition of Global Crossing, shares of LVLT largely haven’t done much. Additionally, they trimmed their previously largest holding, Range Resources, by 25% during the quarter. They still own it, though, as it’s now their tenth largest disclosed stake. The last stock worth highlighting on the selling side is NovaGold Resources (NG). Blue Ridge cut its position in half, which is intriguing when you consider that Seth Klarman’s Baupost Group was buying during the quarter. Not to mention, shares have slid even lower since the close of the quarter.
On the buying side of the equation, Blue Ridge ratcheted up their position in Apple
Key Takeaways
2%3'4"$565"#$-'804+*9:41#0!'86;,)!
@?054>!@?04&55?!'@-@)!
@43A?&%!B#01!'B(62)!
!
."/,'!"89/%6%/)':&6':;-'-&:&%!_!<#EEH>43?54#>1!'-D-8)!
@?0U&5!D&35#01!"#%9!@4>&01!'"I7)!
.3A#25?0!'2*82)!
D?%&?>5!,A?0E?3&H543?%1!'D67)!
;%%HE4>?!';-@L)!
,&>>C@?3!@#05$?$&!',@8)!
*E&043?>!<?+45?%!*$&>3C!'*"L<)!
L6"!.>&0$C!'L6")!
IH>U4>!G0?>91!'ILBL)!
BB6!'BB6)!
(AAPL) in a big way, almost doubling their position size. They’ve long been a holder of the stock, but they sold almost 70% of their position in the fourth quarter. They quickly changed their mind on that decision, bringing it back up to their top holding in the first quarter. The hedge fund also started three new stakes worth highlighting. TripAdvisor (TRIP) was spun-off from Expedia (EXPE) in the fourth quarter and John Griffin’s firm likes the newly separate company as they bought over 4.5 million TRIP shares. Michael Kors (KORS) completed its initial public offering (IPO) in the fourth quarter, but Blue Ridge waited until the first quarter to initiate a position in the name. Lastly, Martin Marietta (MLM) garnered new capital from the hedge fund as well. Regarding MLM, Tom Russo of Gardner, Russo, & Gardner recently made comments about the investment thesis on the company with Columbia Business School: “(Its) business, stone quarrying, tends toward natural monopolies. It is very expensive to haul stone on a truck and stone isn’t valuable enough to allow it to recoup shipping costs. Within 25 miles is about the only distance that you can draw from to get stone … so if you own a quarry in an urban region, you have a very valuable asset.”
As you’ll notice from their portfolio on the next page, Blue Ridge is one of the better hedge funds to track via 13F due to the lower amount of turnover. Many of the positions remain ‘unchanged’ from the prior quarter. John Griffin’s firm typically categorizes its investments into either a) time arbitrage (long-term investors) or b) catalyst driven.
View Blue Ridge Capital’s Updated Portfolio on the Next Page
Q1 2012 www.hedgefundwisdom.com
Blue Ridge Capital John Griffin
Classifies investments as catalyst driven or time arbitrage & previously
was Julian Robertson’s right-hand man
View his recommended reading list

23
Blue Ridge Capital First Quarter 2012 Portfolio:
Continued on next page…
Q1 2012 www.hedgefundwisdom.com
Rank Company Name Ticker Put/Call % of Portfolio Activity
Value x $1000 # of Shares
1 Apple Inc. AAPL
7.2% Added 92% $431,976 720,500 2 Priceline.com Inc PCLN
6.6% Unchanged $397,495 554,000
3 Amazon.com Inc. AMZN
5.8% Unchanged $352,751 1,741,896 4 Monsanto Co. MON
5.7% Unchanged $345,760 4,335,000
5 Google Inc. GOOG
5.5% Added 4% $333,445 520,000 6 JPMorgan Chase & Co. JPM
4.7% Added 43% $282,087 6,135,000
7 Netflix, Inc. NFLX
4.5% Unchanged $272,070 2,365,000 8 Sensata Technologies ST
4.4% Unchanged $263,655 7,875,000
9 Thermo Fisher Scientific TMO
4.4% Unchanged $262,731 4,660,000 10 Range Resources Corp RRC
4.1% Cut -25% $249,404 4,289,720
11 Liberty Global Inc. LBTYA
4.1% Added 1% $244,641 4,885,000 12 Lowe's Companies Inc. LOW
3.7% Unchanged $222,672 7,096,000
13 HCA HLDGS INC COM HCA
3.1% Added 14% $186,787 7,550,000 14 DOLLAR TREE STORES DLTR
3.0% Unchanged $181,421 1,920,000
15 TRIPADVISOR TRIP
2.8% New $166,757 4,675,000 16 Polo Ralph Lauren Corp. RL
2.7% Unchanged $162,999 935,000
17 VeriSign Inc. VRSN
2.5% Added 86% $148,031 3,860,000 18 Gilead Sciences Inc. GILD
2.4% Add 122% $145,114 2,970,000
19 SIRIUS XM Radio Inc. SIRI
2.4% Added 12% $143,197 61,990,000 20 MARTIN MARIETTA MLM
2.3% New $138,721 1,620,000
21 Delta Air Lines Inc. DAL
2.0% Unchanged $122,946 12,400,000 22 BlackRock, Inc. BLK
2.0% Unchanged $117,818 575,000
23 WABCO Holdings Inc. WBC
1.8% Added 27% $105,538 1,745,000 24 MICHAEL KORS KORS
1.7% New $103,663 2,225,000
25 TD AMERITRADE AMTD
1.6% Unchanged $96,825 4,905,000 26 United Continental UAL
1.4% Unchanged $86,982 4,045,678
27 Baidu, Inc. BIDU
1.4% Unchanged $82,724 567,500 28 Citigroup, Inc. C
1.3% Added 76% $81,141 2,220,000
29 YOUKU.COM INC. YOKU
1.3% Added 3% $79,164 3,600,000 30 MGIC Investment Corp. MTG
0.8% Unchanged $49,107 9,900,600
31 Xinyuan Real Estate XIN
0.8% Unchanged $47,723 13,752,933 32 YANDEX N V YNDX
0.7% Unchanged $44,067 1,640,000
33 NovaGold Resources Inc. NG
0.4% Cut -50% $25,830 3,597,500 34 Tesla Motors, Inc. TSLA
0.4% Unchanged $21,413 575,000
35 Ivanhoe Energy Inc. IVAN
0.3% Unchanged $16,784 15,985,000 36 JPMorgan Chase Warrants JPM/WS
0.2% Unchanged $12,484 933,000
37 AIG When Issued AIG/WS
0.2% Unchanged $12,236 1,150,000 38 PACIFIC BIOSCIENCES PACB
0.1% Unchanged $2,975 870,000
39 Northeast Bancorp NBN
0.0% Cut -27% $1,440 114,300

24
Next Page: Paulson & Co
First Quarter 2012 Portfolio: …Continued
Blue Ridge Capital
Q1 2012 www.hedgefundwisdom.com
Rank Company Name Ticker Put/Call % of Portfolio Activity
Value x $1000 # of Shares
40 Level 3 Communications LVLT
Sold
- 41 PennyMac Mortgage PMT
Sold
-
42 American Capital Agency AGNC
Sold
- 43 Gold Miners ETF GDX
Sold
-
44 NRG Energy, Inc. NRG
Sold
- 45 DUNKIN' BRANDS GROUP DNKN
Sold
-
46 Kohlberg Kravis Roberts KKR
Sold
- 47 GOLUB CAPITAL GBDC
Sold
-
48 Ivanhoe Mines Ltd. IVN
Sold
- 49 EchoStar Corp. SATS
Sold
-
50 Greenlight Capital Re GLRE
Sold
- 51 Valeant Pharmaceuticals VRX
Sold
-
52 Dynegy Inc. DYN
Sold
- 53 East West Bancorp EWBC
Sold
-
54 ARCOS DORADOS ARCO
Sold
- 55 Illumina Inc. ILMN
Sold
-

25
John Paulson is profiled and interviewed in the new book, The Alpha Masters, a true must-read due to the unparalled access to numerous top managers the book provides. He also recently made an appearance at the Ira Sohn Conference in New York City where he presented three long ideas. The first of which, Caesars (CZR), was one he just started a position in during the first quarter. His thesis on buying the equity of this highly leveraged name is that he’s treating it essentially as a stock with a high option value. He says that common stock is only 7% of valuation and gets the upside as the company is turning around. Paulson argues the key to CZR could not only be gaming properties but social gaming, which could be worth $6-9, and online gaming could be worth $24 per share. The key is growth and he says the company is already seeing revenue per available room (RevPAR) growth. Paulson
Key Takeaways
2%3'4"$565"#$-'<?&1?01!'<S6)!
<#:494&>!'<(D)!
L#:&%%H1!'LD-2)!
*X#:&L&5!'*GD8)!
8A#E?1!Y!G&551!'8LG)!
D4?3#E!'D;*FG)!
TH&15!2#V5=?0&!'T2K8)!
!
."/,'!"89/%6%/)':&6':;-'80?>1#3&?>!'6;")!
<G!643A?09!.%%41!'<G")!
,A?0E?11&5!^!X#H$A5!#H5!
2#H5A&0>!J>4#>!^!X#H$A5!#H5!
NA40%+##%!'NR6)!
@#1?43!'@(2)!
G&?]&0!R#E&1!'GS@I)!
D?4%!6&1#051!'@8L)!
K&%<#0!-#9$4>$!'K<RW,*)!
points to CZR having no debt due until 2015 and he likes hotels because the rates increase with inflation. He argued the stock could have 10x upside.
His second idea at the conference was AngloGold Ashanti (AU), a position he’s held for a while now and one that’s currently his third largest disclosed long. Paulson says this play is pure gold upside and noted it’s been selling off much more than the price of gold as the correlation has broken down. While bears say to just buy the SPDR Gold Trust exchange traded fund (GLD), Paulson says you’re essentially paying more by doing that. He argues you’re buying the company at only $133 per proven reserves.
Paulson’s last idea at the Ira Sohn Conference was an arbitrage play (his specialty). He’s playing the CVR Energy (CVI) takeover by Carl Icahn and is tendering his shares into the offer. So if you buy shares at $30.35 and tender to the offer at $30, you’re only paying $0.35 for contingent cash payment rights (CCP). So if Icahn turns around and shops the company and sells it for $36.15, the CCP could be worth $6.15, which is a 17.6x return on the $0.35 paid initially.
Touching on some of Paulson’s first quarter portfolio activity, he was mainly out adding to risk arbitrage positions for takeovers (El Paso, Medco Health, AboveNet, etc). And after selling over 80% of his position in Transocean (RIG) in the fourth quarter, John Paulson completely liquidated the rest of his shares as RIG continued to trade lower.
View Paulson & Co’s Updated Portfolio on the Next Page
Q1 2012 www.hedgefundwisdom.com
Paulson & Co John Paulson
Predicted & profited from the subprime crisis; manages $35bn
Featured in the book The Greatest
Trade Ever
View an in-depth look at Paulson’s gold fund

26
Paulson & Co First Quarter 2012 Portfolio:
Continued on next page…
Q1 2012 www.hedgefundwisdom.com
Rank Company Name Ticker Put/Call % of Portfolio Activity
Value x $1000 # of Shares
1 SPDR Gold Shares GLD
18.7% Unchanged $2,806,452 17,310,952 2 DELPHI DLPH
9.6% Cut -12% $1,438,898 45,534,758
3 AngloGold Ashanti Ltd. AU
8.2% Cut -3% $1,224,358 33,162,460 4 Hartford Financial HIG
5.3% Added 0% $789,882 37,470,676
5 Mylan, Inc. MYL
3.8% Added 16% $574,605 24,503,400 6 MGM Resorts MGM
3.4% Added 1% $512,782 37,649,200
7 Anadarko Petroleum Corp APC
3.1% Cut -38% $468,657 5,982,345 8 Capital One Financial COF
3.0% Cut -14% $457,068 8,200,000
9 Motorola Mobility MMI
2.9% Unchanged $431,640 11,000,000 10 Baxter International Inc. BAX
2.2% Added 89% $322,812 5,400,000
11 CNO FINL GROUP NOTE CNO
2.1% Unchanged $312,462 199,976,000 12 MedcoHealth Solutions MHS
1.9% Add 100% $281,200 4,000,000
13 Gold Fields Ltd. GFI
1.8% Cut -20% $262,121 18,857,600 14 AMC NETWORKS AMCX
1.7% Unchanged $256,623 5,750,000
15 JPMorgan Chase Warrant JPM/WS
1.7% Cut 0% $247,042 18,463,500 16 XL Group plc XL
1.6% Cut -34% $244,915 11,291,600
17 Life Technologies Corp LIFE
1.6% Added 2% $243,016 4,977,792 18 El Paso Corp. EP
1.6% Add 100% $236,400 8,000,000
19 NovaGold Resources Inc. NG
1.5% Added 39% $229,292 31,937,018 20 CNO Financial Group, Inc. CNO
1.2% Cut -1% $181,129 23,281,369
21 CAESARS Entertainment CZR
1.2% New $182,376 12,372,835 22 Goodrich Corp. GR
1.2% Unchanged $179,084 1,427,649
23 American Capital, Ltd. ACAS
1.1% Cut -43% $157,790 18,199,543 24 Bank of America Warrant BAC/WS/A
1.0% Added 0% $147,085 31,631,200
25 Scripps Networks SNI
1.0% Cut -23% $146,070 3,000,000 26 InterDigital, Inc. IDCC
0.9% Added 36% $139,440 4,000,000
27 SunTrust Banks, Inc. STI
0.9% Cut -52% $136,606 5,651,894 28 Popular Inc. BPOP
0.9% Unchanged $134,830 65,770,600
29 Rock-Tenn Co. RKT
0.9% Cut -37% $135,120 2,000,000 30 AngloGold Converts AU/PA
0.9% Unchanged $131,092 3,043,000
31 MetLife, Inc. MET
0.9% Cut -21% $129,402 1,829,782 32 Wells Fargo & Company WFC
0.8% Unchanged $119,183 3,491,000
33 Ralcorp Holdings Inc. RAH
0.7% Unchanged $111,135 1,500,000 34 Covidien plc COV
0.7% New $98,424 1,800,000
35 Novellus Systems, Inc. NVLS
0.7% New $99,820 2,000,000 36 Family Dollar Stores Inc. FDO
0.6% Unchanged $94,920 1,500,000
37 Capital One Warrants COF/WS
0.6% Unchanged $91,109 3,992,520 38 GRIFOLS, S.A. GRFS
0.6% Cut -1% $86,396 11,205,745
39 AboveNet, Inc. ABVT
0.6% New $82,800 1,000,000 40 Randgold Resources Ltd. GOLD
0.6% Cut -1% $81,866 930,502
41 Howard Hughes Corp HHC
0.5% Cut -25% $75,367 1,180,000 42 Thomas & Betts Corp. TNB
0.5% New $71,910 1,000,000
43 GENON ENERGY INC GEN
0.4% Add 565% $65,670 31,571,989 44 Boise Inc. BZ
0.4% Cut 0% $57,604 7,016,300
45 IAMGOLD Corp. IAG
0.3% Added 40% $51,590 3,881,900 46 Viacom Inc 6.85% Pfd VIAB
0.3% New $47,460 1,000,000
47 Quest Software Inc. QSFT
0.3% New $46,540 2,000,000 48 AbitibiBowater Inc. ABH
0.3% Cut -30% $47,124 3,300,000
49 Gaylord Entertainment Co. GET
0.3% New $41,888 1,360,000 50 Barrick Gold Corporation ABX
0.3% Cut -1% $39,784 915,000

27
First Quarter 2012 Portfolio: …Continued
Paulson & Co
Q1 2012 www.hedgefundwisdom.com
Rank Company Name Ticker Put/Call % of Portfolio Activity
Value x $1000 # of Shares
51 HCA HLDGS INC COM HCA
0.3% New $39,584 1,600,000 52 United Rentals, Inc. URI
0.2% Unchanged $35,809 834,900
53 Agnico-Eagle Mines Ltd. AEM
0.2% Cut -1% $33,934 1,016,600 54 Allied Nevada Gold Corp. ANV
0.2% New $32,807 1,008,521
55 Walter Energy, Inc. WLT
0.2% Unchanged $29,605 500,000 56 POST HOLDINGS INC POST
0.2% New $27,342 830,300
57 Medicis Pharmaceutical MRX
0.2% Unchanged $25,614 681,400 58 International Tower Hill THM
0.2% Cut -1% $21,894 5,103,500
59 STATE BANK FINANCIAL STBZ
0.2% Cut -35% $22,101 1,262,200 60 FelCor Lodging Trust Inc. FCH
0.1% Unchanged $20,520 5,700,000
61 Prestige Brands Holdings PBH
0.1% New $17,480 1,000,000 62 Tenet Healthcare Corp. THC
0.1% Cut -73% $14,337 2,700,000
63 RBS Pfd N RBS-PN
0.1% Added 10% $13,259 820,490 64 Bank of America Warrant BAC/WS/B
0.1% Unchanged $13,694 13,041,600
65 RBS Pfd M RBS-PM
0.1% Unchanged $13,728 835,051 66 RBS Pfd P RBS-PP
0.1% Unchanged $9,820 602,433
67 RBS Pfd Q RBS-PQ
0.1% Unchanged $10,493 617,578 68 STRATEGIC HOTELS SGCHZ
0.1% Cut -71% $10,791 1,640,000
69 RBS Pfd R RBS-PR
0.1% Unchanged $10,171 623,968 70 RBS Pfd S RBS-PS
0.1% Unchanged $8,526 510,524
71 RBS Pfd T RBS-PT
0.1% Unchanged $7,717 406,180 72 Beazer Homes USA Inc. BZH
0.1% Cut -53% $7,480 2,301,483
73 News Corp. NWS
0.0% Cut -94% $5,994 300,000 74 SuperMedia Inc. SPMD
0.0% Unchanged $6,232 2,607,504
75 Teva Pharmaceutical TEVA
0.0% Unchanged $6,362 141,193 76 Dex One Corporation DEXO
0.0% Unchanged $5,220 3,676,394
77 FAIRPOINT COMM FRP
0.0% Cut -52% $4,136 1,100,000 78 CHEMTURA CORP CHMT
0.0% Added 32% $4,964 292,325
79 Sunstone Hotel Investors SHO
0.0% Cut -87% $2,401 246,458 80 Hartford Financial Wrrnt HIG/WS
0.0% Unchanged $928 70,000
81 Quad/Graphics, Inc. QUAD
0.0% Cut -86% $2,085 150,000 82 Sara Lee Corp. SLE
0.0% New $1,507 70,000
83 Transocean Ltd. RIG
Sold
- 84 FelCor Lodging Trust FCH-PA
Sold
-
85 CB Richard Ellis Group CBG
Sold
- 86 PHARMASSET VRUS
Sold
-
87 Southern Union SUG
Sold
- 88 Whirlpool Corp. WHR
Sold
-
89 Mosaic Co. MOS
Sold
- 90 PMI GROUP INC PPMIQ
Sold
-
91 Transatlantic Holdings TRH
Sold
- 92 Veeco Instruments VECO
Sold
-
93 Beazer Homes USA BZMD
Sold
- 94 Vail Resorts Inc. MTN
Sold
-
Next Page: Tiger Management

28
The upper echelon of Tiger Management’s portfolio saw some interesting changes during the first quarter. The most notable change would be the fact that Julian Robertson’s firm sold completely out of its previously large stake in Valeant Pharmaceuticals (VRX). His former number two right-hand man, John Griffin, also sold out of VRX in the quarter. Given that Robertson often talks with his former employees, this similar movement is probably not a coincidence.
After selling out of Netflix (NFLX) in the fourth quarter (after shares plummeted), Tiger Management re-entered a NFLX position just one quarter later. NFLX currently trades around $74. The lowest Tiger could have paid was $72 and the highest $129 based on NFLX’s trading during the quarter. Needless to say, it’s been a wild ride. Tiger also started a bevy of positions, including: HCA (HCA), Starbucks (SBUX), Sherwin Williams (SHW) and VeriSign (VRSN). SHW shares have been on a monster
Key Takeaways
2%3'4"$565"#$-'R<*!'R<*)!
25?0XH3U1!'2GJ7)!
2A&0=4>!N4%%4?E1!'2RN)!
D&0424$>!'D62L)!
./+0&11W`!./+&945&9!2#%H54#>1!'7,()!
L&5V%4/!'LK-7)!
2?>I41U!'2LIB)!
<?%%49H1!2#V5=?0&!'<*-I)!
6&E?0U!@&94?!'@*6B)!
!
."/,'!"89/%6%/)':&6':;-'D?%&?>5!,A?0E?3&H543?%1!'D67)!
<454$0#H+!'<)!
I4$45?%!"%#X&!'I";)!
2#>#3#!,0#9H351!'2(L)!
run this year as numerous other hedge funds got involved. Robertson’s firm also added to existing positions in Apple (AAPL) and Mastercard (MA), boosting their holdings by almost 30% each. AAPL remains Tiger’s top holding, while MA jumped up from 7th largest position to 3rd largest. And after buying baskets of gold miners and junior miners last quarter, they continued to buy shares of GDX and GDXJ.
Robertson recently gave a rare interview to Columbia Business School where he shared some of his latest thoughts. He mentioned he likes WuXi PharmaTech (WX), saying that, “I love WuXi which is a Chinese-based employment agency for PHD’s, primarily in the drug industry … the company’s earnings are certainly increasing beautifully at about 20% a year and it still sells at 10x earnings.” Robertson actually sold 25% of his WX position during the first quarter, but it’s still his seventh largest disclosed position.
The Tiger Management founder also shared some wisdom as to how he approaches investing: “I believe that the best way to manage money is to go long and short stocks. My theory is that if the 50 best stocks you can come up with don’t outperform the 50 worst stocks you can come up with, you should be in another business … For my shorts, I look for a bad management team, and a wildly overvalued company in an industry that is declining or misunderstood.” In the interview, he also reiterated his bullish stance on shares of Apple (AAPL) and Google (GOOG).
View Tiger Management’s Updated Portfolio on the Next Page
Q1 2012 www.hedgefundwisdom.com
Tiger Management Julian Robertson
Mentored the ‘Tiger Cub’ hedge funds & seeded other talented up & coming
managers
Featured in the book A Tiger in the Land of Bulls and Bears
View a profile of Tiger Management

29
Tiger Management First Quarter 2012 Portfolio:
Next Page: Soros Fund Management
Q1 2012 www.hedgefundwisdom.com
Rank Company Name Ticker Put/Call % of Portfolio Activity
Value x $1000 # of Shares
1 Apple Inc. AAPL
15.1% Added 29% $53,174 88,690 2 The Goldman Sachs Group GS
8.9% Added 9% $31,225 251,065
3 Mastercard Incorporated MA
6.3% Added 29% $22,286 52,994 4 Liberty Global Inc. LBTYA
5.8% Unchanged $20,412 407,595
5 Google Inc. GOOG
5.7% Cut -13% $20,226 31,542 6 Visa, Inc. V
5.7% Added 21% $20,007 169,552
7 WuXi PharmaTech WX
4.4% Cut -25% $15,607 1,083,818 8 QUALCOMM Incorporated QCOM
4.2% Unchanged $14,703 216,030
9 PNC Financial Services PNC
3.6% Added 49% $12,711 197,100 10 Wells Fargo & Company WFC
3.6% Added 57% $12,659 370,800
11 HCA HLDGS INC COM HCA
3.6% New $12,533 506,600 12 Starbucks Corp. SBUX
3.5% New $12,212 218,500
13 Sherwin-Williams Co. SHW
3.2% New $11,171 102,800 14 VeriSign Inc. VRSN
3.0% New $10,700 279,000
15 Express-1 Expedited XPO
2.8% New $9,996 595,000 16 Market Vectors Gold Miners GDX
2.8% Added 28% $9,824 198,300
17 Netflix, Inc. NFLX
2.6% New $9,238 80,300 18 LCA-Vision Inc. LCAV
2.5% Unchanged $8,620 1,372,577
19 Cablevision Systems Corporation CVC
2.3% Unchanged $8,011 545,700 20 SanDisk Corp. SNDK
2.0% New $6,992 141,000
21 AutoNavi Holdings Limited AMAP
1.9% Unchanged $6,536 520,759 22 JuniorGoldMiners ETF GDXJ
1.8% Added 29% $6,439 262,300
23 Callidus Software Inc. CALD
1.7% New $5,896 754,900 24 Ryanair Holdings plc RYAAY
1.3% Unchanged $4,463 123,022
25 Suncor Energy Inc. SU
0.6% Unchanged $2,240 68,500 26 REMARK MEDIA MARK
0.4% New $1,530 254,183
27 Cardiome Pharma Corp. CRME
0.3% Unchanged $1,125 1,596,106 28 Sealed Air Corporation SEE
0.3% Unchanged $938 48,600
29 Nexen Inc. NXY
0.2% Unchanged $513 27,950 30 Carnival Corporation CCL
0.1% Unchanged $319 9,950
31 SIRIUS XM Radio Inc. SIRI
0.1% Unchanged $231 100,000 32 Valeant Pharmaceuticals VRX
Sold
-
33 Citigroup, Inc. C
Sold
- 34 DigitalGlobe, Inc. DGI
Sold
-
35 Sonoco Products Co. SON
Sold
-

30
As you can see above, convertible notes are the name of the game for Soros Fund Management. George Soros’ hedge fund turned family office holds six of its top ten positions in the form of notes instead of equity. Micron Technology (MU) notes continues to be their top holding. Their second largest position, however, is now SPDR S&P 500 (SPY) put options as a hedge to the overall portfolio as they boosted their notional exposure by 150%. They also initiated another put option position in the quarter: PowerShares QQQ (QQQ) puts as they seek to hedge their large technology exposure. And speaking of technology, SanDisk (SNDK) notes are Soros’ third largest holding. They clearly prefer playing convertibles here instead of equity as they sold their SNDK common stock during the quarter. SanDisk has
Key Takeaways
2%3'4"$565"#$-',#=&02A?0&1!TTT!'TTT)!,H51!
-H3&>5!8&3A>#%#$4&1!'-J)!L#5&!
I4$45?%!64:&0!'I6;D)!L#5&!
R#%#$43!'R(-7)!L#5&!
TH?>5HE!<#0+!'T8@)!L#5&!
<D6!.>&0$C!'<D;)!
2H>80H15!G?>U1!'28;)!
<A&:0#>!'<D7)!
@?3CO1!'@)!
!
."/,'!"89/%6%/)':&6':;-'2?>I41U!'2LIB)!
I&>90&#>!'ILIL)!
@&?9!\#A>1#>!LH50454#>!'@\L)!
D4?3#E!'D;*FG)!
J2!25&&%!'7)!
L;;!R#%94>$1!'L;RI)!
.3A#25?0!'2*82)!
"##$%&!'"((")!
N?%$0&&>!'N*")!
had a very volatile past few weeks after the company posted weak guidance that generated sufficient investor concern. Over the past few months, SNDK shares are down 32% but Soros at least exited their common stock before the carnage.
Two brand new stakes for George Soros’ firm worth highlighting are Lucent Technologies (LU) notes as well as Digital River (DRIV) notes. In a 13G filed with the SEC recently, Soros disclosed they have continued to buy Digital River convertible bonds and now own 4,162,494 shares via these notes. The filing also discloses that they own two separate sets of notes. The majority of their position is in the 2.00% convertible bonds due 2030 with a conversion price of 49.13 (these mature on November 1st, 2030). The second set of notes they have a much smaller stake in is the 1.25% convertible bonds due 2024 with a conversion price of 44.06.
Of the equity holdings Soros does own, you’ll see a common theme: event-driven/catalysts. They own Sara Lee (SLE) in size as the company is completing a spin-off soon. They also own CVR Energy (CVI), which received a takeover offer from activist investor Carl Icahn. Additionally, Soros also bought more Express Scripts (ESRX), who just purchased Medco Health.
Given that Soros’ family office owns so many positions and has higher turnover, the newsletter will only focus on their sizable positions. Be sure to head to MarketFolly to read a portfolio manager’s take on the potential rationale as to why Soros owns Comverse Technology (CMVT) by clicking here.
View Soros Fund Management’s Updated Portfolio on the Next Page
Q1 2012 www.hedgefundwisdom.com
Soros Fund Mgmt George Soros
Famously broke the Bank of England with a huge bet against the British
Pound
Renowned global macro hedge fund
Author of The Alchemy of Finance
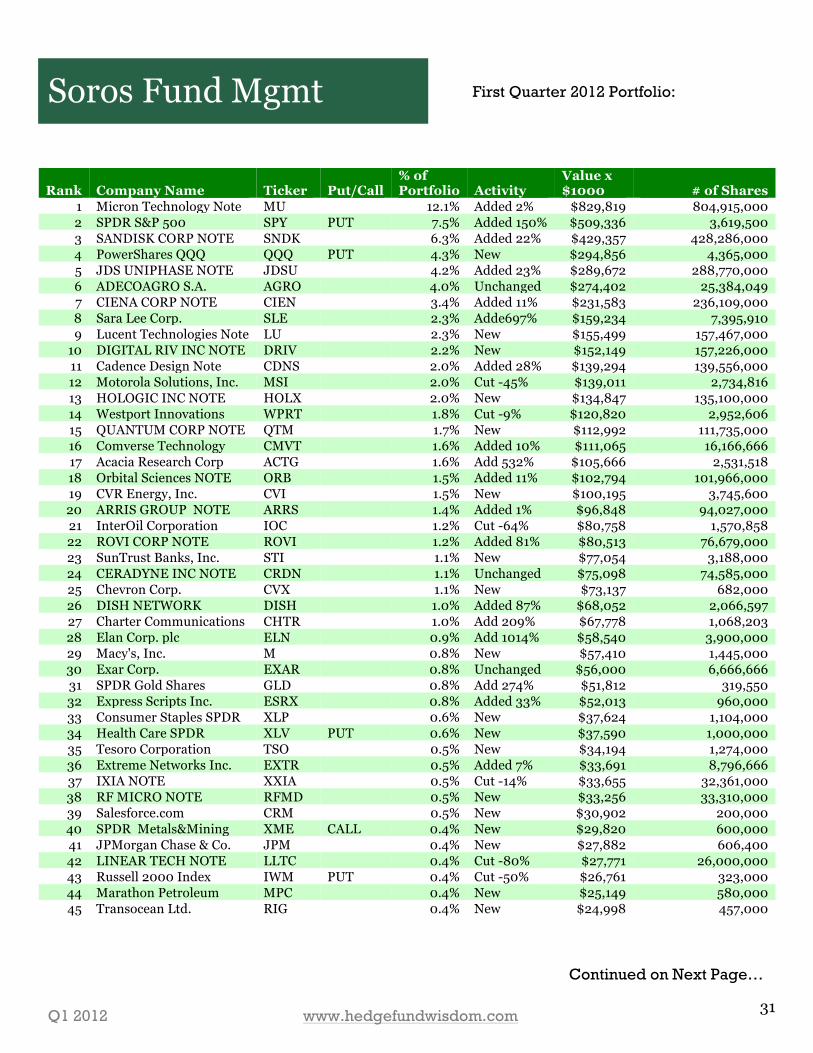
31
Soros Fund Mgmt First Quarter 2012 Portfolio:
Continued on Next Page…
Q1 2012 www.hedgefundwisdom.com
Rank Company Name Ticker Put/Call % of Portfolio Activity
Value x $1000 # of Shares
1 Micron Technology Note MU
12.1% Added 2% $829,819 804,915,000 2 SPDR S&P 500 SPY PUT 7.5% Added 150% $509,336 3,619,500 3 SANDISK CORP NOTE SNDK
6.3% Added 22% $429,357 428,286,000
4 PowerShares QQQ QQQ PUT 4.3% New $294,856 4,365,000 5 JDS UNIPHASE NOTE JDSU
4.2% Added 23% $289,672 288,770,000
6 ADECOAGRO S.A. AGRO
4.0% Unchanged $274,402 25,384,049 7 CIENA CORP NOTE CIEN
3.4% Added 11% $231,583 236,109,000
8 Sara Lee Corp. SLE
2.3% Adde697% $159,234 7,395,910 9 Lucent Technologies Note LU
2.3% New $155,499 157,467,000
10 DIGITAL RIV INC NOTE DRIV
2.2% New $152,149 157,226,000 11 Cadence Design Note CDNS
2.0% Added 28% $139,294 139,556,000
12 Motorola Solutions, Inc. MSI
2.0% Cut -45% $139,011 2,734,816 13 HOLOGIC INC NOTE HOLX
2.0% New $134,847 135,100,000
14 Westport Innovations WPRT
1.8% Cut -9% $120,820 2,952,606 15 QUANTUM CORP NOTE QTM
1.7% New $112,992 111,735,000
16 Comverse Technology CMVT
1.6% Added 10% $111,065 16,166,666 17 Acacia Research Corp ACTG
1.6% Add 532% $105,666 2,531,518
18 Orbital Sciences NOTE ORB
1.5% Added 11% $102,794 101,966,000 19 CVR Energy, Inc. CVI
1.5% New $100,195 3,745,600
20 ARRIS GROUP NOTE ARRS
1.4% Added 1% $96,848 94,027,000 21 InterOil Corporation IOC
1.2% Cut -64% $80,758 1,570,858
22 ROVI CORP NOTE ROVI
1.2% Added 81% $80,513 76,679,000 23 SunTrust Banks, Inc. STI
1.1% New $77,054 3,188,000
24 CERADYNE INC NOTE CRDN
1.1% Unchanged $75,098 74,585,000 25 Chevron Corp. CVX
1.1% New $73,137 682,000
26 DISH NETWORK DISH
1.0% Added 87% $68,052 2,066,597 27 Charter Communications CHTR
1.0% Add 209% $67,778 1,068,203
28 Elan Corp. plc ELN
0.9% Add 1014% $58,540 3,900,000 29 Macy's, Inc. M
0.8% New $57,410 1,445,000
30 Exar Corp. EXAR
0.8% Unchanged $56,000 6,666,666 31 SPDR Gold Shares GLD
0.8% Add 274% $51,812 319,550
32 Express Scripts Inc. ESRX
0.8% Added 33% $52,013 960,000 33 Consumer Staples SPDR XLP
0.6% New $37,624 1,104,000
34 Health Care SPDR XLV PUT 0.6% New $37,590 1,000,000 35 Tesoro Corporation TSO
0.5% New $34,194 1,274,000
36 Extreme Networks Inc. EXTR
0.5% Added 7% $33,691 8,796,666 37 IXIA NOTE XXIA
0.5% Cut -14% $33,655 32,361,000
38 RF MICRO NOTE RFMD
0.5% New $33,256 33,310,000 39 Salesforce.com CRM
0.5% New $30,902 200,000
40 SPDR Metals&Mining XME CALL 0.4% New $29,820 600,000 41 JPMorgan Chase & Co. JPM
0.4% New $27,882 606,400
42 LINEAR TECH NOTE LLTC
0.4% Cut -80% $27,771 26,000,000 43 Russell 2000 Index IWM PUT 0.4% Cut -50% $26,761 323,000 44 Marathon Petroleum MPC
0.4% New $25,149 580,000
45 Transocean Ltd. RIG
0.4% New $24,998 457,000

32
Next Page: Bridger Management
First Quarter 2012 Portfolio: …Continued
Soros Fund Mgmt
Q1 2012 www.hedgefundwisdom.com
Rank Company Name Ticker Put/Call % of Portfolio Activity
Value x $1000 # of Shares
46 MERCURY COMPUTER MRCY
0.4% Cut -17% $25,110 1,895,120 47 General Electric Co. GE
0.4% New $25,128 1,252,000
48 DIRECTV DTV
0.4% Added 8% $25,387 514,529 49 Apple Inc. AAPL
0.4% Cut -58% $23,982 40,000
50 HOLLYFRONTIER CORP HFC
0.3% New $22,923 713,000 51 GENERAL MOTORS B GM/PB
0.3% Unchanged $23,164 550,700
52 MicroStrategy Inc. MSTR
0.3% New $23,213 165,805 53 Valero Energy Corp. VLO
0.3% New $23,090 896,000
54 Fifth Third Bancorp FITB
0.3% New $21,313 1,517,500 55 XYLEM INC. XYL
0.3% Add 329% $20,693 745,688
56 Gilead Sciences Inc. GILD CALL 0.3% New $19,544 400,000 57 TRIPADVISOR TRIP
0.3% Added 45% $18,995 532,510
58 Loral Space & Comm LORL
0.3% Added 3% $18,150 228,011 59 Pfizer Inc. PFE
0.3% Add 3381% $18,015 795,000
60 Capital One Financial COF
0.3% New $17,112 307,000 61 Level 3 Communications LVLT
0.3% New $17,141 666,200
62 Churchill Downs Inc. CHDN
0.3% Added 69% $17,082 305,576 63 DaVita, Inc. DVA
0.2% Cut -42% $15,780 175,000
64 Goldman Sachs Group GS
0.2% New $14,924 120,000 65 Citigroup, Inc. C
0.2% New $15,351 420,000
66 Bancolombia S.A. CIB
0.2% New $14,766 228,361 67 Wells Fargo & Company WFC
0.2% Cut -63% $15,056 441,000
68 SPDR HOMEBUILDERS XHB PUT 0.2% New $14,931 700,000 69 Regions Financial Corp. RF
0.2% New $15,098 2,291,000
70 Newmont Mining Corp. NEM CALL 0.2% New $14,612 285,000 71 Kraft Foods Inc. KFT
0.2% Added 11% $13,722 361,000
72 Spreadtrum Comm SPRD
0.2% New $13,943 845,000 73 Visteon Corp VC
0.2% Unchanged $13,247 249,950
74 MedcoHealth Solutions MHS CALL 0.2% New $13,294 189,100 75 Owens Corning OC
0.2% Added 74% $13,151 365,000
76 Home Inns & Hotels HMIN
0.2% Add 846% $12,069 473,100 77 Bluefly Inc. BFLY
0.2% Unchanged $11,988 6,480,070
78 Aspen Technology Inc. AZPN
0.2% Add 100% $12,318 600,000 79 Liberty Media Corp LMCA
0.2% Cut -3% $12,492 141,712
80 General Motors GM
0.2% Unchanged $11,576 451,300 81 DELPHI AUTOMOTIVE DLPH
0.2% Cut -29% $11,629 368,000
82 ClickSoftware Tech CKSW
0.2% Added 8% $11,886 937,399 83 Pepsico, Inc. PEP
0.2% Added 13% $11,180 168,500
84 iShares Xinhua China FXI CALL 0.2% Added 20% $10,989 300,000 85 E-House (China) EJ
0.2% Cut -37% $11,003 1,897,000
86 Energy Select Sector XLE CALL 0.2% New $10,760 150,000 87 Expedia Inc. EXPE
0.2% Added 3% $11,042 330,210
88 Ariad Pharmaceuticals ARIA
0.2% New $10,148 635,000 89 CIENA Corp. CIEN
0.2% Add 333% $10,524 650,000
90 CF Industries Holdings CF PUT 0.2% New $10,502 57,500

33
Robert Mignone’s top holdings remain largely unchanged from the last quarter. His top position continues to be United Rentals (URI) and last quarter’s newsletter highlighted the company in the equity analysis section as a secular tailwinds story so be sure to login and download it if you want to see the bull and bear case on URI. His hedge fund did trim the position 36% during the quarter but as mentioned above, it still remains his largest disclosed allocation. Bridger Management also trimmed its stakes in tech giants Apple (AAPL) and Google (GOOG) by 14% and 21% each. It appears as though they zigged while other hedge funds zagged. After all, both names were consensus buys among hedge funds during the
Key Takeaways
2%3'4"$565"#$-'804+*9:41#0!'86;,)!
<A?0%&1!64:&0!-?X1!'<6-)!
@#>1?>5#!'@(L)!
<&E&/!'<7)!
@&5-4V&!'@.8)!
*03#1!I#0?9#1!'*6<()!
6HX43#>!@4>&0?%1!'6GP)!
6&1+#>1&!"&>&5431!'6"I7)!
,4>>?3%&!.>5&05?4>E&>5!',LB)!!
!
."/,'!"89/%6%/)':&6':;-',&>>C@?3!@#05$?$&!',@8)!
@*B(!2H0$43?%!'@*B()!
;>A4X45&/!';LR7)!
<?094#E&!,A?0E?!'<6@.)!
<454$0#H+!'<)!<?%%1!
"#%9E?>!2?3A1!'"2)!<?%%1!
2?%4/!,A?0E?!'2-7,)!
@*,!,A?0E?!'@*,,)!
,A?0E?11&5!^!X#H$A5!#H5!
quarter. The largest brand new stake for Bridger
is in TripAdvisor (TRIP). This company was spun-off from Expedia (EXPE) at the end of the fourth quarter and Bridger obviously sees a positive path ahead for TRIP. Apart from that, the only new stakes of any real size are Bridger’s new positions in Charles River Labs (CRL), Wright Medical Group (WMGI), Monsanto (MON), and Cemex (CX).
On the selling side of the portfolio, it’s definitely worth highlighting Mignone’s sale of 45% of his position in CareFusion (CFN). Long-time Hedge Fund Wisdom readers will recall this company was highlighted in 2010 in the second issue ever published. CFN was spun-off from Cardinal Health (CAH) and past issues have flagged large stakes held by Bridger as well as David Einhorn’s Greenlight Capital, Lee Ainslie’s Maverick Capital, and Andreas Halvorsen’s Viking Global. All of these funds sold CFN shares during the quarter though they all continue to be some of the company’s largest holders. This activity is worth drawing attention to though, as it is the second consecutive quarter in which Bridger has substantially reduced its position size.
Last quarter’s newsletter noted that Pharmasset was being acquired by Gilead Sciences (GILD) and wondered whether or not Mignone’s firm would continue to hold a stake in the combined entity. Well they did, however they sold almost 70% of the position by quarter’s end.
View Bridger Management’s Updated Portfolio on the Next Page
Q1 2012 www.hedgefundwisdom.com
Bridger Management Roberto Mignone
Typically focuses on the healthcare sector
Known for his sleuthing abilities on
the short side

34
Bridger Management First Quarter 2012 Portfolio:
Continued on next page…
Q1 2012 www.hedgefundwisdom.com
Rank Company Name Ticker Put/Call % of Portfolio Activity
Value x $1000 # of Shares
1 United Rentals, Inc. URI
7.1% Cut -36% $101,857 2,374,848 2 Morgan Stanley MS
7.0% Unchanged $100,808 5,132,800
3 Apple Inc. AAPL
6.8% Cut -14% $97,727 163,000 4 Google Inc. GOOG
6.6% Cut -21% $95,545 149,000
5 Assured Guaranty Ltd. AGO
5.5% Unchanged $79,558 4,815,837 6 Hyatt Hotels Corporation H
5.2% Unchanged $75,512 1,767,610
7 TRIPADVISOR TRIP
5.0% New $71,340 2,000,000 8 General Motors GM
4.9% Cut -25% $69,896 2,725,000
9 DIRECTV DTV
4.3% Cut -35% $62,168 1,260,000 10 Abbott Laboratories ABT
3.4% Unchanged $49,645 810,000
11 HCA HCA
3.3% Cut -41% $47,625 1,925,000 12 Cott Corporation COT
3.0% Unchanged $43,612 6,617,855
13 Acorda Therapeutics ACOR
2.8% Added 11% $39,825 1,500,000 14 CareFusion Corporation CFN
2.7% Cut -45% $38,895 1,500,000
15 Allergan Inc. AGN
2.6% Unchanged $37,294 390,800 16 Avis Budget Group CAR
2.5% Cut -29% $36,436 2,575,000
17 Starwood Hotels&Resorts HOT
2.4% Cut -22% $35,102 622,273 18 MGM Resorts MGM
2.2% Add 32% $31,871 2,340,000
19 Charles River Labs CRL
2.0% New $28,357 785,730 20 Ironwood Pharma IRWD
1.7% Unchanged $25,014 1,879,375
21 Gilead Sciences Inc. GILD
1.5% Cut -69% $21,987 450,000 22 Wright Medical Group WMGI
1.5% New $20,933 1,083,487
23 Pharmacyclics Inc. PCYC
1.4% Cut -17% $20,820 750,000 24 Monsanto Co. MON
1.4% New $20,339 255,000
25 CEMEX, S.A.B. de C.V. CX
1.3% New $19,369 2,496,000 26 Onyx Pharmaceuticals ONXX
1.3% Cut -53% $18,840 500,000
27 MetLife, Inc. MET
1.3% New $18,675 500,000 28 Popular Inc. BPOP
1.2% Added 14% $17,494 8,533,715
29 iStar Financial Inc. SFI
0.9% Unchanged $12,997 1,792,712 30 Casella Waste Systems CWST
0.8% Unchanged $11,174 1,793,507
31 hiSoft Technology Intl HSFT
0.8% Unchanged $11,070 737,000 32 ARCOS DORADOS ARCO
0.7% New $10,673 590,000
33 Seattle Genetics Inc. SGEN
0.7% Unchanged $10,190 500,000 34 Boston Beer Co. Inc. SAM
0.7% Unchanged $9,718 91,000
35 Amicus Therapeutics FOLD
0.6% Added 74% $9,011 1,706,568 36 Bank of America Warrant BAC/WS/A
0.6% Unchanged $8,838 1,900,700
37 Rubicon Minerals Corp RBY
0.5% New $6,773 2,070,000 38 Response Genetics, Inc RGDX
0.4% New $6,000 3,000,000
39 Pinnacle Entertainment PNK
0.4% New $5,879 510,795 40 Anthera Pharmaceuticals ANTH
0.3% Unchanged $3,619 1,637,428
41 VERASTEM, INC. VSTM
0.2% New $2,186 200,000 42 Allison Transmission ALSN
0.1% New $1,791 75,000
43 BPZ Resources, Inc. BPZ
0.1% Cut -36% $1,112 275,830 44 BPZ Resources, Inc. BPZ CALL 0.1% New $913 226,700 45 BPZ Resources Notes BPZ
0.1% Cut -37% $666 728,330

35
Bridger Management
Next Page: Omega Advisors
First Quarter 2012 Portfolio: …Continued
Q1 2012 www.hedgefundwisdom.com
Rank Company Name Ticker Put/Call % of Portfolio Activity
Value x $1000 # of Shares
46 DexCom, Inc. DXCM
0.0% New $465 44,554 47 CurrencyShares Euro FXE PUT 0.0% Cut -99% $478 3,600 48 SPDR S&P 500 SPY PUT 0.0% New $465 3,300 49 Fortuna Silver Mines FSM
0.0% New $376 83,489
50 iShares Brazil Index EWZ
0.0% New $278 4,300 51 iShares Brazil Index EWZ PUT 0.0% New $349 5,400 52 MAP Pharmaceuticals MAPP
Sold
-
53 PHARMASSET VRUS
Sold
- 54 Salix Pharmaceuticals SLXP
Sold
-
55 Goldman Sachs GS CALL
Sold
- 56 Banco Santander-Chile BSAC
Sold
-
57 Citigroup, Inc. C CALL
Sold
- 58 Cardiome Pharma Corp. CRME
Sold
-
59 SPDR S&P 500 SPY CALL
Sold
- 60 PennyMac Mortgage PMT
Sold
-
61 PHARMASSET VRUS PUT
Sold
- 62 MAKO Surgical Corp. MAKO
Sold
-
63 INHIBITEX INC INHX
Sold
-

36
Leon Cooperman’s Omega Advisors apparently decided that the first quarter was the right time to get into financials as they acquired new stakes in a plethora of “too big to fail” institutions such as Bank of America (BAC), Citigroup (C), Wells Fargo (WFC), and American International Group (AIG). While these decently sized stakes are noted, the largest new position for Cooperman’s firm is in beleaguered wireless provider Sprint Nextel (S). This has turned a few heads as the company struggles to compete with the larger players like AT&T (T) and Verizon (VZ).
The upper echelon of Omega’s portfolio is largely energy heavy. Six of their top eleven holdings are focused on this sector: Atlas Pipeline Partners (APL), Linn Energy (LINE),
Key Takeaways
2%3'4"$565"#$-'2+04>5!L&/5&%!'2)!
(3=&>!K4>?>34?%!'(<L)!
"##$%&!'"((")!
<454$0#H+!'<)!
G?>U!#V!*E&043?!'G*<)!
N&%%1!K?0$#!'NK<)!
*E&043?>!;>5&0>?54#>?%!"0#H+!'*;")!
G%?3U15#>&!"0#H+!'G7)!
B4>9&0!@#0$?>!'B@;)!
6?>$&!6&1#H03&1!'66<)!
D&0424$>!'D62L)!
!
."/,'!"89/%6%/)':&6':;-'
./+0&11!2304+51!'.267)!
*#>!<#0+!'*(L)!
.3A#25?0!'2*82)!
@G;*!'@G;)!
K#0&15!(4%!'K28)!
<?X%&:414#>!'<D<)!
&G?C!'.G*P)!
Leon Cooperman
View Omega Advisors’ Updated Portfolio on the Next Page
Has returned 16% annualized over 18 years
Prior to founding Omega, he spent 25
years at Goldman Sachs and was Chief Executive Officer of Goldman’s
Asset Management division
El Paso (EP), Transocean (RIG), and Atlas Energy (ATLS). Apart from these energy plays, Cooperman’s largest disclosed US equity long is SLM Corp (SLM) and he also holds large stakes in Apple (AAPL), WellPoint (WLP), and Unitedhealth (UNH). He essentially doubled his stakes in the last two during the first quarter.
At the Skybridge Alternatives Conference in Las Vegas a couple of weeks ago, Cooperman reiterated his stance that US government bonds are fundamentally overvalued. He thinks that at a 2% return, bonds are risky and that in two or three years in the future everyone will be worrying about inflation and interest rates will be higher. He highlighted his holdings in AIG, Capital One (COF), and Western Union (WU) in his talk ~ all brand new holdings during the quarter. He also mentioned (as he always seems to) shares of E*Trade Financial (ETFC). He’s long pitched the company as an ideal takeover target as they get their loan losses under control and improve their retail brokerage business. It’s just interesting that he chose to mention that name considering he sold 30% of his stake during the quarter. In a separate television interview, Cooperman also dismissed the idea of investing in high yield bonds as they are ‘fully priced.’ He prefers to invest in cheap stocks that will yield more than bonds and are good companies that will grow over time. Commenting on his large stake in AAPL, he thinks the company is worth well over $600 (and it did reach $630 during the first quarter before selling off to current levels in the low $5xx’s).
Q1 2012 www.hedgefundwisdom.com
Omega Advisors

37
Omega Advisors First Quarter 2012 Portfolio:
Continued on next page…
Q1 2012 www.hedgefundwisdom.com
Rank Company Name Ticker Put/Call % of Portfolio Activity
Value x $1000 # of Shares
1 SLM Corporation SLM
5.4% Cut -3% $269,610 17,107,224 2 Atlas Pipeline Partners LP APL
3.8% Cut 0% $189,740 5,362,918
3 Linn Energy, LLC LINE
3.7% Added 21% $185,188 4,854,200 4 Apple Inc. AAPL
3.5% Added 23% $175,647 293,004
5 El Paso Corp. EP
3.3% Added 7% $163,116 5,520,000 6 Transocean Ltd. RIG
3.1% Added 11% $154,432 2,823,245
7 WellPoint Inc. WLP
3.1% Added 118% $154,110 2,088,207 8 KKR FINANCIAL CORP. KFN
2.8% Unchanged $142,118 15,430,867
9 Unitedhealth Group, Inc. UNH
2.7% Added 93% $133,873 2,271,348 10 QUALCOMM Incorporated QCOM
2.5% Added 3% $126,476 1,859,400
11 Atlas Energy, L.P. ATLS
2.5% Unchanged $125,118 3,791,447 12 The McGraw-Hill Companies MHP
2.5% Cut -12% $123,855 2,555,300
13 ENERGY XXI EXXI
2.5% Cut -10% $122,642 3,396,343 14 Citrix Systems, Inc. CTXS
2.3% Cut -7% $115,114 1,458,799
15 XL Group plc XL
2.2% Added 6% $110,848 5,110,537 16 ALTISOURCE PORTFOLIO ASPS
2.2% Added 3% $108,697 1,792,500
17 Boston Scientific Corporation BSX
2.1% Added 4% $102,632 17,162,600 18 JPMorgan Chase & Co. JPM
2.0% Added 153% $102,115 2,220,864
19 Williams Companies, Inc. WMB
2.0% Added 7% $99,366 3,225,108 20 Sprint Nextel Corp. S
1.8% New $91,486 32,100,400
21 ETRADE Financial Corp ETFC
1.7% Cut -30% $87,169 7,960,609 22 Lincoln National Corp. LNC
1.7% Unchanged $86,076 3,265,416
23 CVS Caremark Corporation CVS
1.7% Unchanged $84,683 1,890,255 24 SPDR Gold Shares GLD
1.7% Cut -44% $84,167 519,100
25 Broadridge Financial BR
1.7% Added 7% $82,514 3,451,014 26 Kohlberg Kravis Roberts & Co. KKR
1.7% Added 4% $82,719 5,577,787
27 MetLife, Inc. MET
1.6% Added 10% $78,894 2,112,285 28 DISH NETWORK DISH
1.6% Added 22% $78,775 2,392,200
29 Charming Shoppes Inc. CHRS
1.5% Added 6% $75,572 12,808,764 30 Ocwen Financial Corp. OCN
1.5% New $74,328 4,755,440
31 Google Inc. GOOG
1.4% New $70,440 109,850 32 NYSE Euronext, Inc. NYX
1.4% Added 11% $69,524 2,316,700
33 Denbury Resources Inc. DNR
1.4% Unchanged $67,946 3,727,127 34 Anadarko Petroleum Corp APC
1.4% Add 303% $67,427 860,700
35 Sunoco Inc. SUN
1.3% Cut -44% $67,224 1,762,100 36 United Continental Holdings UAL
1.3% Unchanged $65,765 3,058,836
37 Citigroup, Inc. C
1.3% New $65,512 1,792,400 38 Bank of America Corp BAC
1.2% New $61,950 6,473,400
39 Halliburton Company HAL
1.2% Add 606% $61,836 1,863,100 40 Wells Fargo & Company WFC
1.1% New $52,535 1,538,800
41 ACE Limited ACE
1.0% Unchanged $51,481 703,293 42 AIG AIG
0.9% New $45,166 1,465,000
43 The Blackstone Group BX
0.9% New $44,606 2,798,400 44 Given Imaging Ltd. GIVN
0.9% Cut -7% $44,415 2,371,337
45 KINDER MORGAN, INC KMI
0.9% New $42,890 1,109,700

38
Omega Advisors First Quarter 2012 Portfolio: …Continued
Q1 2012 www.hedgefundwisdom.com
Next Page: Coatue Management
Rank Company Name Ticker Put/Call % of Portfolio Activity
Value x $1000 # of Shares
46 Loral Space & Comm LORL
0.8% Unchanged $41,058 515,800 47 ATLAS RESOURCES ARP
0.8% New $40,596 1,537,102
48 Range Resources Corp RRC
0.7% New $33,820 581,700 49 VeriSign Inc. VRSN
0.7% New $32,658 851,800
50 McMoRan Exploration Co. MMR
0.7% Added 61% $32,451 3,032,800 51 Phillips-Van Heusen Corp. PVH
0.6% Unchanged $31,471 352,300
52 Seagate Technology PLC STX
0.5% New $27,058 1,004,000 53 Regal Entertainment Group RGC
0.5% Cut -50% $25,829 1,899,225
54 Western Union Co. WU
0.5% New $25,949 1,474,353 55 Gannett Co., Inc. GCI
0.5% New $23,234 1,515,600
56 Motorola Solutions, Inc. MSI
0.5% New $22,823 449,000 57 Vodafone Group plc VOD
0.4% Unchanged $22,226 803,256
58 Domtar Corporation UFS
0.4% Cut -12% $19,076 200,000 59 WPX ENERGY INC WPX
0.4% New $18,161 1,008,364
60 SPDR S&P 500 SPY
0.4% Unchanged $17,970 127,700 61 THL Credit, Inc. TCRD
0.3% Unchanged $17,009 1,322,607
62 Family Dollar Stores Inc. FDO
0.3% New $15,187 240,000 63 Ford Motor Co. F
0.3% New $12,490 1,000,000
64 Validus Holdings VR
0.2% Add 3637% $11,798 381,200 65 SIRIUS XM Radio Inc. SIRI
0.2% New $9,332 4,040,000
66 Capital One Financial Corp. COF
0.2% New $9,755 175,000 67 Home Loan Servicing HLSS
0.1% New $6,549 469,817
68 Lam Research Corporation LRCX
0.1% New $6,608 148,100 69 Center Bancorp Inc. CNBC
0.1% Unchanged $5,466 545,000
70 SUNCOKE ENERGY SXC
0.1% New $5,121 360,414 71 Crown Holdings Inc. CCK
0.1% New $4,972 135,000
72 Dean Foods Co. DF
Sold
- 73 Discovery Communications DISCK
Sold
-
74 NRG Energy, Inc. NRG
Sold
- 75 eBay Inc. EBAY
Sold
-
76 Express Scripts Inc. ESRX
Sold
- 77 H&R Block, Inc. HRB
Sold
-
78 PNC Financial Services PNC
Sold
- 79 TEKELEC INC TKLC
Sold
-
80 Teekay Corporation TK
Sold
- 81 Best Buy Co. Inc. BBY
Sold
-
82 Cablevision Systems CVC
Sold
- 83 NutriSystem Inc. NTRI
Sold
-
84 Forest Oil Corp. FST
Sold
- 85 Microsoft Corporation MSFT
Sold
-
86 Ruby Tuesday, Inc. RT
Sold
- 87 Office Depot, Inc. ODP
Sold
-
88 Research In Motion RIMM
Sold
- 89 iShares InvestGradeCorpBond LQD
Sold
-
90 Warnaco Group Inc. WRC
Sold
- 91 MedcoHealth Solutions MHS
Sold
-
92 Aon Corporation AON
Sold
- 93 EchoStar Corp. SATS
Sold
-
94 Valassis Communications VCI
Sold
- 95 GMX Resources Inc. GMXR
Sold
-
96 MBIA Inc. MBI
Sold
-

39
Coatue Management’s founder Philippe Laffont spoke at the Ira Sohn Conference in New York and talked about the thesis behind two of his largest new bets. His second largest disclosed position is a new stake in Equinix (EQIX). He said that data centers are the new core and that they have a huge share of the internet’s backbone. Laffont likes the company’s prime locations they secured through request for proposals (RFPs) because the company secured these spots before everyone else even knew how important they’d be. He points to EQIX’s 50% return on equity with minimal leverage and he thinks the stock triples or more.
Laffont’s second pick is his fourth largest disclosed holding: Virgin Media (VMED). Of this stake, he says that everyone needs faster internet (50-100Mbps, up from 10-20 in the
Key Takeaways
2%3'4"$565"#$-'.aH4>4/!'.T;7)!
D40$4>!@&94?!'[email protected])!
-4X&05C!"%#X?%!'-G8P*)!
G0#?93#E!'G6<@)!
;>V#0E?543?!';LK*)!
L&5V%4/!'LK-7)!
2404H1!7@!6?94#!'2;6;)!
IH>U4>!G0?>91!'ILBL)!
*E&043?>!8#=&0!'*@8)!
!
."/,'!"89/%6%/)':&6':;-'NC>>!6&1#051!'NPLL)!
KH14#>W;(!'K;()!
L&5!*++!'L8*,)!
TH4>250&&5!'TL28)!
"0&&>!@#H>5?4>!<#VV&&!'"@<6)!
<#$>4]?>5!8&3A!2#%H54#>1!'<82R)!
N4%%4?E1!2#>#E?!'N2@)!
past). As the proliferation of HD video continues, this plays right into the company’s wheelhouse as they own the fastest cable broadband network in the UK. What’s also interesting he says is that the company is really buying back shares (10% this year alone, 25% in the last few years). So, they have the capacity to literally buy back all of their shares over the next 5 years.
The Coatue founder also made his first-ever television appearance after the event where he touched on his firm’s concentrated portfolio approach. He said that, “concentration is a problem over the short-run, but it sort of goes away over the long run. We try to invest over the long run and are willing to take the volatility. The less concentrated you are, the more your returns will look like the S&P. If you want to try to outperform, you have to focus on your best ideas. It is something we transmitted to investors from day one. They understand the risk. It puts a premium on being right.” Laffont also touched on the Facebook IPO, saying he would like to get as many shares as possible as he really likes the management team. It’s reasonable to assume that given Coatue’s prime broker relationships and status as a well-known tech fund that they received plenty of IPO shares. Laffont also mentioned LinkedIn (LNKD), which he also has a small position in, saying he thinks it could be a completely different company in 10 years. Lastly, he commented on his top holding: Apple (AAPL). The hedgie first got involved with the name back in 2003 and thinks the iPhone 5 and potential Apple TV are good catalysts. At 5-10% of the market, he thinks they can take much bigger market share.
View Coatue Management’s Portfolio on the Next Page
Q1 2012 www.hedgefundwisdom.com
Coatue Management Philippe Laffont
Manages a long/short fund focused on technology, media, & telecom
One of his mantras is “dare to be
different”

40
Coatue Management First Quarter 2012 Portfolio:
Q1 2012 www.hedgefundwisdom.com
Next Page: Fairholme Capital
Rank Company Name Ticker Put/Call % of Portfolio Activity
Value x $1000 # of Shares
1 Apple Inc. AAPL
17.9% Added 15% $884,133 1,474,661 2 Equinix, Inc. EQIX
11.6% New $572,763 3,637,747
3 Google Inc. GOOG
9.8% Cut -3% $482,636 752,660 4 Virgin Media, Inc. VMED
7.0% New $345,193 13,818,739
5 Priceline.com Inc PCLN
6.4% Added 5% $318,343 443,684 6 QUALCOMM Inc QCOM
6.0% Cut -3% $297,414 4,369,879
7 Liberty Global Inc. LBTYA
5.3% New $262,615 5,243,914 8 Broadcom Corp. BRCM
3.4% New $165,834 4,219,683
9 Informatica Corp INFA
3.3% New $164,018 3,100,535 10 Intuit Inc. INTU
3.3% Added 51% $160,768 2,672,352
11 Amazon.com Inc. AMZN
3.2% Cut -28% $160,302 791,574 12 Chipotle Mexican Grill CMG
3.2% Added 18% $159,320 381,148
13 Netflix, Inc. NFLX
2.9% New $144,308 1,254,415 14 SIRIUS XM Radio Inc. SIRI
2.7% New $133,587 57,829,793
15 DUNKIN' BRANDS DNKN
2.4% New $116,250 3,864,679 16 Baidu, Inc. BIDU
2.1% Cut -62% $103,775 711,909
17 American Tower Corp. AMT
2.1% New $102,145 1,620,840 18 LINKEDIN CORP LNKD
1.4% Cut 0% $68,786 674,444
19 Check Point Software CHKP
1.2% Cut -16% $59,789 936,552 20 J. C. Penney Company JCP
0.9% New $43,830 1,237,083
21 Research In Motion RIMM
0.8% Add 239% $37,541 2,553,791 22 Molycorp, Inc. MCP
0.7% Unchanged $36,541 1,080,136
23 Red Hat, Inc. RHT
0.7% Cut -51% $32,599 544,328 24 NII Holdings Inc. NIHD CALL 0.6% New $31,662 1,729,200 25 H&R Block, Inc. HRB
0.6% Unchanged $30,904 1,876,360
26 Level 3 Communications LVLT
0.3% Unchanged $13,100 509,122 27 Digital River Inc. DRIV
0.1% Cut -57% $4,624 247,130
28 AOL, Inc. AOL
0.1% Cut -89% $3,713 195,700 29 NutriSystem Inc. NTRI
0.1% Cut -58% $3,435 305,875
30 STEC, Inc. STEC
0.1% Cut -85% $2,725 288,641 31 INVENSENSE INC INVN
0.1% New $3,077 170,000
32 GROUPON INC GRPN
0.0% Unchanged $919 50,000 33 Nokia Corporation NOK CALL 0.0% New $386 70,300 34 Logitech International SA LOGI
0.0% Cut -98% $178 22,800
35 Atmel Corporation ATML
Sold
- 36 Silicon Laboratories, Inc. SLAB
Sold
-
37 Wynn Resorts Ltd. WYNN
Sold
- 38 FUSION-IO, INC FIO
Sold
-
39 NetApp, Inc. NTAP
Sold
- 40 QuinStreet, Inc. QNST
Sold
-
41 Green Mountain Coffee GMCR
Sold
- 42 Research In Motion Limited RIMM CALL
Sold
-
43 Williams-Sonoma Inc. WSM
Sold
- 44 CognizantTechnologySolutions CTSH
Sold
-

41
Bruce Berkowitz’s Fairholme is the definition of a concentrated portfolio. His latest first quarter disclosure shows a massive 36.3% of reported assets tied up in AIG (AIG). Given that he has so much money invested in the name, it’s obviously worth drawing attention to the information Berkowitz has revealed regarding his train of thought. He frames the company as one that trades at less than one-half tangible book value, has a fortress balance sheet, has a shareholder equity-to-assets ratio of 15%, and has a leading position in its market. Berkowitz feels that a 10% return on owner’s equity equals a 20% implied annual return on investment. The Fairholme man has experience with insurance companies and found one trading at attractive prices so it’s directly within his circle of competence. In terms of margin of safety, he feels that AIG is a situation where you pay $25 and receive $45 worth of assets. Given the volatility in the stock, he certainly has courage of conviction. With his contrarian approach, it’s no surprise that Fairholme’s slogan is “ignore the crowd.” Many successful investors have reiterated the fact that your highest conviction picks should garner the most capital. There’s no secret as to what Berkowitz’s top pick is.
Turning to his third largest position, it’s
Key Takeaways
2%3'4"$565"#$-'(03A?09!2H++%C!'(2R)!^!1+H>W#VV!2R-I!
@&03H0C!"&>&0?%!'@<P)!
!
."/,'!"89/%6%/)':&6':;-'"#%9E?>!2?3A1!'"2)!
also worth piecing together Berkowitz’s rationale for owning Bank of America (BAC) as well. There’s an obvious theme in Fairholme’s portfolio: ‘out of favor’ plays. Berkowitz has revealed his thesis on BAC as well and his main reasons for owning shares are as follows: it trades at less than one third book value, its core businesses generate 1% return on assets and 10% return on equity, it has a fortress balance sheet, and it has the largest US retail deposit market share (serving one in every two US households). Berkowitz also seemingly highlights the company’s status as ‘too big to fail’ as a positive, saying that Bank of America is “essential to global economic security.”
Fairholme’s manager sees a 20% implied annual return on his investment in Bank of America. He says that is a reasonable return when you consider that you’re buying BAC for less than half of book value. Berkowitz likes the various economic trends unfolding which he thinks will benefit the big bank: an improving job market, a stabilizing housing market, and overall improving fundamentals in the financial sector. At $7 per share, he argues that you’re buying something worth $20+. Summarizing his BAC thesis, he writes, “Its earnings power has been disguised by the intense provisioning for loan losses. But when the provisioning gets back to a normal level, you’ll start to see that incredible earnings power come down to the bottom line. And it’s as simple as that.”
For Berkowitz’s advice on becoming a better money manager, head to his basic checklist for investing.
View Fairholme Capital’s Updated Portfolio on the Next Page
Q1 2012 www.hedgefundwisdom.com
Fairholme Capital Bruce Berkowitz
Named Morningstar’s Fund Manager of the Decade
Manages over $10 billion and runs a
highly concentrated portfolio, making him ideal to track

42
Next Page: Tiger Global
Fairholme Capital First Quarter 2012 Portfolio:
Q1 2012 www.hedgefundwisdom.com
Rank Company Name Ticker Put/Call % of Portfolio Activity
Value x $1000 # of Shares
1 AIG AIG
36.3% Cut -1% $2,819,861 91,464,833 2 Sears Holdings Corp SHLD
14.3% Added 4% $1,113,893 16,813,480
3 Bank of America Corp BAC
12.7% Cut -1% $984,165 102,838,555 4 CIT Group, Inc. CIT
9.8% Cut -1% $763,869 18,522,529
5 The St. Joe Company JOE
6.1% Cut -2% $474,185 25,715,428 6 Leucadia National Corp. LUK
6.1% Cut -1% $474,524 18,180,980
7 MBIA Inc. MBI
5.8% Cut -1% $453,303 46,255,370 8 AIG Warrant AIG/WS
3.4% Added 0% $261,240 24,575,760
9 Berkshire Hathaway Inc. BRK-A
2.5% Cut -61% $191,749 1,573 10 Berkshire Hathaway Inc. BRK-B
1.0% Cut -65% $78,474 967,019
11 Jefferies Group Inc. JEF
0.7% Add 111% $50,817 2,697,300 12 Bank of America Warrant BAC/WS/A
0.6% Added 15% $45,495 9,783,828
13 Citigroup, Inc. C
0.2% Cut -81% $14,598 399,400 14 Orchard Supply Hardware OSH
0.2% New $14,792 716,322
15 Wells Fargo Warrants WFC-WT
0.2% Added 58% $13,045 1,296,695 16 JPMorgan Chase Warrant JPM/WS
0.1% Unchanged $6,485 484,700
17 Mercury General Corp MCY
0.0% New $3,101 70,900 18 Wells Fargo & Company WFC
0.0% Unchanged $1,072 31,400
19 Assured Guaranty Ltd. AGO
0.0% Unchanged $854 51,700 20 Regions Financial Corp. RF
0.0% Unchanged $138 20,900
21 Goldman Sachs Group GS
Sold
-
43
The first position worth pointing out in Tiger Global’s portfolio is one that won’t appear on the next page because the company just completed its initial public offering (IPO): Facebook (FB). Tiger has previously owned a private stake in Facebook as they purchased 1% of the company at a $24 billion valuation. And given that FB shares now trade with a market capitalization of $104 billion, Tiger has made a pretty penny on their investment. Chase Coleman’s early stage tech investments in private companies have paid off handsomely as many of these budding companies have come public. As such, it should come as no surprise that Coleman was named one of the top 25 highest earning hedge fund managers of 2011.
Turning to Tiger Global’s first quarter portfolio activity, it’s very evident that they favored trimming positions more than anything. While they still hold sizable positions in their top seven holdings, they only added to one of those positions: Google (GOOG). This was par for the course in hedge fund land during the
Key Takeaways !
2%3'4"$565"#$-'I&3U&01!'I.<B)!
K0#>54&0!<#EEH>43?54#>1!'K86)!
*>3&150CF3#E!'*<(@)!
66!I#>>&%%&C!'66I)!
2H+&0:?%H!'2DJ)!
<0#=>!<?15%&!'<<;)!
K#3H1!@&94?!'K@<L)!
!
."/,'!"89/%6%/)':&6':;-'<#4>15?0!'<286)!
R&3UE?>>!'R.B)!
.>9H0?>3&!2+&34?%5C!R#%94>$1!'.LR)!
,043&%4>&F3#E!',<-L)!<?%%1!
@43A?&%!B#01!'B(62)!
;*<!;>5&0?354:&!';*<;)!
Chase Coleman
View Tiger Global’s Updated Portfolio on the Next Page
Mentored and seeded by Julian Robertson of Tiger Management
From 2001-2007, he returned 47% on
average
Descendant of Peter Stuyvesant, the man who built the ‘wall’ in Wall St
quarter as GOOG was a consensus buy. Tiger’s top two holdings of Yandex (YNDX) and Apple (AAPL) were both trimmed 25% and they also cut their stake in high-flier Priceline.com (PCLN) by 36%. PCLN was featured in the equity analysis section of the most recent issue of Hedge Fund Wisdom (Q4 2011) if you haven’t had a chance to read the rationale behind owning that company. The most notable sales from Tiger during the quarter, though, were their reductions in their stakes in Baidu (BIDU), Viacom (VIA.B), and Liberty Media (LMCA). They trimmed each by 64%, 70%, and 50% respectively.
In terms of purchases, they were few and far between in Tiger’s book. What’s interesting is that instead of adding to many existing positions, they favored starting stakes in brand new companies. And even more intriguing is that instead of a tech oriented company, Tiger’s largest new buy is in that of Deckers (DECK), the purveyor of the trendy and fuzzy UGG boots.
As you look through Chase Coleman’s portfolio on the next page, you’ll notice a few key themes. He’s playing the ‘dominant’ internet plays (i.e. search engines) via Yandex, Google, and Baidu. He also has a lot of capital allocated to travel with a focus on international exposure via Priceline, MakeMyTrip, and HomeAway. Coleman also likes the big duopoly in payment processing (Mastercard & Visa) as the world continues its secular shift from using physical currency to paying with plastic (debit & credit cards). The important aspect of these two is that they bear no credit risk; they merely process the payments and take a cut.
Q1 2012 www.hedgefundwisdom.com
Tiger Global

44
Tiger Global First Quarter 2012 Portfolio:
Q1 2012 www.hedgefundwisdom.com
Continued on next page…
Rank Company Name Ticker Put/Call % of Portfolio Activity
Value x $1000 # of Shares
1 YANDEX N V YNDX
18.1% Cut -25% $1,074,800 40,000,000 2 Apple Inc. AAPL
12.4% Cut -24% $734,449 1,225,000
3 Google Inc. GOOG
10.1% Added 29% $598,918 934,000 4 Priceline.com Inc PCLN
9.5% Cut -36% $563,238 785,000
5 Liberty Global Inc. LBTYA
6.8% Cut -15% $404,396 8,075,000 6 Visa, Inc. V
5.4% Cut -10% $319,190 2,705,000
7 Mastercard Incorporated MA
5.3% Cut -4% $311,620 741,000 8 Liberty Global Inc. LBTYK
3.0% Cut -10% $179,094 3,739,703
9 MakeMyTrip Limited MMYT
2.8% Unchanged $165,037 7,184,866 10 Live Nation Entertainment LYV
2.6% Cut -3% $151,265 16,092,048
11 Baidu, Inc. BIDU
2.1% Cut -64% $126,820 870,000 12 HOMEAWAY INC AWAY
2.0% Unchanged $118,846 4,691,881
13 Deckers Outdoor Corp. DECK
2.0% New $118,219 1,875,000 14 Energy Select Sector SPDR XLE CALL 1.9% Cut -3% $111,213 1,550,000 15 Frontier Communications FTR
1.7% New $100,080 24,000,000
16 Liberty Media Corp LMCA
1.4% Cut -50% $84,086 953,898 17 Viacom Inc 6.85% Pfd VIAB
1.2% Cut -70% $73,088 1,540,000
18 Genpact Ltd. G
1.2% Unchanged $68,440 4,198,790 19 Ancestry.com Inc. ACOM
0.8% New $45,480 2,000,000
20 R.R. Donnelley & Sons Co RRD
0.8% New $44,604 3,600,000 21 SUPERVALU Inc. SVU
0.7% New $42,825 7,500,000
22 RenaissanceRe Holdings RNR
0.6% Added 54% $37,865 500,000 23 Amazon.com Inc. AMZN
0.6% Cut -80% $36,857 182,000
24 CompaniaCerveceriasUnidas CU
0.6% Cut -6% $36,290 461,179 25 Crown Castle International CCI
0.6% New $35,471 665,000
26 Polypore International Inc. PPO
0.6% Unchanged $35,160 1,000,000 27 Focus Media Holding Ltd. FMCN
0.6% New $35,168 1,400,000
28 UBIQUITI NETWORKS UBNT
0.6% Added 175% $34,793 1,100,000 29 Qihoo 360 Technology QIHU
0.6% New $33,114 1,354,343
30 LINKEDIN CORP LNKD
0.5% Unchanged $30,597 300,000 31 W.R. Grace & Co. GRA
0.5% New $30,345 525,000
32 Sony Corporation SNE CALL 0.5% Added 27% $27,001 1,300,000 33 C&J ENERGY CJES
0.4% Unchanged $22,238 1,250,000
34 Northern Oil and Gas NOG
0.4% New $20,740 1,000,000 35 Northern Oil and Gas NOG PUT 0.4% New $20,740 1,000,000 36 KIT digital, Inc. KITD
0.3% New $16,390 2,276,400
37 ARCOS DORADOS ARCO
0.3% Added 110% $16,781 927,645 38 hhgregg, Inc. HGG
0.2% Added 10% $12,506 1,098,932
39 BITAUTO HOLDINGS BITA
0.2% Cut -37% $8,834 1,666,761 40 TAL Education Group XRS
0.2% Unchanged $8,880 800,000
41 YELP INC YELP
0.1% New $4,034 150,000

45
Tiger Global
Next Page: Passport Capital
Q1 2012 www.hedgefundwisdom.com
First Quarter 2012 Portfolio: …Continued
Rank Company Name Ticker Put/Call % of Portfolio Activity
Value x $1000 # of Shares
42 Sears Holdings SHLD
Sold
- 43 Coinstar Inc. CSTR
Sold
-
44 Heckmann Corp HEK
Sold
- 45 Endurance Specialty ENH
Sold
-
46 Validus Holdings, Ltd. VR
Sold
- 47 Priceline.com Inc PCLN CALL
Sold
-
48 MICHAEL KORS KORS
Sold
- 49 IAC/InterActiveCorp. IACI
Sold
-
50 Sears Holdings Corp SHLD PUT
Sold
- 51 Axis Capital Holdings Ltd. AXS
Sold
-
52 Harry Winston Diamond HWD
Sold
- 53 Everest Re Group Ltd. RE
Sold
-

46
John Burbank’s Passport Capital purchased a huge (in terms of notional value) put option position on the S&P 500 during the first quarter. Given that movement, it won’t surprise you either to learn that Passport’s main Global Fund has actually been net short. Burbank is decisively bearish and has high conviction in his stance because he feels a recession is coming in the United States in the second half of the year. As the market has drifted lower lately, Burbank has to love the action. He addressed his bearishness in his first quarter letter to investors, writing, “For several years now, we have said that we would raise our risk budget when we felt it was prudent. In large part this would generally require three things to occur: 1) a lower correlation regime that could benefit idiosyncratic stock selection;
Key Takeaways
2%3'4"$565"#$-'2,I6!2Y,!Z[[!'2,P)!,H51!
I&&0&!'I.)!,H51!
J2!L?5H0?%!"?1!'JL")!,H51!
,0&54HE!',D")!
@?5&04?%1!2&%&35!2&35#0!'7-G)!,H51!
L&5V%4/!'LK-7)!,H51!
NC>>!'NPLL)!
25!\H9&!'28\)!,H51!
@&5A?>&/!'@.(R)!
2Y,!@&5?%1!?>9!@4>4>$!'7@.)!,H51!
2#%H54?!'2(*)!
!
."/,'!"89/%6%/)':&6':;-'*9&3#?$0#!'*"6()!
,4%$04EO1!,049&!',,<)!
J2!25&&%!'7)!
<K!;>9H1504&1!'<K)!
@&?9!\#A>1#>!LH50454#>!'@\L)!
@#1?43!'@(2)!
*%+A?!L?5H0?%!6&1#H03&1!'*L6)!
@#>1?>5#!'@(L)!
John Burbank
View Passport Capital’s Updated Portfolio on the Next Page
Has returned 22% annualized
Makes plays based on macro themes; has thought markets to be overvalued
for many years now
Received his MBA from Stanford & undergraduate degree from Duke
2) the potential for a less-skewed distribution between stock winners and losers; and 3) conviction in our macro bottom-up view. Since the March 2009 equity low, the S&P has rallied 122%. The Russell 2000 has rallied over 152% in that time. Given our forwardlooking economic assessment, this is the first time in a long while where we believe the best opportunity to derive idiosyncratic alpha is in security selection on the short side.”
Burbank feels that central bank liquidity has fueled violent rallies and that the easy money has already been made. So while he obviously has long positions (detailed on the next page), take these with a grain of salt given his net positioning to the short side. He also has stated that he favors Saudi equities on the long side. Realistically, three Saudi plays are in his top ten holdings that won’t be listed on the next page: Yanbu National Petroleum (YANSAB AB), Etihad Etisalat (EEC AB), and Saudi Basic Industries (SABIC AB).
Vivus (VVUS) in the US continues to be Passport’s top long investment. Of this stake, Burbank writes that, “Vivus announced that the FDA delayed their decision date on whether to approve the obesity pill Qnexa by three months to July 17th. We believe this delay is for more drug-labeling discussion and does not change our view that a pre-approval trial is unlikely to be required. We continue to believe that a positive outcome this summer coupled with M&A activity prior to launch of the drug in the second half of the year would create an ideal situation to maximize profits.”
Q3 2010 www.hedgefundwisdom.com
Passport Capital

47
Passport Capital First Quarter 2012 Portfolio:
Continued on next page…
Q1 2012 www.hedgefundwisdom.com
Rank Company Name Ticker Put/Call % of Portfolio Activity
Value x $1000 # of Shares
1 SPDR S&P 500 SPY PUT 27.1% New $798,586 5,675,000 2 Cytec Industries Inc. CYT
6.0% Cut -1% $176,710 2,906,900
3 iShares Russell 2000 IWM PUT 5.9% Add 386% $173,157 2,090,000 4 VIVUS Inc. VVUS
5.6% Added 72% $165,213 7,388,793
5 SPDR Gold Shares GLD PUT 3.9% Added 545% $115,119 710,000 6 Marathon Petroleum MPC
3.6% Cut -37% $104,459 2,409,100
7 Deere & Company DE PUT 2.8% New $80,900 1,000,000 8 Google Inc. GOOG
2.1% Added 393% $62,008 96,700
9 Liberty Media Interactive LINTA
2.1% Cut -27% $60,973 3,194,000 10 US Natural Gas Fund LP XUNGX PUT 2.0% New $57,312 3,600,000 11 Apple Inc. AAPL
1.9% Added 257% $54,859 91,500
12 PRETIUM RES INCCOM PVG
1.8% New $53,317 3,730,336 13 Materials Select Sector XLB PUT 1.6% New $46,952 1,270,000 14 Netflix, Inc. NFLX PUT 1.6% New $46,016 400,000 15 Wynn Resorts Ltd. WYNN
1.5% New $44,058 352,800
16 St. Jude Medical Inc. STJ PUT 1.5% New $44,310 1,000,000 17 Methanex Corp. MEOH
1.4% New $42,037 1,295,400
18 SPDR Metals & Mining XME PUT 1.4% New $40,257 810,000 19 Thoratec Corp. THOR
1.3% Cut -44% $37,634 1,116,400
20 Huntsman Corporation HUN
1.3% Added 29% $37,339 2,665,200 21 Accuray Incorporated ARAY
1.2% Unchanged $35,300 5,000,000
22 Solutia Inc. SOA
1.1% New $33,075 1,183,800 23 Praxair Inc. PX
1.1% Add 304% $32,638 284,700
24 Georgia Gulf Corp. GGC
1.1% New $32,742 938,700 25 Mercadolibre, Inc. MELI
1.0% Cut -8% $28,672 293,200
26 HCA HLDGS INC COM HCA
1.0% Cut -3% $27,904 1,127,900 27 Timken Co. TKR
0.8% Added 77% $24,873 490,200
28 Amazon.com Inc. AMZN
0.7% New $21,669 107,000 29 GoldMiners ETF GDX PUT 0.7% New $20,819 420,000 30 QUALCOMM QCOM
0.6% Added 297% $18,601 273,300
31 Family Dollar Stores Inc. FDO
0.6% Added 142% $17,889 282,700 32 SPDR Gold Shares GLD
0.5% Added 8% $16,001 98,700
33 Airgas Inc. ARG
0.5% New $15,632 175,700 34 VMware, Inc. VMW
0.5% Added 511% $15,732 140,000
35 Thomas & Betts Corp. TNB
0.5% New $15,310 212,900 36 Owens-Illinois, Inc. OI
0.5% Unchanged $15,257 653,700
37 LyondellBasell Industries LYB
0.5% New $15,356 351,800 38 Superior Energy Services SPN
0.5% Cut -10% $14,972 568,000
39 Tyco International Ltd. TYC
0.5% Added 109% $13,427 239,000 40 Sherwin-Williams Co. SHW
0.5% New $13,475 124,000
41 Ecolab Inc. ECL
0.5% Unchanged $13,202 213,900 42 Procter & Gamble Co. PG
0.4% New $12,817 190,700
43 Boise Inc. BZ
0.4% Cut -21% $11,772 1,433,900 44 Sina Corp. SINA
0.3% Added 135% $10,049 154,600
45 Teck Resources Limited TCK
0.3% Cut -44% $9,949 279,000

48
First Quarter 2012 Portfolio: …Continued
Passport Capital
Q1 2012 www.hedgefundwisdom.com
Continued on next page…
Rank Company Name Ticker Put/Call % of Portfolio Activity
Value x $1000 # of Shares
46 OCEAN RIG ORIG
0.3% Cut -59% $9,482 561,070 47 CHEMTURA CORP CHMT
0.3% Cut -58% $7,974 469,600
48 eBay Inc. EBAY
0.3% New $7,380 200,000 49 PACIFIC DRILLING PACD
0.2% Unchanged $7,205 711,911
50 News Corp. NWSA
0.2% New $7,096 360,000 51 Nevsun Resources Ltd. NSU
0.2% Cut -62% $6,926 1,877,700
52 Cliffs Natural Resources CLF
0.2% Cut -43% $6,774 97,800 53 Watson Pharmaceuticals WPI
0.2% New $6,706 100,000
54 W.R. Grace & Co. GRA
0.2% Cut -33% $6,595 114,100 55 Southern Copper Corp. SCCO
0.2% Cut -74% $6,466 203,899
56 Abbott Laboratories ABT
0.2% New $6,129 100,000 57 Alcoa, Inc. AA
0.2% Cut -33% $6,120 610,800
58 Gilead Sciences Inc. GILD
0.2% New $6,108 125,000 59 Rock-Tenn Co. RKT
0.2% Cut -45% $5,553 82,200
60 WebMD Health Corp. WBMD
0.2% Cut -71% $5,671 221,700 61 Dendreon Corp. DNDN
0.2% New $5,328 500,000
62 Walter Energy, Inc. WLT
0.2% Cut -76% $5,181 87,500 63 Keegan Resources Inc. KGN
0.2% Cut -30% $5,050 1,332,900
64 Idenix Pharmaceuticals IDIX
0.2% New $4,895 500,000 65 Dollar General Corp DG
0.2% New $4,851 105,000
66 Allot Communications ALLT
0.1% New $4,135 177,850 67 Illumina Inc. ILMN
0.1% New $4,209 80,000
68 Las Vegas Sands LVS
0.1% Added 16% $4,260 74,000 69 Amylin Pharmaceuticals AMLN
0.1% New $3,744 150,000
70 Ingersoll-Rand Plc IR
0.1% New $3,903 94,400 71 Deckers Outdoor Corp. DECK
0.1% New $3,531 56,000
72 Deckers Outdoor Corp. DECK PUT 0.1% New $3,468 55,000 73 Targacept, Inc. TRGT CALL 0.1% New $3,210 627,000 74 China Ming Yang Wind MY
0.1% Unchanged $2,800 1,186,500
75 Western Refining Inc. WNR
0.1% Unchanged $2,823 150,000 76 NIELSEN HOLDINGS NLSN
0.1% Cut -5% $3,014 100,000
77 Anheuser-Busch InBev BUD
0.1% Cut -22% $2,712 37,300 78 SPX Corporation SPW
0.1% New $2,671 34,450
79 CARBO Ceramics Inc. CRR
0.1% Unchanged $2,710 25,700 80 Express Scripts Inc. ESRX
0.1% New $2,709 50,000
81 Qihoo 360 Technology Co QIHU
0.1% Cut -53% $2,738 112,000 82 Halozyme Therapeutics HALO
0.1% New $2,552 200,000
83 Caterpillar Inc. CAT
0.1% New $2,482 23,300 84 Momenta Pharma MNTA
0.1% New $2,298 150,000
85 MONSTER BEVERAGE MNST
0.1% Cut -15% $2,422 39,000 86 Key Energy Services Inc. KEG
0.1% Unchanged $2,322 150,300
87 PioneerNatural Resources PXD
0.1% New $2,388 21,400 88 Union Pacific Corporation UNP
0.1% New $2,488 23,150
89 Masimo Corporation MASI
0.1% New $2,338 100,000 90 National Oilwell Varco NOV
0.1% Unchanged $2,177 27,400

49
First Quarter 2012 Portfolio: …Continued
Passport Capital
Q1 2012 www.hedgefundwisdom.com
Continued on next page…
Rank Company Name Ticker Put/Call % of Portfolio Activity
Value x $1000 # of Shares
91 HSN, Inc. HSNI
0.1% Added 93% $2,206 58,000 92 zipRealty Inc. ZIPR
0.1% Unchanged $2,081 1,519,058
93 TUDOU TUDO
0.1% Added 31% $1,636 55,400 94 PulteGroup, Inc. PHM PUT 0.1% New $1,416 160,000 95 MSC Industrial Direct MSM
0.0% New $1,249 15,000
96 Baker Hughes BHI
0.0% Cut -35% $1,158 27,600 97 Research In Motion RIMM CALL 0.0% Added 143% $1,250 85,000 98 Giant Interactive Group GA
0.0% Unchanged $929 189,500
99 Albemarle Corp. ALB
0.0% Unchanged $888 13,900 100 Celldex Therapeutics CLDX CALL 0.0% New $509 100,000 101 SandRidge Energy SD
0.0% Unchanged $392 50,000
102 Halliburton Company HAL
0.0% Unchanged $7 200 103 NCI Building Systems NCS
0.0% New $78 6,800
104 MISSION NEWENERGY MNELF
0.0% Unchanged $4 8,233 105 Watts Water Technologies WTS
0.0% New $77 1,900
106 ITC Holdings Corp. ITC
0.0% Unchanged $77 1,000 107 Tetra Tech Inc. TTEK
0.0% Unchanged $116 4,400
108 Pike Electric Corporation PIKE
0.0% New $83 10,100 109 Johnson Controls Inc. JCI
0.0% Unchanged $62 1,900
110 The Andersons, Inc. ANDE
0.0% Unchanged $107 2,200 111 Pentair, Inc. PNR
0.0% Cut -21% $90 1,900
112 Rentech, Inc. RTK
0.0% New $83 39,800 113 Cosan Ltd. CZZ
0.0% Cut -95% $79 5,300
114 AVX Corp. AVX
0.0% Unchanged $80 6,000 115 MYR Group, Inc. MYRG
0.0% Cut -50% $57 3,200
116 AO Smith Corp. AOS
0.0% New $76 1,700 117 Acuity Brands, Inc. AYI
0.0% New $82 1,300
118 Barrick Gold Corp ABX
Sold
- 119 Shutterfly, Inc. SFLY
Sold
-
120 The Home Depot HD PUT
Sold
- 121 ADECOAGRO S.A. AGRO
Sold
-
122 Pilgrim's Pride Corp PPC
Sold
- 123 20+ Year Treasury TLT CALL
Sold
-
124 NextEra Energy, Inc. NEE
Sold
- 125 Arcelor Mittal MT
Sold
-
126 United States Steel Corp. X
Sold
- 127 Monsanto Co. MON CALL
Sold
-
128 Rowan Companies Inc. RDC
Sold
- 129 CF Industries Holdings CF
Sold
-
130 Mead Johnson Nutrition MJN
Sold
- 131 First Solar, Inc. FSLR
Sold
-
132 AK Steel Holding Corp AKS
Sold
- 133 Mosaic Co. MOS
Sold
-
134 Alpha Natural Resources ANR
Sold
- 135 Trina Solar Ltd. TSL
Sold
-
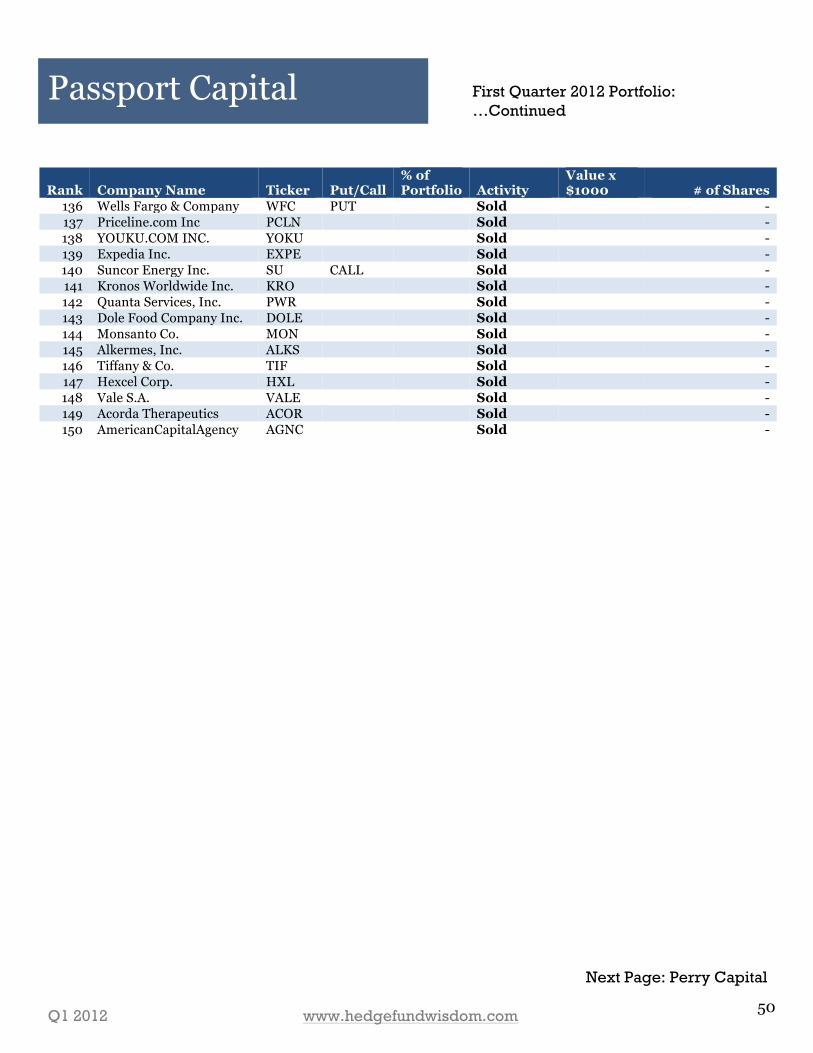
50
First Quarter 2012 Portfolio: …Continued
Passport Capital
Q1 2012 www.hedgefundwisdom.com
Next Page: Perry Capital
Rank Company Name Ticker Put/Call % of Portfolio Activity
Value x $1000 # of Shares
136 Wells Fargo & Company WFC PUT
Sold
- 137 Priceline.com Inc PCLN
Sold
-
138 YOUKU.COM INC. YOKU
Sold
- 139 Expedia Inc. EXPE
Sold
-
140 Suncor Energy Inc. SU CALL
Sold
- 141 Kronos Worldwide Inc. KRO
Sold
-
142 Quanta Services, Inc. PWR
Sold
- 143 Dole Food Company Inc. DOLE
Sold
-
144 Monsanto Co. MON
Sold
- 145 Alkermes, Inc. ALKS
Sold
-
146 Tiffany & Co. TIF
Sold
- 147 Hexcel Corp. HXL
Sold
-
148 Vale S.A. VALE
Sold
- 149 Acorda Therapeutics ACOR
Sold
-
150 AmericanCapitalAgency AGNC
Sold
-

51
Richard Perry’s firm started a massive new stake in pharmacy benefit manager Express Scripts (ESRX) during the quarter. They originally initiated the position as a way to play the merger between ESRX and Medco Health. But upon the conclusion of the deal, they continue to see opportunity in the combined entity. Perry Partners outlined their thesis behind ESRX in their first quarter letter to investors, writing, “At the levels we bought stock, our analysis suggests the market is underestimating the earnings power of the combined company. We believe that over time the company will realize close to $1.4 billion in cost synergies, well in excess of the $1 billion management is currently guiding towards. In addition, the company should be able to resume share repurchases within 18 months once it pays down much of the leverage raised to finance the merger. The current valuation of
Key Takeaways
2%3'4"$565"#$-'./+0&11!2304+51!'.267)!
*:#>!,0#9H351!'*D,)!
2,I6!2Y,!Z[[!'2,P)!
*$>43#W.?$%&!@4>&1!'*.@)!
*%%4&9!L&:?9?!"#%9!'*LD)!
8&:?!,A?0E?!'8.D*)!<?%%1!
42A?0&1!6H11&%%!b[[[!';N@)!,H51!
!
."/,'!"89/%6%/)':&6':;-'R&05]!'R8S)!
I#%%?0!8A04V5C!'I8")!
@#5#0#%?!@#X4%45C!'@@;)!
"##9043A!'"6)!
645&!*49!'6*I)!
6G2!,0&V&00&9!'6G2W,6)!
6G2!,0&V&00&9!'6G2W,,)!
2#H5A&0>!J>4#>!^!X#H$A5!#H5!
!
11.5x 2013 combined earnings does not reflect that of a market leading healthcare company which expects to grow earnings by more than 15% over the next three years. The deal closed on April 2, 2012 and we continue to find the risk/reward compelling.”
The hedge fund firm also initiated new holdings in two gold miners: Agnico-Eagle Mines (AEM) and Allied Nevada Gold (ANV). They believe that AEM will be able to create value from its assets and can further increase its dividend yield. Perry feels that ANV is undertaking a massive expansion project where it attempts to expand production six-fold and so the stock should “re-rate” over time. They also hypothesize that the company could be a takeover target as two of the world’s largest gold miners also reside in ANV’s home state of Nevada. Perry has hedged the exposure to these individual equity plays with a basket of senior gold mining companies.
The last interesting takeaway from Perry’s portfolio is the fact that they completely exited their risk arbitrage plays in Motorola Mobility (MMI) and Goodrich (GR). This is a bit peculiar considering both are being taken over in the near future and have an impending catalyst. Given Perry’s propensity to invest in event-driven plays, perhaps they found more compelling places to allocate capital for the time being. Lastly, while the next page shows a new stake in Avon Products (AVP) from the first quarter, note that Perry has actually significantly reduced their position recently.
View Perry Capital’s Updated Portfolio on the Next Page
Q1 2012 www.hedgefundwisdom.com
Perry Capital Richard Perry
Average return of over 15% since inception; only 1 losing year in 22
years (2008)
Seeks to deliver strong returns with low correlations to equity markets

52
Perry Capital First Quarter 2012 Portfolio:
Q1 2012 www.hedgefundwisdom.com
Rank Company Name Ticker Put/Call % of Portfolio Activity
Value x $1000 # of Shares
1 Express Scripts Inc. ESRX
12.85% New $267,107 4,930,000 2 American Tower Corp. AMT
9.82% Added 12% $204,241 3,240,886
3 Yahoo! Inc. YHOO
9.53% Added 23% $198,022 13,010,675 4 DELPHI DLPH
9.06% Cut -20% $188,397 5,961,919
5 BP plc BP CALL 6.49% Cut -22% $135,000 3,000,000 6 Avon Products Inc. AVP
5.12% New $106,480 5,500,000
7 Universal American Corp UAM
3.99% Unchanged $82,943 7,694,185 8 Anadarko Petroleum Co APC CALL 3.91% Added 7% $81,239 1,037,000 9 SPDR S&P 500 SPY
3.87% New $80,547 572,026
10 RBS Pfd M RBS-PM
3.69% Cut -3% $76,745 4,668,176 11 Agnico-Eagle Mines Ltd. AEM
3.32% New $68,938 2,065,258
12 Anadarko Petroleum Corp APC
3.26% Cut -59% $67,848 866,067 13 RBS Pfd S RBS-PS
3.20% Unchanged $66,576 3,986,560
14 BP plc BP
3.08% Cut -53% $64,067 1,423,700 15 Allied Nevada Gold Corp. ANV
2.60% New $53,971 1,659,100
16 Teva Pharmaceutical TEVA CALL 2.26% New $46,980 1,042,600 17 RBS Pfd T RBS-PT
2.24% Cut -29% $46,672 2,456,395
18 RBS Pfd Q RBS-PQ
2.16% Unchanged $44,941 2,645,164 19 iShares Russell 2000 Index IWM PUT 1.82% New $37,753 455,900 20 Johnson & Johnson JNJ
1.48% Unchanged $30,741 466,051
21 RBS Pfd N RBS-PN
1.27% Cut -10% $26,348 1,630,451 22 North American Energy NOA
1.08% Unchanged $22,532 4,598,466
23 United Community Banks UCBI
0.95% Cut 0% $19,822 2,033,030 24 Teva Pharmaceutical TEVA
0.51% New $10,668 236,755
25 Kinross Gold Corporation KGC
0.47% New $9,790 1,000,000 26 SanofiContingentValueRight GCVRZ
0.37% Cut 0% $7,628 5,650,572
27 CAESARS ENTERTAINMENT CZR
0.29% New $5,938 402,839 28 Bristol-Myers Squibb Co BMY CALL 0.06% New $1,350 40,000 29 Cisco Systems, Inc. CSCO
0.04% New $755 35,700
30 BioMarin Pharmaceutical Inc. BMRN
0.04% New $784 22,900 31 Edwards Lifesciences Corp. EW
0.04% New $778 10,700
32 Northrop Grumman Co NOC
0.04% New $745 12,200 33 General Motors Warrants GM/WS/A
0.04% Cut -1% $761 45,743
34 Becton, Dickinson and Co BDX
0.04% New $745 9,600 35 Arrow Electronics, Inc. ARW
0.04% New $739 17,600
36 Hyatt Hotels Corporation H
0.04% New $786 18,400 37 McGraw-Hill Companies MHP
0.04% New $771 15,900
38 Intel Corporation INTC
0.04% New $745 26,500 39 iShares Silver Trust SLV CALL 0.04% New $785 25,000 40 International Flavors IFF
0.04% New $809 13,800
41 General Mills Inc. GIS
0.04% New $753 19,100 42 Bristol-Myers Squibb BMY
0.04% New $749 22,200
43 Fidelity National Financial FNF
0.04% New $759 42,100 44 Wal-Mart Stores Inc. WMT
0.04% New $808 13,200
45 Dollar General Corporation DG
0.04% New $762 16,500
Continued on next page…

53
Perry Capital First Quarter 2012 Portfolio:
Q1 2012 www.hedgefundwisdom.com
Next Page: Glenview Capital
Rank Company Name Ticker Put/Call % of Portfolio Activity
Value x $1000 # of Shares
46 Essex Property Trust Inc. ESS
0.04% New $758 5,000 47 Microchip Technology Inc. MCHP
0.04% New $755 20,300
48 AFLAC Inc. AFL
0.03% New $676 14,700 49 Silver Wheaton Corp. SLW
0.03% New $608 18,300
50 Wynn Resorts Ltd. WYNN
0.03% New $574 4,600 51 Atmel Corporation ATML
0.03% New $586 59,400
52 Titanium Metals Corp TIE
0.03% New $542 40,000 53 Southern Copper SCCO
0.03% New $545 17,200
54 Pfizer Inc. PFE
0.03% New $657 29,000 55 NVIDIA Corporation NVDA
0.03% New $636 41,300
56 United Therapeutics UTHR
0.03% New $721 15,300 57 Smithfield Foods SFD
0.03% New $661 30,000
58 Morgan Stanley MS
0.03% New $568 28,900 59 Pepsico, Inc. PEP
0.03% New $531 8,000
60 SPDR Gold Shares GLD CALL 0.02% New $405 2,500 61 Sohu.com Inc. SOHU
0.02% New $513 9,300
62 Human Genome Sciences HGSI
0.02% New $494 59,900 63 Paychex Inc. PAYX
0.02% New $496 16,000
64 General Motors Warrants GM/WS/B
0.02% Cut -1% $512 45,743 65 Amazon.com Inc. AMZN
0.01% New $304 1,500
66 MBIA Inc. MBI
0.01% New $299 30,500 67 CARPENTER TECH CRS
0.01% New $245 4,700
68 ADTRAN Inc. ADTN
0.01% New $299 9,600 69 Cypress Semiconductor CY
0.01% New $234 15,000
70 The Cooper Companies Inc. COO
Sold
- 71 RBS Pfd R RBS-PR
Sold
-
72 HERTZ GLOBAL HOLDING HTZ
Sold
- 73 Dollar Thrifty Automotive DTG
Sold
-
74 MedcoHealth Solutions Inc. MHS
Sold
- 75 Motorola Mobility Holdings MMI
Sold
-
76 Walgreen Co. WAG CALL
Sold
- 77 iShares Emerging Markets EEM PUT
Sold
-
78 Goodrich Corp. GR
Sold
- 79 RBS Pfd P RBS-PP
Sold
-
80 The Cooper Companies Inc. COO CALL
Sold
- 81 AFLAC Inc. AFL PUT
Sold
-
82 Rite Aid Corp. RAD
Sold
- 83 Yahoo! Inc. YHOO CALL
Sold
-
84 Southern Union Co. SUG
Sold
- 85 General Motors GM
Sold
-

54
At the Ira Sohn Conference in New York, Larry Robbins recently shared his thoughts on what he’s investing in. He basically said to go long hospitals and life sciences and to short treasuries, utilities, and the defense sector. He’s not alone in the ‘short treasuries’ camp as Leon Cooperman has been blasting the asset class for some time now. Robbins laid out his long thesis for hospitals by pointing out that EBITDA has grown every year for them as they offer 9% CAGR, 1% admission growth, and 2% leverage. He says hospitals benefit from Medicaid eligibility as it reduces bad debt expense. The Glenview manager pointed out that half of hospitals are non-profit and “just get by.” HCA Holdings (HCA) is one of his top longs and runs a private network of hospitals. Robbins points out that it’s unlikely that the government could unilaterally take a for profit hospital’s profits from reimbursement. At price
Key Takeaways
2%3'4"$565"#$-'8&>&5!R&?%5A3?0&!'8R<)!
@3B&11#>!'@<B)!<?%%1!
*&5>?!'*.8)!
.c80?9&!K4>?>34?%!'.8K<)!
<454$0#H+!'<)!
*++%&!'**,-)!
;>$&01#%%!6?>9!';6)!
R#1+40?!'R2,)!
!
."/,'!"89/%6%/)':&6':;-'TH&15!I4?$>#15431!'I"7)!
D4?3#E!'D;*FG)!
<D2!<?0&E?0U!'<D2)!
66!I#>>&%%&C!'66I)!
K?E4%C!I#%%?0!'KI()!
2&?$?5&!8&3A>#%#$C!'287)!
-?X#0?5#0C!<#0+!'-R)!
to earnings ratio averages of 8.1x for the sector, he likes this play. In other health sector plays, Robbins started a brand new stake in Tenet Healthcare (THC) in March. He also over doubled his position in Health Management Associates (HMA).
Robbins recently also provided a short idea that is worth highlighting considering the rarity in which hedge fund managers reveal them. He says to short the utility play ITC Holdings (ITC), a transmission company. He argues they’re essentially overcharging customers as the users overpay by anywhere between $260 million to $550 million. Robbins says there’s no accounting issues but the company is just getting a “sweetheart deal” that regulators won’t let go on forever. He says that if you cut the company’s return on equity by 194 basis points, earnings get hit by 18%. While the consensus EPS is $4.00, he thinks it could really be $2.00.
Glenview Capital’s largest disclosed position continues to be Life Technologies (LIFE), a company that sells equipment and consumables to pharma & biotech companies, hospitals, etc. Most of their revenue is high margin and recurring, which is attractive. The bull case on this stock centers on its purchase of Ion Torrent (they make a genetic sequencer). Once free cashflow from this ramps up in a few years, LIFE could potentially be worth much more. Overall, the company should benefit from an aging population and strong trends in genetic technology. The potential risk with this company is that it derives over 40% of its revenue from the government and education sectors, so budget cuts could potentially put this in jeopardy.
View Glenview Capital’s Updated Portfolio on the Next Page
Q1 2012 www.hedgefundwisdom.com
Glenview Capital Larry Robbins
Known for taking concentrated positions in large caps
Previously a trader at Leon
Cooperman’s Omega Advisors

55
Continued on Next Page…
Glenview Capital First Quarter 2012 Portfolio:
Q1 2012 www.hedgefundwisdom.com
Rank Company Name Ticker Put/Call % of Portfolio Activity
Value x $1000 # of Shares
1 Life Technologies Corp LIFE
10.4% Cut -15% $573,927 11,755,972 2 Crown Castle International CCI
5.9% Cut -15% $327,068 6,131,756
3 Flextronics International FLEX
5.6% Added 17% $312,029 43,217,244 4 AIG AIG
5.2% Added 29% $289,354 9,385,465
5 Thermo Fisher Scientific TMO
4.7% Added 0% $262,138 4,649,487 6 CIGNA Corporation CI
4.6% Added 88% $253,498 5,147,161
7 Fidelity National Info FIS
4.6% Added 4% $252,817 7,633,374 8 Cardinal Health, Inc. CAH
4.5% Added 141% $248,206 5,757,505
9 BMC Software Inc. BMC
4.1% Added 3% $224,765 5,596,736 10 Xerox Corp. XRX
3.6% Cut -2% $201,364 24,936,694
11 HCA HLDGS INC COM HCA
3.5% Cut -11% $192,235 7,770,229 12 Aon Corporation AON
3.2% Unchanged $176,132 3,590,138
13 Time Warner Cable Inc. TWC
2.9% Added 30% $162,857 1,998,240 14 URS Corporation URS
2.8% Added 1% $152,529 3,587,234
15 Lincare Holdings Inc. LNCR
2.5% Cut -1% $140,704 5,436,790 16 McKesson Corporation MCK
2.5% Cut -66% $138,778 1,581,152
17 Tenet Healthcare Corp. THC
2.4% New $134,905 25,405,900 18 Lowe's Companies Inc. LOW
2.2% Cut -13% $123,622 3,939,500
19 Tyco International Ltd. TYC
2.1% Cut -53% $117,987 2,100,152 20 McKesson Corporation MCK CALL 1.6% New $87,770 1,000,000 21 The Babcock & Wilcox Co BWC
1.5% Added 27% $81,223 3,154,277
22 Health Management Assoc HMA
1.4% Added 118% $75,763 11,274,276 23 Take-Two Interactive TTWO
1.4% Cut -12% $75,686 4,919,489
24 Liberty Global Inc. LBTYA
1.3% Added 23% $72,849 1,454,647 25 American Tower Corp. AMT
1.3% Cut -57% $72,207 1,145,780
26 Sealed Air Corporation SEE
1.3% Cut -22% $71,356 3,695,310 27 Target Corp. TGT
1.2% Cut -56% $66,583 1,142,658
28 Meritor, Inc. MTOR
1.1% Cut -3% $61,714 7,647,279 29 General Motors GM
1.0% Cut -18% $52,823 2,059,371
30 Aetna Inc. AET
0.9% New $51,493 1,026,583 31 Lifepoint Hospitals Inc. LPNT
0.9% Add 154% $49,649 1,258,860
32 ETRADE Financial Corp ETFC
0.9% New $49,172 4,490,565 33 Sprint Nextel Corp. S
0.8% Added 45% $45,618 16,006,206
34 Citigroup, Inc. C
0.8% New $42,493 1,162,600 35 Clearwire Corporation CLWR
0.7% Unchanged $39,807 17,459,027
36 Apple Inc. AAPL
0.5% New $28,838 48,100 37 Ingersoll-Rand Plc IR
0.5% New $27,568 666,700
38 Mueller Water Products MWA
0.5% Added 16% $25,563 7,676,685 39 Hospira Inc. HSP
0.4% New $24,561 656,900
40 State Street Corp. STT
0.4% Cut -14% $23,558 517,755 41 Rovi Corporation ROVI
0.4% New $23,143 711,000
42 Express Scripts Inc. ESRX
0.4% Cut -64% $21,506 396,936 43 Apollo Group Inc. APOL
0.4% New $21,221 549,200
44 Time Warner Inc. TWX
0.3% New $14,349 380,100 45 TRIPADVISOR TRIP
0.2% New $11,967 335,500

56
First Quarter 2012 Portfolio: …Continued
Glenview Capital
Q1 2012 www.hedgefundwisdom.com
Next Page: Viking Global
Rank Company Name Ticker Put/Call % of Portfolio Activity
Value x $1000 # of Shares
46 Hartford Financial HIG
0.2% New $11,472 544,200 47 HartfordFinancial Warrant HIG/WS
0.1% Unchanged $7,016 526,750
48 UNWIRED PLANET INC UPIP
0.1% Unchanged $5,829 2,568,031 49 RBS Pfd S RBS-PS
0.1% Unchanged $4,178 250,000
50 Citigroup Warrant C/WS/A
0.1% Unchanged $3,682 8,561,020 51 RBS Pfd N RBS-PN
0.0% Unchanged $933 57,565
52 RBS Pfd P RBS-PP
0.0% Unchanged $535 32,819 53 First American Financial FAF
0.0% New $760 45,700
54 RBS Pfd R RBS-PR
0.0% Unchanged $330 20,000 55 Quest Diagnostics Inc. DGX
Sold
-
56 Viacom Inc 6.85% Pfd VIAB
Sold
- 57 Fiserv, Inc. FISV
Sold
-
58 R.R. Donnelley & Sons RRD
Sold
- 59 CVS Caremark Corp CVS
Sold
-
60 Oracle Corp. ORCL
Sold
- 61 Family Dollar Stores Inc. FDO
Sold
-
62 Seagate Technology PLC STX
Sold
- 63 Expedia Inc. EXPE
Sold
-
64 Laboratory Corp LH
Sold
- 65 Textron Inc. TXT
Sold
-

57
The first thing worth highlighting in regards to Viking Global pertains not to its portfolio, but rather to its personnel. In March, Jim Parsons (portfolio manager and management committee member) left the firm apparently due to differences regarding the direction Viking was heading. He was
Key Takeaways
2%3'4"$565"#$-'"##$%&!'"((")!
804+*9:41#0!'86;,)!!
NC>>!'NPLL)!
23A%HEX&0$&0!'2-G)!
25&043C3%&!'26<-)!
N?51#>!,A?0E?!'N,;)!
<0#=>!<?15%&!'<<;)!
R#E&!I&+#5!'RI)!
L#X%&!'L.)!
G&0U1A40&!R?5A?=?C!'G6BWG)!
"#%9E?>!2?3A1!'"2)!
;%%HE4>?!';-@L)!
8A&0E#!K41A&0!234&>54V43!'8@()!
!
."/,'!"89/%6%/)':&6':;-'<4$>?!'<;)!
<?+45?%!(>&!'<(K)!
"4%&?9!234&>3&1!'";-I)!
K&9./!'KI7)!
@&5-4V&!'@.8)!
&G?C!'.G*P)!
./+0&11!2304+51!'.267)!
<A&:0#>!'<D7)!
I6!R#05#>!'IR;)!
8?5?!@#5#01!'88@)!
*11H0&9!"H?0?>5C!'*"()!
,4#>&&0!L?5H0?%!6&1#H03&1!',7I)!
;>A4X45&/!';LR7)!
<A&3U,#4>5!2#V5=?0&!'<RB,)!
responsible for around 15% of their portfolio (mainly in the technology, media, and telecom sector as well as financials). Viking closed its flagship fund to new investments back in October as its larger size was starting to affect its investment strategy.
The main reason for pointing out this personnel change is because high-level departures have become somewhat of a trend at Viking, to the point that it’s a bit concerning. Before Parsons, another investment committee member, Dris Upitis, left in 2011. Additionally, David Ott, former CIO and one of the founders of the firm, left the year prior. While it’s obviously reassuring that the founder Andreas Halvorsen is still heading the Viking ship, it’s also a bit disconcerting that so many key members that have helped Viking succeed in the past are now gone (after all, Halvorsen said that Parsons made “significant contributions”). Viking’s Global Equities III fund finished 2011 up 7.69%. After all the departures, Tom Purcell and Dan Sundheim are now tagged as co-chief investment officers.
Turning to Viking’s latest portfolio activity, the massive addition to their pre-existing stake in Cisco Systems (CSCO) is the headline here. It’s now their top holding as they boosted the position by over 330% during the quarter. The hedge fund also began a brand new stake in Google (GOOG), as it ended the quarter as their second largest disclosed position. They also initiated a sizable stake in TripAdvisor (TRIP), the online travel website that was spun-off from Expedia (EXPE) a few months ago.
Andreas Halvorsen Viking Global
View Viking Global’s Updated Portfolio on the Next Page
Has returned an average of 13% annually over the past decade
Has been directing more capital to
Viking’s ‘best ideas’ & is taking a more concentrated portfolio approach
than in the past
Q1 2012 www.hedgefundwisdom.com

58
First Quarter 2012 Portfolio: Viking Global
Q1 2012 www.hedgefundwisdom.com
Continued on Next Page…
Rank Company Name Ticker Put/Call % of Portfolio Activity
Value x $1000 # of Shares
1 Cisco Systems, Inc. CSCO
5.6% Added 335% $682,950 32,290,800 2 Google Inc. GOOG
5.5% New $675,482 1,053,400
3 Invesco Ltd. IVZ
5.4% Cut -5% $662,942 24,857,253 4 LyondellBasell Industries LYB
5.1% Added 16% $621,366 14,235,209
5 Mastercard Incorporated MA
4.8% Added 21% $583,987 1,388,662 6 Priceline.com Incorporated PCLN
3.9% Added 15% $476,036 663,466
7 Valeant Pharmaceuticals VRX
3.7% Added 25% $450,348 8,387,949 8 U.S. Bancorp USB
3.4% Cut -39% $415,071 13,102,000
9 Biogen Idec Inc. BIIB
3.3% Added 118% $405,151 3,215,487 10 H&R Block, Inc. HRB
3.2% Added 0% $389,853 23,670,511
11 TRIPADVISOR TRIP
3.0% New $372,444 10,441,404 12 Citigroup, Inc. C
2.5% Added 324% $308,841 8,449,838
13 Wynn Resorts Ltd. WYNN
2.5% New $307,179 2,459,800 14 Albemarle Corp. ALB
2.1% Added 26% $262,355 4,104,428
15 News Corp. NWSA
1.9% Added 143% $233,232 11,833,200 16 Humana Inc. HUM
1.9% Added 21% $232,992 2,519,381
17 Schlumberger Limited SLB
1.9% New $227,819 3,257,817 18 QUALCOMM Incorporated QCOM
1.8% Cut -61% $223,313 3,281,127
19 Cardinal Health, Inc. CAH
1.8% Added 409% $222,448 5,160,026 20 Universal Health Services UHS
1.6% Added 3% $192,404 4,590,894
21 Stericycle, Inc. SRCL
1.6% New $189,643 2,267,373 22 Estee Lauder Companies EL
1.5% Added 24% $185,344 2,992,318
23 Prudential Financial, Inc. PRU
1.3% Cut -35% $162,963 2,570,800 24 Carter's, Inc. CRI
1.3% Added 32% $161,583 3,246,600
25 HOST HOTELS & RESORT HST
1.3% Cut 0% $152,820 9,306,978 26 Texas Instruments Inc. TXN
1.3% Added 1% $153,248 4,559,614
27 CareFusion Corporation CFN
1.2% Cut -44% $150,849 5,817,571 28 Watson Pharmaceuticals WPI
1.2% New $149,584 2,230,600
29 Crown Castle International CCI
1.2% New $143,984 2,699,368 30 The Home Depot, Inc. HD
1.1% New $134,967 2,682,721
31 Noble Corp. NE
1.1% New $134,007 3,576,400 32 DaVita, Inc. DVA
1.1% Cut -59% $133,009 1,475,102
33 Marsh & McLennan Co MMC
1.1% Added 141% $133,617 4,074,959 34 Berkshire Hathaway BRK-B
1.0% New $127,478 1,570,900
35 EOG Resources, Inc. EOG
0.9% Added 40% $110,161 991,549 36 Goldman Sachs GS
0.9% New $108,674 873,800
37 Illumina Inc. ILMN
0.9% New $108,818 2,068,400 38 Apple Inc. AAPL
0.9% Cut -87% $103,902 173,300
39 Sherwin-Williams Co. SHW
0.8% Cut -38% $102,448 942,751 40 Thermo Fisher Scientific TMO
0.8% New $99,419 1,763,385
41 American Tower Corp. AMT
0.7% Cut -56% $90,563 1,437,061 42 Baidu, Inc. BIDU
0.7% Cut -86% $88,307 605,800
43 SanDisk Corp. SNDK
0.7% Cut -47% $85,470 1,723,546 44 JPMorgan Chase & Co. JPM
0.6% Cut -53% $78,124 1,699,100
45 ACE Limited ACE
0.6% New $77,104 1,053,335

59
Viking Global
Q1 2012 www.hedgefundwisdom.com
First Quarter 2012 Portfolio: … Continued
Next: Farallon Capital
Rank Company Name Ticker Put/Call % of Portfolio Activity
Value x $1000 # of Shares
46 LAS VEGAS SANDS LVS
0.6% New $77,057 1,338,500 47 Agrium Inc. AGU
0.6% New $76,168 881,885
48 MEDNAX, Inc. MD
0.6% Cut -22% $74,478 1,001,463 49 Banco Santander (Brasil) BSBR
0.6% New $72,995 7,960,200
50 Linear Technology Corp. LLTC
0.6% Cut -8% $68,084 2,020,300 51 Health Management Assoc HMA
0.5% Cut -10% $66,354 9,874,124
52 CBS CORP CL B CBS
0.5% New $61,546 1,815,000 53 St. Jude Medical Inc. STJ
0.5% Added 59% $57,297 1,293,100
54 Cobalt International CIE
0.5% New $56,135 1,869,300 55 AmerisourceBergen ABC
0.5% Added 729% $55,889 1,408,500
56 Visa, Inc. V
0.5% New $54,586 462,600 57 AMERIGROUP Corp AGP
0.4% New $52,222 776,200
58 EQT Corporation EQT
0.4% New $46,585 966,300 59 Monsanto Co. MON
0.4% Cut -50% $44,234 554,600
60 First Horizon National FHN
0.4% New $44,166 4,255,000 61 Huntsman Corporation HUN
0.3% New $42,155 3,008,961
62 Cognizant Tech Solutions CTSH
0.3% New $35,690 463,817 63 Penn West Energy Trust PWE
0.3% Cut -78% $35,084 1,792,785
64 Hartford Financial Services HIG
0.2% New $29,769 1,412,219 65 WellCare Health Plans WCG
0.2% New $23,569 327,900
66 Aetna Inc. AET
0.2% New $23,676 472,020 67 Oncothyreon Inc ONTY
0.1% Added 5% $14,223 3,262,215
68 BioMarin Pharmaceutical BMRN
0.1% New $14,793 431,923 69 PNC Financial Services PNC
0.1% New $10,506 162,922
70 Coach Inc. COH
0.0% New $231 3,000 71 CIGNA Corporation CI
Sold
-
72 Capital One Financial Corp. COF
Sold
- 73 Gilead Sciences Inc. GILD
Sold
-
74 INHIBITEX INC INHX
Sold
- 75 Pioneer Natural Resources PXD
Sold
-
76 FedEx Corporation FDX
Sold
- 77 MetLife, Inc. MET
Sold
-
78 Assured Guaranty Ltd. AGO
Sold
- 79 eBay Inc. EBAY
Sold
-
80 Check Point Software CHKP
Sold
- 81 Alexion Pharmaceuticals ALXN
Sold
-
82 Express Scripts Inc. ESRX
Sold
- 83 Axis Capital Holdings AXS
Sold
-
84 Chevron Corp. CVX
Sold
- 85 DR Horton Inc. DHI
Sold
-
86 GRIFOLS, S.A. GRFS
Sold
- 87 Occidental Petroleum OXY
Sold
-
88 Tata Motors Ltd. TTM
Sold
-

60
Thomas Steyer’s Farallon Capital was recently named one of the top 10 hedge funds by net gains since inception. They came in at number nine on the list with a $12.2 billion net gain since inception in 1992. They’re the arbitrage focused hedge fund the newsletter tracks to keep an eye on what deals they see as most likely to close that offer a compelling spread. Their top holding at the end of the quarter was El Paso (EP) as the company will be taken over by Kinder Morgan (KMI). Farallon added to its EP position by 54% during the
Key Takeaways
2%3'4"$565"#$-'*++%&!'**,-)!
,043&%4>&F3#E!',<-L)!
<G2!'<G2)!
.aH4>4/!'.T;7)!
N?0>?3#!'N6<)!
,0#$0&11!.>&0$C!',"L)!
N&X@I!'NG@I)!
<#+?!R#%94>$1!'<,*)!
<?0&KH14#>!'<KL)!
D<*!*>5&3A!'N((K)!
8&%H1!'8J)!
!
."/,'!"89/%6%/)':&6':;-'
.//#>!@#X4%!'7(@)!,H51!
<A&:0#>!'<D7)!,H51!
,A?0E?11&5!^!X#H$A5!#H5!
2;!<#0+!'2(L.)!
-4>U5#>&!'-8(L)!
*9:?>3&9!*>?%#$43!'**8;)!
"&#.C&!'".(P)!
R<*!R#%94>$1!'R<*)!
N&%%1!K?0$#!'NK<)!
2A?>9?!;>5&0?354:&!'2LI*)!
J>45&9!6&>5?%1!'J6;)!
LP2.!.H0#>&/5!'LP7)!
!
quarter and it now represents over 13.7% of their reported holdings. The deal offers EP shareholders numerous options for payment including Kinder Morgan stock, warrants, and cash in various arrangements.
Steyer’s firm boosted its holdings in Medco Health Solutions during the quarter as they were betting on the takeover by Express Scripts (ESRX) coming to fruition. They substantially increased their sharecount by over 380%. Their wager paid off as the deal recently closed and Medco is now part of Express Scripts (ESRX). It will be interesting to see if Farallon will continue to own shares in the combined entity or if they were simply playing the deal spread and will move on to their next play. Perry Partners, profiled earlier in this issue, was also playing the deal but has determined that the new entity is also a compelling investment opportunity.
Four of Farallon’s top five holdings are risk arbitrage plays (they’re also waiting for Motorola Mobility (MMI) to be acquired by Google (GOOG) and for Goodrich (GR) to be acquired by United Technologies (UTX)). Their fifth largest holding is intriguing in the form of Owens-Illinois (OI) shares. Some analysts believe the company is an ideal takeover target. The company manufactures and sells glass containers for beverages. It is a simple business that offers scale and has very little competition. However, there has been somewhat of a secular decline in the use of glass as beverage makers increasingly elect to package their products in plastic and aluminum containers.
Thomas Steyer Farallon Capital
View Farallon Capital’s Updated Portfolio on the Next Page
Typically focuses on risk arbitrage strategies
Founded Farallon in 1986 & invests
in equities, private investments, debt, etc.
Q1 2012 www.hedgefundwisdom.com

61
First Quarter 2012 Portfolio: Farallon Capital
Q1 2012 www.hedgefundwisdom.com
Continued on Next Page…
Rank Company Name Ticker Put/Call % of Portfolio Activity
Value x $1000 # of Shares
1 El Paso Corp. EP
13.72% Added 54% $664,592 22,490,420 2 MedcoHealth Solutions MHS
10.14% Add 382% $491,046 6,985,000
3 Motorola Mobility MMI
8.97% Cut -6% $434,191 11,065,000 4 Goodrich Corp. GR
7.25% Cut -18% $351,232 2,800,000
5 Owens-Illinois, Inc. OI
3.38% Cut -31% $163,660 7,012,000 6 Hudson Pacific Properties HPP
3.20% Unchanged $154,838 10,233,860
7 Oracle Corp. ORCL
3.09% Cut -8% $149,503 5,127,000 8 Visa, Inc. V
3.04% Added 27% $147,245 1,247,837
9 State Street Corp. STT
2.53% Cut -18% $122,395 2,690,000 10 Google Inc. GOOG
2.47% Cut -3% $119,527 186,400
11 TransDigm Group TDG
2.40% Added 32% $116,397 1,005,500 12 Apple Inc. AAPL
2.38% New $115,458 192,600
13 American Tower Corp. AMT
2.13% Added 16% $103,038 1,635,000 14 Union Pacific Corporation UNP
2.09% Cut -13% $101,031 940,000
15 Target Corp. TGT
2.01% Cut -21% $97,151 1,667,256 16 Priceline.com Incorporated PCLN
1.66% New $80,360 112,000
17 QUALCOMM Incorporated QCOM
1.60% Added 4% $77,543 1,140,000 18 General Dynamics Corp. GD
1.58% Cut -22% $76,682 1,045,000
19 CBS CORP CL B CBS
1.58% New $76,298 2,250,000 20 News Corp. NWSA
1.54% Cut -51% $74,724 3,795,000
21 Check Point Software CHKP
1.50% Cut -8% $72,778 1,140,000 22 WellPoint Inc. WLP
1.48% Cut -3% $71,586 970,000
23 Progressive Waste Solutions BIN
1.46% Unchanged $70,527 3,253,100 24 Equinix, Inc. EQIX
1.46% New $70,695 449,000
25 Knology, Inc. KNOL
1.35% Unchanged $65,291 3,587,394 26 Comcast Corporation CMCSA
1.25% Cut -53% $60,620 2,020,000
27 Pall Corp. PLL
1.12% Cut -4% $54,224 909,336 28 Warnaco Group Inc. WRC
1.12% New $54,312 930,000
29 Fidelity National Info FIS
1.08% Cut -44% $52,495 1,585,000 30 Microsoft Corporation MSFT
1.06% Cut -59% $51,116 1,585,000
31 Town Sports International CLUB
1.06% Unchanged $51,279 4,060,082 32 Progress Energy Inc. PGN
0.83% New $40,098 755,000
33 BP plc BP
0.79% Cut -53% $38,025 845,000 34 FEI Co. FEIC
0.70% Unchanged $34,005 692,428
35 Life Technologies Corp LIFE
0.54% Unchanged $26,381 540,364 36 Yahoo! Inc. YHOO
0.50% Added 69% $23,987 1,576,000
37 eBay Inc. EBAY
0.49% Added 29% $23,637 640,745 38 WebMD Health Corp. WBMD
0.48% New $23,150 905,000
39 Copa Holdings SA CPA
0.43% New $20,592 260,000 40 CareFusion Corp CFN
0.42% New $20,433 788,000
41 VCA Antech Inc. WOOF
0.38% New $18,568 800,000 42 Tenet Healthcare THC
0.29% Cut -35% $14,087 2,652,900
43 Baxter International BAX
0.27% Cut -76% $12,912 216,000 44 CVS Caremark CVS
0.27% Cut -24% $13,097 292,336
45 EnCana Corp. ECA
0.27% Unchanged $13,119 667,636

62
First Quarter 2012 Portfolio: … Continued
Farallon Capital
Q1 2012 www.hedgefundwisdom.com
Next: Icahn Capital
Rank Company Name Ticker Put/Call % of Portfolio Activity
Value x $1000 # of Shares
46 Fuel Systems Solutions FSYS
0.26% Added 8% $12,738 486,945 47 TELUS Corporation TU
0.23% New $11,365 200,000
48 Illumina Inc. ILMN
0.21% New $10,259 195,000 49 Westport Innovations WPRT
0.20% Unchanged $9,583 234,200
50 Potash Corp POT
0.17% Unchanged $8,473 185,455 51 Fresh Del Monte Produce FDP
0.16% Added 19% $7,964 348,682
52 Schlumberger Limited SLB
0.16% New $7,636 109,200 53 NOVADAQ TECH NVDQ
0.15% New $7,350 1,103,800
54 Chiquita Brands CQB
0.14% Unchanged $6,652 756,727 55 Tata Motors Ltd. TTM
0.13% Cut -39% $6,244 231,514
56 SanofiContingentValueRight GCVRZ
0.13% Unchanged $6,143 4,550,000 57 LOOPNET INC COM STK LOOP
0.11% New $5,540 295,000
58 Ultra Petroleum Corp. UPL
0.11% New $5,354 236,600 59 LPL INVESTMENT LPLA
0.10% Unchanged $5,054 133,206
60 FLIR Systems, Inc. FLIR
0.08% Unchanged $4,105 162,182 61 Dole Food Company Inc. DOLE
0.07% Unchanged $3,629 363,636
62 Horsehead Holding Corp. ZINC
0.05% Unchanged $2,427 213,100 63 Beacon Roofing Supply BECN
0.05% Cut -79% $2,339 90,790
64 TUDOU HOLDINGS TUDO
0.04% New $1,852 62,700 65 DELPHI DLPH
0.03% Unchanged $1,497 47,368
66 DigitalGlobe, Inc. DGI
0.02% New $1,067 80,000 67 SAVIENT PHARMA SVNT
0.01% Unchanged $654 300,000
68 Cninsure Inc. CISG
0.01% Unchanged $500 80,000 69 ADECOAGRO S.A. AGRO
0.01% New $323 29,887
70 Exxon Mobil Corp. XOM PUT
Sold
- 71 Chevron Corp. CVX PUT
Sold
-
72 PHARMASSET, INC. COM VRUS
Sold
- 73 SI CORPORATION SONE
Sold
-
74 Linktone Ltd. LTON
Sold
- 75 ADVANCED ANALOGIC AATI
Sold
-
76 GeoEye, Inc. GEOY
Sold
- 77 BLUE COAT SYS BCSI
Sold
-
78 HCA HLDGS INC COM HCA
Sold
- 79 Wells Fargo & Company WFC
Sold
-
80 PHARMASSET, INC. COM VRUS PUT
Sold
- 81 SHANDA INTERACTIVE SNDA
Sold
-
82 United Rentals, Inc. URI
Sold
- 83 NYSE Euronext, Inc. NYX
Sold
-

63
When Carl Icahn finally succeeded in splitting the old Motorola entity up into Motorola Mobility (MMI) and Motorola Solutions (MSI), the newsletter pondered whether he would continue to hold both companies. Well, he did hold both for a brief while at least. Icahn’s latest portfolio disclosure shows he has disposed of his position in Motorola Solutions (MSI). And with Motorola Mobility set to be acquired by Google (GOOG), Icahn will soon have no trace of Motorola left in his portfolio at all.
Last quarter’s issue highlighted Icahn’s rapid acquisition of CVR Energy (CVI) shares. In the first quarter, he boosted his position by 229% and has made a bid for the entire company. His tender offer comes in at $30 per share and CVI currently trades at a slight premium to that offer. The reason shares are trading above his offer is because he’s sweetened his bid by adding a contingent cash payment agreement which essentially provides shareholders the right to any amount above the $30 he’s offering if he’s able to flip the company to another buyer for an even higher price within the next nine months. And as detailed earlier in this newsletter, John Paulson has taken up Icahn on the offer as he has tendered his CVI shares into the $30 offer and is content to take the contingent value right. Paulson has done so mainly because of the extremely skewed risk/reward the opportunity provides. The
Key Takeaways
2%3'4"$565"#$-'>M?!
!
."/,'!"89/%6%/)':&6':;-'@#5#0#%?!2#%H54#>1!'@2;)!
.%!,?1#!'.,)!
!
Paulson & Co founder says that you essentially pay around 35-40 cents for the contingent value right and if Icahn’s able to sell the company for even higher, you’ll make a high multiple on that initial capital outlay. It’s essentially treated as an option because there’s defined risk and a timetable of nine months (expiration). Paulson clearly likes those odds.
The only other portfolio activity from Icahn during the quarter was that he added to his position in WebMD Health (WBMD) by 18%. As to what Icahn might see in the company: WebMD is the most visited health related website in the US. The stock has suffered as its primary ad buyers (pharma companies and the like) have cut their ad spending. If WebMD is able to turn around these revenue declines and cut costs, then the stock would obviously be trading higher. The company tried to sell itself in the past unsuccessfully so it raises the question as to whether there are any natural buyers out there.
For the most part in the first quarter, Icahn’s overall portfolio was largely unchanged. He was named one of the top 25 highest earning hedge fund managers of 2011, sliding in at the number two position on the list with $2.5 billion.
View Icahn Capital’s Updated Portfolio on the Next Page
Q1 2012 www.hedgefundwisdom.com
Icahn Capital Carl Icahn
Known as a ‘rabblerouser’ and a corporate raider
Typically takes controlling stakes &
uses activism to generate shareholder value

64
First Quarter 2012 Portfolio: Icahn Capital
Q1 2012 www.hedgefundwisdom.com
Next: JANA Partners
Rank Company Name Ticker Put/Call % of Portfolio Activity
Value x $1000 # of Shares
1 Icahn Enterprises IEP
41.0% Added 17% $4,008,551 92,812,051 2 Federal-Mogul Corp. FDML
13.5% Unchanged $1,314,590 76,385,255
3 Motorola Mobility MMI
10.4% Cut -14% $1,020,240 26,000,000 4 Forest Labs FRX
9.4% Unchanged $914,487 26,361,686
5 Amylin Pharma AMLN
3.7% Unchanged $358,973 14,381,925 6 CVR Energy, Inc. CVI
3.4% Add 229% $336,628 12,584,227
7 Hain Celestial Group HAIN
3.2% Unchanged $312,390 7,130,563 8 Navistar International NAV
3.0% Unchanged $293,320 7,251,426
9 American Railcar ARII
2.9% Unchanged $278,568 11,848,898 10 Mentor Graphics Corp. MENT
2.5% Unchanged $239,547 16,120,289
11 Oshkosh Corporation OSK
2.1% Unchanged $200,774 8,665,260 12 WebMD Health Corp. WBMD
1.8% Added 18% $171,400 6,700,525
13 Commercial Metals CMC
1.6% Cut -9% $154,958 10,455,991 14 Take-Two Interactive TTWO
1.2% Unchanged $112,397 7,305,626
15 Enzon Pharma ENZN
0.4% Unchanged $40,389 5,904,863 16 Dynegy Inc. DYN
0.1% Unchanged $10,104 18,042,212
17 Motricity, Inc. MOTR
0.1% Unchanged $7,460 6,782,039 18 Motorola Solutions MSI
Sold
-
19 El Paso Corp. EP
Sold
-

65
Jana Partners made a splash in the market when they revealed a large stake in beleaguered bookseller Barnes & Noble (BKS). Their portfolio on the next page shows they owned 5.5 million shares of the last remaining bookstore giant at the end of the first quarter. Note that since then, they continued buying into the second quarter and own around 6 million shares. While Barry Rosenstein’s firm are typically activist investors, they intriguingly did not pursue activist measures on BKS, instead electing to play a passive role while the likes of
JANA Partners
Key Takeaways
2%3'4"$565"#$-'I40&38D!'I8D)!
<#:&>50C!R&?%5A<?0&!'<DR)!
R&11!'R.2)!
D415&#>!'D<)!
G?0>&1!Y!L#X%&!'GB2)!
<#3?!<#%?!.>5&0+041&1!'<<.)!
*:41!GH9$&5!'<*6)!
250?C&0!.9H3?54#>!'286*)!
I?0%4>$!'I*6)!
<?0>4:?%!'<<-)!
L#0V#%U!2#H5A&0>!'L2<)!
K#0&15!(4%!'K28)!
!
."/,'!"89/%6%/)':&6':;-'<C5&3!'<P8)!
6#3U!8&>>!'6B8)!
-4V&!8&3A>#%#$4&1!'-;K.)!
2H>#3#!'2JL)!
804+*9:41#0!'86;,)!
@?004#55!D?3?54#>1!'D*<)!
R<*!R#%94>$1!'R<*)!
"##$%&!'"((")!
G@<!2#V5=?0&!'G@<)!
I&%+A4!'I-,R)!
View JANA Partners’ Updated Portfolio on the Next Page
larger shareholders Len Riggio and John Malone’s Liberty lead the charge. Even bigger news pertaining to Barnes & Noble hit literally days after JANA publicly revealed its stake when Microsoft announced it had invested in BKS’ e-reading platform, Nook. JANA thinks a sum of the parts valuation on BKS yields $11 per share for the retail and college bookstore segment and $26 per share for the Nook segment, yielding a total of $37 per share, or around 230% upside from where they established their stake. While shares of BKS initially traded north of $25 per share on the news of Microsoft’s investment, they’ve settled back down around the $17 range. It seems though that JANA’s entire investment thesis hinges on the Nook. They note that the biggest risk to their investment in BKS is the future of the e-reader segment and the execution of monetizing it. You can read JANA’s entire thesis on BKS here.
At the Skybridge Alternatives Conference in Las Vegas a few weeks ago, Rosenstein commented that he’s been involved in activist investing since the 1980’s and he thinks today’s environment is the best he’s seen for it. The hedge fund manager also talked about his firm’s lack of exposure to financials, pointing out that he thinks the sector is too hard to analyze.
Rosenstein will be presenting his newest investment ideas at the Value Investing Congress in New York City in October along with David Einhorn and numerous other hedge fund managers. Newsletter readers can receive a huge discount to the event by clicking here and entering discount code: N12MF3
Barry Rosenstein
Q1 2012 www.hedgefundwisdom.com
Has returned 14.3% annualized since inception in 2001
“Value-oriented fund with an event-
driven strategy which invests in companies considering or
implementing change.”

66
First Quarter 2012 Portfolio: JANA Partners
Q1 2012 www.hedgefundwisdom.com
Next: Pennant Capital
Rank Company Name Ticker Put/Call % of Portfolio Activity
Value x $1000 # of Shares
1 Marathon Petroleum MPC
11.5% Cut -61% $279,851 6,454,131 2 El Paso Corp. EP
6.6% Added 7% $160,739 5,439,559
3 DIRECTV DTV
6.5% New $157,959 3,201,441 4 Expedia Inc. EXPE
5.4% Added 29% $131,782 3,940,857
5 Energizer Holdings Inc. ENR
5.4% Added 78% $131,691 1,775,288 6 Liberty Media Corp LMCA
5.3% Added 12% $128,722 1,460,256
7 McGraw-Hill Co MHP
5.3% Cut -70% $128,205 2,645,031 8 Apple Inc. AAPL
4.9% Cut -23% $119,479 199,281
9 Coventry Health Care Inc. CVH
4.7% New $115,017 3,233,532 10 Motorola Solutions, Inc. MSI
4.7% Added 123% $113,749 2,237,823
11 Anadarko Petroleum APC
4.1% Added 3% $99,880 1,274,954 12 Hess Corporation HES
4.1% New $99,612 1,689,767
13 Visteon Corp VC
3.2% New $77,133 1,455,335 14 Barnes & Noble, Inc. BKS
3.0% New $73,844 5,573,111
15 Coca-Cola Enterprises Inc. CCE
3.0% New $73,361 2,565,073 16 Liberty Media Interactive LINTA
2.6% Cut -15% $63,142 3,307,615
17 Avis Budget Group, Inc. CAR
2.3% New $55,511 3,923,050 18 Comverse Technology Inc. CMVT
2.1% Added 22% $51,462 7,490,821
19 Strayer Education Inc. STRA
2.0% New $48,450 513,900 20 Netflix, Inc. NFLX
1.9% Cut -39% $45,830 398,383
21 SEMGROUP CORP A SEMX
1.7% Cut -27% $41,625 1,428,453 22 Darling International Inc. DAR
1.6% New $38,624 2,217,233
23 Carnival Corporation CCL
1.6% New $38,042 1,185,851 24 Norfolk Southern Corp. NSC
1.5% New $36,426 553,332
25 SPDR Gold Shares GLD
1.2% Added 43% $27,903 172,115 26 Forest Oil Corp. FST
1.0% New $24,842 2,049,704
27 Anadarko Petroleum Corp APC CALL 0.9% New $22,562 288,000 28 Convergys Corporation CVG
0.7% Added 6% $16,636 1,246,168
29 SUNCOKE ENERGY SXC
0.6% New $15,283 1,075,491 30 Opko Health, Inc. OPK
0.5% Added 34% $12,682 2,681,193
31 Marathon Petroleum MPC CALL
Sold
- 32 Life Technologies Corp LIFE
Sold
-
33 Rock-Tenn Co. RKT
Sold
- 34 Cytec Industries Inc. CYT
Sold
-
35 Savient Pharmaceuticals SVNT
Sold
- 36 Sunoco Inc. SUN
Sold
-
37 WPX ENERGY INC WPX
Sold
- 38 TRIPADVISOR TRIP
Sold
-
39 MARRIOTT VACATIONS VAC
Sold
- 40 HCA HLDGS INC COM HCA
Sold
-
41 Google Inc. GOOG
Sold
- 42 BMC Software Inc. BMC
Sold
-
43 EXELIS INC XLS
Sold
- 44 DELPHI DLPH
Sold
-

67
Pennant Capital was largely out trimming position sizes during the first quarter of the year as they sold shares of seven of their top ten positions. That being said, none of the position sizes were reduced by meaningful size. Of their top holdings, Apple (AAPL) was the position that saw the most selling and even then they only sliced off 23% of their position. For the most part, it looks as though Pennant was just managing exposure levels.
The hedge fund did do some buying during the quarter, mainly via starting new positions in Priceline.com (PCLN), WABCO (WBC), and Canadian Natural Resources (CNQ), the latter being a much smaller position relative to the other two. If you missed the write-up on Priceline from last quarter’s issue of Hedge Fund Wisdom, be sure to login and check it out as numerous top hedge funds now own stakes.
Pennant’s addition of WABCO is intriguing so it’s worth examining the potential thesis there further. The company is headquartered in Europe and as such shares have slipped as the crisis on that continent continues. WABCO stands for the Westinghouse Air Brake Company and, as its
Key Takeaways
2%3'4"$565"#$-',043&%4>&F3#E!',<-L)!
N*G<(!'NG<)!
<?>?94?>!L?5H0?%!6&1#H03&1!'<LT)!
!
."/,'!"89/%6%/)':&6':;-'2+04>5!L&/5&%!'2)!
*X&030#EX4&!Y!K453A!'*LK)!
2CE&50?!K4>?>34?%!'2P*)!
G?X3#3U!Y!N4%3#/!'GN<)!
N4%%41!"0#H+!'N2R)!
name implies, focuses on the production of braking supplies for vehicles. The company has high market share with a dominant competitive position and strong returns on capital (ROIC average more than 20%). The problem is that truck production and demand for brakes is highly cyclical. However, the company also sells replacement parts for its brakes to help pad the gap when new orders are slow to roll in. The reason this position is worth highlighting is because due to its cyclical nature, Pennant would be more likely to hold this investment for some time. As is often the case with cyclical plays, it can take some time for improvements in the business to translate into material share price gains.
During the first quarter when Pennant was buying, shares of WBC traded as low as $45 and as high as $63. Currently, WBC has sold off with the market and shares sit around $51. Various value firms were out buying WBC in size back in the third quarter of 2011 as the markets (and WBC shares in particular) were decimated. Given that shares have now fallen back down to the average level of trading price from the first quarter when Pennant was buying, it seems logical to draw attention to this name.
Pennant’s top ten holdings remain largely unchanged from the quarter prior. Their lower level of turnover makes them an ideal fund to track.
View Pennant Capital’s Updated Portfolio on the Next Page
Q1 2012 www.hedgefundwisdom.com
Pennant Capital Alan Fournier
Pursues a long/short equity strategy
Before founding Pennant in 2001, he was responsible for the global equity
portfolio for David Tepper’s Appaloosa Management

68
First Quarter 2012 Portfolio: Pennant Capital
Q1 2012 www.hedgefundwisdom.com
Rank Company Name Ticker Put/Call % of Portfolio Activity
Value x $1000 # of Shares
1 DaVita, Inc. DVA
6.3% Cut -6% $279,543 3,100,181 2 TransDigm Group TDG
6.2% Cut -15% $274,754 2,373,482
3 Fidelity National Info FIS
6.0% Cut -9% $266,256 8,039,144 4 QUALCOMM Incorporated QCOM
5.7% Cut -15% $253,441 3,723,781
5 WellPoint Inc. WLP
4.8% Added 2% $210,101 2,846,892 6 Dollar General Corporation DG
4.6% Cut -4% $204,505 4,426,516
7 Apple Inc. AAPL
4.4% Cut -23% $194,227 323,955 8 NVR Inc. NVR
4.2% Added 19% $187,475 258,113
9 TRIPADVISOR INC COM TRIP
4.1% Cut -15% $182,661 5,120,850 10 Family Dollar Stores Inc. FDO
4.1% Added 17% $181,442 2,867,281
11 HUNTINGTON INGALLS HII
4.0% Added 23% $174,943 4,347,499 12 Terex Corp. TEX
3.9% Cut -2% $171,526 7,623,370
13 Sensata Technologies ST
3.7% Cut -4% $162,857 4,864,316 14 Coca-Cola Enterprises Inc. CCE
3.4% Cut -1% $149,409 5,224,106
15 WESCO International Inc. WCC
3.1% Cut 0% $137,884 2,111,224 16 Union Pacific Corporation UNP
3.1% Cut 0% $137,495 1,279,263
17 Priceline.com Incorporated PCLN
2.9% New $129,868 181,000 18 Unitedhealth Group, Inc. UNH
2.9% Cut -1% $127,035 2,155,331
19 Citigroup, Inc. C
2.7% Added 13% $120,291 3,291,122 20 WABCO Holdings Inc. WBC
2.5% New $110,163 1,821,471
21 Range Resources Corp RRC
2.3% Cut -1% $101,589 1,747,316 22 Google Inc. GOOG
2.0% Cut -1% $88,805 138,489
23 PHH CORP PHH
1.9% Unchanged $85,249 5,510,629 24 Pfizer Inc. PFE
1.9% Unchanged $82,803 3,656,574
25 Hologic Inc. HOLX
1.6% Cut -15% $70,404 3,267,027 26 Old Republic Intl ORI
1.2% Cut -1% $52,495 4,975,868
27 AEROFLEX HOLDING ARX
0.9% Added 6% $39,377 3,534,708 28 Middleby Corp. MIDD
0.8% Cut -10% $34,685 342,809
29 Universal Stainless & Alloy USAP
0.7% Unchanged $29,296 685,770 30 Petroleo Brasileiro PBR-A
0.6% Cut -7% $27,349 1,070,000
31 Valero Energy Corp. VLO
0.6% Cut -13% $26,028 1,010,000 32 Quest Diagnostics Inc. DGX
0.6% Cut -4% $25,072 410,000
33 Fluor Corporation FLR
0.6% Cut -7% $24,616 410,000 34 PHH CORP NOTE PHH
0.5% Unchanged $23,931 23,900,000
35 Foster Wheeler AG FWLT
0.4% Added 40% $15,818 695,000 36 Broadcom Corp. BRCM
0.4% Cut -20% $15,720 400,000
37 Canadian Natural CNQ
0.2% New $10,784 325,000 38 Amgen Inc. AMGN
0.2% Added 13% $9,176 135,000
39 Human Genome Sciences HGSI
0.1% Add 374% $3,626 440,000 40 Sprint Nextel Corp. S
Sold
-
41 Abercrombie & Fitch Co. ANF
Sold
- 42 Symetra Financial Corp SYA
Sold
-
43 The Babcock & Wilcox Co BWC
Sold
- 44 Willis Group Holdings WSH
Sold
-
Next: Equity Analysis Section

69 Q1 2012 www.hedgefundwisdom.com
Equity Analysis: Investment Thesis Summaries
Overview
These analytical summaries examine why a hedge fund was buying a specific stock and what their potential investment thesis could be. Written by hedge fund analysts, this section highlights stocks that saw large hedge fund buying in the quarter. When presenting an investment idea to a fund manager, an analyst outlines numerous aspects of a thesis. This section aims to briefly summarize the following bullet points:
- Company background - The business model & current situation - The investment thesis - The bull case versus the bear case - Market valuation - Potential catalysts (if any) - Hedge fund activity in the stock
This quarter’s issue features a write-up on a company seeing robust secular growth trends and REIT-ification optionality versus threat of low-price competition from wholesalers and fear of overcapacity: - Equinix (EQIX)
Also included is an investment thesis summary of a company with a superior product but competition might be catching up: - Tempur-Pedic (TPX) Lastly, this issue features analysis of a company combating industry slowdown with company-specific growth levers (but it’s trading at the top of its historical valuation range): - Autozone (AZO)
Next: Analysis of Equinix (EQIX)

70 Q1 2012 www.hedgefundwisdom.com
Equinix (EQIX) Investment Thesis Summary Secular Growth Trends
Hedge Fund Activity
Philippe Laffont’s Coatue Management and John Thaler’s JAT Capital both started significant new positions in Equinix (EQIX). Two Sigma, Scout Capital, Hoplite Capital, and Farallon Capital also started new positions. Lone Pine Capital and Och-Ziff increased their exposure. The stock traded in the range of $101 - $157 during the quarter, and it’s currently at $148.
Company Background
EQIX was founded in 1998 by ex-DEC managers who believed that the proliferation of internet networks and rapid growth in the infrastructure would need hubs to bring the networks together in order to efficiently exchange data. The company has become a leader in IT infrastructure collocation and network interconnections. EQIX has the most data centers globally in strategic high-density locations in order to provide close proximity to the largest number of end-users as well as companies that are outsourcing their IT.
Data centers offer access to locations with technology, power, and security required to host other companies’ servers. Collocation qualifies as property-generated revenue, which is relevant to the REIT structure. In addition to collocation, EQIX offers interconnections and managed infrastructure as value-added services. Interconnection refers to connecting one network to another so that they can exchange data.
If an internet user is using a network like AT&T, but he needs to access data from a company that is relying on Sprint’s network, then data needs to get exchanged, or ‘hop’ from one network to the other. In a data transmission, data may require a number of hops if the intermediaries or facilitators don’t have both networks physically located in the same area. The more hops involved in a transmission, the greater the delay. As data consumption increases exponentially and clients need ever faster access to data, e.g., high-frequency traders or video viewing, the growing need for localized ecosystems with as many networks and companies at the same place as possible is filled by companies like EQIX.
EQIX operates state-of-the art facilities with all the power, cooling, and security required. The company has targeted specific verticals with low latency needs, and worked on bringing many customers in the same locations, so that they could all benefit from faster data transfers. A great example is the financial industry, where brokers, data providers, and traders can all be hosted in machines that are very close to each other and can thus exchange data without the delay of rerouting them through different networks and data exchange providers.
A Look at the Industry

71
execution is very different because they need to focus on clustering and network effects, such as EQIX’s strategy of deep coverage by vertical. Separately, since collocation revenue qualifies as rental-property revenue, wholesalers have converted into REITs because of the tax efficiency of the structure: as long as 90% of annual taxable income is distributed to shareholders, the corporation doesn’t pay taxes. Therefore, another barrier to competing with someone like EQIX is that value-added services do not qualify as sales generated from property ownership, which can put a REIT structure at risk (REITs have to generate at least 75% of their sales directly from property ownership).
The wholesalers are DuPont Fabros
(DFT), Digital Realty (DLR), and CoreSite Realty (COR). The retailers used to be EQIX, Rackspace (RAX), Savvis (SVVS), Terremark (TMRK), and Telecity (TCY LN), but some of these companies have been recently absorbed by larger telecommunications corporations that wanted access to this high-growth industry. The remaining independents are EQIX, RAX, and TCY.
Q1 2012 www.hedgefundwisdom.com
Secular Growth Trends
Industry Background (Continued)
Equinix (EQIX)
The US hosting services industry is an $11bn market and consists of collocation and managed services. Collocation is provided by wholesale and retail data center operators. Wholesale data centers tend to provide an empty box, whereas retail providers bundle managed infrastructure and other value-added services.
Larger companies tend to opt for
wholesale services, where they commit to 10-year contracts and larger spaces but at a much lower cost of ~$30 per month per sq.ft. Smaller companies choose 2-5 year contracts and managed services, but may end up paying more than double. Occasionally, when companies become sustainable, they transition from retail to wholesale collocation. The cost differential and similarity of the offering seemingly makes wholesale collocators and a company like EQIX direct competitors, and EQIX wouldn’t compare favorably.
However, the big difference is that
wholesalers cater primarily to standalone networks, i.e., customers who don’t benefit particularly from interconnections. EQIX’s model instead is to provide both collocation and network interconnections, which creates powerful network effects and adds value to customers. Therefore, the threat from wholesale collocators to compete on pricing or capture market share is not as big as it would seem. EQIX has built highly interconnected ecosystems: for example, a high-frequency trader derives substantial benefits from being in close proximity to various networks and in the same location as brokers and exchanges.
Even though wholesale providers could
theoretically expand their service offerings,
A Look at the Industry

72
21x EBITDA, in April 2011. TMRK’s higher multiple can be justified by its high mix of value-added services and focus on cloud services, which accelerated VZ’s expansion in that high-growth space.
Q1 2012 www.hedgefundwisdom.com
Secular Growth Trends
Valuation
Equinix (EQIX)
Of the wholesalers, DLR is the largest player with a $7.5bn market cap and an $11.4bn EV, and it trades at 18x EV/EBITDA. DFT has a $1.6bn market cap and a $3.0bn EV, and it trades at 16x EV/EBITDA. COR has a $0.5bn market cap and a $1.0bn EV, and it trades at 15x EV/EBITDA. It was owned by Carlyle and IPO’d as a REIT in November 2011. All these wholesalers are REITs, so a more appropriate valuation metric is “adjusted funds from operation”, which is effectively equity cashflows. However, for comparability purposes, we’ll stick to using EV/EBITDA, which is a good proxy for relative valuations.
Of the retailers, EQIX is the largest with a
$7.0bn market cap and a $9.2bn EV, and it trades at 13x EV/EBITDA. RAX is much more focused on managed IT services (customer service is a big company differentiator), it has a $6.6bn market cap and a $6.5bn EV, and it trades at 19x EV/EBITDA. The high multiple can be justified by the company’s focus on cloud services, faster growth, and lower capital intensity (services vs collocation). TCY is predominantly a European player, it has a $1.5bn market cap and a $1.7bn EV, and it trades at 16x EV/EBITDA. Its premium can be justified because of its smaller size, which makes incremental growth easier to achieve, and takeover premium (EQIX is deemed too large).
SVVS was acquired by CenturyLink (CTL) for $2.4bn, which valued SVVS at 13x EBITDA, in July 2011. TMRK was acquired by Verizon (VZ) for $1.7bn, which valued the company at
Industry Background (Continued)
“Of the retailers,
EQIX is the largest with a $7 billion market cap,
a $9.2 billion EV, and it
trades at 13x EV/EBITDA.”

73
Q1 2012 www.hedgefundwisdom.com
Secular Growth Trends
Valuation
Bull Case, Bear Case & Summary
On the trading side, TCY is the closest comparable to EQIX, and on the transaction side, SVVS is the most relevant. TCY trades at 16x EV/EBITDA and SVVS was acquired for 13x EBITDA. Historically, EQIX seems to trade around 10-15x EBITDA. Therefore, the current 13x multiple seems fair, though it likely already incorporates – at least in part – investors’ expectation that the company will eventually convert into a REIT. At this valuation, the company needs to deliver consistently strong results quarter after quarter. Any slip up in customer churn or pricing could cause investors to get concerned about the opportunity.
The upside from a REIT conversion can be assessed by comparing EQIX to the wholesalers, who trade at 15-18x EBITDA. Assuming a mid-range multiple of 16.5x would imply upside of 35%. At DLR’s multiple, EQIX would have a 50% upside. EQIX is projected to grow faster than the REIT wholesalers in the next few years as it can utilize its strong cashflow and has many opportunities to expand. This would justify a premium multiple, but the uncertainty in the timing of the conversion is an offset.
It is more difficult to assess the probability and timing of a potential conversion. In order to qualify for a REIT, EQIX needs to generate at least 75% of rental-type sales and dividend at least 90% of its taxable income to shareholders every year. On the former, EQIX’s sales mix is currently very close to the 75% minimum requirement, which doesn’t give it a lot of room for any change in the mix and limits its expansion opportunities into more service-based revenue. On the latter, it currently has high CAPEX plans for the next few years, so converting at this point might be premature because it would limit its capital flexibility.
There are tradeoffs to the REIT structure, and it may be that EQIX’s business model may not have matured enough yet to pursue a conversion. The timeframe from starting the process, preparing the company, and eventually converting into a REIT is estimated at 2 years based on the recent experience at American Tower (AMT). Since EQIX is currently just evaluating the option, it could be a 3-5 year event.
Equinix (EQIX)

74
Q1 2012 www.hedgefundwisdom.com
Secular Growth Trends
Next: Analysis of Tempur-Pedic (TPX)
Equinix (EQIX)
The Bull Case
EQIX is the leading pure-play retail data center provider. It has successfully created deep ecosystems across a number of verticals, which create network effects that translate into barriers to entry, growth opportunities, and pricing power. EQIX is a way to play the growth in digital data consumption, driven by a secular growth trend in cloud and media. In addition, EQIX has the option to convert into a REIT structure, which will provide tax efficiency and a large number of substantial incremental stockholders. Compared to its historical multiple, EQIX trades at a reasonable valuation, but compared to REITs in the same industry (wholesale data centers) it could have an upside of 30-50%.
Summary
EQIX is a leader in a market fueled by strong secular growth trends and it trades at a
reasonable multiple. Substantial upside can come from market outgrowth or from the conversion into a tax-efficient REIT structure. On the other hand, the REIT structure has been under evaluation for years, and it takes years to implement. EQIX’s business and strategy may not be compatible with the REIT structure. Also, it faces increasing competition from wholesale data center providers, who offer a much cheaper alternative.
The Bear Case
The company has been exploring a REIT conversion for years, so it may not happen in the near term. In the meantime it is at least fully valued. Even though 95% of its sales are considered recurring, they are subject to ~3 year contracts as opposed to 10 years for REITs, which have much more stable cashflows. There are competitive threats from the REIT wholesalers, who offer substantial cost-savings, and from large companies building their own infrastructure, e.g., Amazon and Google building their own data centers. Another key risk that investors are keenly aware of is the threat of a supply glut coming from over-expansion. New facilities need to be added at a very measured pace in order to avoid the post-internet bubble situation, when there was an overcapacity of network facilities that led to depressed prices and company liquidations.

75
Tempur-Pedic (TPX)
TPX is headquartered in Lexington, KY, has annual sales of $1.4bn, and a market capitalization of $2.9bn. It is the largest manufacturer, marketer, and distributor of specialty bedding (no springs or coils) with ~25% market share. It makes high-end mattresses that are more comfortable because they use temperature-sensitive high-density visco-elastic (memory foam) material that conforms to your body. Its beds and pillows relieve pressure and align the neck and spine, thus alleviating back pain. The beds are typically priced at more than $1K. The primary competitor is Select Comfort (SCSS), which makes its own specialty bed, the Sleep Number bed, which allows a couple of set the firmness on their side of the bed individually.
The National Aeronautics and Space Administration (NASA) developed a visco-elastic pressure-relieving material to cushion astronauts from the G-force experienced during lift-off, a material that became available to the public in the 1980s. A Swedish company developed a commercial material in the early 1990s and produced the first Tempur-Pedic mattress. The owners of the Swedish company gave the rights to a company that was formed in the US to introduce the mattress to the market. This company, along with other international distributors of the mattresses merged in the late 1990s. In late 2002, the private equity firms TA Associates and Friedman, Fleischer and Lowe bought the holding company for ~$400mm, and then took it public in December 2003. Mattress companies have been the target of private equity firms because the bedding market is quite stable and the industry has very low capital investment requirements. The high cashflow generation means that the companies can support high loads of debt, repay them quickly, and buy back shares. However, in the case of Tempur-Pedic, the investment was made to support expansion because of the large market opportunity with a superior and differentiated product.
TPX’s strategy is to be very focused on customer needs and innovate its bedding in order to always offer the most comfortable sleeping surfaces possible. More than 2/3 of its sales come from mattresses, 90% of which are sold through the retail channel (furniture stores) and the rest are sold direct, through chiropractors, or 3rd-party distributors. Retail sales carry a 50% gross margin, while direct sales have an 80% margin. 2/3 of the sales are domestic with a 50% gross and 20% operating margin; the international sales have 5-10% higher margins and are growing faster due to the lower penetration. The other 1/3 of sales comes from pillows, adjustable bed bases, and other products, which can have even higher margins.
TPX IPO'd in mid-Dec 2003 at $14 and hit a pre-crisis peak of $37 in late 2007. It troughed below $5 in March 2009, and in mid-April 2012 hit its all-time high of $86. During 1Q12, the stock traded in the range of $53 to $84. Since disappointing investors on its earnings call on April 19, it has dropped 45% to $46. After it IPO'd, TPX had $600mm in annual sales and was trading at ~10x EV/EBITDA. By late 2007, when the stock price hit a high, the sales run-rate had almost doubled. But by mid-2009 it had dropped close to its IPO levels. Since the financial crisis, it has doubled.
Company Background
John Thaler’s JAT Capital bought Tempur-Pedic (TPX) in Q1, allocating 10% of its reported assets, making it its largest disclosed position. Conatus Capital also bought a new stake.
Hedge Fund Activity
Q1 2012 www.hedgefundwisdom.com
Growth Story

76
Tempur-Pedic (TPX)
Growth Story
The US mattress market is a $6bn industry, and the international market is double the size. Traditional mattresses are made with coils or springs and account for 90% of the units but 75% of the sales because of their lower average sales price (ASP). Specialty mattresses don’t use coils or springs but rather rely on specialty materials. They account for the rest of the units and sales, with an ASP usually 3.5x that of a traditional mattress.
Historically, the industry has been dominated by 4 large players who control >50% of the market: Select Comfort, Sealy, Simmons, and Serta. The first two are public and the last two are private companies. They are referred to as “the 4Ss”.
Select Comfort (SCSS) has $750mm sales and a $1.4bn market cap. SCSS is TPX’s main competitor in specialty bedding and is considered a rapidly rising major player in the segment with its Sleep Number bed. The company was formed in 1987 from an employee who left Comfortair, a company that invented adjustable air-supported sleep systems. As it is smaller and has lower brand awareness, it is considered to have the highest growth potential.
Sealy (ZZ) used to be the leading mattress manufacturer, but it has recently been overtaken as its sales have been on a decline. It has been unable to compete in the high-growth specialty bedding segment. It is the maker of the PosturPedic brand and has $1.2bn sales, but its market cap is only $165mm, 1/10th of what it was in 2007. It was bought by KKR (the company’s 3rd private equity owner) from Bain Capital for $1.5bn in 2004, but since the IPO in 2006 the stock price has declined ~90%. The company was founded in the late 1800s.
Simmons is a private company, has a 135-year history in the industry, and is the maker of the BeautyRest and NaturalCare
Industry Background
Valuation
Q1 2012 www.hedgefundwisdom.com
brands. Serta has an 80-year history, is the private company that makes the PerfectSleeper bed, and is known for its counting-sheep commercials.
The vast majority of sales in the industry occur through the retail channel, which is highly fragmented (local furniture stores). Stores have a certain number of “slots” on the floor, which refer to the spaces where a bed set can be shown. Usually, more than half of the slots go to the dominant players (the 4Ss), where one of them usually takes a majority share; the rest go to specialty beds and smaller brands.
Given that many specialty beds cost upwards of $1K, they are a highly discretionary item. As incomes rise and customers learn the benefits of specialty bedding, this segment increases penetration. However, during tough economic conditions, sales can be more volatile because of the higher price point. For example, the mattress industry unit sales declined 8% in 2008, whereas specialty units dropped by more than twice that. Pricing had to adjust substantially the following year for the sector to stabilize, with specialty mattress ASPs down ~15% (traditional ASPs were down half that).
Customers usually purchase a new bed every 7-10 years. The fact that customers are out of the market for such a long period of time allows the industry to have some pricing power, since price increases are difficult to notice and interpret. Further confusing customers and making historical as well as cross-brand comparisons more difficult is the proliferation of SKUs (some companies offering more than 100 different beds). As a result, the industry has been successful at raising prices by a few percentage points annually.

77
Tempur-Pedic (TPX)
In 1Q, the stock traded in the range of $53 - $84, and it’s currently at $46. Analysts expect the mattress industry to grow at a rate of only a few percent over the next few years, but specialty bedding is forecasted to grow 2-3x as fast. TPX also has international growth opportunities, where its penetration is significantly lower than in the US. It is estimated that TPX will be able to grow top line at a 15% clip for at least a few years. EPS should grow at >20% based on operating leverage and free cashflow deployment in the form of share buybacks.
TPX has a market cap of $2.9bn and net debt of $0.4bn for an EV of $3.4bn. It trades at 8.3x 2011 EBITDA and 7.6x consensus 2012 EBITDA. Historically, it has traded in the 6-12x LTM EBITDA range, with an average of ~9x, which would imply a <10% upside. On a P/E basis, it trades at 14x 2011 EPS, 12x 2012 EPS, and 10x 2013 EPS. Historically, it has usually traded in the 10-30x range, averaging 20x. However, as the company is transitioning from a high-growth, low-hanging-fruit story to a more mature company where growth comes from tougher incremental penetration and it’s facing increasing competition from other established layers, the multiple will probably have to compress. A mid-to-lower range 15-17.5x multiple sounds reasonable, which would imply 7-25% upside.
The two publicly-traded peers are SCSS and ZZ, with SCSS being a more direct comparable to TPX. SCSS has a market cap of $1.4bn and an EV of $1.2bn. It trades at an EV/EBITDA of 11x LTM and almost 9x 2012, and a P/E of 21x LTM, 17x 2012 and 14x 2013. It is smaller than TPX $750mm sales, so it is considered to have higher growth potential as it catches up with a very similar strategy and business model.
ZZ is a bigger player in traditional mattresses and is highly levered following the LBO recapitalization by KKR in 2004. It has a market cap of $165mm and an EV of $850mm. It is trading at an EV/EBITDA of 7x LTM and 2012 as analysts don’t project any growth, and a P/E of ~40x for both LTM and 2012. As a highly levered company that is close to breakeven in terms of profitability, small changes in growth or efficiency can have a dramatic impact on the P/E ratio, which is expected to drop to 16x of 2013 earnings. Despite being the worst-positioned company, ZZ has the highest 2013 EPS multiple because it is more of a turnaround story with low margins and the opportunity to compete more aggressively in the premium segment of the market.
Compared to its peers – especially SCSS – TPX seems to have 15% upside to SCSS’ 2012 EV/EBITDA multiple and 40% to SCSS’ 2013 EPS multiple. Assuming that SCSS deserves a premium multiple for its higher growth prospects still indicates that a ~20% might be reasonable. In early May, TPX was trading at $60 (30% higher than the current price level), and before its earnings in mid/late-April it was trading above $80 (80% higher).
Valuation
Current Situation
Growth Story
Q1 2012 www.hedgefundwisdom.com

78
Tempur-Pedic (TPX)
Following its 1Q earnings call after the market close on April 19th, TPX shares lost 20% from $84 to $67. The company reported robust growth of 18% in sales, which was in line with analyst expectations, as were its earnings. However, the impression is that the industry grew faster than TPX, which was a big blow to the stock. Also, the company reaffirmed its 2012 guidance of $3.80-3.95 on $1.6bn of sales, which fell short of consensus of $4.06 EPS and $1.7bn sales. Analysts became less sanguine about the stock’s growth prospects because of intensifying competition in the specialty bedding segment and the potential of cannibalization from the introduction of lower-priced beds.
More intense competition in specialty beds will translate into slower growth for TPX and potentially lower prices and margins. Also, TPX has been focused on the higher end of the premium segment with very few low-priced offerings. In order to continue growing, it has to expand its product line into lower-priced products. These products may satisfy some of TPX’s current customers, thus resulting in a down-mix shift.
On May 7, TPX made a surprise announcement that it will be offering its Cloud Supreme mattress on sale from mid-May to July. Offering sales discounts is very uncharacteristic of TPX and goes against its strategy, which is why the market reacted so negatively. The stock lost almost 20% within a couple of days as the move was interpreted as a red flag that could signal deeper fundamental issues and slowing growth.
Current Situation
Bull Case, Bear Case & Summary
Growth Story
Q1 2012 www.hedgefundwisdom.com

79
The company's growth cycle has matured, so it doesn't deserve the historically high valuation multiples that reflected much higher growth. The risk is that SCSS has a lot of ground to cover in terms of increasing its brand awareness and distribution before it can catch up to TPX, which means that SCSS may capture most of the incremental segment growth. In addition, the high growth of the segment has attracted significant competition. Therefore, growth may be more difficult to achieve than expected. What’s more, TPX has leading margins, but as competition intensifies it may have to give back some of its pricing power. If EPS growth doesn’t materialize at >20% for the next couple of years, there is downside to the stock.
Hedge funds have been attracted to TPX because of its strong balance sheet, shareholder-friendly management, robust growth, and solid execution. It has all the ingredients to continue growing earnings at a rapid pace. However, competition is intensifying and what has made TPX successful can also be viewed as a source of risk to the relatively rich valuation: growth can slow down with more players, and margins can compress. The stock price took a big hit following disappointing guidance and concerns that the company needs to resort to discounts in order to boost sales.
Summary
Tempur-Pedic (TPX)
TPX is the premier specialty-bedding manufacturer and is taking market share from traditional mattresses. The combination of operating leverage and focus on cost cutting, in conjunction with aggressive share buybacks, creates a very positive earnings trajectory. TPX went through an aggressive expansion phase in the mid-2000s, so it currently has substantial excess capacity and it won’t need any material CAPX in the medium term. It generates a ~7% free cashflow yield, which gets allocated primarily to share repurchases. The company has already bought back ~ 1/3 of outstanding shares since 2005.
Management is shareholder-friendly and has been delivering solid results since the financial crisis. Looking forward, specialty bedding should continue in its high growth trajectory and TPX should remain the leader in this segment because of its high-quality product, solid execution and successful introduction of new products, and penetration opportunities (expanding distribution and capturing more retail slots, both domestically and internationally).
The Bull Case
Next: Analysis of AutoZone (AZO)
Growth Story
Q1 2012 www.hedgefundwisdom.com
The Bear Case

80
AZO is the largest retailer of automotive parts and accessories. It was founded in 1979 as part of a wholesale grocer by one of the grocer’s founders, at which time it was known as Auto Shack. Within 5 years it grew from 1 store to almost 200. At that time, the grocer’s management believed that the entire company was undervalued, so they approached and eventually completed a management buyout with KKR in 1984.
By 1987, it was evident that the auto parts business was the most promising division, so KKR with management decided to spin it out and sell the grocer. That was the year of the name change to AutoZone. With KKR’s assistance, AZO grew very rapidly by investing in new technologies, leveraging infrastructure, and building out its store network. AZO IPO’d in 1991 at a $1bn valuation. KKR retained 2/3 ownership following the IPO and eventually exited in 1996. In 1998, Eddie Lampert / RBS Partners became a significant shareholder. Currently, AZO has ~4,900 retail stores.
Company Background
Steve Mandel’s Lone Pine Capital established a new $400 million position in AutoZone (AZO) during the quarter. Scout Capital and Hoplite Capital also started new positions in the name. What’s interesting is that many hedge funds are becoming interested in the stock just as large stakeholder Eddie Lampert and his RBS Partners have been selling shares.
Industry Background
AutoZone (AZO)
Hedge Fund Activity
Q1 2012 www.hedgefundwisdom.com

81
Industry Background (Continued)
Industry Background
The auto parts aftermarket has two segments: the Do It Yourself (DIY) segment, which caters to car owners looking to repair and maintain their vehicles without the help of professionals; and the Do It For Me (DIFM) or commercial segment, which caters to individuals who pay service shops for repairs and maintenance. Through commercial sales programs, retailers deliver auto parts to local garages, auto dealers, and service stations. DIY is a $44bn market and has been growing at a 4% annual rate. DIFM is a larger and highly-fragmented market growing at a slightly slower pace.
The main driver-dynamics in the industry are: the increasing age of vehicles on the road increases the demand for replacement parts as older vehicles break down more frequently (especially relevant are cars 7 years or older as they come out of warranty), the decreasing number of miles driven is negative for demand because of the slower wear and tear of the cars, increasing gas prices can make customers more budget conscious about maintenance, as well as eventually shift their focus to the purchase of new cars that are much more fuel efficient.
The auto parts aftermarket has been benefiting from a tailwind in the aftermath of the financial crisis. During the crisis, demand dropped as customers postponed maintenance and brought their auto spending to halt. However, even though miles driven declined, car maintenance isn’t entirely discretionary and can only get pushed out to a certain extent, generating pent-up demand, which was manifested in the following years. As new car sales dropped dramatically, the average age of cars has been steadily increasing. The result has been strong same-store-sales growth at auto parts retailers.
However, as the economy improves, the DIY market is at risk of slowing down. It is also expected that the growth of the DIFM market will eventually outpace DIY growth as cars become increasingly complicated. This is why retailers are shifting resources towards the commercial / DIFM market, where their market share is much lower and they can grow much faster by increasing their penetration. The “Big 3” have 1/3 of the DIY market but only 10% of the DIFM market. AZO, the largest retailer, still has a <2% market share in DIFM. This presents a growth opportunity for retailers as they add commercial capabilities to more of their stores. As DIY slows down, retailers will increasingly shift focus to DIFM.
There are three big retailers in the auto parts aftermarket (the “Big 3”): AutoZone, Advance Auto Parts, and O’Reilly Auto Parts. AZO is the largest player in the industry with $8bn in sales (up from $6bn in 2007) and it is the most profitable with a 21% EBITDA margin. It has a $14.5bn market cap and a $17.9bn EV, and it trades at 10x EBITDA and 17.5x EPS.
AutoZone (AZO)
Q1 2012 www.hedgefundwisdom.com

82
Valuation
Industry Background (Continued)
Advance Auto Parts (AAP) is the 2nd largest auto aftermarket distributor with ~3,650 stores. AAP generates slightly more than $6bn in sales (up from slightly less than $5bn in 2007) and is the least profitable with a 13% EBITDA margin. It started in 1929 as a general merchandiser with the name Advance Stores, but refocused on auto parts in the late 1980’s and switched its name.
AAP executed a DIFM expansion strategy earlier than AZO, achieved organic growth but sacrificed incremental margins, and now it is cutting expenses in order to improve profitability. However, the strategy has resulted in lower margins because of the investments in a larger headcount and in lost market share in the core DIY segment, perhaps because of lost management focus. The company’s same-store-sales have lagged the industry for the past couple of years.
As a result, even though AAP is the 2nd largest in terms of distribution network, it has only a $4.9bn market cap and $5.1bn EV (valued at less than half of ORLY), and it trades at 6x EBITDA and 12x EPS. AAP trades at the lowest multiple of the Big 3 because of its lagging growth, both on same-store-sales and because it has allowed the 3rd player, ORLY, to catch up with a much more successful acquisition-based growth strategy. Its competitors have continued to invest and may be taking market share, while AAP has been focused more on improving margins.
O’Reilly Auto Parts (ORLY) has ~3,800 stores and generates slightly less than $6bn in sales (up from $2.5bn in sales in 2007) with a 17% EBITDA margin. It used to be significantly smaller than AAP but caught up through aggressive growth and acquisitions, as AAP shifted towards organic growth in more recent years. ORLY started in 1957, when a parent and son team disagreed with the restructuring of the auto supply company they were working at, which would have retired the father and relocated the son, so they decided to start their own auto parts business in a market they knew well. The company became publicly traded in 1993. ORLY has an $11.8bn market cap and a $12.0bn EV, and it trades at 11x EBITDA and 23x EPS. ORLY trades at a high premium because it has been successfully growing through acquisitions that generate synergies, it has made significant investments that should reduce its inventory capital requirements going forward, and it is expected to generate incremental excess cashflow to support further share buybacks.
Two other competitors that aren’t part of the Big 3 are Genuine Parts Company (GPC) and CarQuest. CarQuest is a private company slightly smaller than AAP and ORLY in terms of distribution. GPC generates the same amount of sales from auto parts as AAP and ORLY, but it is a more diversified company. It distributes replacement parts for cars, as well as parts for industrial machinery and office supplies. The auto parts segment accounts for half the company’s sales.
AutoZone (AZO)
Q1 2012 www.hedgefundwisdom.com

83
Bull Case, Bear Case & Summary
Valuation
AZO has traded historically at 7-10x EBITDA and 13-18x P/E. It is currently trading at 10x EBITDA and 17.5x P/E, the top end of its range. This reflects bullish investor expectations as the company’s strategy has been to take advantage of the tailwinds in the DIY market (rapidly increasing average age of cars on the road as car owners delayed new car purchasers) and invest into marketing and in its commercial segment. As a result, AZO’s commercial sales have been growing at a >20% rate and its earnings have been beating consensus for 12 quarters straight. Sell-side analysts have the most conviction in this stock out of the Big 3 because of its strong execution, leading industry metrics, recent investments, and superior organic growth profile. Nevertheless, based on its historical valuation range, AZO seems fairly valued.
Compared to the public peers, AZO is usually valued at a premium forward P/E multiple to AAP and a discount to what at least used to be a smaller and faster-growing ORLY. Historically, AZO has traded at a 10-20% discount to ORLY and a similar premium to AAP. AZO currently trades at almost 15x 2012 EPS. AAP’s lagging same-store-sales trends are reflected in relatively flat EPS in 2012, so it trades at 12x 2012 EPS. ORLY’s faster growth is reflected in a premium multiple of 20x 2012 EPS. The trading multiples indicate that there could be some upside in AZO’s shares if it can deliver consistent growth through its commercial segment, but the market seems to be a bit skeptical.
AutoZone (AZO)
Q1 2012 www.hedgefundwisdom.com

84
The auto parts aftermarket retailers have been benefiting from tailwinds in the aftermath of the financial crisis, but these tailwinds are already slowing down and could reverse as the economy improves and pent-up demand for new cars starts reducing the average age of cars on the road. Nevertheless, AZO is well-positioned to continue its rapid earnings growth due to its recent investments into beefing up its commercial segment, where its market share has been lagging. In an increasingly challenging environment, AZO still has a favorable growth profile, but its valuation is already at the top of its historical range.
Summary
AZO’s and other aftermarket auto retailers’ performance has benefited from the recent crisis and continued uncertainty that has translated into fewer new car purchases and more older cars on the roads. This in turn drives sales of auto parts and maintenance services. However, there is a point at which technological advances in fuel efficiency start making more economic sense as opposed to maintaining an old car. New car purchases are already on an upwards trajectory. In conjunction with high oil prices, demand for aftermarket auto parts may shrink going forward. Valuations seem extended as stocks are trading at the higher end of their historical valuation ranges.
On May 17th, AAP held a disappointing earnings call (weak same-store-sales growth and outlook), and the stock has dropped 25% since then, while ORLY and AZO have lost <10%. Investors have interpreted AAP’s weakness to be company-specific, but weakening same-store-sales could be a DIY-segment issue industry-wide. More optimistic investors have attributed the organic growth issues to the warm winter weather.
The Bull Case
AZO has generated high and consistent returns on capital and growth. Given macro uncertainty, it is unlikely that new car purchases will spike anytime soon, so the modest improvement in the new car market shouldn’t have as large of a negative impact as investors fear. Even though the aging trend of cars on the road will slow down, AZO has more growth levers than peers because it is underpenetrated in the commercial segment, which accounts for only 15% of its sales, compared to 35-40% for peers. In addition, management has been driving high EPS growth through free cashflow deployment into share buybacks. AZO is a shareholder-friendly market leader, with demonstrated robust execution and strong performance metrics, trading at reasonable valuation levels that indicate upside potential. Consensus has consistently under-appreciated AZO’s growth potential, so the forward P/E multiple may prove artificially high and may expand further.
AutoZone (AZO)
Q1 2012 www.hedgefundwisdom.com
The Bear Case
This concludes the Q1 2012 edition of Hedge Fund Wisdom

85
Q1 2012 www.hedgefundwisdom.com May 21, 2012
Terms of Use & Publication Information
Copyright © 2012 Hedge Fund Wisdom LLC. All Rights Reserved. The U.S. Copyright Act imposes liability of up to $150,000 for each act of willful infringement of a copyright. All material is copyrighted by Hedge Fund Wisdom LLC, except for some material that is copyrighted by others and cited accordingly. Copyrighted material may not be copied, reproduced or otherwise used for commercial purposes without the written permission of the copyright holder. This site also contains some trademarks, which may not be appropriated by persons other than the trademark owner and may not be used contrary to trademark law. The information, opinions, and material displayed and presented on HedgeFundWisdom.com and in the Hedge Fund Wisdom newsletter (collectively referred to herein as “HFW”) are provided for informational purposes only and are not to be used as or considered an offer or a solicitation to sell or buy securities, investment products, or other financial instruments, nor to constitute any advice or recommendation with respect to such securities, investment products, or other financial instruments. The information, opinions, and material displayed and presented by HFW are prepared for subscription without regard to the specific investment objectives, financial situation, and particular needs of any individual person or corporate entity who may receive or view this information. Before making any investments or entering into any transaction in relation to any securities mentioned or referenced by HFW, you agree to independently evaluate an investment and/or consult an independent financial adviser who is licensed and registered in both the jurisdiction where you reside and the jurisdiction in which said securities are being offered. Failure to do so is in violation of the Terms of Use of HFW and thereby releases HFW from any and all liability. In preparation of the materials and newsletters offered by HFW, every effort has been made to offer the most current, correct, and clearly expressed information possible. However, inadvertent errors in information may occur and information may become outdated. These errors may include but are not limited to typographical errors and accuracy or timeliness of the information that may be contained on the pages. HFW also reserves the right to make changes at any time without notice. HFW reserves the right to cancel subscriptions at any time at its sole discretion. Members whose subscriptions are canceled will be refunded the pro-rated remainder of their subscription payment. The employees, members, principals, and contractors of HFW invest in a variety of securities including but not limited to common stock and other equity, bonds, limited partnerships, derivatives, options, and hedge funds. HFW’s employees, members, principals, and contractors may be long or short a security at any time, and said positions change frequently without notice. By using HFW’s website or newsletter, you agree to make your own independent financial decisions based on your opinion and/or the opinion of your financial advisor(s) notwithstanding the personal investment positions of any employees, members, principals, and contractors of HFW. The information and data included in HFW have been compiled from a variety of sources and are subject to change without notice. HFW makes no warranties or representations whatsoever regarding the quality, content, completeness, or adequacy of such information and data. If misleading, inaccurate or otherwise inappropriate information is brought to our attention, a reasonable effort will be made to fix or remove it. Please contact us at [email protected] with any concerns. Documents and materials on HFW’s website and this publication may provide access to the World Wide Web. Because HFW connects to the Internet, once you leave the site, we cannot control the information you access. HFW links to external websites in the hope that users will find reference material on related subjects. HFW does not control those sites and is not responsible for the content included in them, including but not limited to any subsequent links contained within a linked site, or any changes or updates to a linked site. Each individual site has its own set of policies about what information is appropriate for public access. HFW is not responsible for any information or material located at any site other than www.hedgefundwisdom.com. HFW makes no representations or warranties regarding the condition or functionality of the website, its suitability for use, or that this web service will be uninterrupted or error-free. By using HFW, you assume all risks associated with the use of this site and publication including any risk to your computer, software or data being damaged by any virus, software, or any other file that might be transmitted or activated via an HFW web page or your access to it. HFW shall not be liable for any damages of any kind (general, special, incidental or consequential damages, including but in no way limited to lost revenues or lost profits) resulting from the use or misuse of the information contained in HFW’s web pages and publication. Reference herein to any specific commercial product, process, or service by trade name, trademark, manufacturer, or otherwise, does not necessarily constitute or imply endorsement, recommendation, or favoring by HFW. The views and opinions of authors expressed herein do not necessarily state or reflect those of HFW, and shall not be used for advertising or product endorsement purposes.