free surface modeling using cfd: bubble bursting by …
TRANSCRIPT

FREE SURFACE MODELING USING CFD:
BUBBLE BURSTING
by
NUR FATIN BTE ALIAS
A project dissertation submitted to the
Chemical Engineering Programme
Universiti Teknologi PETRONAS
in partial fulfilment of the requirement for the
BACHELOR OF ENGINEERING (Hons)
(CHEMICAL ENGINEERING)
UNIVERSITI TEKNOLOGI PETRONAS
TRONOH, PERAK
July 2010
i
CERTIFICATION OF APPROVAL
Free Surface Modeling by Using CFD: Bubble Bursting
by
Nur Fatin bte Alias
A project dissertation submitted to the
Chemical Engineering Programme
Universiti Teknologi PETRONAS
in partial fulfilment of the requirement for the
BACHELOR OF ENGINEERING (Hons)
(CHEMICAL ENGINEERING)
Approved by,
_____________________
(Dr. Nurul Hasan)
UNIVERSITI TEKNOLOGI PETRONAS
TRONOH, PERAK
July 2010

ii
CERTIFICATION OF ORIGINALITY
This is to certify that I am responsible for the work submitted in this project,
that the
original work is my own except as specified in the references and
acknowledgements, and that the original work contained herein have not
been
undertaken or done by unspecified sources or persons.
______________________
NUR FATIN BTE ALIAS

iii
ABSTRACT
Bubble bursting is a process where bubble rises up to a surface of a liquid and
experiences bubble film breaks and liquid jet. Invisible to the naked eyes, these two
events produce droplets known as film drops and jet drops. There are a lot of industrial
problems that are pertinent to these droplets and these problems are very important to be
properly handled as they can affect the working environment and workers’ health.
Realizing the importance of bubble bursting phenomenon, this project has the objective
to capture the bubble bursting mechanisms by using CFD and to study the effect of
surface tension and initial bubble diameter on bubble bursting mechanism. CFD package
that is used in this study is FLUENT 12.0 and the tracking method used is Volume-of-
Fluid (VOF). The cases are run for two different surface tension which are 1.2 N/m and
1.4 N/m and two different initial bubble diameter which are 11.5 mm and 9.3 mm. In
terms of bubble bursting, the main events of this phenomenon have been captured
successfully by CFD where the disintegration of bubble cap and production of liquid jet
are observed. However in terms of film and jet droplets formation, this simulation does
not show any formation of droplets from the bubble bursting causing no conclusion can
be made to relate direct relation between surface tension and initial bubble diameter to
the formation of droplets. Improvement can be made to have finer mesh to capture
possible formation of droplets in the system.
iv
ACKNOWLEDGMENT
First and foremost, a praise to Almighty for giving me the strength and determination in
completing this project. I would like to express my heartfelt gratitude to my supervisor,
Dr. Nurul Hasan for his guidance and supports. Without his advice and supervision, this
study may not be able to be completed. As a supervisor, he has been a source of
motivation towards the completion of this project.
A large measure of gratitude also goes to the following persons who have contributed
significantly towards the project:
Dr. Khalik M. Sabil and Dr. Mohanad El-Harbawi, the Final Year Research Project
Coordinators, who kindly made the arrangement to provide the students with the
necessary tools and materials for research works. Mr. Remy Azuan, the Chemical
Engineering Design Laboratory Technician for providing laboratory workspace,
apparatus and rendering his technical assistance. Lastly, my sincere thanks to my family
for their support and also to friends who not only gave encouragement but also their
effort in assisting my project works.

v
TABLE OF CONTENTS
CERTIFICATION OF APPROVAL ................................................................................... i
CERTIFICATION OF ORIGINALITY ............................................................................. ii
ABSTRACT....................................................................................................................... iii
ACKNOWLEDGMENT.................................................................................................... iv
TABLE OF CONTENTS.................................................................................................... v
LIST OF FIGURES .......................................................................................................... vii
LIST OF TABLES........................................................................................................... viii
CHAPTER 1: INTRODUCTION....................................................................................... 1
1.1. Background of Study............................................................................................ 1
1.2. Problem Statements.............................................................................................. 2
1.3. Objectives............................................................................................................. 3
1.4. Scope of Study ..................................................................................................... 4
CHAPTER 2: LITERATURE REVIEW............................................................................ 5
2.1. Validation Papers ................................................................................................. 5
2.2 Other Experimental Studies ...................................................................................... 9
2.3 Comparisons between experimental and numerical studies.................................... 10
CHAPTER 3: METHODOLOGY .................................................................................... 11
3.1. Final Year Project Methodology........................................................................ 11
3.2. Final Year Project Gantt Chart........................................................................... 12
3.3. Final Year Project Research Methodology ........................................................ 13
3.4. Tools and Equipment ......................................................................................... 14
3.5. CFD Problem Solving using FLUENT .............................................................. 14
3.6. Overview on Fluid Simulator............................................................................. 15

vi
3.6.1. Fluid Movement Governing Equation : Navier Stokes Equation ............... 15
3.6.2. Interface Tracking Method : Volume of Fluid (VOF) ................................ 16
3.7. Validation Case I: Bubble bursting phenomenon in Gas/Metal/Slag systems... 18
3.7.1. Experimental and Simulation Setup............................................................ 18
3.7.2. Geometry of Computational Domain.......................................................... 20
3.7.3. Model and Numerical Background............................................................. 21
3.8. Validation Case II: Dust formation in Electric Arc Furnace.............................. 23
3.8.1. Experimental and Simulation Setup............................................................ 23
3.8.2. Geometry and Grid ..................................................................................... 24
3.8.3. Model and Numerical Background............................................................. 24
3.9. Validation Case III: Production of Water Drops and Corona due to Rupture of
Air Bubbles at Water Surface under a Positive DC Electric Field..................... 25
3.9.1. Experimental and Simulation Setup............................................................ 25
3.9.2. Model and Numerical Background............................................................. 25
CHAPTER 4: RESULTS AND DISCUSSIONS ............................................................. 26
4.1. Bubble Bursting Phenomenon............................................................................ 26
4.1.1. Bubble Film Breakage ................................................................................ 26
4.1.2. Liquid Jet Production.................................................................................. 29
4.1.3. Comparison with Literature Review........................................................... 31
4.2. Effect of Initial Bubble Diameter to Bubble Bursting ....................................... 31
CHAPTER 5: CONCLUSIONS ....................................................................................... 35
REFERENCES ................................................................................................................. 36

vii
LIST OF FIGURES
Figure 1.1 Modeling Objectives ..........................................................................................3
Figure 2.1 Film Rupture of a Bubble at Free Surface..........................................................5
Figure 2.2 Jet Drops Formation from Vertical Liquid Jet ...................................................6
Figure 2.3 X-Ray Images on Droplet Formation from Bubble Bursting.............................7
Figure 2.4 Graphs of Mass Ejections against size of bubble ...............................................8
Figure 2.5 Graphs of Mass Ejections against surface tension .............................................8
Figure 2.6 Diameter of first drop and number of drops versus drops ejected .....................9
Figure 3.1 Simplified Diagrams on Final Year Research Methodology ...........................11
Figure 3.2 Gantt Chart for Final Year Project ...................................................................12
Figure 3.3 Basic Procedural Steps in Solving Problem using FLUENT ...........................14
Figure 3.4 Averaging Volume compared to bubble/drop volume .....................................17
Figure 3.5 Experimental Setup for Bubble Bursting Phenomenon in Gas/Metal/Slag System................................................................................................................................19
Figure 3.6 Redrawn Experimental Setup for Case I ..........................................................20
Figure 3.7 Experimental Setup done by Guezzenece et al.................................................23
Figure 3.8 Details on crucible used by Guezzenec et.al ....................................................24
Figure 4.1 Bubble at Liquid Surface before Burst .............................................................26
Figure 4.2 Single Point breaks on Bubble Cap ..................................................................27
Figure 4.3 Formation of Hole during Bubble Film Breakage............................................28
Figure 4.4 Disintegration of Bubble Cap...........................................................................28
Figure 4.5 Liquid Surface tends to Close Up to Produce Liquid Jet .................................29
Figure 4.6 Liquid Jet Production .......................................................................................30
Figure 4.7 Bubble Bursting phenomenon by Sugimoto and Higayashima........................31
Figure 4.8 Initial Condition for 9.3mm and 11.5mm diameter or bubble .........................32

viii
Figure 4.9 Time for bubble reaches the surface for different bubble size .........................32
Figure 4.10 Time for bubble cap to completely disappear for different bubble size.........33
Figure 4.11 Time for highest liquid jet for different bubble size.......................................33
LIST OF TABLES
Table 3.1 Geometric Configuration of the Computational Domain for Case I ................20
Table 3.2 Solver Settings used in Case I Simulation .........................................................20
Table 3.3 Multiphase Settings used in Case I Simulation .................................................21
Table 3.4 Time Solver Settings for Case I Simulation ......................................................21

1
CHAPTER 1: INTRODUCTION
1.1. Background of Study
It is normal for naked eyes to see the phenomenon as a simple process where bubble
rises from the underneath of fluid, and when it reaches the surface, the bubble will burst
and disappear. This phenomenon might seem to be insignificant. However, considering
bubble bursting phenomenon in industry like metallurgy processes and oceanography,
this phenomenon is considered as a critical aspect that seems to be the key point in
controlling or improving a process [1].
An application in steelmaking industry that correlates with bubble bursting
phenomenon is Electric Furnace Arc (EAF). In EAF, dust formed from the process
consists of hazardous metal elements which require specific storage and landfills and the
main mechanism of this EAF dust formation is bubble bursting [1]. Similar phenomenon
happens in pneumatic steelmaking where bubble bursting is believed to be the source of
dust formation [2] and It is proven that the main mechanism of dust formation in
pneumatic steelmaking process is the formation of metal droplets that are caused by
bubble bursting phenomenon that happened on the free surface of iron melt [3]. These
dusts are considerably hazardous as they contained metal oxides, lime, silica, zinc, lead
and cadmium. In order to cater the dusts problem, a better understanding of the
interaction between the bubble and the system is highly important.
Same goes in electroplating process where bubble bursting phenomenon is causing
Cr(VI)-containing droplets which received considerable attention because of high
prevalence rates of nasal septum ulcer or perforation among chromium electroplating
workers [4]. Furthermore, bubble bursting also is very important in glass-making
manufactures as bubbles which formed during the introduction of sand into the molten
glass should rise and burst before the glass leaves the furnace [5]. Thus, it might be an
interesting attention on how long a bubble will burst, assuming constant surface tension.
More interesting, bubble bursting phenomenon also plays an important role in animal cell

2
technology which important in medical product such as viral vaccines, antibodies and
human therapeutic proteins, where bubble bursting is implicated as the cause in cell
damage in cell culture fermentors [6]. Bubble bursting also can be seen as a mechanism
in release of sea salt particles at the ocean surface [7].
From these processes, it can be seen that, a simple phenomenon such as bursting of
bubble at a free surface is considerably important to many aspects such as health and
hazard risks. Thus, a deep understanding on how this phenomenon occurs, its key
parameters and its consequences are highly needed so that, the related industry processes
can be improved significantly.
1.2. Problem Statements
A lot of studies have been carried out in investigating bubble bursting phenomenon
in order to get clearer view on the related process industries or natural phenomenon.
Significant numbers of experiments have been conducted for above objectives. However,
an adaption of Computational Fluid Dynamics (CFD) in studying and investigating
bubble bursting phenomenon specifically is quite unfamiliar and very few open literature
available.
As there are many attempts in solving and modeling bubble bursting phenomenon,
with various types of method and approaches, it has to be realized that it is very
challenging to model the bubble bursting in terms of computational techniques and
computational cost. In this project, bubble bursting phenomenon will be modeled by a
chosen CFD package, FLUENT 12.0 to provide significant findings the mechanisms in
bubble bursting phenomenon and the effects of key parameters on the bubble bursting.
3
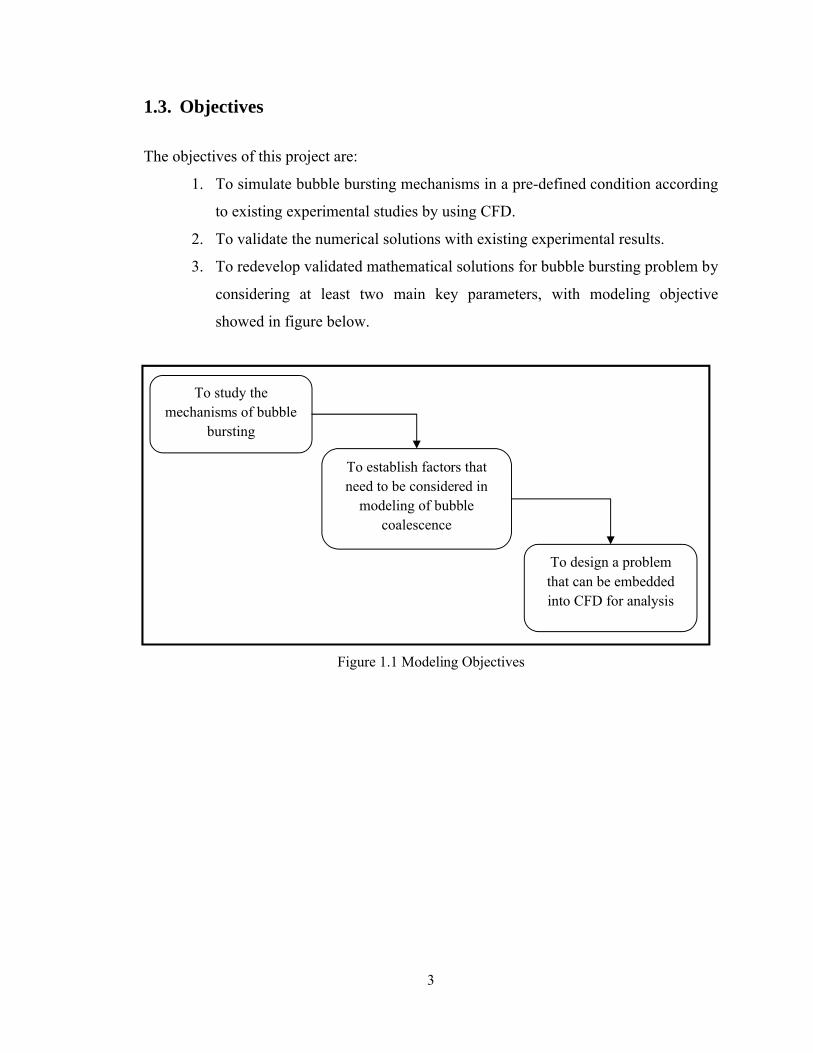
1.3. Objectives
The objectives of this project are:
1. To simulate bubble bursting mechanisms in a pre-defined condition according
to existing experimental studies by using CFD.
2. To validate the numerical solutions with existing experimental results.
3. To redevelop validated mathematical solutions for bubble bursting problem by
considering at least two main key parameters, with modeling objective
showed in figure below.
Figure 1.1 Modeling Objectives
To study the mechanisms of bubble
bursting
To establish factors that need to be considered in
modeling of bubble coalescence
To design a problem that can be embedded into CFD for analysis

4
1.4. Scope of Study
This paper is expected to fully use the application of a CFD package which is
FLUENT 12.0 to investigate the actual mechanisms occurs in bubble bursting and to
capture any significant consequences from bubble bursting. In addition, this paper also is
expected to examine the effects of two key parameters on the bubble bursting. The key
parameters should be depending on the experiments that are going to be used to validate
this model and they include surface tension, viscosity and parent bubble diameter. For the
computer domain’s geometric configuration and all test conditions, they are specified
from existing experimental setup. Lastly, the simulation results were compared with the
key papers and presented subsequently.

5
CHAPTER 2: LITERATURE REVIEW
Realizing the importance of bubble bursting towards many industries and applications,
numerous studies have been carried out, experimentally and numerically, studying the
main situations that occurs during bubble bursting phenomenon. Besides, a lot of existing
papers also have studied various key parameters in bubble bursting.
2.1.Validation Papers
Guézennec and colleagues[1] have carried study on bubble bursting phenomenon to
capture the formation of film and jet droplets generated from bubble bursting by using
high speed camera. They also study the relations between bubble burst phenomenon with
generated droplet size and number. They came out with a conclusion on three steps in
bubble bursting which produces two types of droplets;
After the bubble rises and reaches the surface, the bubble floats at the surface with
an equilibrium position that can be determined with a thin liquid film that
separates the bubble from atmosphere.
The bubble cap ruptures when the film reaches critical thickness and the
disintegration produces fine droplets or film droplets
Figure 2.1 Film rupture of a bubble at free surface[1]
Film drops

6
After the rupture, the cavity remaining at the liquid surface closes up, creating an
upward jet that is unstable and can break up into droplets which are larger that
film droplets. These droplets are called jet droplets.
Figure 2.2 Jet drops formation from vertical liquid jet [8]
In this study also, the high speed video proves that the bubble cap ruptures from one
point, regardless the bubble size. Experiments carried out by Guézennec and colleagues
also showed the jet drop size represents 10 to 18% of the parent bubble size. In this
experiment, film drop projections could not be observed in the images due to the
limitation on image resolution of the high speed video.
From the study, there are three main aspects that will be replicated in CFD which are:
i. the jet drop size represents 10 to 18 % of parent-bubble size
ii. number of jet drops increases as the parent-bubble decreases, which
propose an exponential law;
)58.0exp(4.43 Bdrops dN (1)
iii. Amount of film drops coming from bubble burst at the surface of the
steel bath decreases as the bubble size decreases.

7
Zhijun Han and Lauri Holappa also had set up an experimental model in investigating the
main factors affecting bubble bursting on their paper entitled "Bubble Bursting
Phenomenon in Gas/Metal/Slag Systems" [2], where in the paper, they observed bubble
bursting phenomenon at the interface of slag/iron systems by using the X-ray
transmission techniques and they studied the effects of bubble diameter and surface
tension for two cases; bubble bursting on the free surface of molten iron and bubble
bursting to the slag/iron interface. They found that the mechanisms of bubble bursting are
quite similar to air/water system and two groups of droplet are found in the experiment;
fine droplets with diameter few microns up to about 500 µm and bigger droplets with
several millimeters in diameter. The fine droplets formed from bubble film cap rupture at
the iron melt surface and the bigger droplets are formed from jet produced by collapsing
the residual bubble cavity. Figure 2.3 below shows the images that had been captured
when bubble bursting occurs.
Figure 2.3 X-Ray images of bubble bursting at iron melt surface [2]
Han and Haloppa also showed the relationship between bubble size and surface tension
on the formation of droplets from bubble bursting (refer Figure 2.4 and Figure 2.5).
These results will be compared to result gained by this paper.

Figure 2.4 Graph of mass of ejection against size of bubble
Figure 2.5 Graph of mass of ejection against surface tension for bubble diameter of 11.5mm
Sugimoto and Higayashima
due to rupture or air bubbles ate water surface under a positive DC electric field. In a part
of their experiment, Sugimoto and Higayashima briefly explained about production of jet
drops without electric field, making
study, they showed a linear relationship between size of bubble caps and the diameter of
the jet drops released from the water jet. They also observed that size of jet drops are
about one-fifth of the film caps. Figure 2.6 below shows the graph that had been
developed by Sugimoto and Higayashima.
8
Graph of mass of ejection against size of bubble (regenerated)
Figure 2.5 Graph of mass of ejection against surface tension for bubble diameter of 11.5mm
(regenerated)
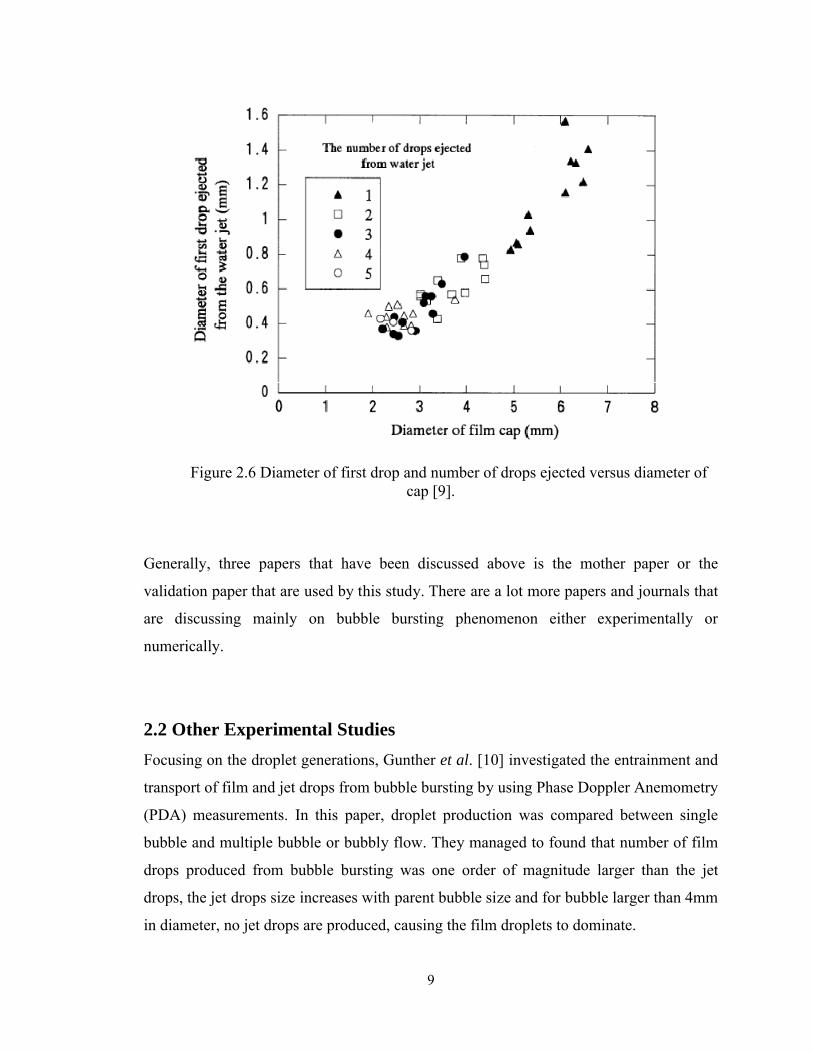
Sugimoto and Higayashima [9] also had performed a study on production of water drops
due to rupture or air bubbles ate water surface under a positive DC electric field. In a part
of their experiment, Sugimoto and Higayashima briefly explained about production of jet
drops without electric field, making it similar with other case of bubble bursting. In their
study, they showed a linear relationship between size of bubble caps and the diameter of
the jet drops released from the water jet. They also observed that size of jet drops are
film caps. Figure 2.6 below shows the graph that had been
developed by Sugimoto and Higayashima.
(regenerated)
Figure 2.5 Graph of mass of ejection against surface tension for bubble diameter of 11.5mm
a study on production of water drops
due to rupture or air bubbles ate water surface under a positive DC electric field. In a part
of their experiment, Sugimoto and Higayashima briefly explained about production of jet
it similar with other case of bubble bursting. In their
study, they showed a linear relationship between size of bubble caps and the diameter of
the jet drops released from the water jet. They also observed that size of jet drops are
film caps. Figure 2.6 below shows the graph that had been
9
Figure 2.6 Diameter of first drop and number of drops ejected versus diameter of cap [9].
Generally, three papers that have been discussed above is the mother paper or the
validation paper that are used by this study. There are a lot more papers and journals that
are discussing mainly on bubble bursting phenomenon either experimentally or
numerically.
2.2 Other Experimental Studies
Focusing on the droplet generations, Gunther et al. [10] investigated the entrainment and
transport of film and jet drops from bubble bursting by using Phase Doppler Anemometry
(PDA) measurements. In this paper, droplet production was compared between single
bubble and multiple bubble or bubbly flow. They managed to found that number of film
drops produced from bubble bursting was one order of magnitude larger than the jet
drops, the jet drops size increases with parent bubble size and for bubble larger than 4mm
in diameter, no jet drops are produced, causing the film droplets to dominate.

10
2.3 Comparisons between experimental and numerical studies
Boulton-Stone and Blake [11] studied the complex motion occurs when air bubble bursts
at air-water interface which resulting in high speed liquid jet. Boulton-Stone and Blake
used boundary integral method in modeling numerically the free surface motion and
analyze the effect of bubble diameter on bubble bursting. Stone and Blake showed that
values of pressure and energy dissipation rates in the fluid indicate a violent motion that
causes cell damage in biological industry.
An improvement paper followed, Dey, Boulton-Stone, Emery and Blake have carried out
study in explaining the effect of surfactants at free surface to bubble bursting [6]. They
compare between experimental data and numerical model, where the study found out the
effect of surfactant on time of jet formation, the height and width of jet formed and the
number of droplets released. The numerical modeling is based on boundary integral
method.
While for Sussman et al. [12] they used level set method in capturing the water/air
interfaces as boundary integral method is believed to be difficult to be used as bubble
bursting phenomenon is consisting merging and breaking up mass of fluid. In Sussman et
al. [12], fluids are governed by Navier-stokes equation.
Gas bubble bursting process continues to be investigated numerically by Georgescu,
Achard and Canot [13]. This numerical solution is using boundary element method with
explicit second order time-evolution scheme on several purely Newton fluid and different
parent bubble sizes. The fluid flows are governed by Laplace equation for the velocity
potential and Euler’s equation. Georgescu, Achard and Canot [13] showed similar
argument regarding stages in bubble bursting phenomenon with Guézennec et al.’s but
their model only focusing on jet drop formation, the last stage. The parent bubble sizes
used in this study varied from 0.5 mm radius up to critical bubble radius. One of the main
findings from this study is when parent bubble size is smaller than critical size, the jets
formed split up and produced successive jet drops. However, for parent bubble size
greater than critical size, the jet decays without splitting and no jet drops were formed.

11
CHAPTER 3: METHODOLOGY
This chapter basically explains about the general methodology planned in completing
Final Year Project (FYP) for Semester I and Semester 2. This chapter also includes the
specific methodology used in achieving the objectives and solving problem statements
stated in previous chapter.
3.1. Final Year Project Methodology
Figure3.1 below shows the sequential steps that are planned in achieving the
objectives of Final Year Project.
Figure 3.1 Simplified Diagram of Research Methodology in Final Year Project
Preliminary Research
Identification of Validation Cases
Replicate
Validate
Reproduce
Validate
Compilation
Agree with experimental data
Not agree with experimental data
Agree with experimental data
Not agree with experimental data

12
3.2. Final Year Project Gantt Chart
No. Detail/ Week Jan Feb Mar Apr May Jun Jul Aug Sep Oct Nov Dec
1 Selection of project title and brief description of project by supervisor
2 Project Initiation – Literature Review Validation cases identification
3 Methodology Identification on Modeling Methodology
4 Project Work – Regenerate/redraw all cases
computational domain Build mesh
5 Project Work on each case Physical and Boundary Settings Run cases Discussion on results
6 Poster Exhibition
7 Submission of Dissertation (soft bound)
8 Oral Presentation
9 Submission of Project Dissertation (Hard Bound)
Process
Figure 3.2 Gantt Chart for Final Year Project

13
3.3. Final Year Project Research Methodology
Preliminary Research includes all activities in gaining basic knowledge and
literature reviews on all aspects associated with this study. Basically, there are five main
aspects that have been considered to be crucial to be knew in order to have the full grasp
about this study. The five aspects are:
Free Surface Modeling using Computational Dynamics (CFD)
Volume-of-Fluid (VOF) Method
Bubble Bursting Phenomenon
All related researches under these five aspects have been discussed in Chapter 2.
In Identification of Validation Case, three main cases have been chosen based on
the degree of relation with this study. As been mentioned in Chapter Two, the three cases
are:
Validation Case I: Bubble Bursting Phenomenon In Gas/Slag/Metal Systems
by Zhijun Han and Lauri Holappa.
Validation Case II: Dust Formation By Bubble Burst Phenomenon by G.
Guezennec, J.C. Huber, F. Patisson, Ph. Sessiecq, J.P. Birat and D. Ablitzer.
Validation Case III: Production of Water Drops and Corona due to Ruptue
of Air Bubbles at Water Surface under Positive DC Electric Field by
Toshiyuki Sugimoto and Yoshio Higayashima
In Replicate stage, the experimental models in the validation cases will be
implemented in FLUENT. All fluid properties, experimental setups, constants and
parameters considered in the experiment will be applied in FLUENT. By using
FLUENT, the experimental model will be computationally solved and the results will be
compared with experimental results from the validation cases. Agreement between
computational results and experimental result will validate the computational model
used in solving the cases.

14
3.4. Tools and Equipment
In completing this study, FLUENT 12.0 software is used to study the bubble
bursting phenomenon and some modification is done in defining the problem. Prior to
FLUENT solving stage, GAMBIT 2.4.6 is used to draw the 3D geometry and generate
mesh for problem solving. Most of computational domain related to problems will be
drawn by using AutoCAD 2004. For viewing and presenting the results form numerical
solution, TECPLOT 360 2010 is used.
3.5. CFD Problem Solving using FLUENT
In applying the experimental models form validation cases in FLUENT, there are
steps that are generally carried out in order to achieve the modeling goals. Figure 3.2
below shows the basic procedural steps in solving problems using FLUENT.
Figure 3.3 Basic procedural steps in solving problem using FLUENT
Define the modeling goals
Create the model geometry and grid
Set up the solver and physical models
Compute and monitor the solution
Consider revisions to the numerical or physical model parameter is necessary

15
As the modeling goal has been identified, the Step 2 which is to create the model
geometry and grid, FLUENT requires a geometry modeler and grid generator. This study
will use GAMBIT Version 2.4.6 as a separate system for geometry modeling and grid
generation before it can be solved in FLUENT. The completed geometry and meshes will
be solved in FLUENT to get the desired result.
3.6. Overview on Fluid Simulator
3.6.1. Fluid Movement Governing Equation : Navier Stokes Equation
The equations governing the fluid motion are the three fundamental principles of mass,
momentum, and energy conservation [14].
Continuity 0
Vt
(2)
Momentum 0 Fp
Dt
DVij
(3)
Where ρ of the fluid density, V is the fluid velocity vector, τij is the viscous stress tensor,
p is pressure, F is the body force, e is the internal energy, Q is the heat source term, t is
time, φ is the dissipation term, and ∇.q is the heat loss by conduction.
For incompressible fluid is incompressible and the coefficient of viscosity of the fluid, µ,
as well as, coefficient of thermal conductivity are constant, the continuity, momentum,
and energy equations reduce to the following equations:

16
0 V (4)
FpVDt
DV 2
(5)
3.6.2. Interface Tracking Method : Volume of Fluid (VOF)
Volume-of-Fluid is a numerical technique used for tracking and locating the free surface
or any fluid-fluid interface. It belongs to the class of Eulerian Methods which are
characterized by a mesh that is either stationary moving in a certain prescribed manner to
accommodate the evolving shape of the interface. Known for its ability to conserve the
mass of traced fluid and when fluid interface changes its topology, this change is traced
easily, so the interfaces can join or break apart. The main concept used in VOF is by
using fraction function, γ.
γ is defined as the integral of fluid’s characteristics function in the control volume or the
volume of a computational grid cell.
• When the cell is empty, value of γ would be 0.
• Cell is full; γ =1
• Then the cell consists of fluid-fluid interface, then 0< γ <1
γ is a discontinuous function, its value jumps from 0 to 1 when the argument moves into
interior of traced phase. γ also is a scalar function. While the fluid moves with velocity,
every fluid particle retains its identity. When a particle is a given phase, it does not
change the phase; like a particle of air, that is a part of air bubble in water remains air
particle, regardless of the bubble movement.
In bubble/drop volume case [15], considering two phases, without mass exchange and
volume averaging the mass and momentum equations, following three cases are
encountered as Figure 3.4 below.

17
Figure 3.4 Averaging volume compared with bubble/drop volume[15].
Case 1 : The averaging picks out Phase 1
Mass Conservation
0111
ut
(6)
Momentum Balance
gTuut
u11111
11
(7)
Case 2 : The averaging picks out Phase 2
Mass Conservation
0222
ut
(8)
Momentum Balance
gTuut
u22222
22
(9)
Average Volume
Case 1: Phase 1(γ=1)
Case 2: Phase 2(γ=0)
Case 3: Phase 3(0<γ<1)

18
Case 3 : The averaging picks out a piece of the interface and both the phases
Mass Conservation
0221
ut
(10)
0)1()1(
222
ut
(11)
Momentum Balance
IAI
I
dAnTV
gTuut
u12111111
11 1
(12)
222
22 )1()1(
uut
u
IA
II
dAnTV
gT 212221
)1()1( (13)
3.7. Validation Case I: Bubble bursting phenomenon in Gas/Metal/Slag systems
In Bubble Bursting Phenomenon in Gas/Metal/Slag Systems [2], bubble bursting
phenomenon had been studied at the surface of molten iron. The main objective of [2] is
to study the relationship between surface tension and parent bubble diameter with the
mass of ejection from bubble bursting.
3.7.1. Solution Domain Setup
In studying bubble bursting at gas/metal/slag system, Han and Holappa have used X-ray
transmission technique as shown in Figure below. The system consists of vertical
electrical resistant furnace, X-ray imaging system and a gas supply and control system.

19
1 Furnace Shell 6 Furnace Tube
2 Ceramic Plate 7 Capillary
3 Crucible 8 Argon Gas
4 CCD Camera 9 10%H2 + 90% Ar gas
5 Refractory Insulation
Figure 3.5 Experimental setup for Bubble Bursting Phenomenon in Gas/Metal/Slag
System[2].
The images produced by X-ray receiver are captured by a high-resolution CCD camera
(Hamamatsu-54505-01) with resolution of 360x575 and the images are recorded in
cassette. Bubble bursting occurs in crucible with inner diameter of 30mm and height of
50mm, where in this crucible places 150-g electrolytic iron and alumina plate to collect
ejected droplets.
20
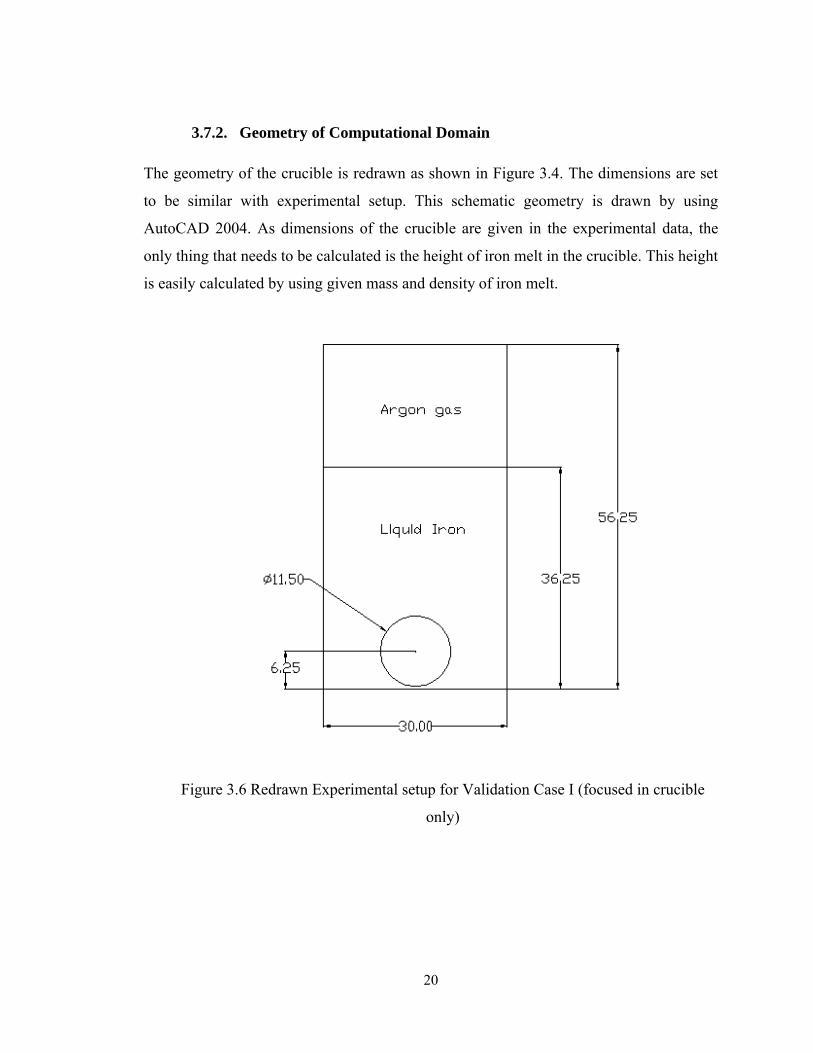
3.7.2. Geometry of Computational Domain
The geometry of the crucible is redrawn as shown in Figure 3.4. The dimensions are set
to be similar with experimental setup. This schematic geometry is drawn by using
AutoCAD 2004. As dimensions of the crucible are given in the experimental data, the
only thing that needs to be calculated is the height of iron melt in the crucible. This height
is easily calculated by using given mass and density of iron melt.
Figure 3.6 Redrawn Experimental setup for Validation Case I (focused in crucible
only)

21
Table 3.1 Geometric Configuration of the Computational Domain for Case I
Argon Bubble Diameter 11.5 mm
Crucible
Inner Diameter 30 mm
Height 50 mm
Mass of Electrolytic iron 150 g
Density of Electrolytic Iron 7.1 g/cm3
Height of Electrolytic Iron in Crucible 30 mm
Surface Tension 1.2 N/m2
Total Number of Cells 260325
3.7.3. Model and Numerical Background
Simulations were run on a Hewlett-Packard HP xw8400 Workstation with 8.00 GB
of RAM by using a chosen CFD package, FLUENT 12.0. This simulation was taken
place in 3D space instead of axisymmetric as bubble shape cannot be assumed to be
uniform in all axes throughout the time. The solver had been set to be in Pressure-Based
as momentum and pressure were going to be the primary variables. Transient or Unsteady
time was aligned with real case situation where the process taken place in the experiment
was not stable with time. Table 3.2 below summarizes the settings that have been set up
in defining the solver.
Table 3.2 Solver Settings used in Validation Case I Simulation
Model Setting
Solver Pressure Based
Formulation Implicit
Space 3D
Time Unsteady
Velocity Formulation Absolute
Gradient Option Green-Gauss Cell Based

22
For simulations of fluid-fluid interface using a finite volume approach with
existence of breakup of interface surface, Volume of Fluid (VOF) Model is very suitable
as VOF allows mass conservation [15]. Table 3.3 below summarizes the settings needed
for multiphase model.
Table 3.3 Multiphase Settings used in Validation Case I Simulation
Multiphase Model
Model Volume of Fluid
Number of Phases 2
VOF Scheme Explicit
Courant Number 0.25
Open Channel Flow Disable
Implicit Body Force Disable
This simulation is set to cover the bubble bursting phenomenon for approximately
0.01 real seconds as bubble bursting phenomenon is a very quick process as break up of
bubble cap is expected to be about 0.05 real seconds [16]. Table 3.4 below summarizes
the settings that are being used in time step solver.
Table 3.4 Time Solver Setting for Validation Case I Simulation
Iterate : TimeTime Step Size 0.0001sNumber of Time Steps 100Time Stepping Method FixedMax Iterations per Time Step 100
Autosave DataData FileEvery 10 time steps

23
Generally, simulation settings for all three validation cases are expected to be
similar except in Material Selections, Computational Domain and Dimensions and
Physical Properties such as Surface Tension and Viscosity.
3.8. Validation Case II: Dust formation in Electric Arc Furnace
Dust Formation in Electric Arc Furnace [1] is quite similar to be compared with Bubble
Bursting Phenomenon in Gas/Metal/Slag System [2]. Their obvious difference is
regarding the dimensions of the crucible and size of parent bubble.
3.8.1. Experimental and Simulation Setup
The original experimental setup consist a vacuum induction melting furnace which
had been modified to operate at atmospheric pressure under an argon atmosphere (refer to
Figure 3.5). The difference between this case and the previous case mainly are on the the
dimensions of the equipments and the initial size of the bubble.
Figure 3.7 Experimental Setup done by Guezennec et. al.[1]

24
3.8.2. Geometry and Grid
For this case, the focus is inside the crucible which contains 750g of commercial
steel grade. This crucible is in 45mm inside diameter and 70mm height and the geometry
of the crucible is redrawn as shown in Figure 3.8. The dimensions are set to be similar
with experimental setup. This schematic geometry is drawn by using AutoCAD 2004. As
dimensions of the crucible are given in the experimental
Figure 3.8 shows the location of bubble which is located at the bottom of the
crucible. In this example, the diameter of bubble is 7 mm. Depending on different cases,
the diameter of bubble is changing.
Figure 3.8 Details on crucible used by Guezzenec et al. [1]
3.8.3. Model and Numerical Background
Simulations were run on a Hewlett-Packard HP xw8400 Workstation with 8.00 GB
of RAM by using a chosen CFD package, FLUENT 12.0. This simulation was taken
place in 3D space instead of axisymmetric as bubble shape is not uniform throughout the
time. The solver had been set to be in Pressure-Based as momentum and pressure were

25
going to be the primary variables. Transient or Unsteady time was aligned with real case
situation where the process taken place in the experiment was not stable with time. The
basic simulation settings are set similar to Validation Case I. Based on same materials,
the surface tension also is kept same with Validation Case I. Validation Case II is
different in terms of size of bubble and dimensions of crucible.
3.9. Validation Case III: Production of Water Drops and Corona due to Rupture of
Air Bubbles at Water Surface under a Positive DC Electric Field
In Case III [9], the study is regarding bubble bursting phenomenon at water surface under
a positive DC electric field. However, there is an earlier part where Sugimoto and
Higayashima run the case without electric field. This part has been chosen to be a
validation case to be compared with simulation results.
3.9.1. Experimental and Simulation Setup
The original experimental setup consist a water vessel containing tap water which is
surrounded with thermal insulation. Air bubbles are produced from silicon tube which is
having diameter of 0.4 mm. The dimension of the water vessel is 100mm x 100mm x
100mm. Relatively to bubble diameter of 2.8 mm, the dimension of the water vessel is
considered large and reconstructing the large domain in the simulator will require high
computational cost and longer time to solve. It is then decided for Case III to have the
same geometrical domain except the initial bubble size.
3.9.2. Model and Numerical Background
The model and numerical background for Validation Case III is set to be similar with
Case I and Case III.

26
t = 0.1s
CHAPTER 4: RESULTS AND DISCUSSIONS
4.1. Bubble Bursting Phenomenon
To capture bubble bursting phenomenon by using CFD is one of the main objectives of
this project. Based on the collected result, it can be seen that bubble bursting
phenomenon that is captured by using FLUENT 12.0 is quite similar with the literature
review. In describing the phenomenon of bubble bursting, below case is for bubble
diameter of 11.5 mm and 0.5 N/m2 of surface tension. Details are explained in paragraph
below. Bubble bursting phenomenon is divided into two main events which are bubble
film breakage and liquid jet production.
4.1.1. Bubble Film Breakage
As the bubble rises from liquid and meets the surface, it curves the surface for a
hemisphere-looked like shape (refer Figure 4.1). The liquid film forms and separates the
bubble from the atmosphere. In simulation, the rising of bubble from the bottom of the
tank is calculated with step size of 0.001s. It appears the time taken for the bubble to
arrive at the surface which located 30mm from the initial point of the bubble, is
approximately 0.1s.
Figure 4.1 Bubble at liquid surface before burst

Having its equilibrium position, the bubble can rest for a certain period of time
while the liquid film is drained until the film reaches its critical thickness
The equilibrium position of the bubble at atmosphere had been studied by Georgescu
During its equilibrium position, the liquid
eventually. The film is thin enough for inter
rapidly ruptures. The film rupture begins from one point which looked like a hole. This
point can be anywhere on the bubb
Figure
It can be observed above that one point of breakage exists on the bubble cap,
merely at the center of the cap on 0.10025
having its liquid film drained until its critica
bubble reaches the surface. In order to justify other phenomenon occur in bubble
bursting, this point is taken as a reference
point of hole occur on bubble cap.
t = 0.1001s
27
Having its equilibrium position, the bubble can rest for a certain period of time
while the liquid film is drained until the film reaches its critical thickness
The equilibrium position of the bubble at atmosphere had been studied by Georgescu
During its equilibrium position, the liquid film is drained and the film becomes thin
eventually. The film is thin enough for inter-molecular forces to take over before the film
rapidly ruptures. The film rupture begins from one point which looked like a hole. This
point can be anywhere on the bubble cap.
Figure 4.2 Single point breaks on bubble cap
It can be observed above that one point of breakage exists on the bubble cap,
t the center of the cap on 0.10025s. It means, the bubble rests on the surface,
having its liquid film drained until its critical thickness and start to burst 0.25
bubble reaches the surface. In order to justify other phenomenon occur in bubble
bursting, this point is taken as a reference point. Bubble burst is started when the single
point of hole occur on bubble cap.
t = 0.1001s t = 0.1002s
t = 0.10030st = 0.10025s
Having its equilibrium position, the bubble can rest for a certain period of time
while the liquid film is drained until the film reaches its critical thickness before it bursts.
The equilibrium position of the bubble at atmosphere had been studied by Georgescu[13].
film is drained and the film becomes thin
molecular forces to take over before the film
rapidly ruptures. The film rupture begins from one point which looked like a hole. This
It can be observed above that one point of breakage exists on the bubble cap,
the bubble rests on the surface,
l thickness and start to burst 0.25 ms after the
bubble reaches the surface. In order to justify other phenomenon occur in bubble
point. Bubble burst is started when the single

To compare with existing literature review, Guezennec et. al
bubble film disintegration is started with formation of a hole on th
after the bubble reach its equilibrium position on liquid surface.
Figure 4.3 Formation of hole during bubble film breakage
From this point, the hole widens or can be known as disintegration of bubble c
into fine droplets or film drops, until the film disappeared. Studies had been conducted
extensively regarding the relationship between number and size of film drops depending
on size of parent bubble.
t = 0.101s
28
To compare with existing literature review, Guezennec et. al [1]
bubble film disintegration is started with formation of a hole on the bubble film at 0.2ms
after the bubble reach its equilibrium position on liquid surface.
Figure 4.3 Formation of hole during bubble film breakage
From this point, the hole widens or can be known as disintegration of bubble c
into fine droplets or film drops, until the film disappeared. Studies had been conducted
extensively regarding the relationship between number and size of film drops depending
Figure 4.4 Disintegration of bubble cap
t = 0.102s
[1] had shown that
e bubble film at 0.2ms
Figure 4.3 Formation of hole during bubble film breakage[1]
From this point, the hole widens or can be known as disintegration of bubble cap
into fine droplets or film drops, until the film disappeared. Studies had been conducted
extensively regarding the relationship between number and size of film drops depending
t = 0.103s

29
Figure 4.4 shows how the initial hole that exists on the cap widens and it took
approximately 0.002 sec for the cap to completely disappear.
The expectation of bubble film disintegration is the formation of film droplets. These
droplets’ size range up from few micron to 500µm[2]. In this simulation, the results do
not show any formation of bubble film droplets. This might be due to coarse mesh that
does not fine enough to capture fine droplets.
4.1.2. Liquid Jet Production
After the disruption of bubble cap, there is cavity remaining at the liquid surface which
tends to close up and creating an upward liquid jet (refer Figure 4.5).
Figure 4.5 Liquid surface tends to close up to produce liquid jet
t = 0.108s

30
Figure 4.6 Liquid Jet Production
From Figure 4.6, it can be seen that liquid jet is produced with height of 16 mm from the
liquid surface. Liquid jet that produced is unstable and can disintegrate to produce
droplets. This result is expected to produce jet droplets that could be disintegrated from
the liquid jet. However, there is none droplets that can be seen. This result might be due
to coarse mesh or the bubble diameter is larger than critical bubble diameter in iron/argon
system that is yet to be determined.
Jet production is influenced by the size of bubble. In explaining the effect of bubble
size to jet production, bubble size is divided into two kinds; bigger than critical size, and
smaller than critical size. For a bubble with critical size, the submerged and protruding
portion is equally distributed, forming an almost hemispherical shape of the submerged
portion. For bubble which sized smaller than the critical size, the protruding smaller is
smaller than the submerged, where the center of curvature of bubble cavity is below the
free surface. While for bigger bubble, the submerged is smaller compared to the
protruding portion. The deeper the centre of curvature of bubble, the harder the energetic
jet will be. This would explain about no jet droplets will be produced for bubble bigger
than critical size.
t = 0.129st = 0.109s t = 0.119s

31
4.1.3. Comparison with Literature Review
This comparison is made focusing only on bubble bursting phenomenon. Figure 4.5
below is the results that are gathered by Sugimoto and Higayashima in their paper[9].
Figure 4.7 Bubble bursting phenomenon captured by Sugimoto and Higayashima
In Figure 4.7, it can be seen that 0 ms is when the bubble reaches its equilibrium
position at the surface. After the bubble reaches the surface, the bubble cap disappear,
leaving a bubble cavity that is tend to close up and producing liquid jet. The series of
events can be captured by using FLUENT 12.0. Sugimoto and Higayashima do not show
any formation of film droplets but jet droplets are visible to see. However, bubble that is
used by Sugimoto and Higayashima is different with bubble in simulation. This
comparison is made to see only on bubble bursting phenomenon. Thus, bubble bursting
phenomenon is similar for all size of bubble. As the ejection of jet droplets is depending
on the parent bubble size, thus, the results of no jet droplets can be due to coarse mesh or
large bubble size.
4.2. Effect of Initial Bubble Diameter to Bubble Bursting
In order to observe the effect of initial bubble diameter on bubble bursting
phenomenon, the case is run for two different sizes of bubble diameter which are 9.3 mm
and 11.5 mm. The surface tension is held constant at 1.2 N/m. Figure 4.8 below shows
the comparison on the initial condition of both cases.

9.3
Figure 4.8 Initial condition for 9.3 mm and 11.5 mm diameter of bubble
It can be seen that the path for bubble to rise
comparison, observations are
bubble to reach the surface, bubble cap completely disappear and highest liquid jet
production are shown in Figure 4.9, 4.10 and 4.11,
9.3
Figure 4.9 Time for bubble reaches the surface for different bubble size
32
Initial Bubble Diameter at t = 0 s
9.3 mm 11.5 mm
Figure 4.8 Initial condition for 9.3 mm and 11.5 mm diameter of bubble
It can be seen that the path for bubble to rise and reach the surface is the same.
s are made at every main events. Position and time for each
bubble to reach the surface, bubble cap completely disappear and highest liquid jet
production are shown in Figure 4.9, 4.10 and 4.11, respectively.
Initial Bubble Diameter
9.3 mm 11.5 mm
Figure 4.9 Time for bubble reaches the surface for different bubble size
t = 0.100s t = 0.090s
mm
Figure 4.8 Initial condition for 9.3 mm and 11.5 mm diameter of bubble
the surface is the same. For
made at every main events. Position and time for each
bubble to reach the surface, bubble cap completely disappear and highest liquid jet
mm
Figure 4.9 Time for bubble reaches the surface for different bubble size
t = 0.090s

9.3
Figure 4.10 Time for bubble cap to completely disappear for different bubble size
9.3
Figure 4.1
From Figure 4.9, bubble with 11.5 mm of diameter
smaller one and this indicates that bigger bubble rises faster than small bubble.
to Krishna and colleagues
relation with some introduction of scale factor, SF (refer Equation 14).
33
Initial Bubble Diameter
9.3 mm 11.5 mm
for bubble cap to completely disappear for different bubble size
Initial Bubble Diameter
9.3 mm 11.5 mm
Figure 4.11 Time for highest liquid jet for different bubble size
From Figure 4.9, bubble with 11.5 mm of diameter reaches the surface before the
smaller one and this indicates that bigger bubble rises faster than small bubble.
to Krishna and colleagues [17] rise velocity of bubbles is describe by Davies
relation with some introduction of scale factor, SF (refer Equation 14).
t = 0.109s t = 0.100s
t = 0.126s t = 0.129s
mm
for bubble cap to completely disappear for different bubble size
mm
for different bubble size
reaches the surface before the
smaller one and this indicates that bigger bubble rises faster than small bubble. According
s describe by Davies –Taylor
t = 0.100s
t = 0.129s

34
= 0.71 ( ) (14)
Scale factor which is derived by Collins[18] is depending on the range of the ratio
of bubble’s diameter to column’s diameter. As in this case, the scale factor is the same as
they lay within the same range. Based on Equation 14, the relation between bubble rise
velocity and bubble’s diameter is directly proportional, thus drawing a conclusion on
larger bubble rise faster than small bubble like shown in Figure 4.9.
In Figure 4.10, bubble with 9.3 mm of diameter needs 9 ms for its film to
completely disappear. While bubble with 11.5 mm of diameter needs 10 ms. It also can
be observed that the bubble cavity is larger for larger bubble. This different in cavity size
is the main reason for difference in liquid jet. As it can be seen in Figure 4.11, liquid jet
produced by bubble with 11.5 mm of diameter is higher than 9.3 mm. The height of
liquid jet is depending on the area of bubble cavity as the bigger area of bubble cavityAs
no droplet can be found in both cases, thus no conclusion can be made to direct relate
between bubble size and formation of droplets.

35
CHAPTER 5: CONCLUSIONS
Bubble bursting phenomenon that is captured by using FLUENT 12.0 in this study is
similar compare to results that are gathered from existing experimental data. Simulation
on bubble bursting has been done to see the relationship between bubble bursting
phenomenon with bubble diameter and surface tension. For bubble diameter, the
simulation has been done on two different bubble diameters which are 9.3 mm and 11.5
mm, while surface tensions are determined to be 1.2 N/m and 1.4 N/m. These values are
determined from the validation cases that are used for comparison. Bubble bursting
phenomenon that are captured are similar for each different case. It can be seen generally
Bubble bursting phenomenon consists of series of main events which are formation one
single hole on bubble film, bubble film breakage and liquid jet production. All of these
events can be captured by using FLUENT 12.0 and agree with literature review.
However, film droplets and jet droplets that are expected to form cannot be seen in all the
cases making it difficult to distinguish the difference on the effects of the key parameters.
This is expected due to coarse meshes that are not fine enough to capture the droplets.
Finer mesh is highly recommended in order to capture the droplets.

36
REFERENCES
1. Guézennec, A.-G., et al., (2005). Dust formation in Electric Arc Furnace: Birth of
the particles, Powder Technology, 157,1-3, pp. 2-11.
2. Han, Z. and L. Holappa, (2003). Bubble bursting phenomenon in Gas/Metal/Slag
systems, Metallurgical and Materials Transactions B, 34,5, pp. 525-532.
3. R. Tsujino, M.H., T. Ohno, N. Ishiwata and T.Inoshita, (1898). Mechanism of
Dust Generation in a Converter with Minimum Slag, The Iron and Steel Institute
of Japan, 29,4, pp. 291-99.
4. Kuo, H.-W., J.-S. Lai, and T.-I. Lin, (1997). Nasal septum lesions and lung
function in workers exposed to chromic acid in electroplating factories,
International Archives of Occupational and Environmental Health, 70,4, pp. 272-
276.
5. Howell, P.D., (1999). The draining of a two-dimensional bubble, Journal of
Engineering Mathematics, 35, pp. 251-272.
6. Dey, D., Boulton-Stone, J. M., Emery, A. N., and Blake, J. R., (1997).
Experimental comparisons with a numerical model of surfactant effects on the
burst of a single bubble, Chemical Engineering Science, 52,16, pp. 2769-2783.
7. Reinke, N., Voßnacke, A., Schütz, W., Koch, M. K., and Unger, H., (2001).
Aerosol Generation by Bubble Collapse at Ocean Surfaces, Water, Air, & Soil
Pollution: Focus, 1,5, pp. 333-340.
8. A. G. Guézennec, J.C.H., F. Patisson, Ph. Sessiecq, J. P. Birat And D. Ablitzer,
(2004). Dust Formation by Bubble-burst Phenomenon at the Surface of a Liquid
Steel Bath.
9. Higashiyama, T.S.a.Y., (2001). Production of water drops and corona due to
rupture of air bubbles at water surface under a positive dc electric field, Journal of
Electrostatics, 53, pp. 209–219.
10. Günther, A., S. Wälchli, and P.R. von Rohr, (2003). Droplet production from
disintegrating bubbles at water surfaces. Single vs. multiple bubbles, International
Journal of Multiphase Flow, 29,5, pp. 795-811.

37
11. Boulton-Stone, J.M. and J.R. Blake, (1993). Gas bubbles bursting at a free
surface, Journal of Fluid Mechanics Digital Archive, 254,-1, pp. 437-466.
12. Sussman, M., et al., (1998). An improved level set method for incompressible
two-phase flows, Computers & Fluids, 27,5-6, pp. 663-680.
13. Georgescu, S.-C., J.-L. Achard, and É. Canot, (2002). Jet drops ejection in
bursting gas bubble processes, European Journal of Mechanics - B/Fluids, 21,2,
pp. 265-280.
14. Mostaghimi, N.A.J., An Introduction to Computational Fluid Dynamics, in Fluid
Flow Handbook.
15. Vinay R. Gopala, B.G.M.v.W., (2008). Volume of fluid methods for immiscible-
fluid and free-surface flows, Chemical Engineering Journal 141, pp. 204–221.
16. Johnston, H. Bursting Bubbles Cascade on Camera. 2010; Available from:
http://physicsworld.com/cws/article/news/42898.
17. Krishna, R., et al., (1999). Rise velocity of a swarm of large gas bubbles in
liquids, Chemical Engineering Science, 54,2, pp. 171-183.
18. Collins, R., (1967). The effect of a containing cylindrical boundary on the
velocity of a large gas bubble in a liquid, Journal of Fluid Mechanics,28, pp. 97-
112.