freedom foods group limited for personal use only - asx · important information 2 this...
TRANSCRIPT

Freedom Foods Group Limited
Managing Director & CEO Presentation
Half Year Results FY 2017
For
per
sona
l use
onl
y
Important Information
2
This presentation is provided for information purposes only. The information contained in this presentation is not intended to be relied upon as advice to investors and does not take into account the investment objectives, financial situation or needs of anyparticular investor. Investors should assess their own individual financial circumstances and consider talking to a financial adviser or consultant before making any investment decision.
Certain statements in this presentation constitute forward looking statements. Such forward looking statements involve known and unknown risks, uncertainties, assumptions and other important factors, many of which are beyond the control of the Company and which may cause actual results, performance or achievements to differ materially from those expressed or implied by such statements.
While all reasonable care has been taken in relation to the preparation of this presentation, none of the Company, its subsidiaries, or their respective directors, officers, employees, contractors or agents accepts responsibility for any loss or damage resulting from the use of or reliance on the presentation by any person.
Past performance is not indicative of future performance and no guarantee of future returns is implied or given. Some of the information in this presentation is based on unaudited financial data which may be subject to change. All values are expressed in Australian currency unless otherwise stated.
All intellectual property, proprietary and other rights and interests in this presentation are owned by the Company.
For
per
sona
l use
onl
y

Half Year FY 2017 Results Overview
3
For
per
sona
l use
onl
y
Our Company
4
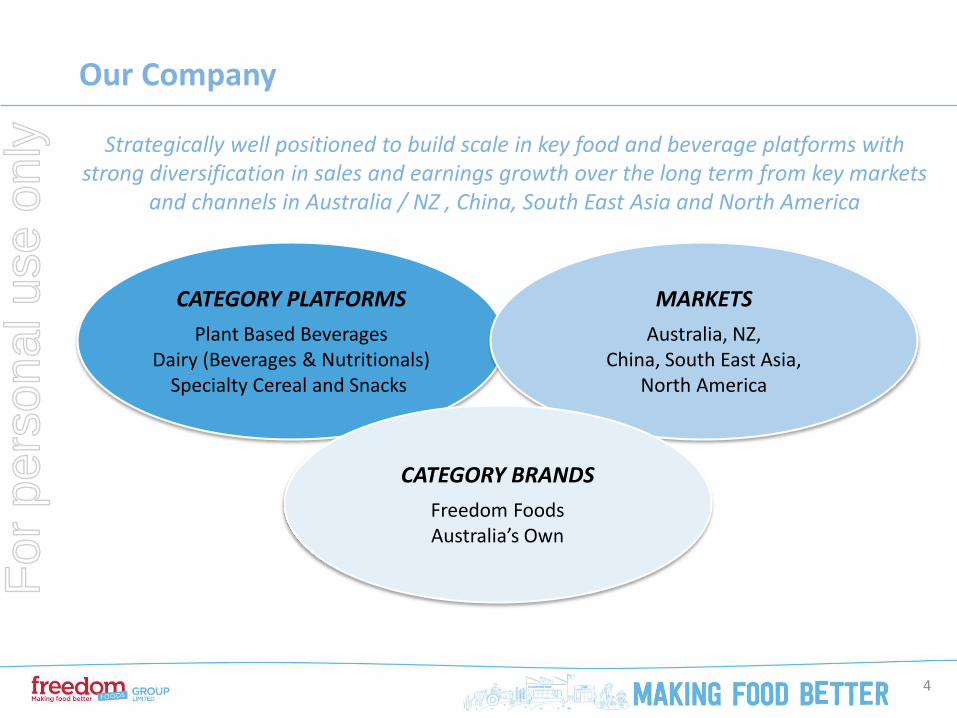
Strategically well positioned to build scale in key food and beverage platforms with strong diversification in sales and earnings growth over the long term from key markets
and channels in Australia / NZ , China, South East Asia and North America
CATEGORY PLATFORMS
Plant Based BeveragesDairy (Beverages & Nutritionals)
Specialty Cereal and Snacks
MARKETS
Australia, NZ,China, South East Asia,
North America
CATEGORY BRANDS
Freedom FoodsAustralia’s Own
For
per
sona
l use
onl
y
1st Half FY 2017 Results Overview
5
A successful 6 month period investing in the Company’s capabilities to deliver profitable growth consistent with its medium term plan, with reported net sales growth of 129%, reflecting:
• Strong organic sales growth across all key category platforms in Australia/NZ, China, South East Asia and North America;
• Strong growth in new value added Cereal and Snacks and Plant Based Beverages, including branded and non-branded sales in the growing Almond and value added plant milk categories;
• Strong sales growth in new channels including Food Services in Australia and into South East Asia with plant milks and oat based cereals;
• Acceleration of growth in sales dairy beverages, including our Australia’s Own Kid’s Milk in China, with the brand now the leading imported Kid’s Milk brand in China where distributed;
• Full 6 month sales and profit contribution from Darlington Point Mill, Dandenong cereal and bar operations and Shepparton Dairy Beverage operations;
• Development of a strong pipeline of product innovation leading to further sales growth into calendar 2017; and
• Net sales growth (adjusted for the impact of acquisitions from comparable periods) was 30.2% on the prior year period
• Excluding Shepparton operations, net sales growth was 17.3%For
per
sona
l use
onl
y

1st Half FY 2017 Results Overview (cont’d)
6
• Execution of significant capital expenditure projects across the Group, including the nearly completed state-of-the-art UHT plant and dairy milk processing facility at Ingleburn in South West Sydney to drive material ongoing earnings benefits over the medium term
• Strong growth in dairy beverage sales, with a significant turnaround in contribution from the Dairy operations at Shepparton, reflecting new contracts and increasing demand in Australia, China and South East Asia. The business was consolidated from 1 January 2016, following the Company converting its notes into shares
• As a critical part of our long term dairy milk supply strategy, Australian Fresh Milk Holdings (AFMH), expanded what is Australia’s largest single-site dairy operation from 3,500 to 5,500 milking cows. The business is profitable, is improving its profitability in line with its medium term plans and made a contribution to earnings in the period
• Successful capital raising initiatives including an entitlements issue and placement in December 2016 to existing and new shareholders raising $75 million. The funds raised from the capital raising are being utilised in the funding of the Company’s growth strategy including the acquisition of Australian Consolidated Milk’s 50% interest in Pactum Dairy Group and other proposed acquisitions and investments as well as providing the Company with additional balance sheet flexibility for future growth opportunities
For
per
sona
l use
onl
y

Operating EBITDA (Underlying vs Statutory)
7
• Operating EBDITA of $13 million (72% increase) reflecting:
- Increased contribution from Cereal and Snacks operations;
- Increased demand for Plant Based Beverages;
- Full 6 months contribution from Dandenong and Darlington Point acquisitions;
- Full 6 months contribution following consolidation of the PDG Shepparton operations; and
- Partially offset by a decrease in contribution from Specialty Seafood.
• Operating EBDITA growth (adjusted for the impact of acquisitions from comparable periods and excluding Shepparton contribution) was 29% on the prior year period
6 Months to 31st December 2016 (A$’000) 1H 2017 1H 2016
Underlying Operating EBDITA(1) 12,994 7,542
Other costs not representing underlying performance(2) (309) (2,415)
Employee Share Option Expense (non cash) (224) (180)
Statutory EBDITA(1)(3) 12,461 4,947
the directors as the primary measures of assessing the financial performance of the Group and individual segments.2) 2016 other costs comprise once off acquisition costs, unrealised foreign exchange loss and a workers compensation settlement from a 2015 incident.3) 2015 Statutory EBDITA excludes gains from a2MC investment disposal.
Note: 1) Operating EBDITA is a non-IFRS measure as contemplated in ASIC Regulatory Guide 230 Disclosing non-IFRS financial information (RG230). Operating EBDITA is used by management and
For
per
sona
l use
onl
y

Significant Investment in Food & Beverage Manufacturing Capability
8
For
per
sona
l use
onl
y
Significant and Unique Manufacturing Capabilities
9
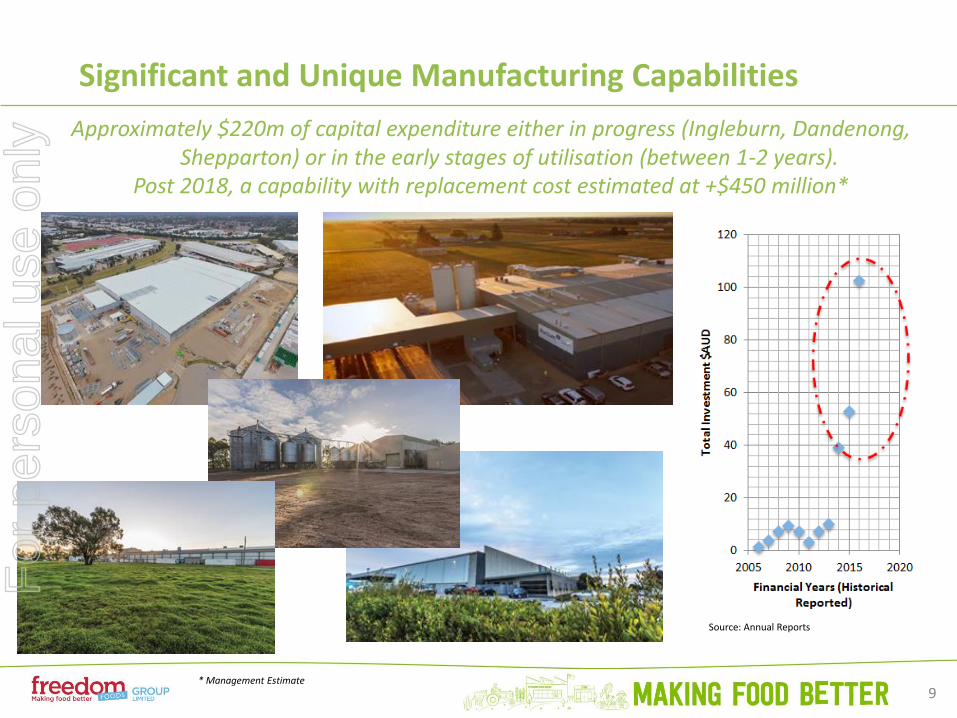
Post 2018, a capability with replacement cost estimated at +$450 million*
* Management Estimate
Source: Annual Reports
Approximately $220m of capital expenditure either in progress (Ingleburn, Dandenong, Shepparton) or in the early stages of utilisation (between 1-2 years).
For
per
sona
l use
onl
y

INGLEBURNSouth West Sydney
10
For
per
sona
l use
onl
y

Progress of New UHT Facility at Ingleburn
11
• State-of-the art UHT facility for manufacturing of:
- Plant based beverages
- Premium Milk beverages
• Current: Installed capacity for up to 180m litres per annum
- Traditional “Tetra” Carton Board packaging formats
- New UHT and ESL Plastic Bottle Packaging Capability (Oct 2017)
- Lower cost, efficiency and integrated warehouse and distribution
• Future: Infrastructure to provide for 300m litres capacity
• Apr 2017: Commissioning and products starting to come on-stream
• Sep 2017: 100% of production transferred from Taren Point site
Largest Investor in UHT Technology and Capacity in Australia
For
per
sona
l use
onl
y

12
Progress of New UHT Facility at Ingleburn (cont’d)
External infrastructure almost complete
For
per
sona
l use
onl
y
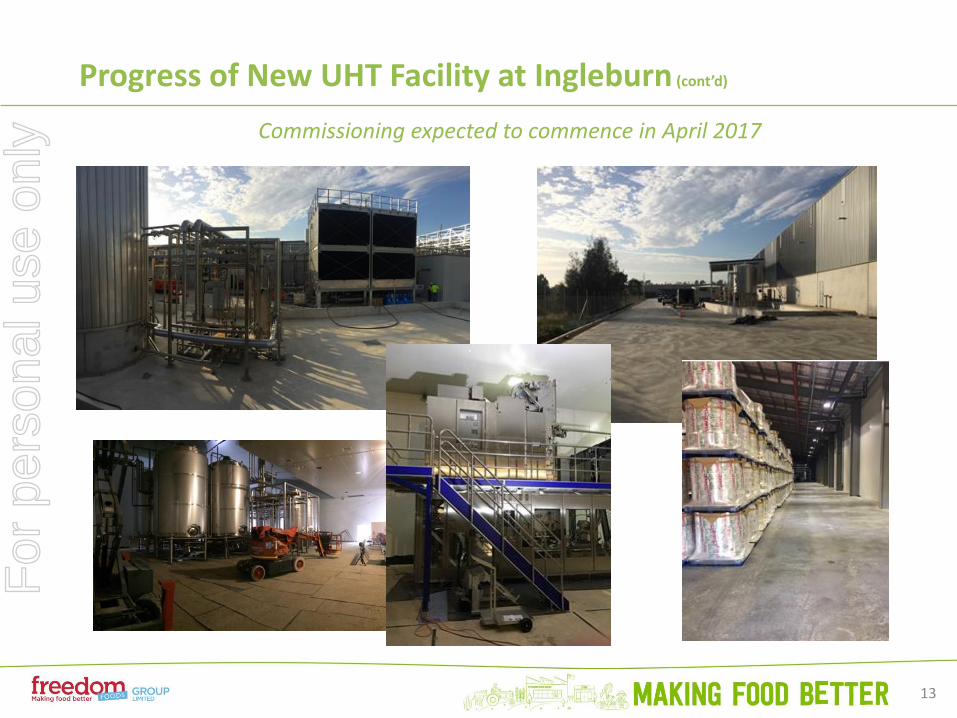
Progress of New UHT Facility at Ingleburn (cont’d)
13
Commissioning expected to commence in April 2017
For
per
sona
l use
onl
y

SHEPPARTONVictoria
14
For
per
sona
l use
onl
y

Shepparton – UHT Capability
15
Largest Investor in UHT Technology and Capacity in Australia
• Established in April 2014
• Growing demand (domestic and export) with monthly volumes averaging 8-9 million litres, with further growth into 2017
• Additional processing and packaging upgrades from 1st quarter 2017
• With large base dairy volume established, focus is on driving the business towards specialty and high value added products
- UHT Cream (whipping, pouring)
- Ambient drinking yogurt
- High protein products
For
per
sona
l use
onl
y

Shepparton – UHT Capability (cont’d)
16
For
per
sona
l use
onl
y

New UHT Capacity at Shepparton
17
New Schubert Machine
For
per
sona
l use
onl
y
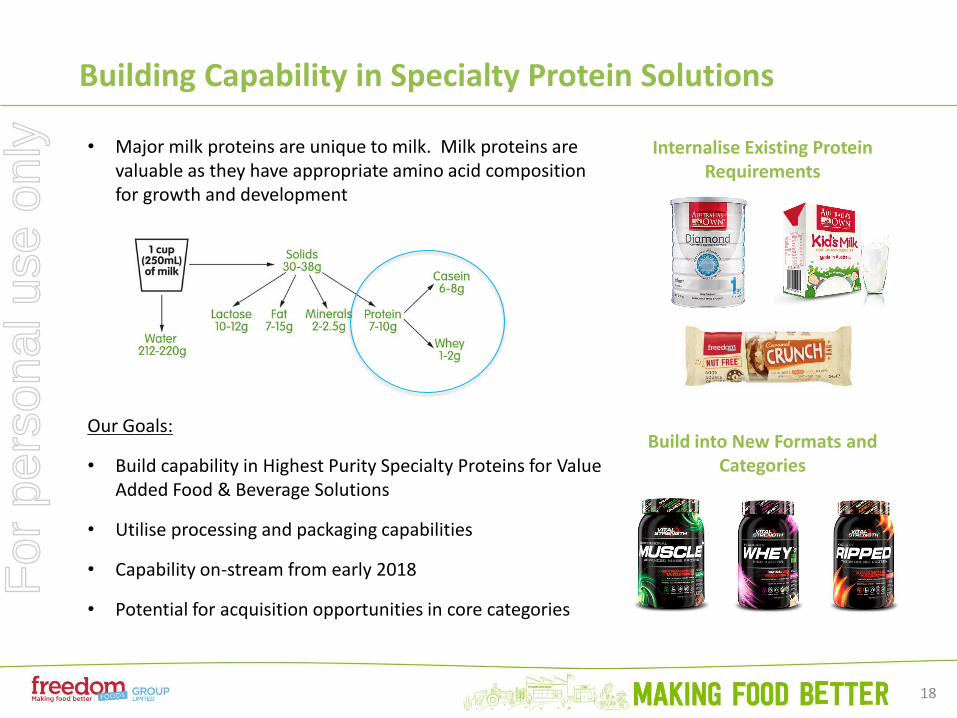
Building Capability in Specialty Protein Solutions
18
Internalise Existing Protein Requirements
Build into New Formats and Categories
Our Goals:
• Build capability in Highest Purity Specialty Proteins for Value Added Food & Beverage Solutions
• Utilise processing and packaging capabilities
• Capability on-stream from early 2018
• Potential for acquisition opportunities in core categories
• Major milk proteins are unique to milk. Milk proteins are valuable as they have appropriate amino acid composition for growth and development
For
per
sona
l use
onl
y

Additional Infrastructure at Shepparton
19
• Company now owns or leases (long term lease) all of the land and building infrastructure at the Shepparton site
• In house warehousing capacity
• Expanded facilities provide for fast tracking additional production capabilities
For
per
sona
l use
onl
y

DANDENONGSouth Melbourne
20
For
per
sona
l use
onl
y
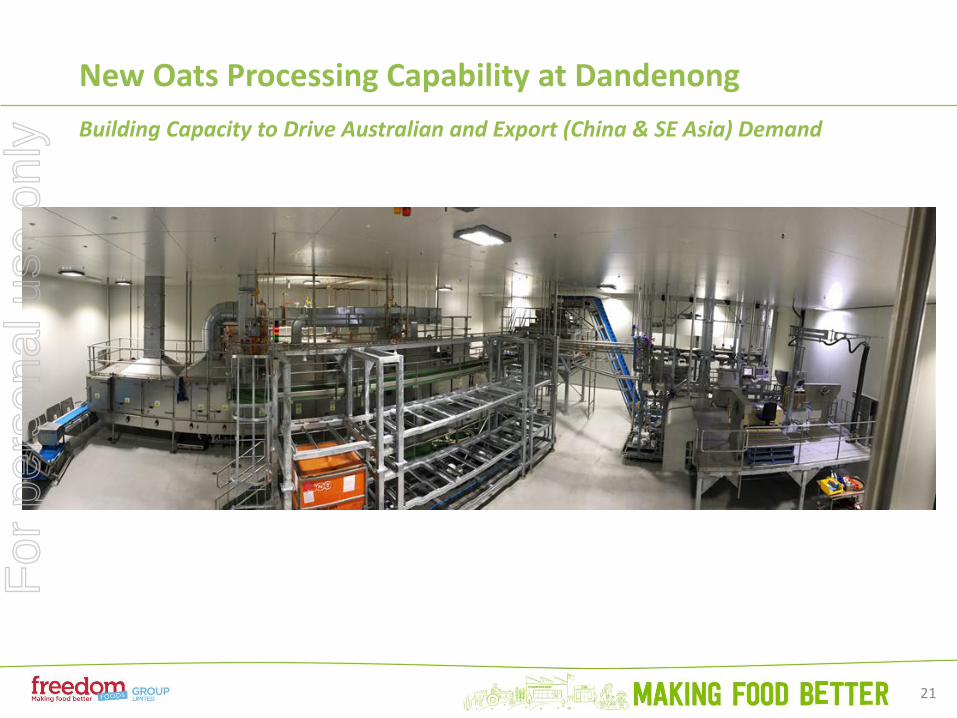
New Oats Processing Capability at Dandenong
21
Building Capacity to Drive Australian and Export (China & SE Asia) Demand
For
per
sona
l use
onl
y
DARLINGTON POINT MILLRiverina NSW
22
For
per
sona
l use
onl
y

Darlington Point Milling
23
Storage Tanks & Milling Equipment Installation
For
per
sona
l use
onl
y
POWER FOODSSydney
24
For
per
sona
l use
onl
y
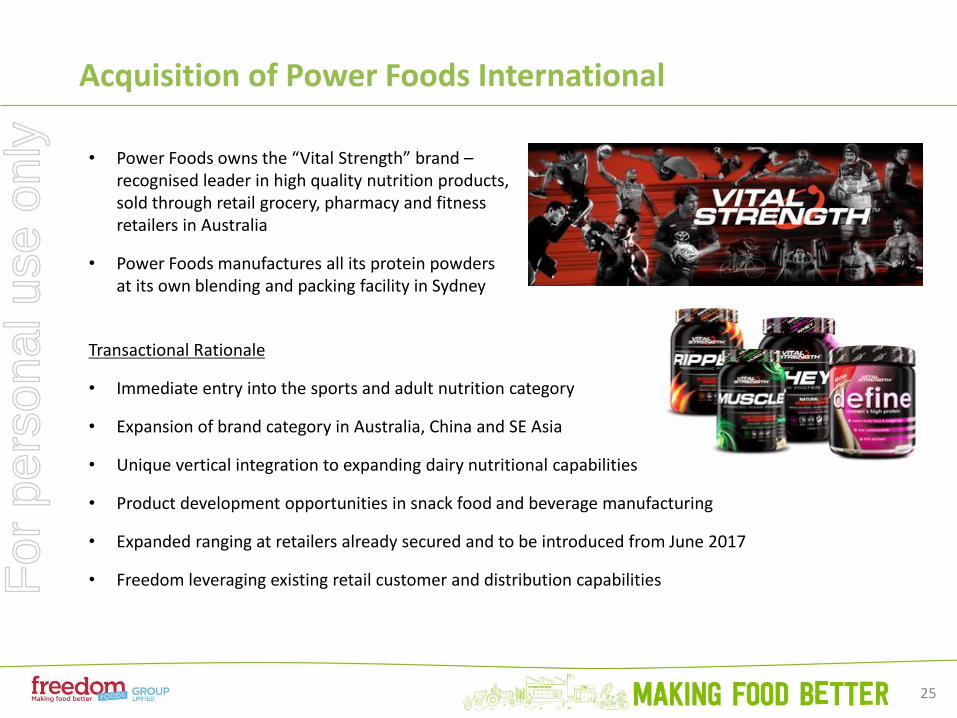
Acquisition of Power Foods International
25
• Power Foods owns the “Vital Strength” brand –recognised leader in high quality nutrition products, sold through retail grocery, pharmacy and fitness retailers in Australia
• Power Foods manufactures all its protein powders at its own blending and packing facility in Sydney
Transactional Rationale
• Immediate entry into the sports and adult nutrition category
• Expansion of brand category in Australia, China and SE Asia
• Unique vertical integration to expanding dairy nutritional capabilities
• Product development opportunities in snack food and beverage manufacturing
• Expanded ranging at retailers already secured and to be introduced from June 2017
• Freedom leveraging existing retail customer and distribution capabilitiesFor
per
sona
l use
onl
y
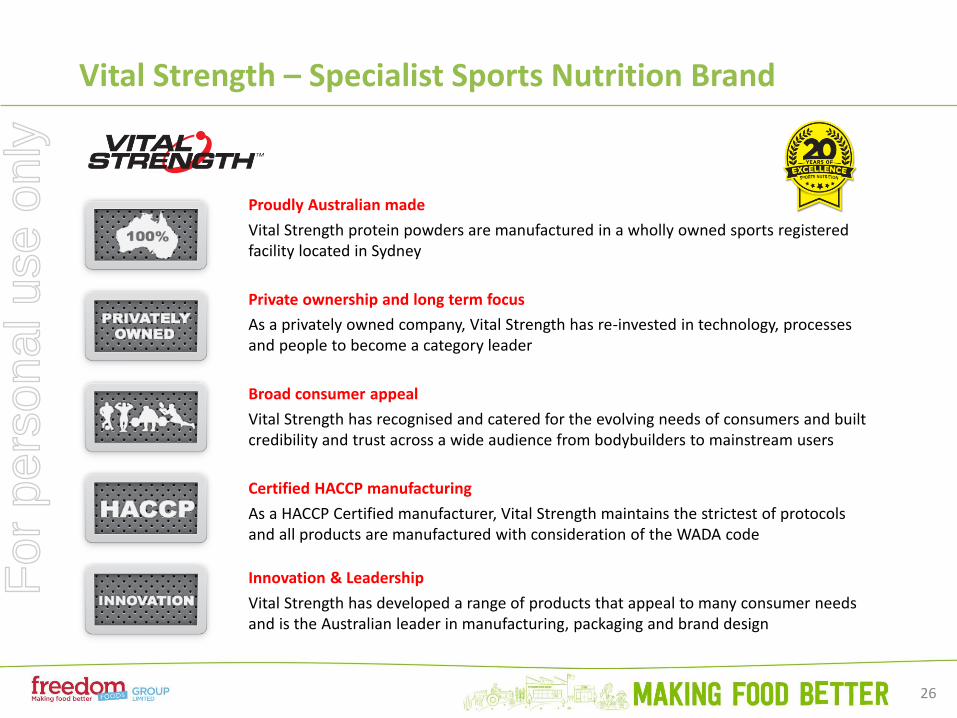
Vital Strength – Specialist Sports Nutrition Brand
26
Proudly Australian made
Vital Strength protein powders are manufactured in a wholly owned sports registeredfacility located in Sydney
Private ownership and long term focus
As a privately owned company, Vital Strength has re-invested in technology, processesand people to become a category leader
Broad consumer appeal
Vital Strength has recognised and catered for the evolving needs of consumers and built credibility and trust across a wide audience from bodybuilders to mainstream users
Certified HACCP manufacturing
As a HACCP Certified manufacturer, Vital Strength maintains the strictest of protocolsand all products are manufactured with consideration of the WADA code
Innovation & Leadership
Vital Strength has developed a range of products that appeal to many consumer needs and is the Australian leader in manufacturing, packaging and brand design
For
per
sona
l use
onl
y

Global Sports Nutrition Trends
27
Sports Nutrition in strong growth, with protein bars and RTD’s gaining share
Fitness & healthy lifestyle have become mainstream
Shoppers want easy access to quality nutritional products
#CleanEating
Sports Nutrition is driving mainstream Fitness Lifestyle Trends
For
per
sona
l use
onl
y

Building New Channels & Markets
28
For
per
sona
l use
onl
y

Strategic Platform Established
29
The Cereal, Snack and Milling business is now strategically positioned to build a significant growth platform in multiple products, channels and distribution
For
per
sona
l use
onl
y

Branded Portfolio in Australia
30
Number 1 Health Food Cereal Brand with +40% Market Share and Growing
For
per
sona
l use
onl
y

Digital Campaign delivering Strong Engagement with Target
31
For
per
sona
l use
onl
y

Execution of Dynamic & On Trend Innovation
32
+10 new products launched in FY17 in a retailer reduced range environment
New Cereal & Snacking range on shelf in Woolworths & Coles stores now
For
per
sona
l use
onl
y

Execution of Dynamic & On Trend Innovation (cont’d)
33New Cereal & Snacking range on shelf in
Woolworths & Coles stores now
For
per
sona
l use
onl
y

Execution of Dynamic & On Trend Innovation (cont’d)
34New Cereal & Snacking range on shelf in
Woolworths & Coles stores now
For
per
sona
l use
onl
y

Building Presence in Value Added Cereal in Breakfast Category
35
Leveraging Arnold’s Farm to fill a gap in the Oats & Muesli segment in the Breakfast category exclusively in Woolworths with +14% share*
Arnold’s Farm on shelf in Woolworths stores
* Aztec Scan Data, MAT 02/10/16
For
per
sona
l use
onl
y

FY 2017 Breakthrough Innovation
36
Ready for Launch into North America
For
per
sona
l use
onl
y

Food Service Offering
37
Building New Channels Through Innovation in Coffee Milk Application Strong Brand Recognition and Sales Achieved within this Higher Margin Channel
For
per
sona
l use
onl
y
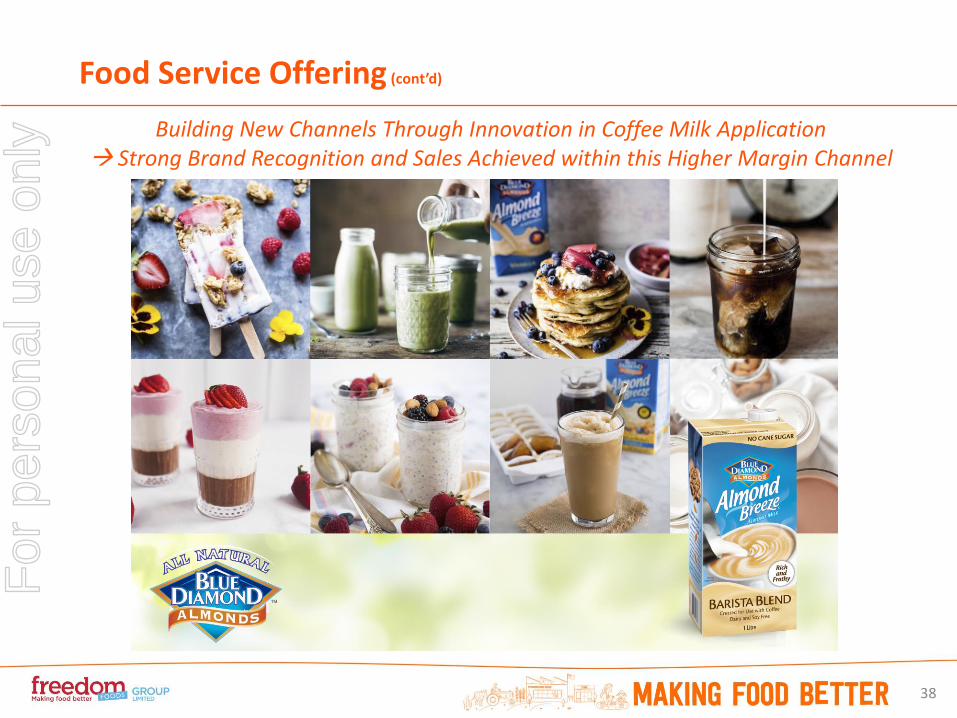
Food Service Offering (cont’d)
38
Building New Channels Through Innovation in Coffee Milk Application Strong Brand Recognition and Sales Achieved within this Higher Margin Channel
For
per
sona
l use
onl
y

Expansion of Packaging Capability to Drive Innovation
39
Expanding Plant Based Beverages into the chiller for increased convenience & to directly compete with Dairy
In Woolworths stores November 2017
For
per
sona
l use
onl
y
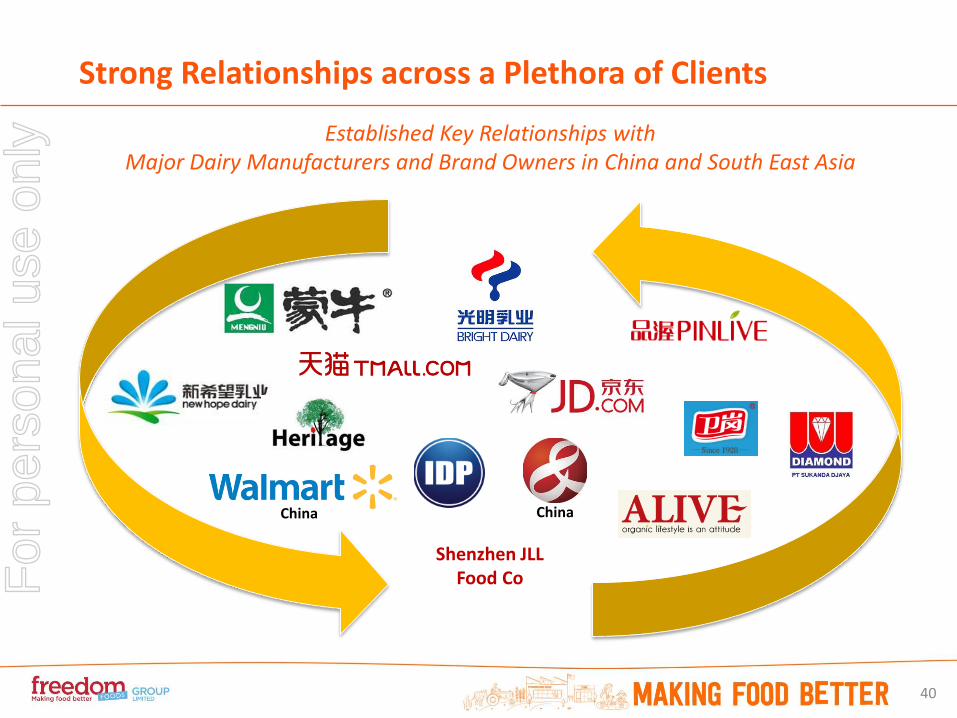
Strong Relationships across a Plethora of Clients
40
Established Key Relationships with Major Dairy Manufacturers and Brand Owners in China and South East Asia
China China
Shenzhen JLL Food CoF
or p
erso
nal u
se o
nly

Australia’s Own for China… A Premium Dairy Platform
41
Continued Strong Growth Trajectory through 2016 making it the Largest Imported Kid’s Milk Brand in China
Australia’s Own Dairy Company China (AO China)
to be established in 2017For
per
sona
l use
onl
y

Cereal in China – Market Expected to Accelerate in China
42
“Arnold’s Farm” brand was the No. 1 Cereal Product on Tmall International during the CNY promotional period and one of the Top 3 selling products in Tmall
For
per
sona
l use
onl
y

So Natural & Vitalife
43
Company Brands Building Through Online Channels into China
• SO NATURAL Dairy Milk No 1 imported dairy milk brand on JD Worldwide (cross border channel)
• SO NATURAL brand building beyond dairy into Cereals and related products
• SO NATURAL Muesli one of 10 Special “best in class” food products promoted by JD
For
per
sona
l use
onl
y
Supply Chain
44
For
per
sona
l use
onl
y
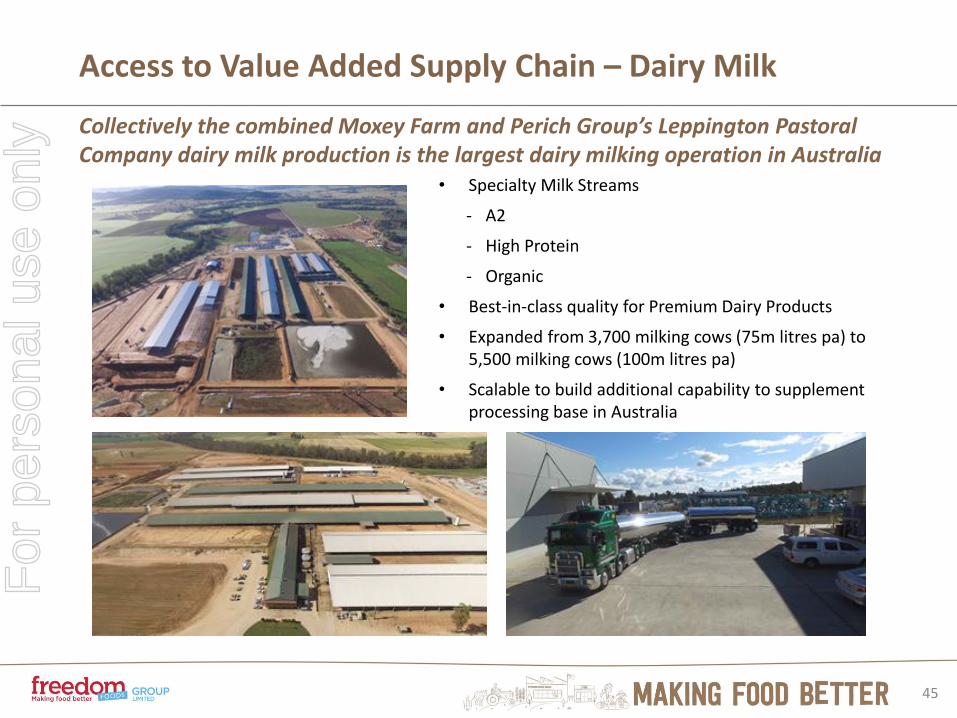
Access to Value Added Supply Chain – Dairy Milk
Collectively the combined Moxey Farm and Perich Group’s Leppington Pastoral Company dairy milk production is the largest dairy milking operation in Australia
• Specialty Milk Streams
- A2
- High Protein
- Organic
• Best-in-class quality for Premium Dairy Products
• Expanded from 3,700 milking cows (75m litres pa) to 5,500 milking cows (100m litres pa)
• Scalable to build additional capability to supplement processing base in Australia
45
For
per
sona
l use
onl
y

Freedom Farmers
Aiming to be a fully integrated paddock to plate provider to ensure full quality control of our supply chain
Harvesting in 2017
Maize (Corn), Sorghum, Buckwheat, Oats
46
For
per
sona
l use
onl
y

Darlington Point Mill
Largest supplier of popping corn in Australia with over 40% share
47
For
per
sona
l use
onl
y

Corporate & Group Management
48
For
per
sona
l use
onl
y

Talent & Technology
• Significant investments in people, talent and capability in all areas of retail sales, marketing & innovation, quality operations, financial and compliance
• During the period, the Company appointed a Chief Financial Officer
• For our expanding capital projects initiatives, we increased our capability to manage and install our key projects that will provide for ongoing capability at our sites, reducing reliance on 3rd party providers
• Well progressed on a complete transformation of its IT / ERP systems, with the transition from a 1st generation platform to a new cloud based ERP system well progressed and expected to be materially completed by June 2017
• The Company intends to be a leader in utilising digital technologies to further automate and streamline its operations
We are developing our people, talent & capability across all areas to align with the Company’s rapidly expanding sales and operational platform
49
For
per
sona
l use
onl
y

Capital Management
• Dec 2016: Completed a capital raising comprising a pro-rata accelerated non-renounceable entitlement offer and institutional placement
• The offer raised a total of $75 million, with the institutional component being significantly oversubscribed with strong demand from a broad range of high quality institutional investors including existing institutional shareholders
• Offer price: $4.45 per share (5.9% discount to 30 days VWAP)
• Funds raised utlised in funding of the Company’s growth strategy:
- Acquisition of ACM’s 50% interest in PDG
- Other proposed acquisitions and investments
- Balance sheet flexibility for future growth opportunities including the capital expenditure initiatives which are ongoing in relation to product and capability expansion at our Shepparton, Ingleburn and Dandenong facilities
Strong Cash Flow with Prudent Capital Management Policies in Place
Capital Raising
50
For
per
sona
l use
onl
y
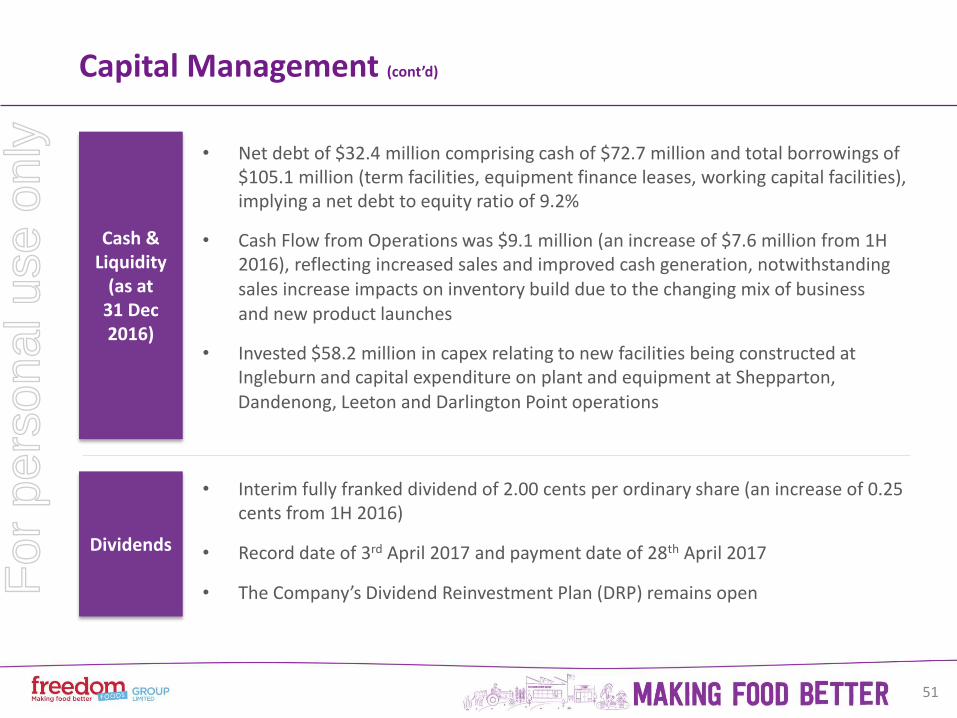
Capital Management (cont’d)
• Net debt of $32.4 million comprising cash of $72.7 million and total borrowings of $105.1 million (term facilities, equipment finance leases, working capital facilities), implying a net debt to equity ratio of 9.2%
Cash & Liquidity
(as at 31 Dec 2016)
Dividends
• Interim fully franked dividend of 2.00 cents per ordinary share (an increase of 0.25 cents from 1H 2016)
• Record date of 3rd April 2017 and payment date of 28th April 2017
• The Company’s Dividend Reinvestment Plan (DRP) remains open
51
• Cash Flow from Operations was $9.1 million (an increase of $7.6 million from 1H 2016), reflecting increased sales and improved cash generation, notwithstanding sales increase impacts on inventory build due to the changing mix of business and new product launches
• Invested $58.2 million in capex relating to new facilities being constructed at Ingleburn and capital expenditure on plant and equipment at Shepparton, Dandenong, Leeton and Darlington Point operations
For
per
sona
l use
onl
y

Outlook
A strong start to the year in sales across all business areas will further accelerate into the 2nd half FY 2017, reflecting stronger seasonal sales mix into the 2nd half and ongoing organic growth.
We continue to invest to drive scale and generate profitability:
• Near completion of Ingleburn material increase in sales & profitability + further growth opportunities
• Established Dairy platform focus on specialty and high value added products (eg cream & yogurt)
• Development of specialist Nutritionals platform creating protein and milk componentry for internal
We will continue to evaluate acquisitions that add value to and significantly accelerate and or leverage our sales, marketing and operational platforms.
Our operating profits will increase through the investment cycle, balanced against a requirement to invest in people, systems and process to manage a scaled and diversified business platform.
52
“Australia’s Own” and “Freedom Foods” brands will increasingly be at the forefront of driving our returns from our innovation and manufacturing capabilities
use and external sales
• Strong innovation in Cereal & Snacks a suite of products across multiples channels across geographies
• Dandenong & Darlington Point acquisitions showing evidence of volume and cost efficiencies
• Potential Power Foods acquisition exploring new opportunities in sports and adult nutrition market
• North American strategy acceleration materially contributing to earnings in the medium term
For
per
sona
l use
onl
y

Summary FinancialsHalf Year FY 2017
53
For
per
sona
l use
onl
y

Financial Summary
54
6 Months to 31st December 1H 2017$’000
1H 2016$’000
% Change
Net Sales Revenue 123,852 54,117 + 128.9%
EBDITA (Underlying Operating)(1) 12,994 7,542 + 72.3%
EBDITA (Statutory) 12,461 4,947 + 151.9%
Equity Associates Share of Profit(2) 240 192 + 25.0%
Pre Tax Profit (Operating)(1) 7,277 3,826 + 90.2%
Pre Tax Profit (Reported) 6,744 27,355 - 75.3%
Income Tax (Operating) 1,965 842 + 133.4%
Net Profit (Operating)(3) 5,312 2,984 + 78.0%
Net Profit (Reported)(3) 4,475 23,422 - 80.9%
Interim Ordinary Dividend (cents) 2.00 1.75 + 14.3%
Interim CRPS Dividend (cents) 1.35 1.35 -
EPS (Fully Diluted) (cents) 2.51 14.13 - 82.2%
EPS Operating (Fully Diluted) (cents) 4.58 2.51 + 82.5%
Net Debt / Equity 9.2% 12.1%
Net Assets per Share (cents) 179.3 149.0
Net Tangible Assets per Share (cents) 143.1 127.2
Notes:(1) Underlying Operating EBDITA excludes pre-tax abnormal or non-operating charges including an add back of non cash employee share option expense of $224k. 2015 excluded gain on sale of a2MC investment.(2) Equity Associates is share of NPAT of Australian Fresh Milk Holdings (10% equity interest held by Freedom Foods Group) and 1% of PDG Equity accounted NPAT for period 1st July 2015 to 31st December 2015.(3) Operating Pre Tax Profit and Net Profit does not include pre-tax abnormal or non-operating charges including an add back of non cash employee share option expense of $224k. 2015 excluded gain on sale of
a2MC investment.
For
per
sona
l use
onl
y

Financial Summary by Business Units
55
6 Months to 31st December 2016 (A$’000)
Freedom Foods
PactumTaren Point
Pactum Dairy Group
Specialty Seafood
Freedom Foods NA
Other Total
Net Sales Revenue(1) 58,672 32,099 40,761 6,480 1,136 (15,296) 123,852
Trading EBDITA 6,911 6,134 2,539 791 (465) - 15,910
Other Gains and Losses(2) - - - - - (194) (194)
Equity Associates(3) - - - - - 240 240
Corporate Costs(4) - - - - - (3,495) (3,495)
Statutory EBDITA 6,911 6,134 2,539 791 (465) (3,449) 12,461
Net Sales Change (YOY %) + 87% + 21% n/a - 2% + 49% + 38% + 129%
Net Sales Change (YOY $m) + 27,283 + 5,643 +40,761 - 145 + 372 - 4,179 + 69,735
Trading EBDITA Change (YOY %) + 119% + 29% n/a - 25% - 8% n/a + 88%
Trading EBDITA Change (YOY $m) + 3,752 + 1,370 +2,539 - 259 + 40 n/a + 7,442
Trading EBDITA Margin (%) 11.8% 19.1% 6.2% 12.2% 40.9% n/a 12.8%
Trading EBDITA Margin Prior Year (%) + 1.7% + 1.1% n/a - 3.6% +25.2% n/a - 2.8%
Notes:(1) Net Sales Revenue is after intercompany elimination of sales (total intercompany sales eliminated is $15.3m).(2) Other gains and losses relates to realised and unrealised exchange gains and losses.(3) Equity Associates is share of NPAT of Australian Fresh Milk Holdings (10% equity interest held by Freedom Foods Group).(4) Corporate Costs includes non cash employee share option expense of $224k and acquisition costs of $31k.
For
per
sona
l use
onl
y

Cash Flow
56
6 Months to 31st December 2016 1H 2017($’000)
1H 2016($’000)
Cash from Operating Activities 9,099 1,450
Net Interest Paid (2,539) (2,092)
Income Tax Paid - (2,675)
Total Cash from Operating Activities 6,560 (3,317)
Capex on PP&E (58,190) (17,150)
Net Advances to Associates - (441)
Proceeds from Sale of Associates - 90,229
Repayment of Loan by Associates - 100
Investment in Equity Interest - (5,733)
Business Acquisitions - (39,422)
Net Cash used in Investing Activities (58,190) 27,583
Net Proceeds from Equity Issuance 62,667 65,962
Payment of Share Issue Costs (1,536) (1,613)
Dividends Paid (1,038) (560)
Proceeds of Bank Financing 1,319 18,974Other Payments (966) (3)
Net Cash from Financing Activities 60,446 82,760
Closing Cash Balance 72,724 109,355
• Cash Flow from Operating Activities: 6 times increase reflecting increased sales, improved cash generation and working capital mix
• Net Interest Paid: Increased reflecting higher utilisation of financing facilities relating to working capital and capex
• Income Tax Paid: No income tax was paid during the period. The Company is in the process of finalising prior period returns an will pay tax in the 2nd half
• Capex: Capex on construction of Ingleburn and P&E at various site
For
per
sona
l use
onl
y

Funds Employed
57
• Inventory and Receivables: Increases reflecting increase sales turnover and additional working capital requirement for new innovation in products
• Fixed Assets: Capex on construction of Ingleburn facility and P&E at Shepparton, Dandenong and Darling Point
31 Dec 16($’000)
30 Jun 16($’000)
Inventory 54,606 45,834
Trade & Other Creditors (62,757) (51,780)
Net Investment in Inventory (8,151) (5,946)
Trade & Other Receivables 48,547 45,548
Other Current Assets 8,021 3,979
Working Capital 48,417 43,581
PP&E 278,508 224,317
Intangible Assets 71,153 71,128
Other Fixed Assets 9,896 9,944
Total Fixed Assets 359,557 305,389
Total Funds Employed 407,974 348,970
Other Creditors & Provisions (22,826) (21,923)
Net Funds Employed 385,148 327,047
Net Financing (32,424) (39,922)
Net Equity 352,724 287,125
ND / Equity 9.2% 13.9%For
per
sona
l use
onl
y

For
per
sona
l use
onl
y