freeware performance testing tools are worth … · freeware performance testing tools are worth...
TRANSCRIPT

WHITEPAPER
Freeware Performance Testing Tools are Worth What You PaidIf you are basing your storage decisions on free tools, you are probably using bad data, and it’s getting worse
Table of Contents
Abstract .................................................................................................. 2
What is Normal ......................................................................................3
Testing w/ and w/o bursts ..................................................................8
Example Customer Issue .................................................................... 11
Conclusion .............................................................................................12
Abstract
The reason we all test storage performance is to help us to make better deployment decisions and ensure we know the performance limits of storage systems before deploying. Frankly, if you substitute the logo on any vendor’s marketing collateral, they all look alike and make very similar claims on throughput, IOPs and latency. So we look for real data. We often start with benchmarks to, at least, hopefully get us in the right ballpark. But we all know that benchmarks are flawed and they are regularly “gamed” by smart people who know how to do it. Kudos to them but that’s not what we need. Benchmarks simply don’t represent our application workload characteristics.
So we try to run our own tests. We assemble a lab, download some freeware tools, build a basic workload model, cross our fingers, and hope we can accurately simulate our production environment. But there are people whose fundamental business relies on accurate testing … the storage vendors themselves. And what do they almost universally use? The Load DynamiX commercial testing products from Virtual Instruments.
How did the vendors wind up using a commercial product when there’s so much freeware floating around? Simple ... they all started with freeware, but eventually did a comparison with the Load DynamiX appliances. Interestingly, they found that their storage products performed “better” with the freeware tools than with the Load DynamiX appliances. In this paper, we’re going to examine why that is, and one of the reasons the vendors ultimately decided to use the more accurate testing methodology supplied by Load DynamiX.
We were often told by storage vendors that their performance isn’t as good when testing with our load generation appliance as they see with “insert any free tool here”. The faster their array is the more likely they are to say this. This isn’t because we can’t push it as hard, we can actually push it harder.
By default, we generate traffic with sub-second bursts, because our engineers believe that this is more realistic, based on their years of storage and network experience. We have the ability to tune that out of course, but we highly recommend not doing that. With the merger with Virtual Instruments (VI), we now have the real-world data from hundreds of VirtualWisdom (VW) customers, and the resounding answer is … our engineers were right. Sub-second bursts are the norm and if the burst are too large they can cause serious performance issues. Without this burstiness in your tests, you simply cannot simulate real-world workloads, and your performance testing is deeply flawed. The VI services and support teams have helped customers resolve issues related entirely to sub-second bursts in traffic.
In this white paper we will show from our own data center and aggregate customer data that sub-second bursts are normal and therefore should be used in all storage testing. Sub-second bursts will become even more problematic over time. They are even more impactful on lower latency systems, such as all-flash arrays and the applications that depend on low latency. We will demonstrate the difference of testing with and without burst and discuss real world cases where companies have suffered performance issues as a result of sub-second bursts. We hope to help the industry to understand both how to accurately test with bursts and how to minimize them in production.
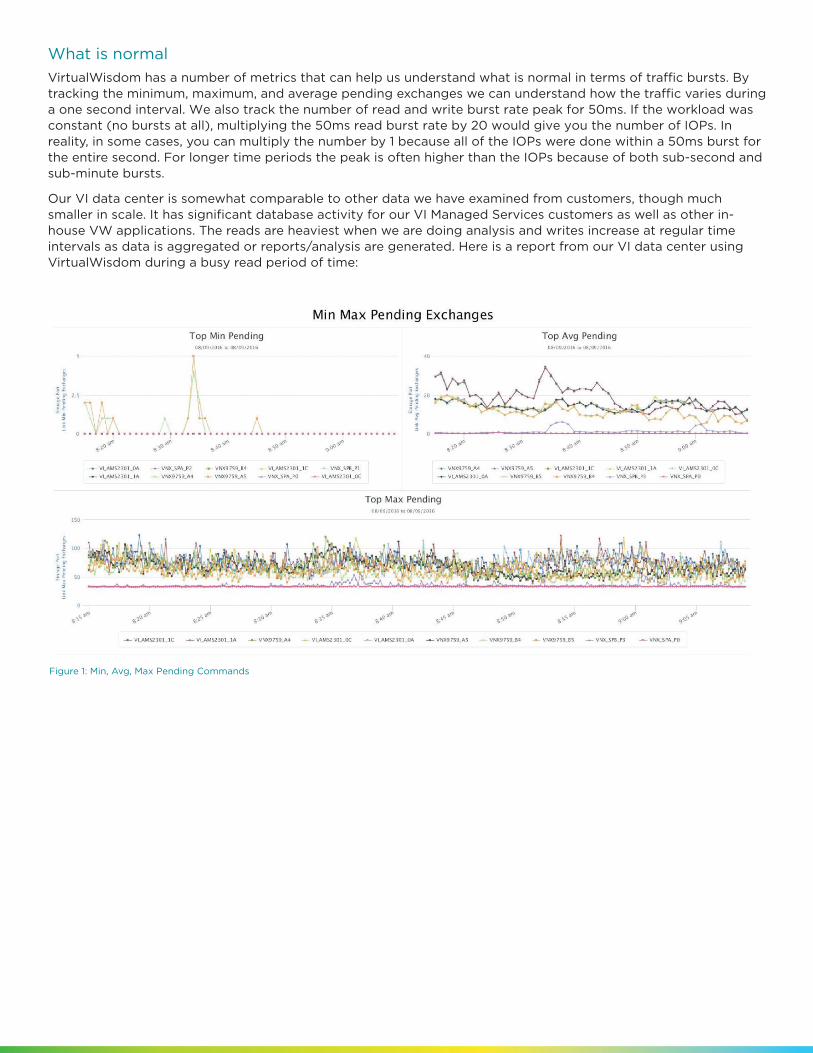
What is normal
VirtualWisdom has a number of metrics that can help us understand what is normal in terms of traffic bursts. By tracking the minimum, maximum, and average pending exchanges we can understand how the traffic varies during a one second interval. We also track the number of read and write burst rate peak for 50ms. If the workload was constant (no bursts at all), multiplying the 50ms read burst rate by 20 would give you the number of IOPs. In reality, in some cases, you can multiply the number by 1 because all of the IOPs were done within a 50ms burst for the entire second. For longer time periods the peak is often higher than the IOPs because of both sub-second and sub-minute bursts.
Our VI data center is somewhat comparable to other data we have examined from customers, though much smaller in scale. It has significant database activity for our VI Managed Services customers as well as other in-house VW applications. The reads are heaviest when we are doing analysis and writes increase at regular time intervals as data is aggregated or reports/analysis are generated. Here is a report from our VI data center using VirtualWisdom during a busy read period of time:
Figure 1: Min, Avg, Max Pending Commands

The Top Min Pending exchanges show that most ports have no traffic pending at some point in time during the one-minute interval. There are a few exceptions where the lowest IO was 5 commands pending. The average is below 20 for all but one port pair while the maximum is between 50 and 100 for almost all active storage ports, with a few exceeding the 100 mark. Other customer data had both higher averages and higher maximums because they have more servers sharing storage array ports than we do. For larger data centers 500-700 is a more normal range for maximum pending during busy time periods. Other customer data also had higher minimums with almost all going to zero at some point but less frequently than our data center. The ratios remained similar.
Figure 2: Read 50ms Peaks and IOPs
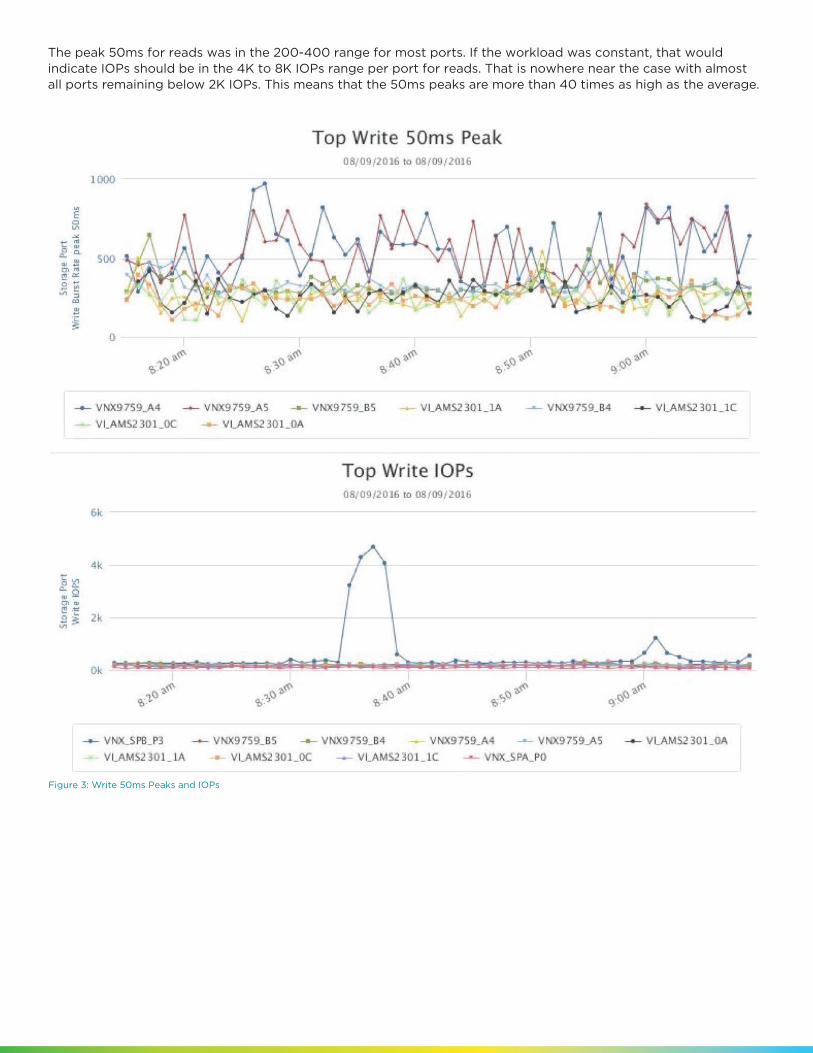
The peak 50ms for reads was in the 200-400 range for most ports. If the workload was constant, that would indicate IOPs should be in the 4K to 8K IOPs range per port for reads. That is nowhere near the case with almost all ports remaining below 2K IOPs. This means that the 50ms peaks are more than 40 times as high as the average.
Figure 3: Write 50ms Peaks and IOPs

For writes it is even more dramatic due to the periodic nature of our write activity. We see this also in other customer workloads where writes are often done at set time intervals due to the nature of the applications driving them.
The peak IOs in 50 ms values are actually higher than the IOPs themselves in most cases. This means that for most seconds, there is less traffic than there is occasionally in 50ms. This indicates both sub-second bursts as well as sub-minute bursts.
Figure 4: Write 50 ms Peaks and IOPs summary
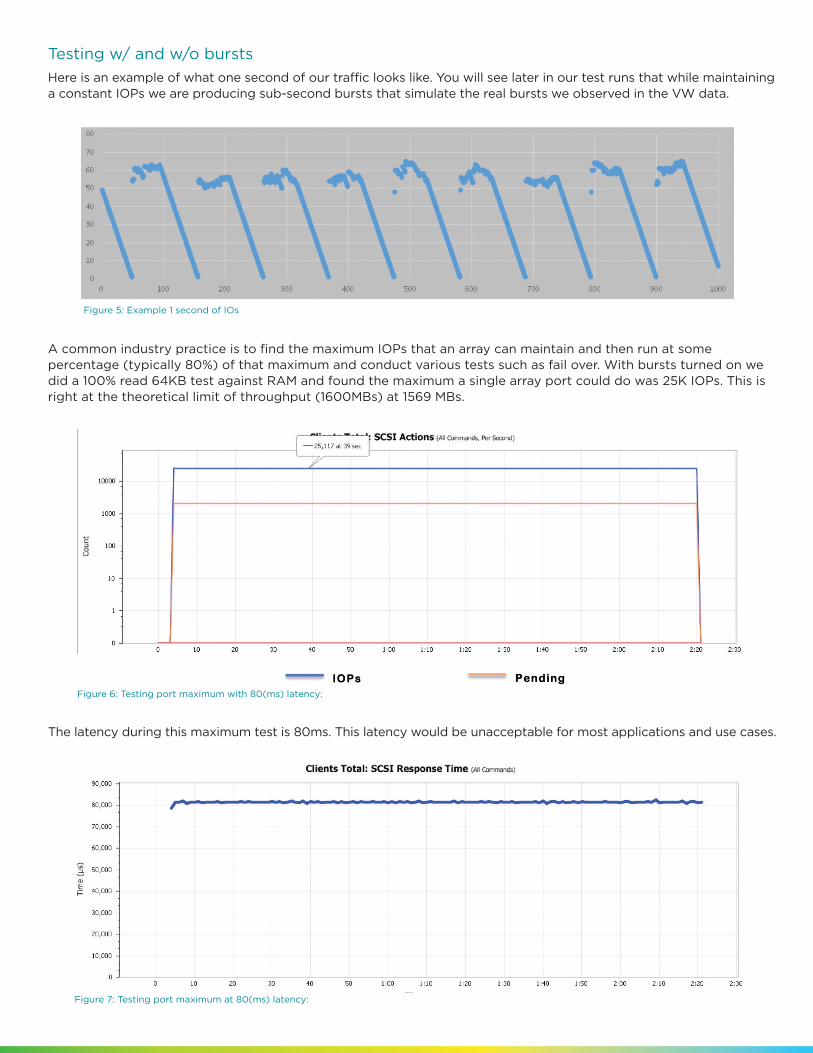
Testing w/ and w/o bursts
Here is an example of what one second of our traffic looks like. You will see later in our test runs that while maintaining a constant IOPs we are producing sub-second bursts that simulate the real bursts we observed in the VW data.
A common industry practice is to find the maximum IOPs that an array can maintain and then run at some percentage (typically 80%) of that maximum and conduct various tests such as fail over. With bursts turned on we did a 100% read 64KB test against RAM and found the maximum a single array port could do was 25K IOPs. This is right at the theoretical limit of throughput (1600MBs) at 1569 MBs.
The latency during this maximum test is 80ms. This latency would be unacceptable for most applications and use cases.
Figure 7: Testing port maximum at 80(ms) latency:
Figure 6: Testing port maximum with 80(ms) latency:
Figure 5: Example 1 second of IOs

We then throttled the IOPs to 20K or 80% of the maximum (still with sub-second bursts).
Note the number of commands that were typically outstanding varied from zero to around 40. This is very realistic and compares with what we observed in the VW data for both our data center as well as VI services customer data. The latency was around 6.5ms.
We then modified the test to have a constant 30 commands out at one time (no sub-second bursts). With that test we found the port could easily do 25K IOPs:
Figure 8: IOPs and Pending commands for 20K throttle w/ bursts
Figure 9: Latency for 20K IOPs w/ bursts
Figure 10: IOPs and pending commands for no burst workload

With 1.2 ms latency (figure 11).
So while it is true that the port can easily do 25K 64KB IOPs 100% reads with 1.2ms latency, that is only true in a lab scenario where it is given a constant stream of work to do. Think about the last time you had a constant amount of work to do. That isn’t how life happens or how applications behave. We live in a hurry up and wait world where we aren’t ready for something until we wanted it yesterday. The same is true with real world workloads.
64KB IOPs 100% Reads on one port
Test IOPs Throughput Latency Gap
With bursts 20K 1250 MB 6.5 ms Real world
With bursts 25K 1569 MB 80 ms Unacceptable latency
Without bursts 25K 1566 MB 1.2 ms Lab-Myth
This has produced a gap where the storage vendors’ sales teams and enterprise architects (except those now using our solution) have been sold a myth and the storage vendors’ support teams and enterprise storage operations teams see a different reality. It is time to close this gap so we can all get some sleep at night.
Example Customer Issue – with problem solved!
Here is an example where a customer was experiencing periodic increased latency with no observable difference in the amount or type of IO being requested. The latency went from <.5ms to as high as 2ms while the traffic was similar traffic to time periods where the latency didn’t increase. The cause was increased sub-second bursts of traffic. Looking at other time periods we can see that IOPs isn’t the cause of the latency. There is a direct match to increases in 50ms peaks and the higher latency. The maximum number of commands sent in a 50ms time window went from around 50 to over 100 and in some cases as many as 150. This caused the latency to be almost 4 times the norm. Queue Depth settings can be used to prevent these bursts though application changes should also be considered. See our white paper on using VI to Optimize Queue Depth Settings in your environment. In this case, thanks to the VW data, the company’s DBA was able to identify a job running on the system responsible for the bursts and was able to move the load to a less busy node.
Figure 11: Latency for 25K IOPs workload w/o bursts
Training [email protected]
Website virtualinstruments.com
Sales [email protected] 1.888.522.2557
©06/2017 Virtual Instruments. All rights reserved. Features and specifications are subject to change without notice. VirtualWisdom®, Virtual Instruments®, SANInsight®, Virtual Instruments Certified Associate, Virtual Instruments Certified Professional, and Virtual Instruments University are trademarks or registered trademarks in the United States and/or in other countries.
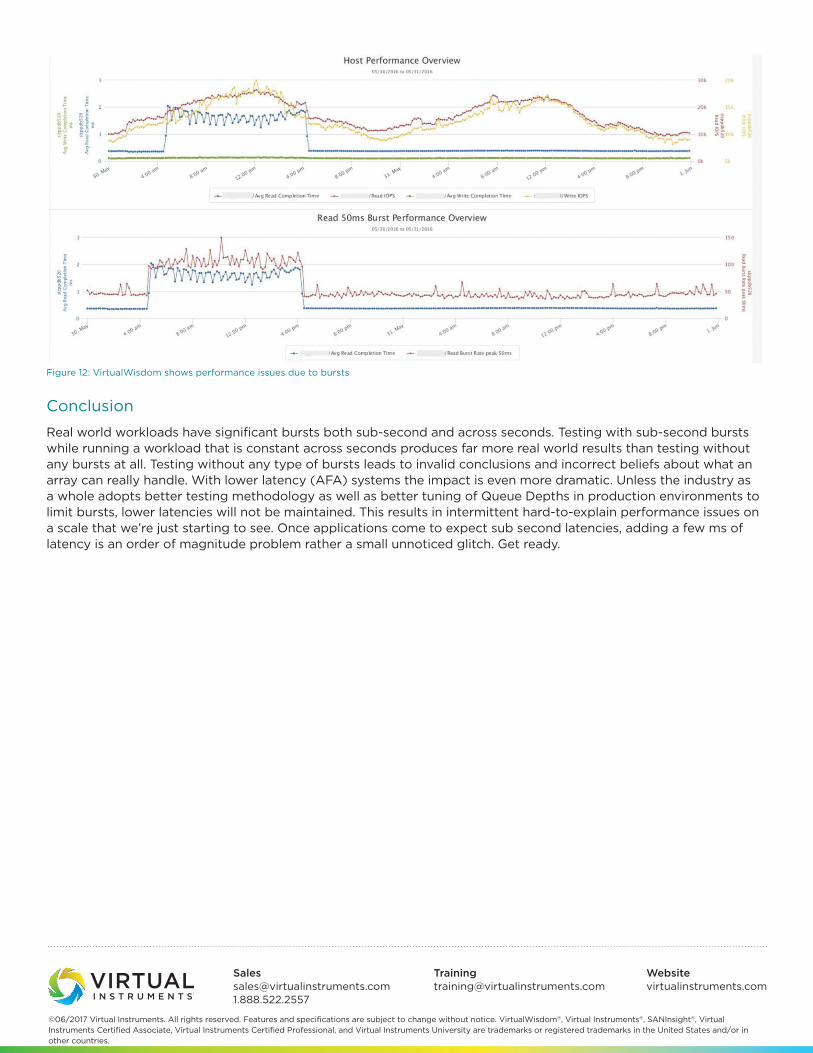
Conclusion
Real world workloads have significant bursts both sub-second and across seconds. Testing with sub-second bursts while running a workload that is constant across seconds produces far more real world results than testing without any bursts at all. Testing without any type of bursts leads to invalid conclusions and incorrect beliefs about what an array can really handle. With lower latency (AFA) systems the impact is even more dramatic. Unless the industry as a whole adopts better testing methodology as well as better tuning of Queue Depths in production environments to limit bursts, lower latencies will not be maintained. This results in intermittent hard-to-explain performance issues on a scale that we’re just starting to see. Once applications come to expect sub second latencies, adding a few ms of latency is an order of magnitude problem rather a small unnoticed glitch. Get ready.
Figure 12: VirtualWisdom shows performance issues due to bursts