freight rail usage - 2017-18 q2 - home | office of rail...
TRANSCRIPT

Freight Rail Usage 2017-18 Q2 Statistical Release Publication date: 21 December 2017 Next publication date: 1 March 2018
Background This release contains information on rail freight usage in Great Britain with the latest quarterly data referring to July, August and September of 2017. The statistics cover freight moved (disaggregated by seven commodities), freight lifted, freight delays per 100 train km, freight train kilometres by operator. This release also contains the annual freight market indicators which show comparisons with other modes of transport (these have not been updated this quarter).
Data are sourced from Network Rail, Freight Operating Companies (FOCs) and Department for Transport (DfT).
Contents Freight moved – page 2 Freight lifted – page 6 Freight delay per 100 train km – page 8 Freight train kilometres by operator – page 9 Freight market indicators – page 11 Annexes – page 13
The volume of rail freight moved in July to September 2017 rose by 2%
compared to the same quarter last year.
Freight moved by commodity, Great Britain, 2017-18 Q2
The total volume of rail freight moved increased to 4.3 billion net tonne
kilometres in 2017-18 Q2 compared to 2016-17 Q2. Construction and
domestic intermodal respectively recorded record volumes of 1.13 and 1.72
billion net tonne kilometres.
In total, 18.4 million tonnes of freight was lifted in 2017-18 Q2. This was a
decrease of 3% compared with the same quarter last year, and marks the lowest
volume recorded since the start of the time series in 1996-97 Q1.
Normalised freight delay rose to 11.9 minutes per 100 train kilometres, an
increase of 15% compared to 2016-17 Q2.
Total freight train kilometres recorded a slight reduction (0.01 million
kilometres) compared to 2016-17 Q2. This is the lowest amount recorded since
the time series began in 2010-11 Q1.
Responsible Statistician: Abby Sneade (Tel: 020 7282 2022) Author: Folusho Amusan Public Enquiries: Email: [email protected] Media Enquiries: Tel: 020 7282 2094 Website: http://www.orr.gov.uk/statistics/published-stats/statistical-releases

1. Freight moved Annual 2016-17
The total volume of rail freight moved fell to 17.2 billion net tonne kilometres in 2016-17, a
3% reduction on 2015-16. This section is unchanged from the 2016-17 Q4 statistical
release.
The volume of rail Freight moved (total) – chart (Table 13.7) Great Britain data 1982-83 to 2016-17
2013-14 peak Billion net tonnes km (total) 24.0 22.0 20.0 18.0 16.0 14.0 12.0 10.0
8.0 6.0 4.0 2.0 0.0
11.8 13.0
21.9 22.7
17.2
Miners' strike
1982-83 1991-92 2000-01 2009-10 2016-17 Financial year
More detailed analysis of the annual data can be found in the 2016-17 Q4 statistical
release.
Freight moved data, measured in net tonne kilometres, shows the amount of freight which is moved on
the railway network, taking into account the weight of the load and the distance carried.
Freight moved is disaggregated by seven commodities which are also summed to provide an overall
total freight moved. The seven commodities are coal, metals, construction, oil and petroleum,
international, domestic intermodal and other.
In addition to the seven commodities listed above the amount of goods used for railway engineering
work is also reported, under the ‘infrastructure’ category. This is not included in the totals published in
the freight moved tables and charts.
Office of Rail and Road 21 December 2017 2017-18 Quarter 2 Statistical Release – Freight Rail Usage 2

2017-18 Quarter 2 Results
Total freight moved increased (2%) in 2017-18 Q2 compared to the same quarter last year, recording 4.3 billion net tonne kilometres.
The volume of rail freight moved (billion net tonne km), Great Britain, 1998-99 Q1 to 2017-18 Q2 (Table 13.7)
Office of Rail and Road 21 December 2017 2017-18 Quarter 2 Statistical Release – Freight Rail Usage 3

Rail freight moved (2017-18 Q2, Great Britain)
Compared Billion net to 2016-17 tonne km Q2
Domestic intermodal increased to 1.7 billion net tonne kilometres ( 1%) compared to the same period a year earlier. This is the highest volume recorded since the start of the time-series in 1998-99 Q1. This may be driven by growth in the retail sector1 increasing demand for goods moved by rail freight.
Construction reached a record high with 1.1 billion net tonne kilometres this quarter, an increase ( 2%) on 2016-17 Q2. This may be caused by increased demand for materials for housing repair and maintenance being moved by rail freight2.
‘Other’ goods moved by rail freight increased to 0.4 billion net tonne km ( 28% compared to the same period last year).
International rose to 0.1 billion net tonne kilometres ( 10%) compared to the same period a year earlier. Eurotunnel reported cross-channel traffic achieving record levels3 during this period, resulting in more rail freight moved4
compared to 2016-17 Q2.
Metals decreased to 0.3 billion net km ( 6%), the lowest Q2 since the start of the quarterly time series in 1998-99 Q1.
Oil and petroleum fell to 0.3 billion net tonne km ( 3%).
1 https://www.ons.gov.uk/businessindustryandtrade/retailindustry/bulletins/retailsales/september2017 (main points)
2https://www.ons.gov.uk/businessindustryandtrade/constructionindustry/bulletins/constructionoutputpriceindicesopis/ukjulytoseptember2 017 (main points)
3 https://www.getlinkgroup.com/uploadedFiles/assets-uk/Media/Press-Releases/2017-Press-Release/170905-eurotunnel-sets-newhistorical-traffic-records-for-summer-2017.pdf
4 https://www.getlinkgroup.com/uploadedFiles/assets-uk/Media/Press-Releases/2017-Press-Release/171019-revenue-traffic-Q32017.pdf (page 4, Fixed Link Traffic)
Office of Rail and Road 21 December 2017 2017-18 Quarter 2 Statistical Release – Freight Rail Usage 4

Billion net Compared tonne km to 2016-17
Q2
Coal fell to 0.3 billion net tonne km ( 13%) compared to last year. This is a record low that follows policy decisions to switch to more renewable fuel sources that have greatly reduced the use and transportation of coal over the last four years5.
Together, construction and domestic intermodal freight accounted for around two-thirds of total rail
freight moved this quarter. This is considerably higher than the 44 per cent share of rail freight
moved that these goods accounted for in July to September of 2013
Quarterly freight moved data are available on the data portal in: Table 13.7
5 https://www.theguardian.com/business/2017/jul/19/how-coal-lost-power-britain
Office of Rail and Road 21 December 2017 2017-18 Quarter 2 Statistical Release – Freight Rail Usage 5

14.5 Miners' strike
Coal
Other*
Effect of announcements to phase out coalfired stations by 2025
2. Freight lifted
Annual 2016-17
In 2016-17, the total amount of freight lifted in Great Britain fell to 79.4 million tonnes, the
lowest since 1984-85, representing an 8% decrease on 2015-16. The fall was largely
driven by the decline in coal freight. This section is unchanged from the 2016-17 Q4
statistical release.
The mass of rail Freight lifted – chart (Table 13.6) Great Britain data 1982-83 to 2016-17
Million Tonnes 100
90
80
70
60
50
40
30
20
10
0 1982-83 1987-88 1992-93 1997-98 2002-03 2007-08 2012-13 2016-17
* Other is a commodity group for non-coal lifted Financial year
More detailed analysis of the annual data can be found in the 2016-17 Q4 statistical
release.
Freight lifted is the mass of goods carried on the rail network measured in tonnes, excluding the
weight of the locomotives and wagons. Unlike freight moved it takes no account of the distance
travelled.
Freight lifted information is sourced from the four major FOCs: DB Schenker Rail (formerly EWS),
Freightliner Ltd (formerly the BR container business), Direct Rail Services (DRS) and GB Railfreight.
Office of Rail and Road 21 December 2017 2017-18 Quarter 2 Statistical Release – Freight Rail Usage 6
12.0
67.4

2017-18 Quarter 2 Results
2017-18 Q2 recorded the lowest volume of freight lifted since the start of the time series in
1996-97 Q1: some 18.4 million tonnes. This was a decrease of 3% compared to 2016-17
Q2.
Freight lifted (million tonnes), Great Britain, 1996-97 Q1 to 2017-18 Q2 (Table 13.6)
The volume of ‘Other’ freight lifted in2017-18 Q2 decreased by 1% compared to 2016-17 Q2
The volume of coal lifted in 2017-18 Q2 was at a record low: 19% lower than in 2016-17 Q2
Quarterly freight lifted data are available on the data portal in: Table 13.6
Office of Rail and Road 21 December 2017 2017-18 Quarter 2 Statistical Release – Freight Rail Usage 7
Freight delay per 100 train kilometres is a normalised measure of delay experienced by FOCs.
The measure is calculated from the total delay experienced by all GB freight operators divided by their train mileage.
Freight train mileage can fluctuate depending on demand so a normalised measure allows for comparison over time regardless of changing levels of freight traffic on the network.
Freight Delivery Metric (FDM) is another measure of freight train delay. It is based on the percentage of freight trains that arrive at their destination within 15 minutes of their scheduled arrival time. Results and more information can be found in the quarterly Passenger and Freight Rail Performance statistical release.
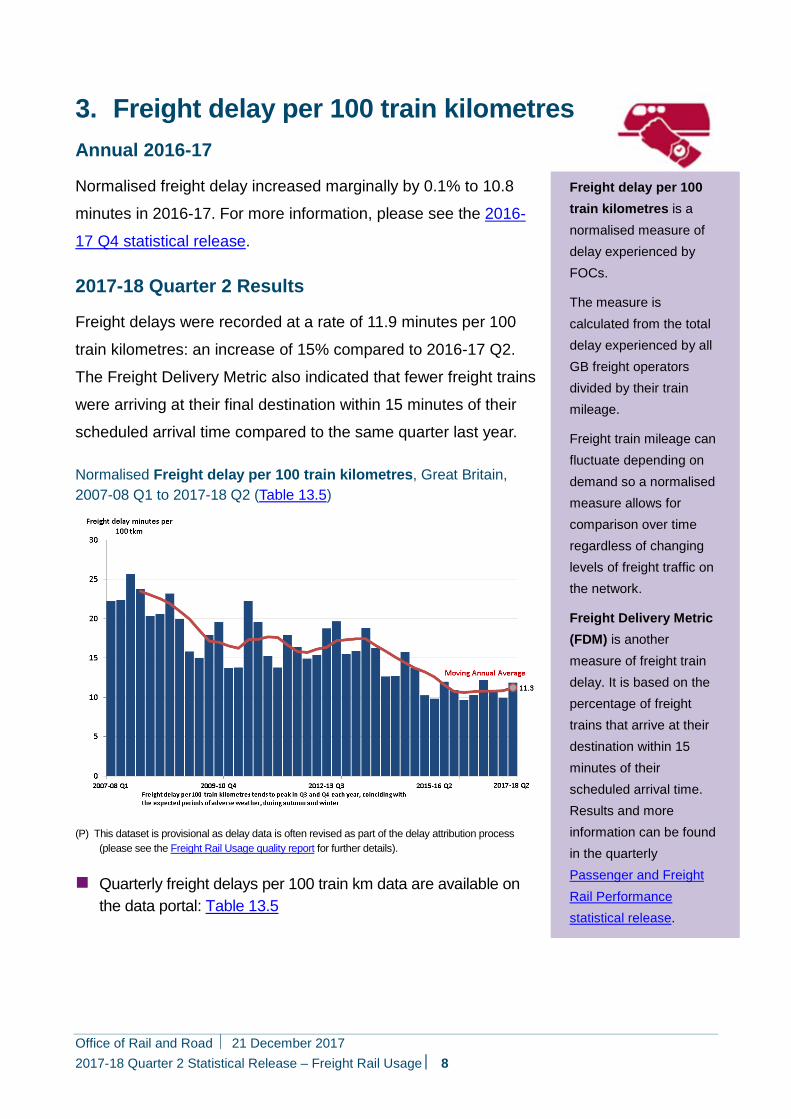
3. Freight delay per 100 train kilometres
Annual 2016-17
Normalised freight delay increased marginally by 0.1% to 10.8
minutes in 2016-17. For more information, please see the 2016
17 Q4 statistical release.
2017-18 Quarter 2 Results
Freight delays were recorded at a rate of 11.9 minutes per 100
train kilometres: an increase of 15% compared to 2016-17 Q2.
The Freight Delivery Metric also indicated that fewer freight trains
were arriving at their final destination within 15 minutes of their
scheduled arrival time compared to the same quarter last year.
Normalised Freight delay per 100 train kilometres, Great Britain, 2007-08 Q1 to 2017-18 Q2 (Table 13.5)
(P) This dataset is provisional as delay data is often revised as part of the delay attribution process (please see the Freight Rail Usage quality report for further details).
Quarterly freight delays per 100 train km data are available on the data portal: Table 13.5
Freight delay per 100 train kilometres is a normalised measure of delay experienced by FOCs.
The measure is calculated from the total delay experienced by all GB freight operators divided by their train mileage.
Freight train mileage can fluctuate depending on demand so a normalised measure allows for comparison over time regardless of changing levels of freight traffic on the network.
Freight Delivery Metric (FDM) is another measure of freight train delay. It is based on the percentage of freight trains that arrive at their destination within 15 minutes of their scheduled arrival time. Results and more information can be found in the quarterly Passenger and Freight Rail Performance statistical release.
Office of Rail and Road 21 December 2017 2017-18 Quarter 2 Statistical Release – Freight Rail Usage 8

4. Freight train kilometres by operator Annual 2016-17
In 2016-17, total freight train kilometres fell to 34 million
kilometres, a reduction of just under 1 million kilometres ( 3%)
compared to 2015-16. This is the lowest amount recorded since
the time series began in 2010-11.
Freight train kilometres by FOC, Great Britain, 2010-11 to 201617 (Table 13.25)
Financial year
2016-17
2015-16
2014-15
2013-14
2012-13
2011-12
2010-11
0 10 20 30 40 50 million kms
Colas Freight DB Cargo UK Devon and Cornwall Railways Direct Rail Services Freightliner Freightliner Heavy Haul GB Railfreight
For more information, please see the 2016-17 Q4 statistical
release.
Freight train kilometres by operator data cover FOCs on Network
Rail infrastructure and were included for the first time in the 2015
16 Q4 statistical release
Freight train kilometres is the actual mileage in kilometres operated by FOCs on Network Rail infrastructure
The data is sourced from Network Rail’s Track Access Billing System (TABS) and covers only the mileages charged through TABS.
Competition between freight operators means we would expect a greater level of variation in mileage from year to year than in the passenger market.
Not all freight operators have been in operation throughout the time-series, therefore total year on year comparison should be treated with caution.
Please see the accompanying quality report for more information.
Office of Rail and Road 21 December 2017 2017-18 Quarter 2 Statistical Release – Freight Rail Usage 9

5.00 6.00 7.00 8.00 9.00 10.00
2017-18 Quarter 2 Results
In 2017-18 Q2, the total volume of freight train kilometres was recorded at 8 million
kilometres: the lowest Q2 since the start of the time-series in 2010-11 Q1. This was largely
unchanged on the same quarter in the previous year, reducing very slightly by just 0.01
million kilometres.
DB Cargo UK and Freightliner Heavy Haul recorded their lowest volumes of freight train
kilometres since the start of the time series with 3.5 and 0.5 million kilometres respectively
in 2017-18 Q2.
Four out of the seven operators covered by our statistics experienced an increase in train
kilometres this quarter compared to last year. Several freight contracts switched operators
from summer 2016 increasing the flows for those acquiring the contracts compared to the
year ending 2016-17 Q2
DB Cargo UK and Freightliner Intermodal accounted for just under 70% of all freight train
kilometres in 2017-18 Q2.
Freight train kilometres by FOC, Great Britain, 2017-18 Q2 (Table 13.25) Change on
2016-17 Quarter 2 -40% -20% 20% Freight operators 0%
DB Cargo UK
Freightliner
GB Railfreight
Freightliner Heavy Haul
Direct Rail Services
Colas Freight
Devon and Cornwall Railways
3.5
2.4
1.4
0.5
0.4
0.3
0.0
-8%
7%
20%
-23%
-3%
27%
27%
0.00 1.00 2.00 3.00 4.00
Freight train (million km) 2017-18 Q2
Quarterly freight kilometres by operator data are available on the data portal in: Table 13.25
Office of Rail and Road 21 December 2017 2017-18 Quarter 2 Statistical Release – Freight Rail Usage 10

5. Freight market indicators Freight market indicators comprise three measures: the number of freight train movements
on the network (data available up to 2016-17), the impact on road haulage (2015-16), and
rail market share (calendar year 2015). This section is based upon annual data and is
unchanged from the 2016-17 Q4 statistical release.
Number of freight train movements Number of freight train movements, Great Britain, 2003-04 to 2016-17 (Table 13.10)
Number of freight train movements shows the volume of
freight trains on the
railway network each
year.
The data is sourced
from Network Rail and
is based on
chargeable train
movements.
During 2016-17, there were 224,000 freight movements: the lowest since the start of the
time series in 2003-04, representing a decrease of 5% compared to 2015-16. The decline
in coal traffic over the year is partly responsible for this downturn.
Annual freight train movement data are available on the data portal in: Table 13.10
Office of Rail and Road 21 December 2017 2017-18 Quarter 2 Statistical Release – Freight Rail Usage 11

Impact on road haulage
In 2015-16, the number of lorry kilometres that would have
been required to transport the amount of freight moved by
rail was 1.7 billion kilometres: a 19% decrease on 2014-15.
This is the lowest recorded since the start of the time
series in 2004-05
There were 7.8 million lorry journeys avoided in 2015-16
through the use of rail freight: 21% lower than the previous
year. 2015-16 recorded the lowest number of avoided lorry
journeys since 2004-05.
Annual impact on road haulage data are available on the data portal in: Table 13.8
Rail market share
In 2015, 5% of all freight lifted6 was on rail, with 97 million
tonnes. The proportion of freight lifted on the rail network
fell by 1.2 percentage points compared to 2014. Between
2014 and 2015, road freight (HGV) increased by 1.4
percentage points.
In 2015, 10% of all freight moved was on the railway
network, with 19 billion net tonne kilometres. The proportion
of freight moved by rail decreased by 2.4 percentage points
compared to the previous year. Between 2014 and 2015,
road freight (HGV) increased by 1.6 percentage points.
Annual rail market share data are available on the data portal in: Table 13.12
Impact on road haulage consists of rail freight lorry kilometres equivalent and
avoided lorry journeys.
Rail freight lorry kilometres equivalent measures an
equivalent distance that road
vehicles (HGVs) would need
to have travelled to move the
amounts of freight carried on
rail.
Avoided lorry journeys is the equivalent number of
road vehicle trips necessary
to move the freight
Rail market share statistics
show the volumes of freight
moved and freight lifted on
different modes of transport;
rail, road, pipeline and water.
Road data is now calculated
based on HGVs only as data
for other vehicle types no
longer available.
Pipeline data is not available
after 2011 therefore it has
been excluded from the
annual totals and the
calculations of market share.
6 https://www.gov.uk/government/uploads/system/uploads/attachment_data/file/546346/domestic-roadfreight-statistics-2015.pdf
Office of Rail and Road 21 December 2017 2017-18 Quarter 2 Statistical Release – Freight Rail Usage 12

Annex 1 – List of pre-created reports available onthe Data Portal All data tables can be accessed on the data portal free of charge. The data portal provides on screen data reports, as well as the facility to download data in Excel format and print the report. We can provide data in csv format on request.
Freight moved
Freight moved, 1982-83 to 2016-17 (annual), 1998-99 Q1 to 2017-18 Q2 (quarterly) – Table 13.7
Freight lifted
Freight lifted, 1982-83 to 2016-17 (annual), 1996-97 Q1 to 2017-18 Q2 (quarterly) – Table 13.6
Freight delay minutes per 100 train kilometres
Normalised freight delay, 2007-08 to 2016-17 (annual), 2007-08 Q1 to 2017-18 Q2 (quarterly) – Table 13.5
Freight train kilometres by operator
Freight train kilometre, 2010-11 to 2016-17 (annual), 2010-11 Q1 to 2017-18 Q2 (quarterly) – Table 13.25
Freight market indicators (Q4/annual publications only)
Number of freight train movements, 2003-04 to 2016-17 – Table 13.10
Impact on rail haulage, 2004-05 to 2015-16 – Table 13.8
Rail market share, 1998 to 2015 – Table 13.12
Revisions: There have been some minor revisions to the previously published dataset. Further details can be found at: Revisions Log.
Methodology: For more information on data collection and the methodology used to calculate the statistics in this release please see the accompanying Quality Report.
Office of Rail and Road 21 December 2017 2017-18 Quarter 2 Statistical Release – Freight Rail Usage 13

Annex 2 Statistical Releases
This publication is part of the statistical releases which cover the majority of reports that were previously released through the Data Portal. The statistical releases consist of four annual and four quarterly themed releases:
Annual:
Rail Finance & Rail Fares Index;
Rail Safety Statistics;
Rail Infrastructure, Assets and Environmental;
Regional Rail Usage.
Quarterly:
Passenger and Freight Rail Performance;
Freight Rail Usage;
Passenger Rail Usage;
Passenger Rail Service Complaints.
A full list of publication dates for the next twelve months can be found in the release
schedule on the ORR website.
Office of Rail and Road 21 December 2017 2017-18 Quarter 2 Statistical Release – Freight Rail Usage 14

National Statistics
The United Kingdom Statistics Authority designated these statistics as National Statistics, in accordance with the Statistics and Registration Service Act 2007 and signifying compliance with the Code of Practice for Official Statistics.
National Statistics status means that official statistics meet the highest standards of trustworthiness, quality and public value.
All official statistics should comply with all aspects of the Code of Practice for Official Statistics. They are awarded National Statistics status following an assessment by the Authority’s regulatory arm. The Authority considers whether the statistics meet the highest standards of Code compliance, including the value they add to public decisions and debate.
It is ORR’s responsibility to maintain compliance with the standards expected of National Statistics. If we become concerned about whether these statistics are still meeting the appropriate standards, we will discuss any concerns with the Authority promptly. National Statistics status can be removed at any point when the highest standards are not maintained, and reinstated when standards are restored.
For more details please contact the Statistics Head of Profession Abby Sneade on 020 7282 2022 or contact [email protected].
The Department for Transport (DfT) also publishes a range of rail statistics which can be found at DfT Rail Statistics. They also publish road freight statistics which can be found at Road freight: domestic and international statistics.
Office of Rail and Road 21 December 2017 2017-18 Quarter 2 Statistical Release – Freight Rail Usage 15
© Crown copyright 2017
This publication is licensed under the terms of the Open Government Licence v3.0 except where otherwise stated. To view this licence, visit nationalarchives.gov.uk/doc/open-government-licence/version/3 or write to the Information Policy Team, The National Archives, Kew, London TW9 4DU, or email: [email protected].
Where we have identified any third party copyright information you will need to obtain permission from the copyright holders concerned.
This publication is available at orr.gov.uk
Any enquiries regarding this publication should be sent to us at orr.gov.uk
Office of Rail and Road 21 December 2017 2017-18 Quarter 2 Statistical Release – Freight Rail Usage 16