french mutual fund - bper banca
TRANSCRIPT

French Mutual Fund
EDMOND DE ROTHSCHILD START
ANNUAL REPORT
as at 29 December 2017
Management company: Edmond de Rothschild Asset Management (France)
Custodian: Edmond de Rothschild (France)
Statutory auditor: KPMG Audit
Edmond de Rothschild Asset Management (France) – 47 rue du Faubourg Saint-Honoré – 75401 – Paris Cedex 08, France

2
CONTENTS
1. Features of the UCI 3
2. Changes affecting the UCI 10
3. Management in Report 11
4. Statutory information 19
5. Statutory Fund Auditor’s Certification 21
6. Annual Financial Statements 25

3
1. CHARACTERISTICS OF THE UCI
• LEGAL FORM French Mutual Fund.
• PROCEDURES FOR DETERMINING AND ALLOCATING DISTRIBUTABLE INCOME
Distributable income C, CHF H, CR, E, I, ICHF H, P, S and U units
J units
Allocation of net income Accumulation Distribution
Allocation of net realised gains or losses
Accumulation
Accumulation (in full or in part) or Distribution (in full or in part) or
Carried forward (in full or in part), at the discretion of the management
company Where distribution units are concerned, the UCITS’ management company may decide to distribute one or more interim dividends on the basis of the financial positions certified by the statutory auditor.
• EXPOSURE TO OTHER FOREIGN UCITS, AIFS OR INVESTMENT FUNDS
Up to 10% of its net assets.
• MANAGEMENT OBJECTIVE
The UCITS’ management strategy is discretionary and opportunistic. The UCITS takes positions on the bond and equity markets and on currencies. The UCITS’ objective is to seek absolute performance, decorrelated over the recommended investment period, on the main international equity and bond markets. In the context of its management, the UCITS’ target volatility will be 2% and may reach a maximum of 3%.
• BENCHMARK INDEX The benchmark index to which the performance of the C – EUR, E – EUR, I – EUR and S – EUR units may be compared is the daily capitalised Eonia The Eonia (Euro Overnight Index Average) is an index that reflects the average overnight rates at which a panel of 57 banks lend money. It is calculated by the European Central Bank and represents the rate of the European money market. The benchmark index to which the performance of the P – USD and U – USD units may be compared is the capitalised Federal Funds Effective Rate. The Federal Funds Effective Rate corresponds to the average overnight rate for the dollar zone and is calculated by the Federal Reserve; it represents the risk-free rate for the dollar zone. The benchmark index to which the performance of the CHF H and ICHF H units may be compared is the capitalised 1-month CHF Libor. As the UCITS is not index-linked, its performance may differ significantly from its benchmarks, which serve only as a basis for comparison. The rates and indices used are annualised. The calculation of the performance of these indicators includes coupons.
• INVESTMENT STRATEGY . Strategies used: The UCITS’ management strategy is discretionary and opportunistic. The UCITS takes positions on the bond and equity markets and on currencies. The UCITS’ objective is to seek absolute performance, decorrelated over the recommended investment period, on the main international equity and bond markets.

4
In the context of its management, the UCITS’ target volatility may be up to a maximum of 3%.
To achieve its management objective, the Fund will be exposed as follows: - Up to 100% of its net assets in public debt securities issued by OECD member states without restriction as to their maturity and rated “Investment Grade” or belonging to the “High Yield” class (speculative securities with a long-term rating below BBB- and a short-term rating below A3 as rated by Standard & Poor’s or equivalent, or with an equivalent internal rating from the management company). - Up to 100% of net assets in public debt securities issued by emerging countries outside of the OECD, rated “investment grade” at the time of purchase (rated BBB- or higher by Standard & Poor’s or equivalent, or with an equivalent internal rating from the management company), without restriction as to their maturity. - Up to 100% of net assets in private debt securities (particularly corporate bonds) rated “investment grade” at the time of purchase, without restriction as to their maturity. These securities may also be issued by private sector companies with registered offices in emerging countries, provided that they are rated “Investment Grade” at the time of purchase. - The UCITS may also invest: up to 25% of its net assets in debt securities belonging to the “High Yield” class issued by private sector companies, with no restrictions on maturity. up to 25% of its net assets in public debt securities belonging to the “High Yield” class issued by non-OECD emerging countries with no restriction as to their maturity.
The total investment in high-yield debt issued by private sector companies and by non-OECD emerging countries may not exceed 30% of net assets. The selection of securities is not based automatically and exclusively on the rating criterion. It is mainly based on an internal analysis. Prior to each investment decision, the management company analyses each security on criteria other than its rating. In the event that an issuer in the High Yield category has their rating downgraded, the management company must conduct a detailed analysis in order to decide whether to sell or retain the security, provided that the rating objective is respected.
Between -10% and +15% of its net assets in equity markets of all capitalisations and in all geographic or business sectors. Up to 40% of its net assets in currencies other than the euro. The UCITS’ interest rate sensitivity may fluctuate between -2 and +4.
. On assets: Debt securities and money market instruments
Sensitivity to interest rates - [-2 ; 4]
Geographic region of the issuers OECD and emerging non-
OECD countries up to 100% of net assets
Currency in which the securities are denominated
Euro up to 100% of net assets
Other currencies (OECD and emerging non-OECD countries)
up to 40% of net assets
Currency risk level - up to 40% of net assets
The UCITS may invest up to 100% of its assets in debt securities and money market instruments in order to gain exposure to bond or money markets. In addition, the UCITS may gain indirect exposure to bond or money markets through derivatives or UCIs.

5
The UCITS may invest up to 100% of its net assets in public debt securities issued by OECD member states without restriction as to their maturity and rating, and up to 100% of its net assets in public debt securities issued by non-OECD emerging countries and rated “investment grade” at the time of purchase (rating higher than or equal to BBB- as rated by Standard & Poor’s or equivalent, or with an equivalent internal rating awarded by the management company).
Exposure to private debt securities rated “investment grade” at the time of purchase may be as high as 100% of the UCITS’ net assets. These securities may also be issued by private sector companies with registered offices in emerging countries, provided that they are rated “Investment Grade” at the time of purchase.
The UCITS may also invest up to 25% of its net assets in securities belonging to the “High Yield” class (speculative securities with a long-term rating below BBB- and a short-term rating below A3 as rated by Standard & Poor’s or equivalent, or with an equivalent internal rating from the management company) issued by private sector companies. Up to 25% of its net assets in public debt securities belonging to the “High Yield” class issued by non-OECD emerging countries. The total investment in the “high yield” debt class issued by
private sector companies and by non-OECD emerging countries may not exceed 30% of the net assets.
The portfolio may invest in callable bonds (bonds with a clause allowing the issuer to redeem the security prior to maturity).
The UCITS’ interest rate sensitivity may fluctuate between -2 and +4.
Convertible bonds The UCITS may invest up to 25% of its net assets in convertible bonds.
Equities The UCITS may invest in all equity markets, in shares with or without voting rights, of all capitalisations and from any geographic region or business sector. The UCITS’ exposure range to the equity market will be between -10% and +15% of its net assets. In addition, the UCITS may be exposed to equities indirectly through forward financial instruments and UCIs, including exchange-traded funds.
Currencies
The UCITS may invest up to 40% of its net assets in currencies other than the euro.
UCIs The UCITS may hold up to 10% of its assets in units or shares of French or foreign UCITS or French AIFs characterised as general-purpose investment funds, particularly investment grade or high-yield bonds (i.e. speculative in nature) and equity, money market or dynamic funds. Within this 10% limit, the UCITS may also invest in shares or units of foreign AIFs and/or foreign investment funds that meet the regulatory eligibility criteria. These UCIs and investment funds may be managed by the management company or by an affiliated company.
Financial contracts In order to hedge its assets and/or achieve its management objective, the UCITS may use financial contracts traded on regulated markets (futures, listed options) or over-the-counter markets (options, swaps, etc.). In this context, the manager may create synthetic exposure or hedging on indices, business sectors or geographic areas. To this end, the UCITS may take up positions with a view to hedging the portfolio against certain risks (equity, interest rate, credit, exchange rate, commodities) or exposing itself to risks in interest rates, credit, equity, currency and commodities futures, etc. In this context, the manager may adopt strategies which primarily aim to anticipate or hedge the UCITS against the risk of default by one or more issuers or to expose the portfolio to the credit risks of one or more issuers. These strategies will be implemented by purchasing or selling protection via credit default swap credit derivatives, on a single reference entity or on indices (iTraxx or CDX). The UCITS will not use total return swaps.

6
In order to limit significantly the total counterparty risk of instruments traded over the counter, the management company may receive cash collateral which will be deposited with the custodian and will not be reinvested.
Risks in which the manager intends to trade: - Interest rate risk; - Equity risk; - Currency risk (primarily on non-convertible currencies); - Credit risk; - Commodity risk (up to a limit of 10% of assets); and components and/or parameters of these risks (including volatility).
Nature of actions: - Hedging; - Exposure; - Arbitrages.
The UCITS may invest in any type of financial contract traded on international regulated, organised or over-the-counter markets.
Strategy for using derivatives: - Hedging the portfolio against certain risks or exposing it to certain risks/asset classes; - Building synthetic exposure to assets, risks and/or parameters or components of these asset classes and risks; - Increasing exposure to the market.
The maximum commitment under such transactions shall meet the limits set for absolute VaR using the Value-at-Risk calculation method, capped by regulations at 20% of the assets with a threshold of 99% over 20 business days.
Securities with embedded derivatives The UCITS may use securities with embedded derivatives in accordance with the same procedures and the same objectives as those referred to above for financial contracts. The UCITS may hold 25% of its net assets in convertible bonds.
Cash borrowings The UCITS is not intended to be a cash borrower. However, a liability position may exist from time to time as a result of transactions associated with the UCITS’ cash flow (investments and divestments in progress, subscription/redemption transactions, etc.), up to a limit of 10% of the net assets.
Temporary transactions involving the purchase and disposal of securities In order to achieve efficient portfolio management and without deviating from its investment objectives, the UCITS may make temporary purchases and sales of securities involving eligible financial securities or money market instruments, up to 100% of its net assets. More precisely, these transactions will consist of repurchase and reverse repurchase agreements linked to interest-rate and credit products of eurozone countries, and will be carried out in the context of cash management and/or the optimisation of the UCITS’ income. The expected proportion of assets under management that will be the subject of such a transaction will be 10% of the net assets. The counterparties of these transactions are first-rate credit institutions domiciled in OECD countries that have a minimum rating of investment grade (rating greater than or equal to BBB- by Standard & Poor’s or equivalent, or a rating deemed equivalent by the management company). These counterparties do not have any influence on the composition or management of the UCITS portfolio. In order to limit significantly the total counterparty risk of instruments traded over the counter, the management company may receive cash collateral which will be deposited with the custodian and will not be reinvested. Further information on the remuneration for temporary sales and purchases of securities is provided in the ‘Charges and Fees’ section.

7
Deposits The UCITS may deposit up to 20% of its net assets with the custodian.
• RISK PROFILE Your money will be invested primarily in financial instruments selected by the management company. These instruments will be subject to market trends and fluctuations. The risk factors described below are not exhaustive. It is the responsibility of each investor to analyse the risk associated with such an investment and to form their own opinion independently of the Edmond de Rothschild Group by obtaining as much specialist advice on such matters as is necessary to ensure that this investment is appropriate for their financial and legal position and investment horizon.
- Risk of capital loss: The UCITS does not offer any guarantee or protection; investors may, therefore, not recover the full amount of the capital initially invested, even if they retain the units for the whole of the recommended investment period.
- Discretionary management risk: The discretionary management style is based on anticipating trends in the various markets (equities, bonds, money market, commodities and currencies). There is a risk that the UCITS may not be invested in the best-performing markets at all times. The performance of the UCITS may therefore fall below the management objective and the drop in its net asset value may lead to negative performance.
- Credit risk: The main risk linked to debt securities and/or money market instruments such as treasury bills (BTFs and BTANs) or short-term negotiable securities is that of issuer default, due either to the non-payment of interest and/or the non-repayment of capital. Credit risk is also associated with the downgrading of an issuer. Unitholders are reminded that the net asset value of the UCITS is likely to fall if a total loss is recorded on a financial instrument following default by an issuer. The inclusion of debt securities in the portfolio, whether directly or through UCIs, exposes the UCITS to the effects of variations in credit quality.
- Credit risk linked to investing in speculative securities: The UCITS may invest in issues from companies rated as non-investment grade by a rating agency (with a rating below BBB- according to Standard & Poor’s or equivalent) or with an equivalent internal rating issued by the management company. These issues are known as speculative securities and present a higher risk of issuer default. This UCITS should therefore be considered to be partly speculative and intended specifically at investors aware of the risks inherent in investing in such securities. As a result, the use of High Yield securities (speculative securities with a higher risk of issuer default) may incur a greater risk of a fall in the net asset value.
- Interest rate risk: Exposure to interest rate products (debt securities and money market instruments) makes the UCITS sensitive to interest rate fluctuations. Interest rate risk might result in a fall in the value of the security and, therefore, the net asset value of the UCITS, in the event of a change in the yield curve.
- Risks associated with investing in emerging markets: The UCITS may be exposed to emerging markets. In addition to the individual risks of each issuing company, there are also external risks, particularly in these markets. Furthermore, investors are reminded that the operating and oversight conditions in these markets may differ from the standards that prevail on major international exchanges. As a result, holding these securities may increase the portfolio’s risk level. A fall in the market may thus be more pronounced and rapid than in developed countries, the net asset value may fall further and more rapidly, and finally, the companies held in the portfolio may have governments as shareholders.

8
- Currency risk: Capital may be exposed to currency risk when the securities or investments of which it is composed are denominated in a currency other than that of the UCITS. Currency risk corresponds to the risk of a drop in the exchange rate of the listing currency of financial instruments in the portfolio against the benchmark currency of the UCITS, the euro, which may result in a drop in the net asset value.
- Equity risk: The value of a share may vary as a result of factors related to the issuing entity but also as a result of external, political or economic factors. Fluctuations in the equity and convertible bond markets, the performance of which is partly correlated with that of the underlying equities, may lead to substantial variations in the net assets, which could have a negative impact on the performance of the UCITS’ net asset value.
- Risk associated with financial and counterparty contract commitments: The use of financial contracts may incur the risk of a sharper, more abrupt fall in the net asset value than in the markets in which the UCITS invests. Counterparty risk results from the use by the UCITS of financial contracts traded on over-the-counter markets and/or temporary purchases and sales of securities. Such transactions potentially expose the UCITS to the risk of counterparty default and the possible risk of a decrease in its net asset value.
- Liquidity risk: The markets in which the UCITS trades may occasionally be affected by a lack of liquidity. These market conditions may affect the prices at which the UCITS may have to liquidate, initiate or modify positions.
- Risk associated with derivatives: The UCITS may use of financial futures (derivatives). The use of financial contracts may incur the risk of a sharper, more abrupt fall in the net asset value than in the markets in which the UCITS invests.
- Risks associated with arbitrage: The UCITS may invest in UCIs that are able to take positions on the futures markets. However, financial market trends may turn out to be contrary to those anticipated by the tools used by underlying UCIs, which may cause the net asset value to fall.
- Risks linked to temporary purchases and sales of securities: The use of these transactions and the management of their collateral may involve certain specific risks such as operational risks or custody risk. These transactions may therefore have a negative effect on the net asset value of the UCITS.
- Legal risk: This is the risk of inadequately drafting contracts concluded with counterparties for temporary purchases and sales of securities.
• GUARANTEE OR PROTECTION None.
• TARGET SUBSCRIBERS AND TYPICAL INVESTOR PROFILE C, CHF, E and P units: All subscribers. E units are specifically sold by distributors selected by the management company. I, ICHF H, S and U units: All subscribers, specifically legal entities and institutional investors. This UCITS is specifically intended for investors seeking a balanced investment, decorrelated over the recommended investment period, on the main equity and bond markets.

9
For individuals, any investment in this UCITS should be made as part of a strategy to build a balanced portfolio, which is exposed to the equity and bond markets. CR units: All subscribers; these units may be marketed to retail investors (non-professional or professional) exclusively in the following cases: - Subscription as part of independent advice provided by a financial advisor or regulated financial entity, - Subscription as part of non-independent advice, with a specific agreement that does not authorise them to receive or retain trailer fees - Subscription by a financial entity regulated on behalf of its client as part of a management mandate, In addition to the management fees charged by the management company, each financial advisor or regulated financial entity may be liable to pay the management or advisory fees incurred by each investor. The management company is not party to such agreements. Units are not registered for marketing in all countries. They are therefore not open to subscription for retail investors in all jurisdictions.
The person responsible for ensuring that the criteria related to the ability of subscribers or purchasers have been observed and that they have received the required information is the person entrusted with effectively implementing marketing for the UCI.
The units of this UCITS are not and will not be registered in the United States under the US Securities Act of 1933 as amended (“Securities Act 1933”) or under any other law of the United States. These units may not be offered, sold or transferred to the United States (including its territories and possessions) or benefit, directly or indirectly, any US Person (as defined by Regulation S of the Securities Act 1933).
The amount which is reasonable to invest in this UCITS depends on your individual circumstances. To determine this amount, investors are advised to seek professional advice in order to diversify their investments and determine the proportion of their financial portfolio or assets to be invested in this UCITS, more specifically in view of: the recommended investment period; exposure to the aforementioned risks; their personal wealth; their requirements; and to their specific objectives. In any event, unitholders must diversify their portfolio sufficiently to avoid being exposed solely to the risks of this UCITS.
- Minimum recommended investment period: 18 months.

10
2. CHANGES AFFECTING THE UCI
1- Various regulatory and other changes made, and performance updated to 31/12/2016, rates of charges and fees updated on 31/12/2016, change to front-end fees and VaR updated on 07/02/2017.
2- EdRAM Suisse established a financial delegation on 01/07/2017.
3- The option of investing in Short-Term bonds graded “High Yield” was added on 04/09/2017.
4- Creation of J and CR units, change made to the management objective, removal of the “Diversified” classification and various regulatory and other changes on 29/12/2017.

11
3. MANAGEMENT REPORT
January Bond market trends in January varied by geographic region. As a result, while rates generally tightened across all yield curves, U.S. bond markets were the clear outperformer. Indeed, this month was marked by Donald Trump taking office in the United States and the controversial statements from the new president on economic or political matters generated a great deal of volatility on the currency market. As a result, the greenback depreciated which impacted U.S. government rates causing them to remain relatively stable while European rates tightened. Ongoing U.S. monetary tightening was not called into question, as illustrated by the words of Janet Yellen herself in January when she emphasised that the U.S. economic situation was close to the Fed’s objectives, both in terms of employment and inflation. In Europe, the markets were marked by the widening of yield spreads on most government debt when compared to Germany. France saw its spread widen as result of the many uncertainties about the candidates for the next presidential election. Italy suffered as a result of the Constitutional Court’s decision to approve partial changes to the electoral and employment laws; this illustrated the difficulties of reforming the country on the one hand and increased the risk of early elections being called on the other. Portugal suffered from the resurgence of peripheral risk aversion, made worse by the pressure placed on Greece by the Eurogroup. Over the month credit spreads for corporate debt remained stable in the Investment Grade class and widened for the High Yield class.
February Bond markets posted a sound performance in February. In fact, there was an upsurge of 11 basis points in U.S. 10-year rates which ended the month at 2.34% and against this backdrop German and U.K. bond markets outperformed by posting performances of 1.7% and 2.3% on 10-year maturities, respectively. This can partly be explained by the willingness of the U.S central bank to tighten policy on a gradual basis and by the European Central Bank still maintaining a very accommodative policy on the purchase of sovereign and corporate bonds as a result of core inflation still being far below its inflation target. The month of February also saw the resurgence of political risk particularly in France with the fear that Marine Le Pen might win the second-round run off in the Presidential elections. This led to a widening of “French spreads” by more than 20 basis points over the month until Emmanuel Macron widely beat François Fillon in terms of voting intentions for the first and second rounds. This volatility in sovereign bonds had noticeably little impact on the European credit markets as both high-quality and high-yield credit posted performances of more than 1% during the month. Lastly, despite reassuring statements on the health of the U.S. economy, emerging markets continued their strong growth with a more than 3.5% performance since the beginning of the year, indicating investors still had a significant appetite for this asset class.
March Under the effect of encouraging economic indicators and reduced political risk, the month of March was marked by pressure on European rates for “core” countries. With the French elections looming, political risk had previously caused a reduction in German rates since the debt of the Federal State, identified as the least risky in Europe, had served as a safe haven when the market took into account the risk that populist votes might win. The reassuring result of the Dutch elections and the Macron’s lead in the polls against Le Pen in France soothed the markets, thereby allowing German rates to rise. Spreads on government bonds narrowed in relation to Germany for most countries. Greece also benefited from positive developments in the negotiations with its creditors. The short part of the German yield curve also tightened under the effect of very good economic indicators. Confidence indices in particular continued to rise. Alongside a sharp rise in inflation in February, the market began to speculate on a change of tone from the ECB, which could soon find reason to adopt a less accommodative monetary policy by the end of the year.

12
As a result, the last TLTRO saw a high take-up; it highlighted the appetite of banks for this type of measure and showed in particular that they expect fewer to come in the future. U.S. rates were relatively stable over the month while the Federal Reserve once again increased its key rates. This monetary tightening was completely expected by the market and statements by U.S. central bankers prepared the yield curve for a very gradual rate rise during the next two years. Against this backdrop, buoyed by strong government rate movements, corporate credit spreads showed little signs of volatility and tightened slightly. Emerging country debt again outperformed the other classes of bond assets.
April It was politics that governed the bond markets during this month with the ECB meeting of 27 April reflecting the status quo. The possibility of a Mélenchon/Le Pen run off, with either extreme placing a question mark over Europe, firstly increased risk premiums to their highest levels in a year with a 10-year French-German spread at more than 75 bps before they came back down to within touching distance of their lowest levels at around 50 bps following the results of the 1st round in which the pro-European Macron came out on top. During the month, German rate levels remained broadly stable while French rates tightened by 13, 23, 22 and 18 bps on maturities of 2, 5, 10 and 30 years, respectively. Investment-grade rates for peripheral countries followed suit to a lesser degree with Portugal and Greece seeing the most benefit, bolstered by Greece signing an agreement with its creditors to unlock the next tranche of its bailout that also raised the possibility of the IMF being included in the programme. This situation also benefited the credit market, particularly in subordinated financials and high-yield bonds, which outperformed sovereign bonds.
May The month of May was marked by a respite from political risk in Europe. In fact, Emmanuel Macron’s win in France helped to reassure investors that the populist wave on the shores of the eurozone might yet be held back. This enabled premiums on the high-yield and subordinated financials markets to tighten to within 10 to 20 basis points. Furthermore, economic indicators continued to paint a picture of confidence amongst business leaders underpinned by encouraging growth figures. Despite this positive environment, long-term rates in the eurozone were surprisingly stable with, for example, the 10-year German rate ending the month unchanged after fluctuating within a range of 15 basis points. This can largely be explained by slightly negative surprises on the inflation front coupled with official statements from the ECB in which it considered its ultra-accommodative policy for the eurozone to be just as necessary as ever. In terms of specific circumstances, Portugal and Greece enjoyed notably positive performances which can be explained by an improving economic and financial outlook on the one hand and by the significant likelihood of an agreement on debt relief on the other. In the United States, by contrast, political risk somewhat increased with almost daily revelations about President Trump’s conduct and the growing risk of impeachment which risked calling into question the market euphoria surrounding the prospects for the U.S. economy and any future rate hikes. In fact, 10-year U.S. rates plunged to their lowest depths since the beginning of the year, declining 12 basis points during the month. The same outperformance of U.S. rates compared to European rates can be seen in the way the euro rose against the greenback. Furthermore, the Federal Reserve reiterated via the report of its last meeting that the reduction in its balance sheet would be extremely gradual, reassuring investors about the risks of disorderly rate rises.
June While the ECB meeting at the start of the month slightly bolstered rates with its statements emphasising that European inflation was still below its target and supporting a more gradual reduction of its QE purchases than markets had expected, Mario Draghi’s announcement at the end of the month about reflationary forces overtaking deflationary forces completely reversed this trend. This reversal was also backed by the Bank of England where the decision to hold rates at their current level was agreed by 5 votes, with 3 votes in favour of a rate rise. Although in favour of holding rates at their present level, Mark Carney subsequently evoked a possible rate rise once business investment began to pick up. The Fed on the other hand surprised no-one with its 25 bps increase which was in line with the details it had given on the terms of reducing its purchase programmes. German, U.K and U.S. 10-year rates increased by 15, 21 and 9 bps respectively during the month. Against this backdrop, high-yield rates held their ground well.

13
Peripheral rates were bolstered by the prospect of more significant QE than expected, particularly for Italy, which saw its 10-year rate tighten by 3 bps during the month after suffering at the start of the month from the ultimately remote prospect of early legislative elections being called, and which, much like the financial sector as a whole, also benefited from the positive view of the government towards recapitalising Veneto Banca and Banco Popolare di Vicenza. Greek 5-year interest rates narrowed significantly by 200 bps during the month thanks to the agreement reached with the Troika on releasing the final tranche of its bailout.
July The month of July was marked by an overall lull in the bond markets. In fact, following his statements on the future of Quantitative Easing at the end of June, at the meeting of the European Central Bank in July, Mario Draghi rather reassured markets by citing weak inflation as proof of the need for the ECB’s support. This was essentially the same reassuring statement given by Janet Yellen at the meeting of the Federal Reserve where she noted that inflation was under the target set but that this would not prevent the bank from soon beginning to reduce its balance sheet. Against this backdrop, 10-year U.S. rates dropped 1 basis point during July closing at 2.29%, while the 10-year German rate came slightly under pressure during the month. In this reassuring climate, rates on peripheral government bonds as well as the credit markets outperformed the markets for government rates. In fact, peripheral government as well as investment-grade & high-yield credit indices recorded increases of between 0.5% and 1.2%. Similarly, emerging countries continued to post excellent performances as a result of exceptional flows into asset classes with performance since the beginning of the year standing at 6.9%. Lastly, the equity component, represented by convertible bonds, suffered notably in July in the wake of setbacks to European equity markets caught off guard by the appreciating currency.
August The month of August was marked by a sharp easing of government interest rates for core countries: the U.S. and German rates fell 13 to 18 bps on maturities of greater than 5 years. The main reason for this was their role as a safe haven in a heavy climate of tensions between the United States and North Korea. The escalating war of words between the leaders of these two countries, followed by North-Korean missile tests, weighed heavily on risky assets which brought about a widening of credit spreads, a fall in equity markets and a rise in U.S. and German sovereign bonds. The latest reports on monetary policy, the non-announcements following the latest conference for central bankers at Jackson Hole and the latest inflation figures to be published were all factors that the market interpreted as accommodating and which eased expectations of a slowdown in European Quantitative Easing European and a hike in key interest rates on the other side of the Atlantic. The ECB was to wait until September, or even October, to announce the planned pace of its bond purchases for next year. In fact, it was more concerned by an appreciating euro, which was having the same effect on the European economy as monetary tightening. Of note in August was the widening of spreads for peripheral sovereign debts. Spanish debt was impacted by the potential consequences that the terrorist attack in Barcelona was seen to have on tourism in the Iberian Peninsula. Italian debt suffered from comments made by Berlusconi on the possibility of a currency running parallel to the euro, bringing as they did the prospect of uncertain elections at the beginning of 2018 back into focus. Emerging-market bonds continued to gain ground with these markets being bolstered by a strong appetite from investors as well as sound fundamentals. In line with the behaviour of equity markets, convertible bonds underperformed the other classes of bond assets.
September While the Bank of England adopted a more aggressive tone on rate rises and with the deadlock on Brexit negotiations seemingly broken, European and U.S. central banks confirmed their intention to gradually pursue normalisation: the ECB delayed its announcement on the future pace of its securities purchases until its next committee meeting and the Fed announced it was to begin reducing the size of its balance sheet and confirmed rates would rise gradually over the coming quarters. As a result, U.K. 10-year rates underperformed their peers with a rise of 33 bps, followed by U.S. rates with a rise of 21 bps and then German rates with a rise of 11 bps. All peripheral rates were relatively resilient to these rate pressures with Portuguese and Slovenian rates narrowing in response to a favourable ratings upgrade, especially so for Portuguese rates with S&P upgrading its rating to “Investment Grade” and a tightening of 39 bps for its 10-year maturities.

14
With this upward movement in rates, credit markets were more resilient than sovereign bonds while emerging-country rates remained broadly stable and convertible bonds were the clear outperformers.
October The month of October was marked by a strong disconnect between the various bond markets, with pressure on U.S. rates and European rates easing sharply. In the United States, economic indicators once again moved very much in the right direction. Confidence indices, such as the ISM for example, were at ten-year highs, the jobs market continued to post a fall in the unemployment rate and wage rises were slightly better than expected. As a result, U.S. rates continued to rise, especially on the shortest maturities with the next likely increase in key interest rates from the Fed now strongly expected in December. In Europe, rates for core countries benefited from a monetary policy still deemed to be very accommodating and peripheral countries were bolstered by a de-escalation of the Catalan crisis and good news coming out of Italy. Investment-grade and high-yield corporate bonds both benefited from these supporting factors but the best performing asset class was the subordinated financial bonds segment. The ECB announced a recalibration of its Quantitative Easing programme which was extended up until September 2018, albeit with lower monthly purchases of EUR 30 billion. Although markets had anticipated such a measure, Mario Draghi managed to present this next stage as very accommodating by drawing attention to the significant size of the coupon reinvestments and their maturities. In Italy, the bond market benefited from its S&P rating being upgraded to BBB and also significant progress in the implementation of the new electoral law.
November Despite virtually neutral performances across all bond markets, the month of November was marked by a period of volatility and pressures on the credit spreads of both emerging and developed countries. In early November, Venezuela notably announced its intention to restructure its external debt although, at the same time, the Treasury continued to reimburse various maturities in principal and via coupons. This news had been expected for many weeks, if not months, and therefore had no significant impact on the markets. However, after more than 18 months of positive performances on the credit markets in Europe and in the United States, there came a wave of profit-taking alongside a wave of volatility for certain large-scale issuers who were running into some difficulties as was the case for Altice. This brought about falls of more than 1% during the month, particularly on the credit markets. Movements on yield curves were fairly measured in absolute terms as the 10-year U.S. rate ended 2 bps higher and the 10-year German rate remained stable. However, it was intra-curves movements that were of most interest as, for example, the U.S. curve flattened by more than 15 bps on maturities of 5-30 years in a climate of gradual rate rises with no visible sign of inflation following suit. Similarly, the European curve flattened nearly 10 bps over the same maturities owing to official statements from the ECB weakening the belief in rates remaining low much beyond the end of Quantitative Easing.
December During the first two weeks of December, the main central banks gave their assessments on the state of the economy, growth prospects and inflation expectations. Of real interest was the view of central bankers that essentially, in the eurozone and the United States, growth will pick up in 2018 thanks to better fundamentals in Europe and the fiscal reform of the U.S. Congress. However, nor do central banks believe that inflation will climb any higher in 2018, which is fairly surprising. The attitude may explain a rise in global rates particularly 0.30% to 0.43% on 10-year German maturities and 2.14% to 2.22% on 5-year U.S. maturities. The credit markets continued to be immune to this change in tone from central banks and posted a stellar year-on-year performance with very low volatility. On the political landscape, in Catalonia, the 3-party separatist bloc came out on top, but the largest single party was still the unionists which simply served to maintain the status quo as Madrid called for peaceful negotiations. At the same time, in Italy, the president dissolved the parliament and called an election for 4 March. The first polls clearly showed that negative sentiment towards the eurozone was making inroads. This caused the 10-year Italian spread to widen by 20 basis points compared with Germany.

15
The ICHF H unit denominated in CHF posted a performance of 0.09% over the year, compared with -0.80% for its benchmark index. The P unit denominated in USD posted a performance of 2.21% over the year, compared with 1.00% for its benchmark index. The I unit denominated in EUR posted a performance of 0.79% over the year, compared with -0.36% for its benchmark index. The C unit denominated in EUR posted a performance of 0.50% over the year, compared with -0.36% for its benchmark index. The E unit denominated in EUR posted a performance of 0.24% over the year, compared with -0.36% for its benchmark index. The S unit denominated in EUR posted a performance of 0.88% over the year, compared with -0.36% for its benchmark index. The U unit denominated in USD posted a performance of 2.63% over the year, compared with 1.00% for its benchmark index.
Past performance is not an indication of future performance.
Main changes to the portfolio during the financial year
Securities Changes (“Accounting currency”)
Purchases Sales
Edmond de Rothschild Credit Very Short Term R 85,176,823.93 46,880,229.12
ITALIE 5.50% 11/22 21,292,068.67 0.00
GEN DE CATALUNYA 4.95% 10-20 13,081,624.99 5,388,319.18
EDMOND DE ROTHSCHILD FUND US IG CORPORATE BONDS I USD
15,639,518.83 0.00
EDMOND DE ROTHSCHILD FINANCIAL BONDS I 3,723,682.40 10,886,669.82
EDMOND DE ROTHSCHILD FINANCIAL BONDS R 14,334,833.40 0.00
CAPGEMINI SE 0.5% 09-11-21 8,407,510.64 5,529,110.82
SPGB 4.4% 10/31/23 12,257,986.30 0.00
ALLGRP 6 1/4 12/01/21 5,030,057.28 5,957,723.36
HELLENIC T-BILL ZCP 081217 5,375,740.00 5,400,000.00

16
Efficient portfolio management techniques and derivative financial instruments
a) Exposure obtained through efficient portfolio management techniques and derivative financial instruments
• Exposure obtained through efficient portfolio management techniques: None. • Underlying exposure obtained through derivative financial instruments: 17.59%.
b) Identity of the counterparty/counterparties to efficient portfolio management techniques and derivative financial instruments
Efficient management techniques Derivative financial instruments (*)
BNP PARIBAS SECURITIES EDMOND DE
ROTHSCHILD (France) BANQUE
NATIONALE DE PARIS BRUX ANZ
BANKING GROUP LTD MELBOURNE
(*) Except listed derivatives c) Collateral received by the UCITS in order to reduce counterparty risk
Types of instruments Amount in the portfolio currency
Efficient management techniques
. Term deposits
. Equities
. Bonds
. UCITS
. Cash (**)
Total
Derivative financial instruments
. Term deposits
. Equities
. Bonds
. UCITS
. Cash
Total
(**) The Cash account also includes liquidity resulting from repurchase transactions.

17
d) Operating income and expenses linked to efficient management techniques
Operating income and expenses Amount in the portfolio currency
. Income (***)
. Other income
Total income
. Direct operating expenses
. Indirect operating expenses
. Other expenses
Total expenses
(***) Income received on loans and repurchase agreements

18
SECURITIES FINANCING TRANSACTION REGULATION (“SFTR”)
During the year, the UCI was not involved in transactions subject to Regulation (EU) 2015/2365 on the transparency of securities financing transactions and of reuse (“SFTR Regulation”).

19
4. STATUTORY INFORMATION
• METHOD FOR CALCULATING TOTAL RISK (AMF INSTRUCTION No. 2011-15 – ARTICLE 16) The UCITS uses the value at risk calculation method to calculate the UCITS’ overall risk on financial contracts. The maximum commitment under these transactions respects the limits set for absolute VaR using the Value-at-Risk calculation method, capped by regulations at 20% of the net assets, with a limit of 99% for 20 working days.
During the last accounting period, the VaR of the UCITS changed as follows: - the minimum VaR was 1.15% on 26/05/2017.
- the maximum VaR was 3.66% on 14/03/2017;
- the average VaR for the financial year was 1.66%. The UCITS’ indicative level of leverage, calculated as the aggregate absolute value of the nominal positions on financial contracts, was 83.02%. The UCITS may achieve a higher level of leverage. It is worth noting that this method, which consists of aggregating the absolute value of nominal amounts, in reality shows the gross exposure.
• INFORMATION ON TRANSACTIONS INVOLVING SECURITIES IN WHICH THE GROUP HAS SPECIAL INTERESTS This information is available in the annual financial statements in the section: GROUP FINANCIAL INSTRUMENTS HELD IN THE PORTFOLIO.
• POLICY FOR SELECTING INTERMEDIARIES AND COUNTERPARTIES In accordance with Article 314-72 of the AMF General Regulations, the management company has introduced a “Best Selection/Best Execution Policy” for intermediaries and counterparties. The purpose of this policy is to select, according to various predetermined criteria, the brokers and intermediaries whose execution policy will achieve the best possible results when executing orders. The policy is available for consultation on the Edmond de Rothschild Asset Management (France) website at www.edram.fr.
• REPORT ON INTERMEDIATION FEES In accordance with Article 314-82 of the AMF General Regulations, the Management Company has drawn up a ‘Report on intermediation fees’ document, This document is available on the Edmond de Rothschild Asset Management (France) website: www.edram.fr.
• COMMUNICATION OF ENVIRONMENTAL, SOCIAL AND GOVERNANCE QUALITY (ESG) CRITERIA
Information about ESG criteria is available on the website at www.edram.fr. • REMUNERATION POLICY AND PRACTICES APPLICABLE TO THE MANAGER’S PERSONNEL The Edmond de Rothschild Asset Management (France) remuneration policy complies with the provisions of European Directive 2009/65/EC (“UCITS V Directive”) and Article 314-85-2 of the AMF General Regulations which apply to UCITS funds. The remuneration policy promotes the sound and effective management of risks and does not encourage risk-taking that would be inconsistent with the risk profiles of the UCITS it manages. The management company has implemented adequate measures to prevent any conflict of interest.
For all employees of the management company considered to have a material impact on the risk profile of UCITS funds (“MRT” or material risk-takers), and annually identified as such through a process involving the Human Resources, Risk, and Compliance teams, the remuneration policy specifies that part of their variable remuneration (which must remain in reasonable proportion to their fixed remuneration) is deferred over three years. This deferral, for employees exceeding a minimum threshold, varies from a minimum of 40% to 60% depending on the variable level.

20
Furthermore, a portion of the variable remuneration for these employees will be indexed to the change in the value of a mixed basket of financial instruments that is representative of the AIFs and UCITS managed by the management company and its affiliates. The deferred variable remuneration will therefore comprise, for MRT employees, at least 50% of cash indexed to the basket of instruments, and at most 50% of other deferred elements (Group Long Term Incentive Plan or, as applicable, deferred cash).
Information in the management company’s annual report as at 31/12/2016: Total amount of remuneration In accordance with Article 107 of delegated regulation 231/2013 of 19 December 2012, the total amount of remuneration corresponds to the total remuneration of the entire staff of the management company with 191 beneficiaries. This total amount for the financial year 2016–2017 was EUR 27,719,370 including a fixed component of EUR 18,039,441, a variable component of EUR 9,679,928 and a profit share in capital gains of EUR 0.
Aggregate Amount of Remuneration
In accordance with Article 33 of AMF Instruction 2011-20 and Article 22 of Directive 2011/61/EU of 8 June 2011, the aggregate amount of the remuneration, broken down between senior executives and staff members of the Management Company whose activities have a material impact on the risk profile of the AIF corresponds for financial year 2016–2017 to:
- Senior executives: €2,180,039
- Staff members: €16,082,695

21
5. STATUTORY AUDITOR’S CERTIFICATION

22
KPMG S.A. Registered office
Telephone: Fax:
+33 (0)1 55 68 86 66 +33 (0)1 55 68 86 60
Tour EQHO Website: www.kpmg.fr
2, avenue Gambetta
CS 60055
92066 Paris La Défense Cedex
France
French Mutual Fund EDMOND DE ROTHSCHILD START
47 rue du Faubourg Saint-Honoré, 75008 Paris, France
Statutory auditor’s report on the annual financial statements
Financial year ended 29 December 2017
Dear Sir, Madam,
Opinion
In execution of the mission entrusted to us by the management company, we carried out the audit of the annual financial statements of the EDMOND DE ROTHSCHILD START Mutual Fund for the year ended 29 December 2017, as attached to this report.
We certify that the annual financial statements are, in conformity with French accounting rules and principles, accurate and consistent, and give a true and fair view of the financial performance of the previous financial year as well as the financial situation and assets of the Mutual Fund at the end of the financial year.
Basis of opinion
Audit framework
We conducted our audit in accordance with the professional auditing standards applicable in France. We believe that the evidence gathered is sufficient and appropriate to justify our opinion.
Our responsibilities pursuant to these standards are set out in the “Statutory auditor’s responsibilities relating to the audit of annual financial statements” section of this report.
Independence
We have conducted our audit assignment in line with the applicable rules of independence, from 31 December 2016 until the date of issue of our report, and in particular we have not provided any services forbidden by the French Code of Ethics for Statutory Auditors.
KPMG S.A., a French company and member firm of the KPMG network of independent firms affiliated with KPMG International Cooperative, a Swiss entity.
Société Anonyme (Public limited company) with management and supervisory boards, providing accounting, auditing and consulting services. Registered with the Paris Tableau de l’Ordre [accounting firm register] under no. 14-30080101 and member of the Versailles Compagnie Régionale des Commissaires aux Comptes [regional association of statutory auditors].
Registered office: KPMG S.A. Tour Echo 2, avenue Gambetta 92066 Paris La Défense Cedex Share capital: €5,497,100. APE code: 6920Z Trade and Companies Register No. 775 726 417 Nanterre NA European Union FR 77 775 726 417

23
French Mutual Fund
EDMOND DE ROTHSCHILD START Statutory auditor’s report on the annual financial statements
11 April 2018
Justification of assessments In accordance with the provisions of Article L. 823-9 and R. 823-7 of the French Commercial Code relating to the justification of our assessments, we would inform you that the most significant assessments we conducted in our view were based on the appropriateness of the accounting principles applied, on the reasonableness of the significant estimates used, and on the overall presentation of the financial statements, pursuant to the Chart of Accounts for open-ended undertakings for collective investment, in particular regarding the financial instruments held in the portfolio.
The assessments were made as part of our audit of the annual financial statements, taken as a whole, and therefore contributed to the formation of the opinion expressed in the first part of this report. We do not express an opinion on items in the annual financial statements taken individually.
Audit of the management report and other documents sent to unitholders We have also performed the specific verifications as required by law in accordance with professional auditing standards applicable in France.
We have no comment to make concerning the accuracy and consistency with the annual financial statements of the information given in the management report and in the documents sent to unitholders concerning the financial position and the annual financial statements.
Responsibilities of the management company relating to the annual financial statements It is the management company’s responsibility to prepare annual financial statements that give a true and fair view, in accordance with French accounting rules and principles, and to implement the internal controls it deems necessary for the preparation of annual financial statements that do not include any material misstatement, whether due to fraud or error.
In preparing the annual financial statements, it is the management company’s responsibility to assess the mutual fund’s ability to continue as a going concern, and if need be, to present in these financial statements the necessary information relating to its viability as a going concern, and to apply the going concern accounting policy, unless the mutual fund is scheduled to be wound up or closed.
The annual financial statements were prepared by the management company.
Statutory Auditor’s responsibilities regarding the audit of the annual financial statements
It is our responsibility to draft a report on the annual financial statements. Our aim is to obtain reasonable assurance that the annual financial statements taken as a whole do not contain any material misstatement. Reasonable assurance corresponds to a high level of assurance, but does not guarantee that an audit performed in accordance with the standards of professional practice will systematically detect any material misstatement.Misstatements may arise from fraud or error and are considered material where it can reasonably be expected that, taken individually or together, they may influence the economic decisions made by account users based thereon.

24
French Mutual Fund
EDMOND DE ROTHSCHILD START Statutory auditor’s report on the annual financial statements
11 April 2018
As specified by Article L. 823-10-1 of the French Commercial Code, our mission is to certify the financial statements, and not to guarantee the viability or the quality of the management of your Mutual Fund.
As part of an audit performed in accordance with the professional standards applicable in France, the statutory auditors exercise their professional judgement for the duration of THIS audit. In addition:
• they identify and assess the risks that the annual financial statements may contain material misstatement, whether due to fraud or error, set out and implement the audit procedures intended to counter these risks, and collate the items that they deem sufficient and appropriate to justify their opinion. The risk of not detecting a material misstatement arising from fraud is higher than that of a material misstatement resulting from an error, since fraud may involve collusion, forgery, voluntary omissions, false statements or the bypassing of internal controls;
• they take note of the internal control processes relevant to the audit so as to set out audit procedures that are appropriate to the circumstances, and not to express an opinion on the effectiveness of the internal control processes;
• they assess the appropriateness of the accounting policies used and the reasonableness of the accounting estimates made by the management company, as well as the information provided in their regard in the annual financial statements;
• they assess the appropriateness of the application by the management company of the going concern accounting policy and, based on the evidence gathered, whether or not significant uncertainty exists relating to events or circumstances that may affect the Mutual Fund’s ability to continue as a going concern. This assessment is based on the information gathered up to the date of their report, on the understanding that subsequent events or circumstances may affect its viability as a going concern. If they conclude that significant uncertainty exists, they draw the report reader’s attention to the information provided in the annual financial statements about this uncertainty or, if this information is not provided or is not relevant, they issue a certification with reserve or a refusal to certify;
• they assess the overall presentation of the annual financial statements and whether they reflect the transactions and underlying events so as to provide a true and fair view thereof.
Paris La Défense, 11 April 2018
KPMG S.A.
[signature]
Gérard Gaultry
Partner

25
6. ANNUAL FINANCIAL STATEMENTS
• BALANCE SHEET in EUR
ASSETS
29/12/2017 30/12/2016
Net fixed assets
Deposits
Financial instruments 799,537,300.55 277,597,776.24 Equities and equivalent securities
Traded on a regulated or equivalent market
Not traded on a regulated or equivalent market
Bonds and similar securities 646,773,177.79 231,278,252.30 Traded on a regulated or equivalent market 646,773,177.79 231,278,252.30 Not traded on a regulated or equivalent market
Debt securities 65,223,129.12 16,998,652.08 Traded on a regulated or equivalent market 50,201,467.50 8,001,568.48 Negotiable debt securities 40,187,291.88 8,001,568.48 Other debt securities 10,014,175.62
Not traded on a regulated or equivalent market 15,021,661.62 8,997,083.60 Undertakings for collective investment 85,907,204.03 29,089,949.99
General-purpose UCITS and AIFs intended for non-professionals and equivalent investors in other countries
85,907,204.03 29,089,949.99
Other funds intended for non-professionals and equivalent investors in other EU Member States
General-purpose professional funds and their equivalents in other EU Member States and listed special purpose vehicles
Other professional investment funds and their equivalents in other EU Member States and unlisted special purpose vehicles
Other non-European undertakings
Temporary securities transactions
Receivables on securities received under repurchase agreements
Receivables on loaned securities
Borrowed securities
Securities assigned under repurchase agreements
Other temporary transactions
Financial futures 1,633,789.61 230,921.87 Transactions on a regulated or equivalent market 1,565,641.31 230,921.87 Other transactions 68,148.30 Other financial instruments
Receivables 77,230,282.65 38,399,492.09 Forward currency transactions 64,447,323.83 33,306,682.71 Other 12,782,958.82 5,092,809.38 Financial accounts 77,880,814.25 22,684,000.21 Cash and cash equivalents 77,880,814.25 22,684,000.21
Total assets 954,648,397.45 338,681,268.54

26
LIABILITIES
29/12/2017 30/12/2016
Share capital
Capital 870,831,657.34 297,889,799.91 Undistributed prior net gains and losses (a) Balance carried forward (a)
Net gains and losses for the financial year (a, b) -6,419,550.61 -5,718,772.04 Income for the financial year (a, b) 13,931,971.58 7,233,483.53
Total share capital (= amount corresponding to net assets) 878,344,078.31 299,404,511.40 Financial instruments 2,070,441.32 326,361.05
Sales of financial instruments Temporary securities transactions
Payables representing securities received under repurchase agreements
Payables representing borrowed securities
Other temporary transactions Financial futures 2,070,441.32 326,361.05
Transactions on a regulated or equivalent market 1,012,931.88 152,666.60 Other transactions 1,057,509.44 173,694.45
Payables 72,490,913.90 38,837,580.14 Forward currency transactions 65,123,269.03 33,242,981.61 Other 7,367,644.87 5,594,598.53
Financial accounts 1,742,963.92 112,815.95 Current bank borrowings 1,742,963.92 112,815.95 Borrowings
Total liabilities 954,648,397.45 338,681,268.54
(a) Including adjustments
(b) Less interim dividends paid over the financial year

27
• OFF-BALANCE SHEET ITEMS in EUR
29/12/2017 30/12/2016 Hedging transactions
Commitment on regulated or equivalent markets
Commitment on over-the-counter markets
Credit Default Swap
ITXEB526 10,000,000.00
ITXEB526 CURNCY 2,500,000.00
Other commitments
Other transactions
Commitment on regulated or equivalent markets
Futures contracts
CBOT USUL 30A 0318 8,656,468.60
CME AUD/USD 0317 477,971.08
CME BP GBPUSD 0318 70,562.33
CME CME EUR/GBP 0318 125,429.50
CME EUR/$ 1218 61,118,629.25
CME RF EURCHF 0317 124,976.68
CME RF EURCHF 0318 7,869,279.58
CME RY EURJPY 0318 5,508,127.81
CME SP EMINI HE 0317 2,293,955.91
EC EURUSD 0317 9,147,926.05
EC EURUSD 0318 23,632,099.43
ES S&P 500 H7 2,226,129.41
EUR DJES BANKS 0318 2,647,120.00
EUR VSTOXX FUTU 0418 858,375.00
EUR XEUR EUFF M 0317 1,486,560.00
EUR XEUR FOAT E 0317 6,528,260.00
MIF MTAA SPMI F 0318 4,242,615.00
NK NIKKEI 225 0318 3,882,161.89
NYS NYL MSCI EM 0318 3,537,229.35
RP EURGBP H7 125,300.20
SP 500 MINI 0318 21,616,588.94
STX 50 DIV 1218 1,257,120.00
TU CBOT UST 2 0317 8,217,587.11
TY CBOT YST 1 0317 5,184,522.40
TY CBOT YST 1 0318 16,321,957.24
VSTOXX MINI 0118 727,125.00
VSTOXX MINI 0218 1,151,500.00
VSTOXX MINI 0318 551,250.00
XEUR FBTP BTP 0318 136,140.00

28
• OFF-BALANCE-SHEET ITEMS in EUR
29/12/2017 30/12/2016
XEUR FESX DJ 0318 6,042,890.00
XEUR FGBL BUN 0318 6,628,880.00
Options
BTP 10Y 6% 01/2018 PUT 134,5 7,095,707.82
BTP 10Y 6% 01/2018 PUT 135,5 10,001,021.06
BTP 10Y 6% 01/2018 PUT 136,5 13,570,203.68
DJ EURO STOXX 50 01/2018 CALL 3650 870,847.99
DJ EURO STOXX 50 01/2018 PUT 3450 4,727,528.68
DJ EURO STOXX 50 02/2018 CALL 3525 7,917,878.26
DJ EURO STOXX 50 02/2018 CALL 3700 1,210,799.30
GBP/USD CME 02/2018 CALL 135 81,702.72
GBP/USD CME 03/2018 CALL 132,5 107,842.79
Commitment on over-the-counter markets
Interest rate swaps
SWAP6M00 50,856,939.43
Credit Default Swap
ITXEB528 38,500,000.00
Other commitments

29
• INCOME STATEMENT in EUR
29/12/2017 30/12/2016
Income from financial transactions
Income from deposits and financial accounts 9,572.09 5.72
Income from shares and similar securities
Income from bonds and similar securities 11,031,580.11 5,549,121.61
Income from debt securities 46,871.42 11,883.82
Income from temporary purchases and sales of securities
Income from forward financial instruments
Other financial income
Total (1) 11,088,023.62 5,561,011.15
Expenses relating to financial transactions
Expenses relating to temporary purchases and sales of securities
Expenses relating to forward financial instruments
Expenses relating to financial debt 133,408.82 27,262.81 Other financial expenses
Total (2) 133,408.82 27,262.81
Profit/loss on financial transactions (1 - 2) 10,954,614.80 5,533,748.34 Other income (3)
Management fees and amortisation charges (4) 2,919,098.30 1,269,123.19
Net profit/loss for the financial year (L. 214-17-1) (1 - 2 + 3 - 4) 8,035,516.50 4,264,625.15 Income equalisation for financial year (5) 5,896,455.08 2,968,858.38 Interim dividends paid over the financial year (6)
Profit/loss (1 - 2 + 3 - 4 + 5 - 6) 13,931,971.58 7,233,483.53

30
NOTES TO THE FINANCIAL STATEMENTS
ACCOUNTING METHODS AND RULES The annual financial statements are presented in the form stipulated by ANC (Autorité des normes comptables, the French accounting standards authority) Regulation 2014-01, repealing CRC (Comité de réglementation comptable, the French accounting regulation committee) Regulation 2003-02, as amended.
General accounting principles apply: - A true and fair view, comparability and operational continuity; - Lawfulness and fairness; - Prudence;
- Consistency in accounting methods from one financial year to the next.
The recognition method selected for recording the income from fixed-income securities is the interest received method.
Purchases and sales of securities are recognised exclusive of costs. The portfolio’s base currency is the Euro. The length of the financial year is 12 months.
Asset valuation rules
Financial instruments are recorded in the financial statements according to the historical cost method and on the balance sheet at their current value as determined by the last known market value or, where no market exists, by any external means or by the use of financial models. Differences between the current values used to calculate the net asset value and the historical costs of transferable securities when first included in the portfolio are recorded in “valuation differentials” accounts. Investments that are not in the portfolio currency are valued in accordance with the principle set out below and then converted to the portfolio currency on the basis of the exchange rate on the valuation date.
Deposits:
Deposits with a residual maturity of three months or less are valued according to the straight line method.
Shares, bonds and other securities traded on a regulated or equivalent market: For the purpose of calculating the net asset value, shares and other securities traded on a regulated or equivalent market are valued on the basis of the day’s closing market price.
Bonds and equivalent securities are valued at the closing price supplied by various financial service providers. Interest accrued on bonds and equivalent securities is calculated up to the net asset value calculation date. Shares, bonds and other securities not traded on a regulated or equivalent market:
Securities which are not traded on a regulated market are valued by the management company using methods based on market value and yield, taking into account the prices used for recent significant transactions.
Negotiable debt securities:
Negotiable debt securities and equivalent securities which are not traded in large volumes are valued using an actuarial method based on a reference rate, defined below, which is increased, where applicable, by a differential that is representative of the intrinsic characteristics of the issuer:
Transferable debt securities with a maturity of less than or equal to one year: Euro Interbank Offered Rate (Euribor);

31
Transferable debt securities with a maturity exceeding one year: rates for French treasury bills (BTAN and OAT) with similar maturity dates for the longest durations
Negotiable debt securities with a residual maturity of three months or less may be valued using the straight line method.
French treasury bills are valued at the market rate, as published daily by the Banque de France.
UCIs held:
Units or shares of UCIs will be valued at the last known net asset value. Temporary securities transactions: Securities received under repurchase agreements are recorded as assets under the “Receivables on securities received under repurchase agreements” heading at the contracted amount, plus any accrued interest receivable.
Securities transferred under a repurchase agreement are recorded as securities purchased at their current value. Payables representing securities transferred under a repurchase agreement are recorded as securities sold at the contracted value, plus any accrued interest payable.
Loaned securities are valued at their current value and are entered under assets at their current value, plus accrued interest receivable, under the heading ‘Receivables on Loaned Securities’.
Borrowed securities are recorded as assets under the “Borrowed securities” heading at the contracted amount, and as liabilities under the “Payables representing borrowed securities” heading at the contracted amount, plus any accrued interest payable.
Financial futures: Financial futures traded on a regulated or equivalent market: Financial futures traded on regulated markets are valued at the day’s settlement price.
Financial futures not traded on a regulated or equivalent market: Swaps: Interest rate and/or currency swaps are valued at their market value according to the price calculated by discounting future interest payments at the prevailing interest rate and/or the currency market exchange rate. This price is adjusted to take into account the risk associated with the issuer.
Index swaps are valued on an actuarial basis using a benchmark rate provided by the counterparty.
Other swaps are valued at their market value or at a value estimated in the manner established by the management company.
Off-balance sheet commitments:
Firm futures contracts are recorded as off-balance sheet commitments at their market value at the price used in the portfolio. Options transactions are converted into the equivalent underlying. Swap commitments are recorded at their nominal value or, where there is no nominal value, at an equivalent amount.

32
Costs of management These operating and management fees cover all charges incurred by the Fund: financial management fees, administration and accounting fees, as well as custody, distribution and the statutory auditor’s fees. These fees are recorded in the income statement for the UCI. The costs of management do not include transaction fees.
For more details about the fees invoiced to the UCI, please refer to the Fund regulations. They are recorded pro rata temporis each time the net asset value is calculated. Management fees are borne by the company or by the Fund. Management fees are paid in full to the management company responsible for all of the UCI’s operating costs.
The costs of management do not include transaction fees.
The rate applied on the basis of the net assets is: - S units : 0.25% incl. taxes - U units : 0.30% incl. taxes - I units : 0.35% incl. taxes - C units : 0.70% incl. taxes - E units : 1.00% incl. taxes - P units: 0.75% incl. taxes - ICHF H units: 0.35% incl. taxes
- CHF H units: 0.70% incl. taxes from 11/10/17.
Performance fee The management company may receive a performance fee. This fee will be calculated on the basis of a Reference Net Asset Value, defined for each calendar year as the last net asset value of the previous calendar year. Performance fees are calculated on the basis of an annual reference period that starts on the Reference Date, which is the date of the Reference Net Asset Value.
The performance fee is calculated when each net asset value is determined and is provisioned as a deduction thereof. For units denominated in EUR, the total value is equal to 15% inclusive of tax of the UCITS’ outperformance of the capitalised Eonia index since the last reference date. The UCITS’ outperformance is defined as the difference between the UCITS’ assets (excluding variable management fees) and theoretical assets comprising: an identical performance to that of the Capitalised Eonia index, redemptions proportionate to those of the Edmond de Rothschild Start Fund,
subscriptions in amounts identical to those of the Edmond de Rothschild Start Fund.
For units denominated in US dollars, the total performance fee is equal to 15% inclusive of tax of the Fund’s outperformance of the capitalised Federal Funds Effective Rate index since the last reference date.
The Fund’s outperformance is defined as the difference between the UCITS’ assets (excluding variable management fees) and theoretical assets comprising:
an identical performance to that of the Capitalised Federal Funds Effective Rate index, redemptions proportionate to those of the Edmond de Rothschild Start Fund,
subscriptions in amounts identical to those of the Edmond de Rothschild Start Fund.
For units denominated in CHF, the total value of the performance fee will be 15% inclusive of tax of the Fund’s outperformance compared to the capitalised Federal Funds Effective Rate index, since the last reference date.

33
The Fund’s outperformance is defined as the difference between the UCITS’ assets (excluding variable management fees) and theoretical assets comprising:
an identical performance to that of the capitalised 1-month CHF Libor index, redemptions proportionate to those of the Edmond de Rothschild Start Fund,
subscriptions in amounts identical to those of the Edmond de Rothschild Start Fund.
In the event of the UCITS underperforming its benchmark, the performance fee provision will be reduced by reversing the provision. The reversal cannot be more than the provision.
The performance fee will be deducted by the management company after the last net asset value of the calendar year has been determined.
When units are redeemed, the proportion of the performance fee attached to the redeemed units will be crystallised and will therefore accrue to the management company.
The trailer fees receivable is taken into consideration every time the net asset value is calculated. The amount set aside as a provision is equal to the portion of the fees acquired over the period observed.
Allocation of distributable income Definition of distributable income : Distributable income comprises: Income:
Net income for the financial year is the sum of interest, arrears, premiums and bonuses, dividends, directors’ fees and all other revenues generated by the securities held in the portfolio, plus income generated by temporary cash holdings, less the sum of the costs of management fees and borrowing costs. It is increased by the balance carried forward and increased or decreased by the balance of the income adjustment account.
Gains and losses: Realised gains (net of fees), minus realised losses (net of fees), recorded during the financial year, plus any net gains of the same type recorded during previous financial years that have not been distributed or accumulated, plus or minus the balance of the capital gains adjustment account.
Methods for allocating distributable income:
Distributable income C, E, I, S, U, P, ICHF H and CHF H units
Allocation of net income Accumulation
Allocation of net realised gains or losses Accumulation

34
• CHANGE IN NET ASSETS in EUR
29/12/2017 30/12/2016
Net assets at the beginning of the financial year 299,404,511.40 179,338,519.43
Subscriptions (including subscription fees paid to the UCI) 911,343,205.15 217,522,360.02
Redemptions (less redemption fees paid to the UCI) -331,777,019.85 -100,357,986.23
Realised gains on deposits and financial instruments 907,582.31 755,079.06
Losses realised on deposits and financial instruments -2,380,853.58 -3,901,030.84
Gains realised on forward financial instruments 12,610,099.91 6,518,594.11
Losses realised on forward financial instruments -14,564,129.63 -6,268,944.57
Transaction fees -335,420.39 -132,789.09
Foreign exchange differences -3,194,255.45 159,859.07
Changes in valuation differential on deposits and financial instruments -981,062.00 1,565,492.51
Valuation differential for financial year N -2,212,821.24 -1,231,759.24
Valuation differential for financial year N-1 1,231,759.24 2,797,251.75
Changes in valuation differential on forward financial instruments -724,096.06 -59,267.22
Valuation differential for financial year N -951,453.48 -227,357.42
Valuation differential for financial year N-1 227,357.42 168,090.20
Dividends paid in the previous financial year on net gains and losses
Dividends paid in the previous financial year on income
Net profit/loss for financial year prior to income equalisation account 8,035,516.50 4,264,625.15
Interim dividend(s) paid over the financial year on net gains and losses
Interim dividend(s) paid over the financial year on income
Other items
Net assets at the end of the financial year 878,344,078.31 299,404,511.40

35
BREAKDOWN OF FINANCIAL INSTRUMENTS BY LEGAL OR ECONOMIC TYPE
Amount %
Assets
Bonds and similar securities
Fixed-rate bonds traded on a regulated or equivalent market 611,508,687.18 69.62 Variable/adjustable rate bonds traded on a regulated or equivalent market 35,264,490.61 4.01 TOTAL Bonds and similar securities 646,773,177.79 73.64 Debt securities
Treasury bills 12,952,737.30 1.47
Short-term transferable securities (NEU CP) issued by non-financial, foreign, European issuers on unregulated markets 15,021,661.62 1.71
Short-term transferable securities (NEU CP) issued by banking issuers 5,008,154.22 0.57 Short-term transferable securities (NEU CP) issued by non-financial issuers 22,226,400.36 2.53
Short-term transferable securities (NEU CP) issued by non-financial, foreign, European issuers 10,014,175.62 1.14
TOTAL Debt securities 65,223,129.12 7.43
Liabilities Sales of financial instruments
TOTAL Sales of financial instruments
Off-balance sheet items
Hedging transactions
TOTAL Hedging transactions
Other transactions
Equities 59,983,909.41 6.83 Foreign exchange 37,395,044.16 4.26 Credit 38,500,000.00 4.38 Interest rates 174,385,947.08 19.85 TOTAL Other transactions 310,264,900.65 35.32
BREAKDOWN BY INTEREST RATES OF ASSETS, LIABILITIES AND OFF-BALANCE-SHEET ITEMS
Fixed rate % Floating rate % Adjustable rate % Other % Assets
Deposits
Bonds and similar securities 611,508,687.18 69.62 35,264,490.61 4.01
Debt securities 65,223,129.12 7.43
Temporary securities transactions
Financial accounts 77,880,814.25 8.87
Liabilities
Temporary securities transactions
Financial accounts 1,742,963.92 0.20
Off-balance sheet items Hedging transactions
Other transactions 50,856,939.43 5.79 123,529,007.65 14.06

36
BREAKDOWN OF ASSETS, LIABILITIES AND OFF-BALANCE-SHEET ITEMS BY RESIDUAL MATURITY
< 3 months % ]3 months –
1 year]
% [1 - 3 years] % [3 - 5 years] % > 5 years %
Assets
Deposits
Bonds and similar securities 19,254,048.08 2.19 77,018,867.09 8.77 220,343,055.12 25.09 314,183,553.76 35.77 15,973,653.74 1.82
Debt securities 7,978,508.39 0.91 57,244,620.73 6.52
Temporary securities transactions
Financial accounts 77,880,814.25 8.87
Liabilities
Temporary securities transactions
Financial accounts 1,742,963.92 0.20
Off-balance sheet items
Hedging transactions 77,440,586.49 8.82 50,856,939.43 5.79 46,088,421.16 5.25
Other transactions
Positions in interest rate futures are shown according to the maturity of the underlying.
BREAKDOWN OF ASSETS, LIABILITIES AND OFF-BALANCE SHEET ITEMS BY LISTING OR VALUATION CURRENCY
USD SEK CHF Other currencies
Amount % Amount % Amount % Amount %
Assets
Deposits
Equities and equivalent securities
Bonds and similar securities 9,238,745.32 1.05
Debt securities
UCIs 14,772,345.52 1.68
Temporary securities transactions
Receivables 23,235,065.04 2.65 7,452,635.69 0.85 35,108,967.93 4.00 74,673.98 0.01
Financial accounts 0.01 0.00 8,123,809.46 0.92 439,731.65 0.05
Liabilities
Sales of
financial instruments
Temporary securities transactions
Payables 2,014,691.00 0.23
Financial accounts 1,658,151.77 0.19 28,560.96 0.00 56,251.19 0.01
Off-balance sheet items
Hedging transactions
Other transactions 139,025,242.54 15.83 50,856,939.43 5.79 7,869,279.58 0.90 5,633,557.31 0.64

37
• RECEIVABLES AND PAYABLES: BREAKDOWN BY TYPE
Type of debit or credit 29/12/2017
Receivables Forward currency purchases 62,447,323.83
Funds to be received on forward currency sales 2,000,000.00
Subscriptions receivable 7,910,006.47
Cash collateral deposits 3,520,178.07
Cash dividends and coupons 112,774.28
Collateral 1,240,000.00
Total receivables 77,230,282.65
Payables Forward currency sales 2,014,691.00
Amount payable on forward currency purchases 63,108,578.03
Purchases with deferred settlement 5,264,406.89
Redemptions payable 1,022,630.55
Costs of management 250,875.05
Variable management fees 829,732.38
Total payables 72,490,913.90

38
• NUMBER OF SECURITIES ISSUED OR REDEEMED
Units Amount
ICHF H Units
Units subscribed during financial year 304,414.668 26,813,925.36
Units redeemed during financial year -115,666.321 -10,321,659.76
Net balance of subscriptions/redemptions 188,748.347 16,492,265.60
C Units
Units subscribed during financial year 323,002.447 178,121,313.44
Units redeemed during financial year -156,114.129 -86,074,449.36
Net balance of subscriptions/redemptions 166,888.318 92,046,864.08
P unit
Units subscribed during financial year 26,476.313 2,352,597.84
Units redeemed during financial year -22,993.423 -2,068,236.42
Net balance of subscriptions/redemptions 3,482.890 284,361.42
I Units
Units subscribed during financial year 45,450.926 267,634,292.91
Units redeemed during financial year -27,055.751 -159,293,413.18
Net balance of subscriptions/redemptions 18,395.175 108,340,879.73
CHF H units
Units subscribed during financial year 1,549.680 134,263.60
Units redeemed during financial year Net balance of subscriptions/redemptions 1,549.680 134,263.60
U unit
Units subscribed during financial year 21,898.885 20,346,776.83
Units redeemed during financial year -13,080.154 -12,469,918.67
Net balance of subscriptions/redemptions 8,818.731 7,876,858.16
E Units
Units subscribed during financial year 6,560.890 668,858.03
Units redeemed during financial year -17,769.496 -1,811,676.03
Net balance of subscriptions/redemptions -11,208.606 -1,142,818.00
S units
Units subscribed during financial year 383,288.285 415,271,177.14
Units redeemed during financial year -55,118.430 -59,737,666.43
Net balance of subscriptions/redemptions 328,169.855 355,533,510.71
• SUBSCRIPTION AND/OR REDEMPTION FEES
Amount
C Units
Redemption fees received
Subscription fees received
Total fees received
P unit
Redemption fees received
Subscription fees received
Total fees received
ICHF H Units
Redemption fees received
Subscription fees received
Total fees received

39
• SUBSCRIPTION AND/OR REDEMPTION FEES
Amount
I Units
Redemption fees received
Subscription fees received
Total fees received
U unit
Redemption fees received
Subscription fees received
Total fees received
CHF H units
Redemption fees received
Subscription fees received
Total fees received
E Units Redemption fees received Subscription fees received Total fees received
S units
Redemption fees received
Subscription fees received
Total fees received
• MANAGEMENT FEES
29/12/2017
P unit
Guarantee fees Fixed management fees 5,267.55 Percentage of fixed management fees 0.75
Variable management fees 53.40
Trailer fees C Units
Guarantee fees Fixed management fees 887,420.74 Percentage of fixed management fees 0.70
Variable management fees 164,856.14
Trailer fees ICHF H Units
Guarantee fees Fixed management fees 78,038.12 Percentage of fixed management fees 0.35
Variable management fees 29,336.68
Trailer fees I Units
Guarantee fees Fixed management fees 554,429.53 Percentage of fixed management fees 0.35
Variable management fees 275,630.59
Trailer fees

40
29/12/2017
U unit
Guarantee fees Fixed management fees 39,337.71 Percentage of fixed management fees 0.30
Variable management fees 34,973.96
Trailer fees CHF H units
Guarantee fees Fixed management fees 189.13 Percentage of fixed management fees 0.70
Variable management fees 0.25
Trailer fees E Units
Guarantee fees Fixed management fees 21,524.02 Percentage of fixed management fees 1.00
Variable management fees 2,536.70
Trailer fees S units
Guarantee fees Fixed management fees 506,696.38 Percentage of fixed management fees 0.25
Variable management fees 318,807.40
Trailer fees
• COMMITMENTS RECEIVED AND GIVEN
Guarantees received by the UCI
None.
Other commitments received and/or given
None.

41
• CURRENT VALUE OF SECURITIES SUBJECT TO A TEMPORARY PURCHASE TRANSACTION
29/12/2017
Securities received under repurchase agreements Borrowed securities
• CURRENT VALUE OF SECURITIES REPRESENTING GUARANTEE DEPOSITS
29/12/2017
Financial instruments given as a guarantee and retained under their original entry Financial instruments received as a guarantee and not recorded on the balance sheet
• GROUP FINANCIAL INSTRUMENTS HELD IN PORTFOLIO
ISIN code Denomination 29/12/2017
Equities
Bonds
Negotiable debt securities
UCIs 85,907,204.03
FR0010027623 Edmond de Rothschild Credit Very Short Term C 1,020,323.16
FR0011031392 Edmond de Rothschild Credit Very Short Term R 49,721,537.25
FR0013062668 EDMOND DE ROTHSCHILD EQUITY EUROPE 5,099,517.00
FR0013233699 EDMOND DE ROTHSCHILD FINANCIAL BONDS 14,623,980.30
LU1080015347 EDMOND DE ROTHSCHILD FUND US IG 14,772,345.52
LU1160352354 EDR EMER BONDS I EUR 669,500.80
Financial futures
Total Group securities 85,907,204.03

42
• ALLOCATION TABLE FOR THE PORTION OF DISTRIBUTABLE INCOME CORRESPONDING TO INCOME
29/12/2017 30/12/2016
Amounts still to be allocated
Balance carried forward
Profit/loss 13,931,971.58 7,233,483.53
Total 13,931,971.58 7,233,483.53
29/12/2017 30/12/2016
ICHF H Units
Allocation
Distribution
Balance carried forward for financial year Accumulation 600,430.50 33,350.16
Total 600,430.50 33,350.16
29/12/2017 30/12/2016
P unit
Allocation
Distribution
Balance carried forward for financial year
Accumulation 14,404.37 5,450.91
Total 14,404.37 5,450.91
29/12/2017 30/12/2016
C Units
Allocation
Distribution
Balance carried forward for financial year
Accumulation 2,285,439.95 1,956,116.97
Total 2,285,439.95 1,956,116.97
29/12/2017 30/12/2016
I Units
Allocation
Distribution
Balance carried forward for financial year
Accumulation 3,610,339.80 3,092,543.44
Total 3,610,339.80 3,092,543.44

43
29/12/2017 30/12/2016
CHF H units
Allocation
Distribution
Balance carried forward for financial year
Accumulation 433.61
Total 433.61
29/12/2017 30/12/2016
U unit
Allocation
Distribution
Balance carried forward for financial year
Accumulation 332,260.81 328,210.74
Total 332,260.81 328,210.74
29/12/2017 30/12/2016
E Units
Allocation
Distribution
Balance carried forward for financial year
Accumulation 12,034.04 54,525.90
Total 12,034.04 54,525.90
29/12/2017 30/12/2016
S units
Allocation
Distribution
Balance carried forward for financial year
Accumulation 7,076,628.50 1,763,285.41
Total 7,076,628.50 1,763,285.41

44
• TABLE SHOWING THE ALLOCATION OF THE PORTION OF DISTRIBUTABLE INCOME CORRESPONDING TO NET GAINS AND LOSSES
29/12/2017 30/12/2016
Amounts still to be allocated
Undistributed prior net gains and losses Net gains and losses for the financial year -6,419,550.61 -5,718,772.04
Interim dividends paid on net gains and losses for the financial year
Total -6,419,550.61 -5,718,772.04
29/12/2017 30/12/2016
C Units
Allocation Distribution
Undistributed net gains and losses
Accumulation -223,803.41 -1,812,269.92
Total -223,803.41 -1,812,269.92
29/12/2017 30/12/2016
ICHF H Units
Allocation
Distribution
Undistributed net gains and losses
Accumulation -3,350,478.21 122,018.72
Total -3,350,478.21 122,018.72
29/12/2017 30/12/2016
P unit
Allocation
Distribution
Undistributed net gains and losses
Accumulation -64,338.05 34,024.46
Total -64,338.05 34,024.46
29/12/2017 30/12/2016
I Units
Allocation
Distribution
Undistributed net gains and losses
Accumulation -289,023.22 -2,546,894.20
Total -289,023.22 -2,546,894.20

45
29/12/2017 30/12/2016
CHF H units
Allocation
Distribution
Undistributed net gains and losses
Accumulation -1,577.65 Total -1,577.65
29/12/2017 30/12/2016
U unit
Allocation
Distribution
Undistributed net gains and losses
Accumulation -1,950,102.44 -61,276.86
Total -1,950,102.44 -61,276.86
29/12/2017 30/12/2016
E Units
Allocation
Distribution
Undistributed net gains and losses
Accumulation -1,609.69 -52,630.11
Total -1,609.69 -52,630.11
29/12/2017 30/12/2016
S units
Allocation
Distribution
Undistributed net gains and losses
Accumulation -538,617.94 -1,401,744.13
Total -538,617.94 -1,401,744.13
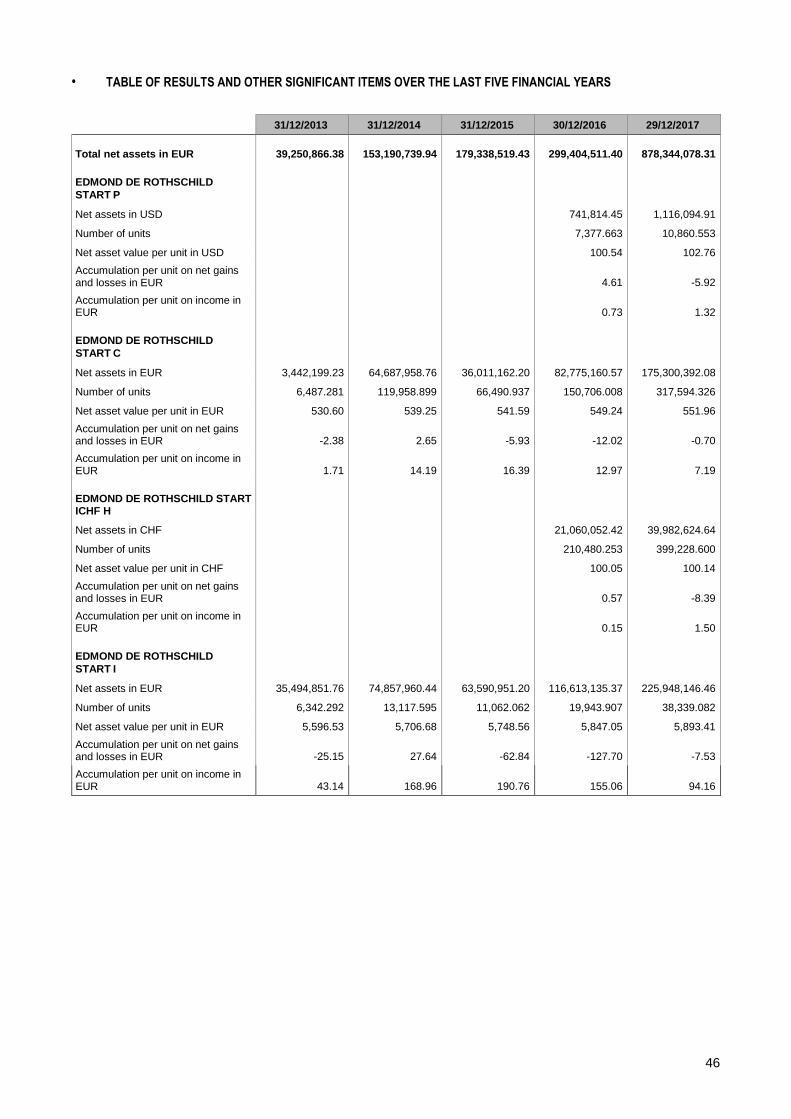
46
• TABLE OF RESULTS AND OTHER SIGNIFICANT ITEMS OVER THE LAST FIVE FINANCIAL YEARS
31/12/2013 31/12/2014 31/12/2015 30/12/2016 29/12/2017
Total net assets in EUR 39,250,866.38 153,190,739.94 179,338,519.43 299,404,511.40 878,344,078.31
EDMOND DE ROTHSCHILD
START P
Net assets in USD 741,814.45 1,116,094.91
Number of units 7,377.663 10,860.553
Net asset value per unit in USD 100.54 102.76
Accumulation per unit on net gains and losses in EUR 4.61 -5.92
Accumulation per unit on income in EUR 0.73 1.32
EDMOND DE ROTHSCHILD
START C
Net assets in EUR 3,442,199.23 64,687,958.76 36,011,162.20 82,775,160.57 175,300,392.08
Number of units 6,487.281 119,958.899 66,490.937 150,706.008 317,594.326
Net asset value per unit in EUR 530.60 539.25 541.59 549.24 551.96
Accumulation per unit on net gains and losses in EUR -2.38 2.65 -5.93 -12.02 -0.70
Accumulation per unit on income in EUR 1.71 14.19 16.39 12.97 7.19
EDMOND DE ROTHSCHILD START ICHF H
Net assets in CHF 21,060,052.42 39,982,624.64
Number of units 210,480.253 399,228.600
Net asset value per unit in CHF 100.05 100.14
Accumulation per unit on net gains and losses in EUR 0.57 -8.39
Accumulation per unit on income in EUR 0.15 1.50
EDMOND DE ROTHSCHILD
START I
Net assets in EUR 35,494,851.76 74,857,960.44 63,590,951.20 116,613,135.37 225,948,146.46
Number of units 6,342.292 13,117.595 11,062.062 19,943.907 38,339.082
Net asset value per unit in EUR 5,596.53 5,706.68 5,748.56 5,847.05 5,893.41
Accumulation per unit on net gains and losses in EUR -25.15 27.64 -62.84 -127.70 -7.53
Accumulation per unit on income in EUR 43.14 168.96 190.76 155.06 94.16

47
31/12/2013 31/12/2014 31/12/2015 30/12/2016 29/12/2017
Total net assets in EUR 39,250,866.38 153,190,739.94 179,338,519.43 299,404,511.40 878,344,078.31
EDMOND DE ROTHSCHILD
START U
Net assets in USD 182,368.80 185,804.48 78,842.31 13,752,471.77 23,727,540.27
Number of units 181.221 181.221 76.221 12,947.100 21,765.831
Net asset value per unit in USD 1,006.33 1,025.29 1,034.39 1,062.20 1,090.12
Accumulation per unit on net gains and losses in EUR -25.17 73.22 136.20 -4.73 -89.59
Accumulation per unit on income in EUR 6.09 23.11 31.43 25.35 15.26
EDMOND DE ROTHSCHILD START CHF H
Net assets in CHF 154,489.32
Number of units 1,549.680
Net asset value per unit in CHF 99.69
Accumulation per unit on net gains and losses in EUR -1.01
Accumulation per unit on income in EUR 0.27
EDMOND DE ROTHSCHILD
START E
Net assets in EUR 146,489.18 37,235.67 20,614.83 2,399,354.24 1,263,071.63
Number of units 1,481.328 371.270 205.180 23,605.390 12,396.784
Net asset value per unit in EUR 98.89 100.29 100.47 101.64 101.88
Accumulation per unit on net gains and losses in EUR -0.44 0.47 -1.10 -2.22 -0.12
Accumulation per unit on income in EUR 0.08 2.43 2.78 2.30 0.97
EDMOND DE ROTHSCHILD
START S
Net assets in EUR 34,978.30 13,454,033.99 79,643,212.44 64,229,373.63 420,842,403.58
Number of units 34.050 12,839.331 75,392.540 59,720.016 387,889.871
Net asset value per unit in EUR 1,027.26 1,047.87 1,056.38 1,075.50 1,084.95
Accumulation per unit on net gains and losses in EUR -4.56 4.92 -11.54 -23.47 -1.38
Accumulation per unit on income in EUR 8.90 31.41 35.85 29.52 18.24

48
• PORTFOLIO BREAKDOWN in EUR
Security name Currency Quantity or
nominal amount
Current value % Net assets
Bonds and similar securities
Bonds and assimilated securities traded on a regulated or assimilated market
GERMANY
CECONOMY AG EX METRO AG 1.375% 28-10-21 EUR 4,602,000 4,787,755.00 0.55
CONTINENTAL AG ZCP 05-02-20 EUR 4,560,000 4,570,351.20 0.52
CRH FINA 1.75% 16-07-21 EMTN EUR 5,850,000 6,183,909.99 0.69
DAIMLER AG FLO 24-06-19 EUR 250,000 251,438.31 0.03
THYSSENKRUPP AG 4% 27/08/2018 EUR 4,991,000 5,193,968.93 0.59
TKAGR 3 1/8 10/25/19 EUR 5,400,000 5,687,621.01 0.65
VOLKSWAGEN LEASING GMBH 3.25% 10/05/2018 SERIE EMTN
EUR 1,500,000 1,550,762.67 0.18
ZF NA CAPITAL 2.25% 26-04-19 EUR 5,000,000 5,229,121.23 0.60
TOTAL GERMANY 33,454,928.34 3.81
AUSTRALIA
NATIONAL AUSTRALIA BK 4 5/8% 2020 EMTN EUR 250,000 283,688.73 0.03
ORGAU 2 1/2 10/23/20 EUR 3,000,000 3,206,494.52 0.37
TOTAL AUSTRALIA 3,490,183.25 0.40
BELGIUM
BARRY CALLEBAUT SVCS NV 5.375% 15/06/2021 EUR 6,766,000 8,195,183.11 0.94
BNP PAR 5.75% 30-04-18 EMTN EUR 1,274,000 1,346,934.58 0.15
FBAVP 5 3/4 06/27/18 EUR 604,000 638,495.35 0.07
KBC GR 1.0% 26-04-21 EMTN EUR 6,200,000 6,397,433.48 0.73
TOTAL BELGIUM 16,578,046.52 1.89
CYPRUS
C 3.875% 06-05-22 EMTN EUR 2,635,000 3,043,903.99 0.35
CYPRUS GOVERNMENT INTERNATIONAL BOND 4.75% 25-06-19 EUR 5,145,000 5,629,845.77 0.64
CYPRUS 4.625% 03/02/2020 EUR 1,200,000 1,356,722.30 0.15
TOTAL CYPRUS 10,030,472.06 1.14
CROATIA
TOTAL CROATIA
DENMARK
TOTAL DENMARK

49
Security name Currency Quantity or nominal amount Current value % Net
assets
SPAIN
AMAD CAP 0.125% 06-10-20 EMTN EUR 1,500,000 1,501,537.19 0.17
AMAD CAP 1.625% 17-11-21 EMTN EUR 1,000,000 1,051,582.47 0.12
CELL 3.125% 27-07-22 EMTN EUR 4,300,000 4,698,518.11 0.53
DISINT 1 1/2 07/22/19 EUR 2,400,000 2,464,153.97 0.28
DIST INT 1.0% 28-04-21 EMTN EUR 2,200,000 2,262,434.49 0.26
ESPAGNE 4.30% 31/10/19 EUR 4,000,000 4,370,638.90 0.50
ESPAGNE 4.85%10-311020 EUR 5,950,000 6,833,242.45 0.78
ESPAGNE 5.5%11-300421 EUR 3,200,000 3,899,615.56 0.44
GEN DE CATALUNYA 4.95% 10-20 EUR 7,000,000 7,773,537.40 0.89
GENER.CATALUNYA 4.9% 09-21 EUR 1,000,000 1,083,257.12 0.12
SPGB 3 3/4 10/31/18 EUR 3,500,000 3,646,423.70 0.42
SPGB 4.4% 10/31/23 EUR 10,000,000 12,250,950.68 1.39
TOTAL SPAIN 51,835,892.04 5.90
UNITED STATES OF AMERICA
ABBVIE 0.375% 18-11-19 EUR 4,823,000 4,859,233.28 0.55
AIR PRODUCTS 0.375% 01-06-21 EUR 670,000 677,650.85 0.08
ALBEMARLE 1.875% 08-12-21 EUR 9,210,000 9,704,628.73 1.11
AMGEN INC 2.125% 13/09/2019 EUR 2,600,000 2,715,207.42 0.31
AMGEN 1.25% 25-02-22 EUR 7,500,000 7,844,586.99 0.89
AT T E3R+0.58% 04-06-19 EUR 2,800,000 2,819,765.67 0.32
BAC 1 3/8 09/10/21 EUR 7,300,000 7,652,460.00 0.87
BAC 1 7/8 01/10/19 EUR 3,730,000 3,877,858.73 0.44
BALL 3.5% 15-12-20 EUR 3,470,000 3,806,948.69 0.43
BERKSHIRE HATHAWAY 0.25% 17-01-21 EUR 4,600,000 4,635,254.90 0.53
CE 3 1/4 10/15/19 EUR 2,742,000 2,916,947.43 0.33
CITIG 1.375% 27-10-21 EMTN EUR 5,700,000 5,957,706.37 0.68
CITIGROUP 7.375% 04/09/19 EMTN EUR 3,000,000 3,449,725.89 0.39
COCA EURO PAR 2.0% 05-12-19 EUR 4,400,000 4,561,563.78 0.52
FEDEX 0.5% 09-04-20 EUR 6,955,000 7,045,171.10 0.80
G E3R+0.65% 11-09-18 EMTN EUR 3,000,000 3,012,742.92 0.34
G E3R+0.7% 29-04-19 EMTN EUR 2,950,000 2,974,886.94 0.34
GENERAL MOTORS FINANCIAL E3R+0.68% 10-05-21 EUR 2,800,000 2,830,482.20 0.32
HUNTSMAN INTERNATIONAL 5.125% 15/04/2021 EUR 1,000,000 1,135,414.17 0.13
KELLOGG CO 1.75% 24/05/2021 EUR 7,300,000 7,740,553.00 0.88
MDLZ 1 03/07/22 EUR 5,420,000 5,600,886.93 0.64
PFIZER 0.25% 06-03-22 EUR 375,000 376,292.00 0.04
THER FISH SCI 1.5% 01-12-20 EUR 263,000 272,893.05 0.03
UNIT TECH COR 1.125% 15-12-21 EUR 2,550,000 2,636,357.32 0.30
TOTAL UNITED STATES OF AMERICA 99,105,218.36 11.27

50
Security name Currency Quantity or nominal amount Current value % Net
assets
FINLAND
FORTUM OYJ 4% 24/05/21 EUR 6,000,000 6,878,027.67 0.78
NOKIA OYJ 1.0% 15-03-21 EMTN EUR 3,650,000 3,700,168.50 0.42
TOTAL FINLAND 10,578,196.17 1.20
FRANCE
ARRFP 1 1/8 01/15/21 EUR 2,000,000 2,078,520.27 0.24
BVIFP 3 1/8 01/21/21 EUR 6,200,000 6,870,895.21 0.78
CAPGEMINI SE 0.5% 09-11-21 EUR 6,500,000 6,563,202.26 0.75
CASINO 4.726% STEP-UP 26-05-21 EMTN EUR 4,500,000 5,403,992.30 0.62
CR.AGRICOLE 5.971% 01/02/2018 EUR 2,000,000 2,119,891.84 0.24
CROW EURO HOL 4.0% 15-07-22 EUR 2,000,000 2,264,233.33 0.26
GECINA E3R+0.38% 30-06-22 EMTN EUR 6,200,000 6,222,363.92 0.71
HIT FINANCE BV 5.75%11-090318 EUR 500,000 528,840.14 0.06
NEW AREVA HOLDING 3.25% 04-09-20 EUR 5,800,000 6,184,621.04 0.70
NEW AREVA HOLDING 4.375% 06-11-19 EUR 6,700,000 7,198,962.77 0.82
SCHL FINA FRA 0.625% 12-02-19 EUR 250,000 253,631.27 0.03
VIVENDI 0.75% 26-05-21 EUR 2,100,000 2,142,696.45 0.24
TOTAL FRANCE 47,831,850.80 5.45
GREECE
GRECE 4.75% 17/04/2019 EUR 7,307,000 7,850,609.77 0.90
HELLENIC REPUBLIC GOVERNMENT BOND 4.2% 29-01-42 EUR 402,500 375,012.06 0.04
HELLENIC REPUBLIC GOVERNMENT BOND 4.375% 01-08-22 EUR 5,750,000 6,083,837.91 0.69
TOTAL GREECE 14,309,459.74 1.63
HUNGARY
HUNG GOVE INT 4.125% 19-02-18 USD 1,200,000 1,018,705.03 0.12
TOTAL HUNGARY 1,018,705.03 0.12
IRELAND
BANK IRELAND 10% 12/02/2020 EUR 4,850,000 6,267,883.55 0.71
FRESENIUS FINANCE IRELAND PLC 0.875% 31-01-22 EUR 8,060,000 8,270,388.08 0.94
IRLANDE 0.8% 15-03-22 EUR 2,800,000 2,927,326.74 0.33
IRLANDE 4,5% 04-20 EUR 2,500,000 2,870,761.99 0.33
SMURFIT KAPPA ACQUISITIO EUR 3,000,000 3,254,665.75 0.37
SMURFIT KAPPA ACQUISITIONS 5.125% 15/09/2018 EUR 2,500,000 2,603,912.50 0.30
TOTAL IRELAND 26,194,938.61 2.98
ICELAND
ICELAND GOVERNMENT INTL BOND 0.5% 20-12-22 EUR 1,100,000 1,109,868.96 0.13
TOTAL ICELAND 1,109,868.96 0.13
ITALY
ATLANTIA SPA EX AUTOSTRADE SPA 3.625% 30-11-18 EUR 1,500,000 1,556,875.07 0.18
AUTOSTRADE PER L ITALILIA SPA 2.875% 26-02-21 EUR 4,820,000 5,353,461.09 0.61

51
Security name Currency Quantity or nominal amount Current value % Net
assets
AUTOSTRADE PER L ITALILIA SPA 4.375% 16-03-20 EMTN EUR 2,250,000 2,549,812.19 0.29
INTE 0.875% 27-06-22 EMTN EUR 5,000,000 5,088,673.97 0.58
ITALIE 5.50% 11/22 EUR 17,162,000 21,172,619.07 2.41
SALINI 6.125% 01/08/2018 EUR 400,000 423,832.11 0.05
TELECOM ITALIA SPA 4% 01/20 EUR 2,500,000 2,786,843.49 0.32
TELECOM ITALIA 4.75% 25/05/2018 EUR 2,500,000 2,620,051.37 0.30
TELECOM ITALIA 5.25% 10/02/22 EUR 4,150,000 5,085,759.62 0.58
TRNIM 0 7/8 02/02/22 EUR 3,000,000 3,099,122.47 0.35
UNICREDT 05/06/18 EUR 3,000,000 3,200,535.21 0.36
WIND TRE 2.625% 20-01-23 EUR 3,400,000 3,347,691.00 0.38
TOTAL ITALY 56,285,276.66 6.41
JAPAN
SOFT BANK 4.625% 15/04/2020 EUR 3,790,000 4,175,294.56 0.48
TOTAL JAPAN 4,175,294.56 0.48
JERSEY
GLENCORE FINANCE EUROPE SA AUTRE V 03-04-18 EUR 3,500,000 3,662,735.62 0.42
GLENCORE 2.75% 01/04/2021 EUR 4,200,000 4,579,343.42 0.52
TOTAL JERSEY 8,242,079.04 0.94
KENYA
EASTERN AND SOUTHERN AFRICAN 5.375% 14-03-22 USD 2,200,000 1,947,487.90 0.22
ESAFRB 6 3/8 12/06/18 USD 2,810,000 2,422,785.48 0.28
TOTAL KENYA 4,370,273.38 0.50
LITHUANIA
LATV GOVE INT 5.5% 05-03-18 EUR 1,000,000 1,057,058.22 0.12
REPU DE LETT 0.5% 15-12-20 EUR 625,000 637,137.67 0.07
TOTAL LITHUANIA 1,694,195.89 0.19
LUXEMBOURG
ARCE 3.0% 09-04-21 EMTN EUR 300,000 331,451.88 0.04
CNH 2 3/4 03/18/19 EUR 7,470,000 7,881,930.59 0.89
FIAT FINANCE TRADE 6.625% 15/03/2018 EUR 400,000 426,885.21 0.05
HEIDELBERGCEMENT FINANCE LUXEMBOURG 0.5% 18- EUR 750,000 761,568.39 0.09
01-21
HEIGR 3 1/4 10/21/21 EUR 500,000 558,645.00 0.06
MTNA 3 03/25/19 EUR 7,000,000 7,434,297.26 0.85
TOTAL LUXEMBOURG 17,394,778.33 1.98
MEXICO
ETAT DU MEXI 1.875% 23-02-22 EUR 10,230,000 11,013,414.80 1.25
MEXIQUE 2.375% 04/21 EUR 5,500,000 5,988,143.84 0.68
PEME PET 3.75% 15-03-19 EMTN EUR 7,140,000 7,666,828.32 0.87
PEMEX 3.125% 27/11/2020 EUR 7,060,000 7,599,227.33 0.87
TOTAL MEXICO 32,267,614.29 3.67

52
Security name Currency Quantity or nominal amount Current value % Net
assets
NETHERLANDS
ACHMEA HYPOTHEEKBANK NV 2% 23/01/2018 EUR 5,000,000 5,101,920.55 0.58
BHARTI 4 12/10/18 EUR 5,830,000 6,062,559.50 0.70
BMW FINANCE NV EUR 4,000,000 4,066,609.32 0.46
DAIMLER INTL FINANCE BV 0.2% 13-09-21 EUR 6,000,000 6,009,502.19 0.69
ELEPOR 4.125% 01/20/2021 EUR 2,500,000 2,902,821.92 0.33
EVONIK FINAN ZCP 08-03-21 EMTN EUR 3,000,000 2,986,260.00 0.34
GM 1.168 05/18/20 EUR 3,500,000 3,612,455.00 0.41
GRUP ANTO DUT 5.125% 30-06-22 EUR 2,000,000 2,102,694.17 0.24
HEIDELBERGCEMENT 8 1/2% 2019 EUR 3,598,000 4,215,003.03 0.48
KONI AHOL DEL 4.25% 19-10-18 EUR 2,427,000 2,531,019.56 0.29
LEAS COR 1.375% 24-09-18 EMTN EUR 1,480,000 1,503,050.70 0.17
LOUDRE 3.875% 07/30/18 EUR 3,000,000 3,110,303.42 0.35
OI EUROPEAN 4.875% 03/21 EUR 3,000,000 3,436,631.25 0.39
REPSM 3.625% 10/07/21 EUR 5,000,000 5,678,448.63 0.65
VOLKSWAGEN INTL FIN NV 2% 14/01/2020 EUR 3,000,000 3,176,901.78 0.36
VOLKSWAGEN INTL FIN 2µ 03/21 EUR 1,000,000 1,072,936.85 0.12
VOLKSWAGEN INTL 5.375% 05/18 EUR 1,262,000 1,331,095.54 0.15
TOTAL NETHERLANDS 58,900,213.41 6.71
POLAND
POLAND GOVERNMENT INTL BOND 0.5% 20-12-21 EUR 7,520,000 7,669,210.19 0.87
TOTAL POLAND 7,669,210.19 0.87
PORTUGAL
METRO DE LISBOA 5.75% 04/02/2019 EUR 1,500,000 1,671,733.36 0.19
PGB 2.2 10/17/22 EUR 7,049,000 7,682,080.35 0.87
PORT OBRI DO 3.85% 15-04-21 EUR 6,800,000 7,842,515.45 0.90
PORTUGAL 4.80% 15/06/20 EUR 6,359,000 7,280,574.16 0.83
TOTAL PORTUGAL 24,476,903.32 2.79
ROMANIA
ROMANIA 4.875% 07/11/2019 EUR 2,500,000 2,753,657.53 0.31
TOTAL ROMANIA 2,753,657.53 0.31
UNITED KINGDOM
AALLN 2 1/2 04/29/21 EUR 3,200,000 3,466,703.34 0.39
ANGL AME 1.5% 01-04-20 EMTN EUR 5,000,000 5,211,367.81 0.59
BARCLAYS BANK 6%2018 EMTN EUR 2,150,000 2,278,725.51 0.26
BRITISH 1.5% 15-09-21 EMTN EUR 2,500,000 2,624,826.37 0.30
COMPASS GROUP 3.125% 13/02/2019 EUR 500,000 532,039.86 0.06
CRED SUI 0.375% 11-04-19 EMTN EUR 2,600,000 2,625,176.19 0.30
CS 0 1/2 03/29/18 EUR 2,000,000 2,011,691.23 0.23
EVERYTHING EVERYW HERE 3.25% 08/18 EUR 2,500,000 2,583,658.22 0.29
FCE BANK 1.75% 05/18 EUR 3,000,000 3,056,050.68 0.35

53
Security name Currency Quantity or nominal amount Current value % Net
assets
IMPERAIL TOBACCO FIN. 4.5% 05/07/2018 EUR 4,000,000 4,184,193.42 0.48
IMPERIAL BRANDS FINANCE 0.5% 27-07-21 EUR 1,400,000 1,412,406.49 0.16
INTE GAME TEC 6.625% 02-02-18 EUR 500,000 534,462.40 0.06
INTL GAME TECHNOLOGY 4.125% 15-02-20 EUR 6,500,000 7,024,891.25 0.79
NATIONWIDE BLDG 6.75% 22/07/2020 EUR 250,000 298,210.92 0.03
RBS 6.934% 04/18 EUR 3,400,000 3,634,608.94 0.41
RTOLN 3 1/4 10/07/21 EUR 6,000,000 6,655,353.70 0.76
TESCO CORP 1.375% 01-07-19 EMTN EUR 2,000,000 2,052,113.70 0.23
TESCO CORP 2.125% 11/20 EUR 2,970,000 3,124,788.67 0.36
TESCO 3.375% 02/11/2018 EUR 2,000,000 2,068,325.75 0.24
VODA 0.875% 17-11-20 EMTN EUR 1,265,000 1,293,584.84 0.15
VODAFONE GROUP 0.375% 22-11-21 EUR 5,891,000 5,903,733.44 0.67
WPP FINA 0.75% 18-11-19 EMTN EUR 400,000 406,138.08 0.05
TOTAL UNITED KINGDOM 62,983,050.81 7.16
SWEDEN
INTRUM JUSTITIA AB E3R+2.625% 15-05-22 EUR 4,750,000 4,831,416.98 0.55
VOLVO CAR AB 3.25% 18-05-21 EUR 4,000,000 4,371,290.00 0.50
TOTAL SWEDEN 9,202,706.98 1.05
TURKEY
REPUB TURQ 5.125% 10-20 EUR 6,680,000 7,542,217.80 0.86
TURKEY 4.35 11/12/21 EUR 4,660,000 5,132,185.03 0.58
TURKEY 5.875% 02/04/19 *EUR EUR 4,000,000 4,451,098.63 0.51
TURKIYE VAKIFLAR BANKASI 3.75% 15/04/2018 USD 4,580,000 3,849,766.91 0.44
TOTAL TURKEY 20,975,268.37 2.39
TOTAL Bonds and assimilated securities traded on regulated or assimilated markets 646,773,177.79 73.63
TOTAL Bonds and similar securities 646,773,177.79 73.63
Debt securities
Debt securities traded on a regulated or
assimilated market
UNITED STATES OF AMERICA
LOUI DREY COMM BV ZCP 03-07-18 EUR 5,500,000 5,507,603.59 0.63
TOTAL UNITED STATES OF AMERICA 5,507,603.59 0.63
FRANCE
ALTAREIT ZCP 19-09-18 EUR 5,000,000 5,008,154.22 0.57
ELIS EX HOLDELIS ZCP 29-01-18 EUR 500,000 499,895.88 0.06
FAURECIA ZCP 24-10-18 EUR 5,000,000 5,008,643.67 0.57
VALLOUREC ZCP 03-04-18 EUR 5,000,000 5,004,257.78 0.57
VALLOUREC ZCP 18-04-18 EUR 700,000 700,671.21 0.08
TOTAL FRANCE 16,221,622.76 1.85

54
Security name Currency Quantity or nominal amount Current value % Net
assets
GREECE
HELLENIC T-BILL ZCP 100418 EUR 6,000,000 5,974,388.46 0.68
HELLENIC T-BILL ZCP 160318 EUR 7,000,000 6,978,348.84 0.79
TOTAL GREECE 12,952,737.30 1.47
LUXEMBOURG
ARCELOR FINANCE ZCP 26-02-18 EUR 500,000 500,263.67 0.06
ARCELOR FINANCE ZCP 26-04-18 EUR 5,000,000 5,005,064.56 0.57
TOTAL LUXEMBOURG 5,505,328.23 0.63
UNITED KINGDOM
DEUT BANK AG LOND ZCP 20-12-18 EUR 10,000,000 10,014,175.62 1.14
TOTAL UNITED KINGDOM 10,014,175.62 1.14
TOTAL Debt securities traded on regulated or assimilated markets 50,201,467.50 5.72
Debt securities not traded on a regulated or assimilated market
GERMANY
CECO AG EX METR AG ZCP 28-09-18 EUR 5,000,000 5,003,808.45 0.57
TOTAL GERMANY 5,003,808.45 0.57
NETHERLANDS
VOLKSWAG. INT. FIN. ZCP 101218 EUR 5,000,000 5,009,239.56 0.57
VOLKSWAG. INT. FIN. ZCP 221018 EUR 5,000,000 5,008,613.61 0.57
TOTAL NETHERLANDS 10,017,853.17 1.14
TOTAL Debt securities not traded on a regulated or assimilated market 15,021,661.62 1.71
TOTAL Debt securities 65,223,129.12 7.43
Undertakings for collective investment
General-purpose UCITS and AIFs intended for non-professionals and equivalent investors in other countries
FRANCE
Edmond de Rothschild Credit Very Short Term C EUR 8,050.522 1,020,323.16 0.12
Edmond de Rothschild Credit Very Short Term R EUR 495 49,721,537.25 5.66
EDMOND DE ROTHSCHILD EQUITY EUROPE SOLVE R EUR 47,100 5,099,517.00 0.58
EDMOND DE ROTHSCHILD FINANCIAL BONDS R EUR 142,910 14,623,980.30 1.66
TOTAL FRANCE 70,465,357.71 8.02
LUXEMBOURG
EDMOND DE ROTHSCHILD FUND US IG CORPORATE USD 164,750 14,772,345.52 1.68
BONDS I USD
EDR EMER BONDS I EUR EUR 3,970 669,500.80 0.08
TOTAL LUXEMBOURG 15,441,846.32 1.76
TOTAL General-purpose UCITS and AIFs intended for non-professionals and equivalent investors in other countries 85,907,204.03 9.78
TOTAL Undertakings for collective investment 85,907,204.03 9.78
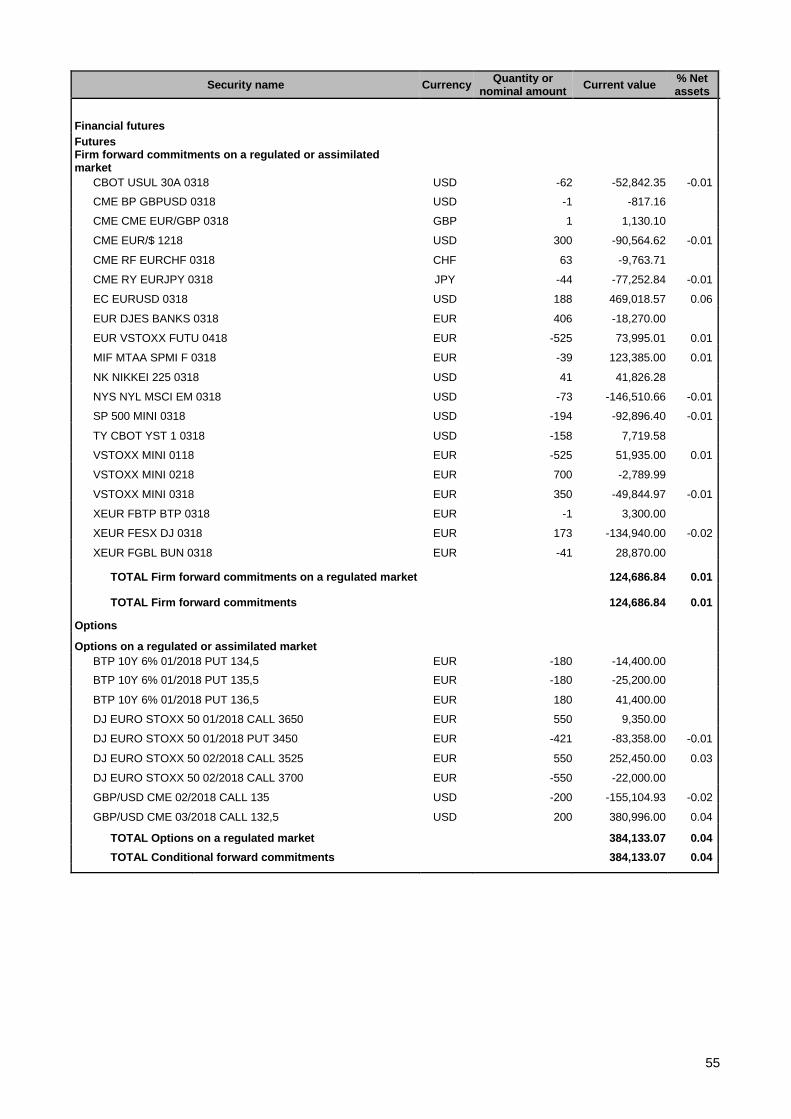
55
Security name Currency Quantity or nominal amount Current value % Net
assets
Financial futures
Futures
Firm forward commitments on a regulated or assimilated market
CBOT USUL 30A 0318 USD -62 -52,842.35 -0.01
CME BP GBPUSD 0318 USD -1 -817.16
CME CME EUR/GBP 0318 GBP 1 1,130.10
CME EUR/$ 1218 USD 300 -90,564.62 -0.01
CME RF EURCHF 0318 CHF 63 -9,763.71
CME RY EURJPY 0318 JPY -44 -77,252.84 -0.01
EC EURUSD 0318 USD 188 469,018.57 0.06
EUR DJES BANKS 0318 EUR 406 -18,270.00
EUR VSTOXX FUTU 0418 EUR -525 73,995.01 0.01
MIF MTAA SPMI F 0318 EUR -39 123,385.00 0.01
NK NIKKEI 225 0318 USD 41 41,826.28
NYS NYL MSCI EM 0318 USD -73 -146,510.66 -0.01
SP 500 MINI 0318 USD -194 -92,896.40 -0.01
TY CBOT YST 1 0318 USD -158 7,719.58
VSTOXX MINI 0118 EUR -525 51,935.00 0.01
VSTOXX MINI 0218 EUR 700 -2,789.99
VSTOXX MINI 0318 EUR 350 -49,844.97 -0.01
XEUR FBTP BTP 0318 EUR -1 3,300.00
XEUR FESX DJ 0318 EUR 173 -134,940.00 -0.02
XEUR FGBL BUN 0318 EUR -41 28,870.00
TOTAL Firm forward commitments on a regulated market 124,686.84 0.01
TOTAL Firm forward commitments 124,686.84 0.01
Options
Options on a regulated or assimilated market
BTP 10Y 6% 01/2018 PUT 134,5 EUR -180 -14,400.00
BTP 10Y 6% 01/2018 PUT 135,5 EUR -180 -25,200.00
BTP 10Y 6% 01/2018 PUT 136,5 EUR 180 41,400.00
DJ EURO STOXX 50 01/2018 CALL 3650 EUR 550 9,350.00
DJ EURO STOXX 50 01/2018 PUT 3450 EUR -421 -83,358.00 -0.01
DJ EURO STOXX 50 02/2018 CALL 3525 EUR 550 252,450.00 0.03
DJ EURO STOXX 50 02/2018 CALL 3700 EUR -550 -22,000.00
GBP/USD CME 02/2018 CALL 135 USD -200 -155,104.93 -0.02
GBP/USD CME 03/2018 CALL 132,5 USD 200 380,996.00 0.04
TOTAL Options on a regulated market 384,133.07 0.04
TOTAL Conditional forward commitments 384,133.07 0.04

56
Security name Currency Quantity or nominal amount Current value % Net
assets
Other forward financial instruments
Credit Default Swap
ITXEB528 EUR -38,500,000 -1,057,509.44 -0.11
TOTAL Credit default swap -1,057,509.44 -0.11
Interest rate swaps
SWAP6M00 SEK 500,000,000 68,148.30 0.01
TOTAL Interest rate swaps 68,148.30 0.01
TOTAL Other forward financial instruments -989,361.14 -0.10
TOTAL Forward financial instruments -480,541.23 -0.05
Margin call
ROTHSCHILD margin calls in EUR EUR -35,225.04 -35,225.04
ROTHSCHILD margin calls in GBP GBP -1,021.87 -1,151.21
ROTHSCHILD margin calls in JPY JPY 7,919,999 58,549.52 0.00
ROTHSCHILD margin calls in USD USD 6,271.36 5,222.65
MARROCHF CHF 19,299.99 16,493.60
TOTAL Margin calls 43,889.52
Receivables 77,230,282.65 8.79
Payables -72,490,913.90 -8.25
Financial accounts 76,137,850.33 8.67
Net assets 878,344,078.31 100.00
EDMOND DE ROTHSCHILD START CHF H CHF 1,549.680 99.69
EDMOND DE ROTHSCHILD START I EUR 38,339.082 5,893.41
EDMOND DE ROTHSCHILD START S EUR 387,889.871 1,084.95
EDMOND DE ROTHSCHILD START C EUR 317,594.326 551.96
EDMOND DE ROTHSCHILD START U USD 21,765.831 1,090.12
EDMOND DE ROTHSCHILD START E EUR 12,396.784 101.88
EDMOND DE ROTHSCHILD START P USD 10,860.553 102.76
EDMOND DE ROTHSCHILD START ICHF H CHF 399,228.600 100.14