french red cross vanuatu - adore.ifrc.orgadore.ifrc.org/download.aspx?fileid=180992&.pdf ·...
TRANSCRIPT
FRENCH RED CROSS
VANUATU
Summary Report of Endline KAP Survey North Tanna Recovery Project
AUGUST 2017

Page 2 / 33
Table of content
1. INTRODUCTION .............................................................. 4
2. METHODOLOGY .............................................................. 6
2.1. Endline survey design ........................................................................................6
2.2. Target population ..............................................................................................9
2.3. Survey implementation ...................................................................................11
2.4. Data consolidation into final database for analysis ..........................................12
2.5. Survey limits : justification of survey choice prior to field implementation ......13
3. DRR KAP SURVEY RESULTS ............................................ 14
3.1. CDC quiz results: monitoring of cdc knowledge ...............................................14
3.2. CDCsurvey (not including quizz questions).......................................................16
3.3. DRR KAP survey results ....................................................................................18
4. WASH KAP SURVEY RESULTS (FOCUS HYGIENE) ............ 23
4.1. Identification of hygiene promition key messages ...........................................23
4.2. Access to soap / ash ........................................................................................25
4.3. Use of soap / ash .............................................................................................25
5. RECOMMENDATIONS.................................................... 27 5.1. Recommendation on survey methodology ......................................................27
5.2. Recommendation on activites .........................................................................28
6. EXIT STRATEGY – LOW COST ACTIVITES ........................ 30
6.1. DRR low cost activities for the VRCS as exit strategy: .......................................30
6.2. Hygiene promotion low cost activities for the VRCS as exit strategy: ..............31
7. BIBLIOGRAPHY – WEBOGRAPHY ................................... 32
Page 3 / 33
ABBREVIATIONS
ACS Area Council Secretary CAP Community Action Plan CBDRR Community Based Disaster Risk Reduction CDC CDCCC
Community Disaster Committee Community Disaster & Climate Change Committee
CRP Community Response plan DRM Disaster Risk Management DRR Disaster Risk Reduction FGD Focus Group discussion FRC French Red Cross Society HP Hygiene Promotion KAP Knowledge, Attitude, and Practice NDMO National Disaster Management Office NGO Non-Governmental Organization ODK Open Data Kit PDC Provincial Disaster Council PDO Provincial Disaster Officer TC Tropical Cyclone VCA Vulnerability and Capacity Assessment VRCS Vanuatu Red Cross Society

Page 4 / 33
1. INTRODUCTION
This report summarizes the findings of a endline survey conducted in July and August 2017 (3weeks).
The purpose of this survey was to evaluate indicator progress and project impact in a sample of
community members and Community Disaster Committees.
This endline monitoring report aims at providing information on DRR actors’ knowledge, attitudes
and practices (KAP, Knowledge, Attitude, Practice) at the community level in order to be able to
monitor the success indicators for each activity under result 1 of the Recovery North Tanna project
implemented from September 2015 to September 2017. Also, this report aims at providing
information on Hygiene knowledge, attitudes and practices (KAP, Knowledge, Attitude, Practice) at
the community level in order to be able to monitor the success indicators for each activity under
result 4.
1.1. General Objectives of the Survey
The purpose of the endline survey is to evaluate the performance of key indicators against the
baseline values to measure progress towards achievement of the project objectives and outcomes.
The main objectives are to:
A. Evaluate North Tanna Recovery project’s outcomes. This is specifically to:
• Use quantitative measurement to track endline values for project output, outcome and
impact indicators;
• Create plausible links between outputs and outcomes/impacts
• Look through community knowledge, attitudes and practices and get some information on
leverage knowledge that increasingly contribute to strengthen people’s resilience toward
disasters
This will be done through the collection of the data at the beginning and end of the program corresponding to the indicators included in the proposal. These data will allow a comparison between the beginning and the final situation at the end of the program in order to measure the effectiveness of the VRCS/FRC program and assess the changes induced by it.
B. Being accountable towards the donor and partners
Defining precisely the objectives reached according to an up to date and accurate data
collection and analysis will facilitate the donor and partners’ perception and participation to
the project. Therefore, the results of this endline survey will be disseminated to keys DRR or
WASH actors and partners in Vanuatu.
C. Being accountable towards the community members
Defining precisely the objectives reached according to an up to date and accurate data
collection and analysis facilitated the process of accountability toward community members.
Results obtained through the endline survey have been presented to to Provincial authorities

Page 5 / 33
(PDO, ACS, NDMO, Rural Water Supply) and CDCCC members during a chief meeting held in
North Tanna on the 28 of August 2017. The objective was here to be accountable to partners
involved in the project but also to gather information of their perception of the analysis here
given.
1.2. Initial value of indicators
Below is a suggestion of breakdown for indicators (Table 1) to facilitate data analysis and to obtain
relevant results. For each topic, the table indicates the tools used to collect data. These tools will be
explained in the next section.
Result 1
Indicators Topics to be analyzed Tools
Indicator 1.2: CDCs are recognized by the community for their skills in relation to natural disaster preparedness and response
- CDCCC aware of their Roles and responsibilities
- CDCCC Quiz & survey
- KAP survey in community
- People in community trust their CDC and know them
- Community knowledge around DRR
Indicator 4.2: 75% of the people attending the awareness sessions are capable of remembering at least 3 key messages: washing hands, good water management at home, management and preparation of food.
- People are able to mention key messages around hygiene practices
- Community members knowledge around hygiene
- Community practices around
those key messages
- KAP survey in community
- Focus Group Indicator 4.3: 90% of households have soap or ash in their homes and 70% use it after having been in contact with faeces and before handling food.
- Availability of soap /ash
- Use of soap / ash
- Qualitative information on reason why people use or not soap & ash
Table 1: Topics to be analyzed for indicators for Result 1 & Result 4

Page 6 / 33
2. METHODOLOGY
2.1. ENDLINE SURVEY DESIGN
2.1.1. Questionnaire design:
The overall survey design is based on a pre and post-survey (baseline and endline) that mirrors the
geographical disaggregation used at baseline. The North Tanna recovery baseline questionnaire was
therefore used as the basis for the Endline survey to ensure consistency of the indicator values that
were estimated for the project endline impact and outcome indicators.
The questionnaire used for the baseline survey had been designed in July/August 2015, by FRC head of project in collaboration with FRC DRR Advisor based in Port Vila, and with the FRC WASH Technical Advisor based in Lao.
The FRC DRR Advisor has 4 year experience in DRR in Vanuatu and conducted numerous
survey in the targeted provinces
The FRC DRR Regional Technical Support has many years of experience in WASH and
conducted numerous WASH surveys for the FRC.
Nonetheless, it has been decided to provide some changes to the survey questionnaires for 2 main reasons:
As developed in the Baseline Survey Summary POSTER (Appendix 1), the baseline
questionnaire was designed in a way that could allow for multiple biases due to survey
design (too many non-response answers, too many open questions, not enough scale
questions etc).
Some questions have been added to the baseline questionnaire in order to target new
data collection on project impact, and on gender comparative analysis, based on gaps
identified in the baseline survey questionnaire
The questionnaire form is provided in Appendix 2 for DRR & WASH surveys.
2.1.2. Data collection method
Different data collection methods have been used, mixing quantitative and qualitative data. The
qualitative data collected will be used to interpret the quantitative data. We used the following
tools:
- Direct observation: used mainly for data that can be easily, objectively and directly
observable, e.g. House type, CDCCC Tools condition, implementation of the activities etc.
- Semi-structured interview: This collection means has been used for Focus group discussions
with various community groups around hygiene practices, especially to let them explain their
challenges and strengths that are quite specific according to the communities

Page 7 / 33
- Open questions: Open questions have been asked in the KAP Survey questionnaire to
household representatives. In this case the interviewer does have answers written in the
questionnaire but does not suggest the answer to the interviewee. Only “good” answers are
available in the form, so if the interviewee’s answer does not appear in the form, the
interviewer will fill the “other answer” area or tick “don’t know”. This strategy has been used
in order to facilitate the interviewers’ intervention and simplify the analysis.
- Scale questions: Likert-type scales questions were useful to measuring latent constructs -
that is, characteristics of people such as attitudes, opinions regarding activities held, etc.
Latent constructs are generally thought of as unobservable individual characteristics
(meaning that there is no concrete, objective measurement) that are believed to exist and
cause variations in behaviour (e.g., answer questions on a scale).
- Closed question: Most of the questions are closed as it is more appropriate for analysis
purposes, as the “Yes or No” questions. Others are shaped as quiz questions, with several
answers suggested, but only one is the right answer. These kinds of questions have been
introduced to cross check the knowledge of the interviewees. It has been used in the KAP
survey and the CDCCC Quiz too.
The endline questionnaire has been tested by the FRC DRR officers and VRCS support Officers in Vila and in field conditions, taking notes on the following points:
o Facility to understand the questionnaire for the surveyor
o Facility to understand the questionnaire for the interviewees
o Mistakes or errors in the questionnaire
The endline questionnaires have been tested by the FRC DRR officers and VRCS support Officers. 5 people tested both surveys in field conditions in Lenakal (Tanna) taking notes on the following points:
o Facility to understand the questionnaire for the surveyor
o Facility to understand the questionnaire for the interviewees
o Coherence between the question and the area
o Mistakes or errors in the questionnaire
Data for this monitoring survey was collected using three tools. The terms used below will also be
used in graph descriptions in part 4.2 Analysis of the Results.
- Baseline & Endline KAP survey 2017 (Appendix 2): As mentioned the baseline and endline
surveys for WASH & DRR were quite similar but slight changes have been made to the
endline survey in order to access more specific outcomes. Those 2 surveys are available for
consultation in Appendix 2.
- CDCCC Quiz & Survey (Appendix 3): Quiz for CDCCCs. This questionnaire aims at assessing
basic knowledge of CDCCCs, especially knowledge of their own roles and responsibilities in a
first part and assessing also activity held with CDC members (interest, participation etc).
- Hygiene Promotion FGD: Interview guides for discussion groups (FGD, Focal Group
Discussion) with various groups. This semi-structured interview questionnaire is used to
monitor hygiene promotion practices in a participatory way, to gather qualitative evidence of
Page 8 / 33
practices around hygiene in the area of intervention.. The data extracted from this
questionnaire are qualitative and will ensure the results of the KAP questionnaire are
interpreted taking into account people’s points of view.
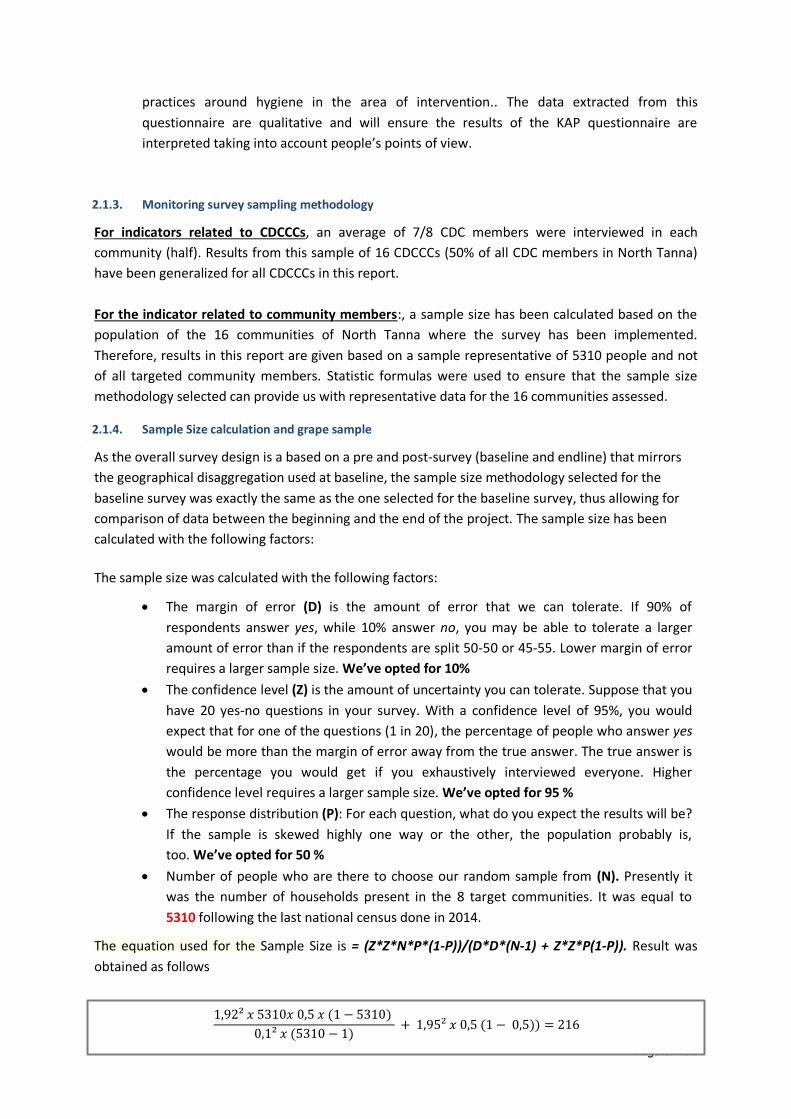
2.1.3. Monitoring survey sampling methodology
For indicators related to CDCCCs, an average of 7/8 CDC members were interviewed in each
community (half). Results from this sample of 16 CDCCCs (50% of all CDC members in North Tanna)
have been generalized for all CDCCCs in this report.
For the indicator related to community members:, a sample size has been calculated based on the
population of the 16 communities of North Tanna where the survey has been implemented.
Therefore, results in this report are given based on a sample representative of 5310 people and not
of all targeted community members. Statistic formulas were used to ensure that the sample size
methodology selected can provide us with representative data for the 16 communities assessed.
2.1.4. Sample Size calculation and grape sample
As the overall survey design is a based on a pre and post-survey (baseline and endline) that mirrors
the geographical disaggregation used at baseline, the sample size methodology selected for the
baseline survey was exactly the same as the one selected for the baseline survey, thus allowing for
comparison of data between the beginning and the end of the project. The sample size has been
calculated with the following factors:
The sample size was calculated with the following factors:
The margin of error (D) is the amount of error that we can tolerate. If 90% of
respondents answer yes, while 10% answer no, you may be able to tolerate a larger
amount of error than if the respondents are split 50-50 or 45-55. Lower margin of error
requires a larger sample size. We’ve opted for 10%
The confidence level (Z) is the amount of uncertainty you can tolerate. Suppose that you
have 20 yes-no questions in your survey. With a confidence level of 95%, you would
expect that for one of the questions (1 in 20), the percentage of people who answer yes
would be more than the margin of error away from the true answer. The true answer is
the percentage you would get if you exhaustively interviewed everyone. Higher
confidence level requires a larger sample size. We’ve opted for 95 %
The response distribution (P): For each question, what do you expect the results will be?
If the sample is skewed highly one way or the other, the population probably is,
too. We’ve opted for 50 %
Number of people who are there to choose our random sample from (N). Presently it
was the number of households present in the 8 target communities. It was equal to
5310 following the last national census done in 2014.
The equation used for the Sample Size is = (Z*Z*N*P*(1-P))/(D*D*(N-1) + Z*Z*P(1-P)). Result was
obtained as follows
1,92² 𝑥 5310𝑥 0,5 𝑥 (1 − 5310)
0,1² 𝑥 (5310 − 1) + 1,95² 𝑥 0,5 (1 − 0,5)) = 216

Page 9 / 33
In total, 216 surveys were to be done in North Tanna during this mission:
SURVEYS AVAILABLE: 216
2.1.5. Limits of the survey
When elaborating the survey, we observed some limits that restrained or slowed down the process
which could be improved.
Questionnaire format limit: The choice of a questionnaire (rather than open questions or
semi-directed interview) was consecutive to the choice of the data collecting tool (ODK).
Answers can therefore be less precise than with open questions, especially for technical
questions.
Sample choice limit: We need to get more information before going to the field to conduct
the survey. A precise and updated map of the area with indications on communities and sub-
Communities (stations) would be very useful to prepare the trip, to estimate the time
needed to conduct the survey and to collect the “extra” data if necessary.
2.2. TARGET POPULATION
Targeted province: The survey will take place in TAFEA province. The KAP survey questionnaires
targeted the households, following the NDMO definition: people living together in a yard and eating
in the same kitchen. The population categories targeted was the adult in charge of the household
with quotas of 50% of women to correct the bias link to the tradition that usually defines the head of
household as men. The population is essentially rural and communities are not very extended .The
survey has been implemented in grape sample in order to cover the different area of the project as
there are many differences between them.
Inside the grape the interviewees have been select in a random way by a definition of a number
of houses to be skip before investigate the next one. Absence or rejection to participate to the
survey were recorded and count as a survey.
Figure 2: KAP survey random investigation
methodology
Page 10 / 33
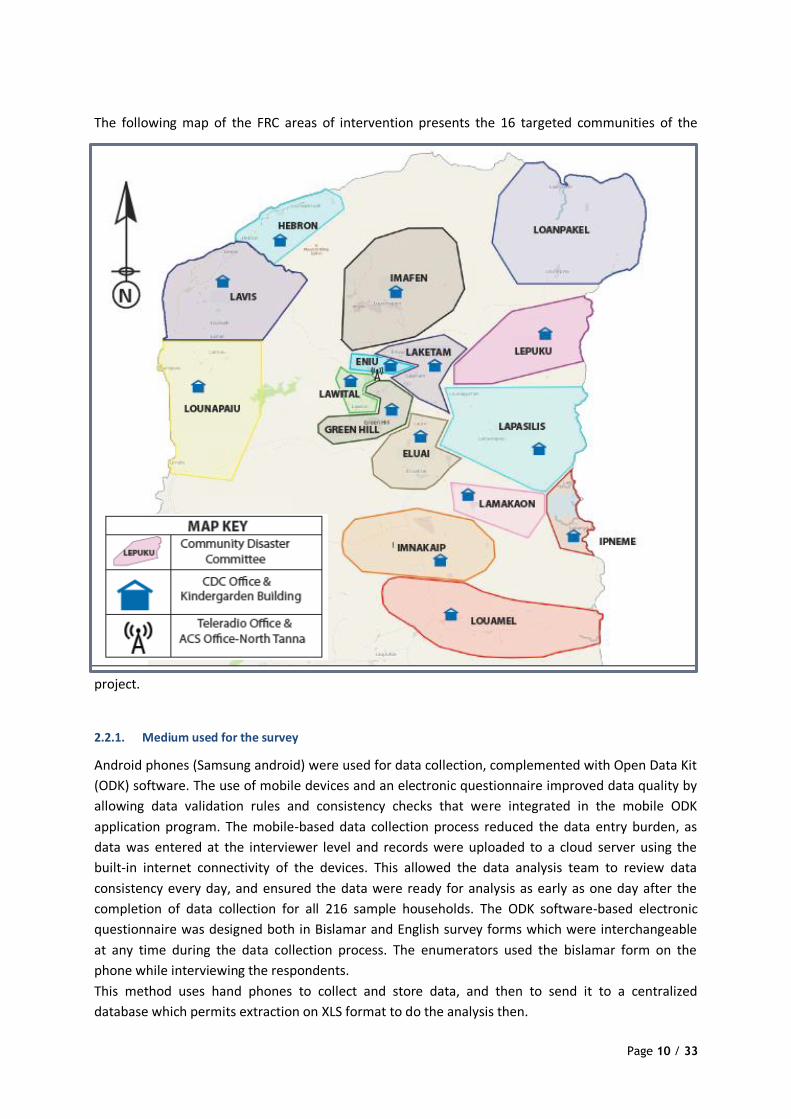
The following map of the FRC areas of intervention presents the 16 targeted communities of the
project.
2.2.1. Medium used for the survey
Android phones (Samsung android) were used for data collection, complemented with Open Data Kit
(ODK) software. The use of mobile devices and an electronic questionnaire improved data quality by
allowing data validation rules and consistency checks that were integrated in the mobile ODK
application program. The mobile-based data collection process reduced the data entry burden, as
data was entered at the interviewer level and records were uploaded to a cloud server using the
built-in internet connectivity of the devices. This allowed the data analysis team to review data
consistency every day, and ensured the data were ready for analysis as early as one day after the
completion of data collection for all 216 sample households. The ODK software-based electronic
questionnaire was designed both in Bislamar and English survey forms which were interchangeable
at any time during the data collection process. The enumerators used the bislamar form on the
phone while interviewing the respondents.
This method uses hand phones to collect and store data, and then to send it to a centralized
database which permits extraction on XLS format to do the analysis then.
Page 11 / 33
After finalizing the questionnaire, phones have been configured on the hand phones and retested to
make sure there was no error. This retesting phase was realized by the FRC DRR officers and VRCS
support Officers in Port Vila. No necessary change was observed and the questionnaires could be
finalized and transferred to the equipped phones. A total of 5 hand phones have been equipped with
ODK software* to realize the survey.
*Open Data Kit (ODK) is a free1 and open-source set of tools which help organizations author, field,
and manage mobile data collection solutions2. ODK provides an out-of-the-box solution for users to:
1. Build a data collection form or survey (XLS Form is recommended for larger forms);
2. Collect the data on a mobile device and send it to a server; and
3. Aggregate the collected data on a server and extract it in useful formats.
In addition to socio-economic and health surveys with GPS locations, ODK is being used to create
decision support for clinicians and for building multimedia-rich nature mapping tools.
2.3. SURVEY IMPLEMENTATION
2.3.1. Preliminary work:
Before departure on the field to conduct the endline survey, a preparatory work has been done in
Port-Vila in different domains: transport, logistics, contact with authorities and communities (see
below), planning of meetings, etc.
Contact with the authorities at province, area and community levels, to plan the meeting dates were
made prior to survey implemention. Usually the contact is done by phone. For the communities, our
counterparts are generally the CDCCCs, ACSs, and chiefs of communities.
This preliminary work was done by the North Tanna DRR & HP Head of project, with support from the
FRC Data & Monitoring officer.
2.3.2. Logistics
Transport: The surveys took place in 16 communities in North Tanna
o Transport was organised from Lenakel with support from the logistic team. Usually, surveyor
team would leave on Monday morning and come back on Friday afternoon.
o Trip arranged on the field with trucks, boat when needed (North West communities)
Accommodation: Accommodation was provided in private or community houses.
Security:
o Networks are not available in every location for communication. Rifill is possible if available.
Staffs are given a satellite phone and are obliged to security calls prior to departure and upon
arrival when going to communities where no network is available
o Life jackets are required (and must be used) when using boat
o Car and boats are basically in good condition.
o No tension or trouble was observed in the visited area.
2.3.3. Survey team
1 ODK can be download on https://opendatakit.org/ 2 Guide line of the French Red Cross available on http://odk-crf.reliefapps.org/

Page 12 / 33
A total of 6 people were engaged on the DRR Endline survey. Based on the conclusion of the FRC
survey experience, it has been decided to work with a small team of surveyors, even if more time
would therefore be needed on the field. Surveyors have been selected regarding their level of
education as well as knowledge of target communities. A reduce number of interviewers reduce
significantly biases link with inconsistency in the way of asking question to community members.
Indeed, an interviewer is always surveying with the same tone in voice and approach, thus giving
more consistency in between surveys.
The team was composed of:
o 1 Data base and Monitoring officer: 1 database and monitoring officer has been recruited
for all VRCS/FRC projects implemented, thus shared in between project. He has a
comprehensive knowledge of survey implementation and was in charge of the first database
analysis (provide graphics to the Head of Project for endline reports). His participation in the
survey implementation provided inputs and increase in quality based on his specific position
in the VRCS and FRC team. He was therefore assigned the role of supervisor in the field, thus
monitoring on a daily basis on the field the quality of surveys and number of surveys
implemented.
o 5 additional Surveyors: In total 5 volunteers (VRCS) were recruited for this survey, based on
their education level and knowledge of communities. There were selected by the Branch
Officer from the VRCS based on their commitment, and their knowledge of language. Indeed,
very often, people in North Tanna have a limited knowledge of bislamar. Being able to
address people in language is a crucial asset to ensure that the survey is understood and
adapted.
2.3.4. Survey planning
All surveys have been implemented in the 16 main project areas from the 31 of July to the 9th of
August 2017. The head of project and data & monitoring officer informed chiefs primarily to make
sure that community leaders were aware of such surveys. In total, 216 surveys were done. Every
survey have been verified / checked by the team supervisor before handling phone to VRCS Office in
Lenakel in order to ensure that no mistakes were made.
2.4. DATA CONSOLIDATION INTO FINAL DATABASE FOR ANALYSIS
The questionnaire of the DRR Survey data base were then sent directly to the ODK platform and
retrieved by North Tanna DRR & HP head of project for primary treatment which permits analysis
(conversion to .xls format tables). This sending took some time as data has to be sent from each
phone via internet. The internet network being sometimes not sufficient for a successful data
transfer, this transfer had to be done several times.
The analysis of the DRR Endline KAP survey has been done by the North Tanna DRR & HP head of
project, during 3 weeks (two week to extract data and one week to compile and analyze them).
The database analysis has been made through comparison of answers observations and percentages.
All data presented in this report are based on direct interpretation of one question issued from the
database, on cross analysis of variables and finally based on comparison with baseline survey data.

Page 13 / 33
Cross analysis of variable has allowed for in-depth results related especially to gender differences or
community of origins of people interviewed in order to sometimes allow for difference analysis and
detailed analysis based on specific contexts.
Those quantitative analysis have been put in prospective with qualitative data issued form the
knowledge of communities after the life of the project, thus allowing to provided complementary
analysis and interpretation of survey results.
2.5. SURVEY LIMITS : JUSTIFICATION OF SURVEY CHOICE PRIOR TO FIELD
IMPLEMENTATION
A. One potential limitation of the survey prior to field implantation is linked with the sample
methodology. At baseline and endline, detailed household listings were unavailable;
therefore, second-stage selection of households was conducted using the random walk
method. When possible, sample selection from household listings is preferable as a more
truly random selection process. In particularly, if not conducted properly, the random walk
method of selecting households in a village may lead to bias in the selection of households,
with households nearer the village central meeting points more likely to be selected than
more isolated households. Nonetheless, the random walk method used to select household
survey to be interviewed is far less time-consuming than methods using household listings
that would be too complicated to allow easy survey implementation in surveys areas.
B. A second potential limitation of the survey prior to field implementation is linked with the
few differences in between the baseline and endline survey questionnaire. Indeed, as
mentioned before, the baseline survey report elaborated on various survey biases linked
with survey design. Indeed, in the baseline, too many questions provided bias results. A
consultation with key Head of project at the VRCS/FRC team had therefore been organised in
order to improve some questions (avoid yes or no question, improve choices for multiple
choice questions to reduce biais, scale question increased to provide better data for in depth
analysis). Therefore, some questions can unfortunately not be compared between the
baseline and the endline survey. This was a choice made by the project team, in order to
reduce bias and increase the survey quality that does not have too many consequences on
the endline survey as only few questions are concerned by those changes.
C. Before the timeframe of the project, cyclone PAM (March 2015) pass through Vanuatu
islands. Tafea was one of the most affected province in Vanuatu, with most of communities
that have been impacted by this cyclone. The impact of this cyclone on people preparedness
and interest toward disasters can be highlighted. It seems that in this KAP survey, it is hard to
capture this influence of PAM on people’s perception or attitudes towards disasters. Also, a
recent situation due to El Nino and consequently creating situations in communities of
droughts had probably affect people’s perception of risks (2016). It is hard to capture in this
survey how those 2 recent situations (droughts and cyclone PAM) have impacted the
changes in mentality and therefore reveal on an objective basis the attribution of changes in
attitudes and practices to the project activities. Indeed, to go in such detail on theories of
change, some different methodologies should be used, and the use of statistical software
would be necessary. The purpose of this study is not scientific but to provide enough

Page 14 / 33
evidence of some changes that occurred during the life of the project in people knowledge,
attitudes and practices. Precautions will therefore be taken in the attribution of changes to
the project in itself.
3. DRR KAP SURVEY RESULTS
3.1. CDC QUIZ RESULTS: MONITORING OF CDC KNOWLEDGE
At the baseline survey stage, CDCCCs did not exist in North Tanna. Those committees were set-up
under the Recovery Project. Therefore, there is no “baseline” information regarding the knowledge
of CDCCCs at initial stage. At the endline stage, a survey was carried out with an average of 7 CDC
members surveyed (~50%). This survey is twofold:
- The first part if a QUIZZ survey with questions asked with true or false answers given by CDC
members. Based on this QUIZZ, scores can be provided to assess CDCCCs knowledge
- The second part is a survey to assess CDCCCs commitment, practices, and interest in their roles
and responsibilities.
CDCCC Quizz Result (Score per CDCCCs)
Province Island Community Endline
Score(/22) %
Tafea Tanna Lavis 20,43 93%
Tafea Tanna Lowital 20,00 91%
Tafea Tanna Greenhill 19,71 90%
Tafea Tanna Lamakaon 19,26 88%
Tafea Tanna Imnakaip 19,18 87%
Tafea Tanna Eniu 18,86 86%
Tafea Tanna Hebron 18,82 86%
Tafea Tanna Lounapaiu 18,86 86%
Tafea Tanna Imafen 17,95 82%
Tafea Tanna Laketam 17,71 81%
Tafea Tanna Eluai 17,43 79%
Tafea Tanna Fetukai 15,67 71%
Tafea Tanna Lapasilis 14,71 67%
Tafea Tanna Ipneme 12,29 56%
Tafea Tanna Lowanpakel 9,86 45%
Tafea Tanna Lepuku 20,43 35%
Average 18,928098 86%
Results show that all CDCCCs in North Tanna do not seem to have the same level of knowledge. Results show that more than 62,2 % of CDC have a rather good knowledge, with an average of more
Community Score
Education level
Lowital 19
Lounapaiu 17
Fetukai 15
Lavis 13
Eluai 12
Laketam 12
Imafen 11
Hebron 10
Imnakaip 10
Greenhill 7
Lapasilis 7
Eniu 6
Lepuku 6
Ipneme 5
Lowanpakel 5
Lamakaon 4
Precaution regarding results need to be taken here as limited number of people were interviewed (~25%
instead of 50% initially planned)
Graph 1: CDC Quizz results by community / comparison with average education level
Page 15 / 33
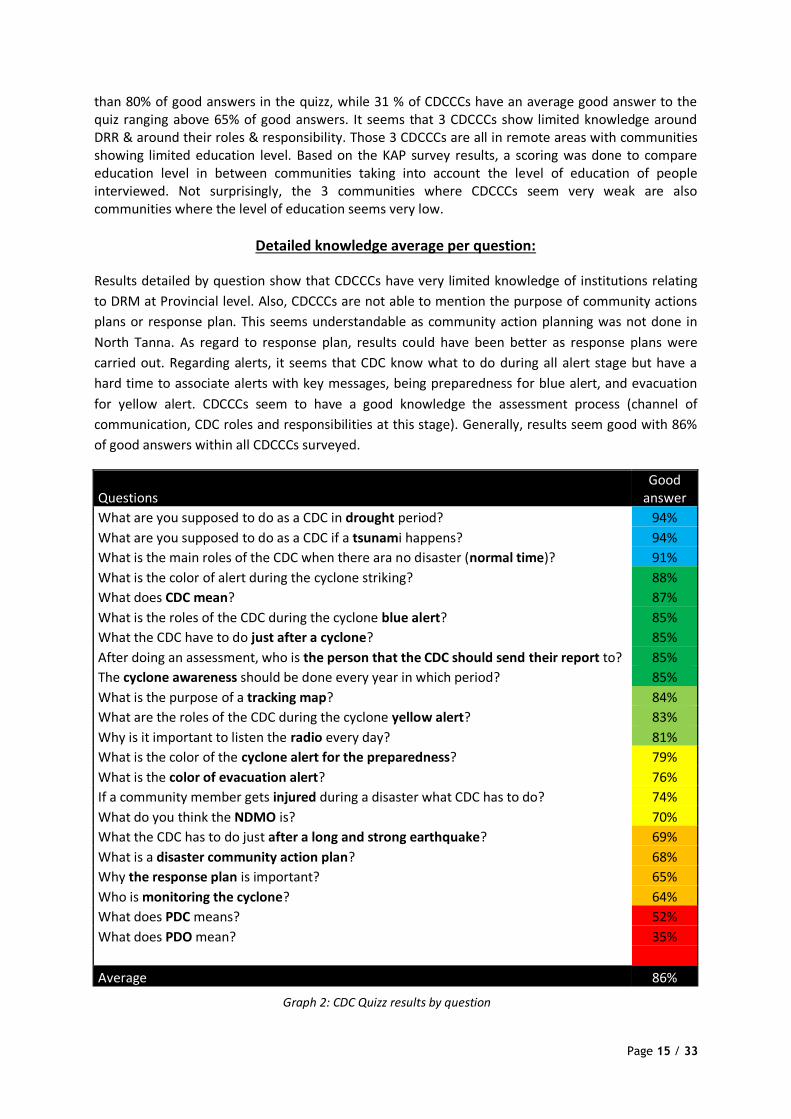
than 80% of good answers in the quizz, while 31 % of CDCCCs have an average good answer to the quiz ranging above 65% of good answers. It seems that 3 CDCCCs show limited knowledge around DRR & around their roles & responsibility. Those 3 CDCCCs are all in remote areas with communities showing limited education level. Based on the KAP survey results, a scoring was done to compare education level in between communities taking into account the level of education of people interviewed. Not surprisingly, the 3 communities where CDCCCs seem very weak are also communities where the level of education seems very low.
Detailed knowledge average per question:
Results detailed by question show that CDCCCs have very limited knowledge of institutions relating
to DRM at Provincial level. Also, CDCCCs are not able to mention the purpose of community actions
plans or response plan. This seems understandable as community action planning was not done in
North Tanna. As regard to response plan, results could have been better as response plans were
carried out. Regarding alerts, it seems that CDC know what to do during all alert stage but have a
hard time to associate alerts with key messages, being preparedness for blue alert, and evacuation
for yellow alert. CDCCCs seem to have a good knowledge the assessment process (channel of
communication, CDC roles and responsibilities at this stage). Generally, results seem good with 86%
of good answers within all CDCCCs surveyed.
Questions Good
answer
What are you supposed to do as a CDC in drought period? 94%
What are you supposed to do as a CDC if a tsunami happens? 94%
What is the main roles of the CDC when there ara no disaster (normal time)? 91%
What is the color of alert during the cyclone striking? 88%
What does CDC mean? 87%
What is the roles of the CDC during the cyclone blue alert? 85%
What the CDC have to do just after a cyclone? 85%
After doing an assessment, who is the person that the CDC should send their report to? 85%
The cyclone awareness should be done every year in which period? 85%
What is the purpose of a tracking map? 84%
What are the roles of the CDC during the cyclone yellow alert? 83%
Why is it important to listen the radio every day? 81%
What is the color of the cyclone alert for the preparedness? 79%
What is the color of evacuation alert? 76%
If a community member gets injured during a disaster what CDC has to do? 74%
What do you think the NDMO is? 70%
What the CDC has to do just after a long and strong earthquake? 69%
What is a disaster community action plan? 68%
Why the response plan is important? 65%
Who is monitoring the cyclone? 64%
What does PDC means? 52%
What does PDO mean? 35%
Average 86%
Graph 2: CDC Quizz results by question
Page 16 / 33
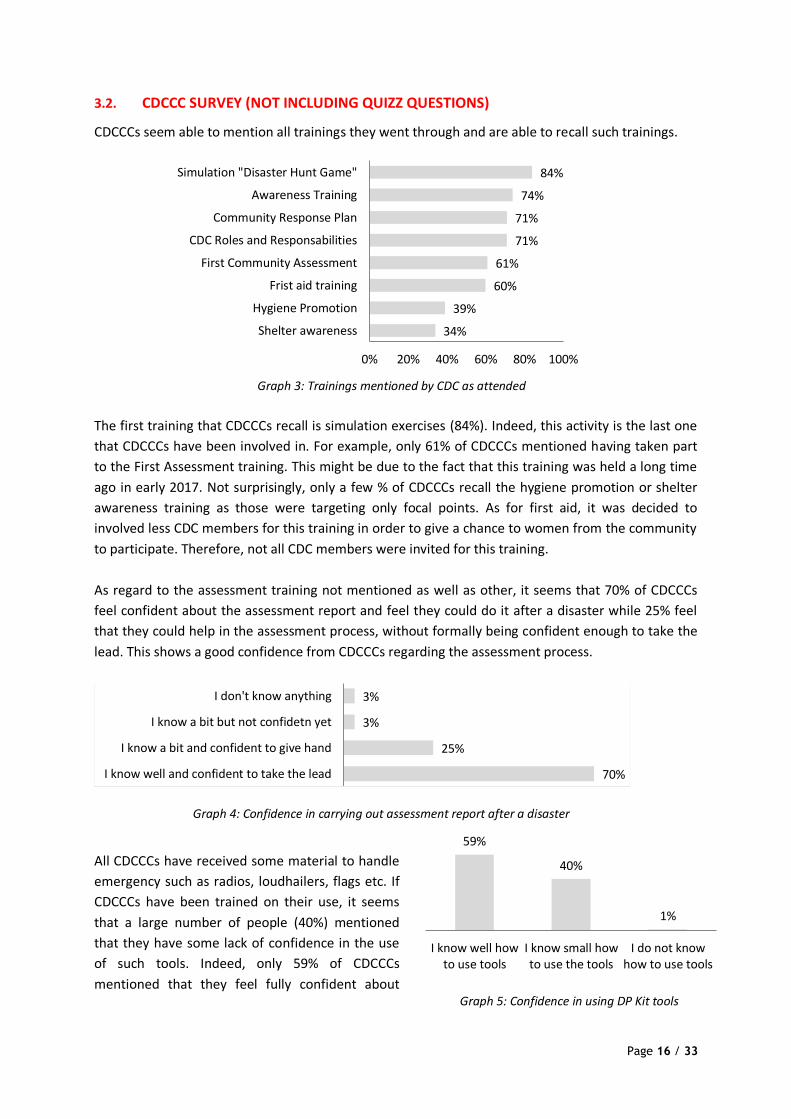
3.2. CDCCC SURVEY (NOT INCLUDING QUIZZ QUESTIONS)
CDCCCs seem able to mention all trainings they went through and are able to recall such trainings.
The first training that CDCCCs recall is simulation exercises (84%). Indeed, this activity is the last one
that CDCCCs have been involved in. For example, only 61% of CDCCCs mentioned having taken part
to the First Assessment training. This might be due to the fact that this training was held a long time
ago in early 2017. Not surprisingly, only a few % of CDCCCs recall the hygiene promotion or shelter
awareness training as those were targeting only focal points. As for first aid, it was decided to
involved less CDC members for this training in order to give a chance to women from the community
to participate. Therefore, not all CDC members were invited for this training.
As regard to the assessment training not mentioned as well as other, it seems that 70% of CDCCCs
feel confident about the assessment report and feel they could do it after a disaster while 25% feel
that they could help in the assessment process, without formally being confident enough to take the
lead. This shows a good confidence from CDCCCs regarding the assessment process.
All CDCCCs have received some material to handle
emergency such as radios, loudhailers, flags etc. If
CDCCCs have been trained on their use, it seems
that a large number of people (40%) mentioned
that they have some lack of confidence in the use
of such tools. Indeed, only 59% of CDCCCs
mentioned that they feel fully confident about
70%
25%
3%
3%
I know well and confident to take the lead
I know a bit and confident to give hand
I know a bit but not confidetn yet
I don't know anything
34%
39%
60%
61%
71%
71%
74%
84%
0% 20% 40% 60% 80% 100%
Shelter awareness
Hygiene Promotion
Frist aid training
First Community Assessment
CDC Roles and Responsabilities
Community Response Plan
Awareness Training
Simulation "Disaster Hunt Game"
Graph 3: Trainings mentioned by CDC as attended
Graph 4: Confidence in carrying out assessment report after a disaster
59%
40%
1%
I know well howto use tools
I know small howto use the tools
I do not knowhow to use tools
Graph 5: Confidence in using DP Kit tools

Page 17 / 33
using those tools. Nonetheless, 83% of CDCCCs mentioned that such tools are useful for the
community.
Mainly, CDCCCs have a role to play in each step of the disaster cyclone. Indeed, CDCCCs have
responsibilities to support community members for preparedness (community work, awareness),
during a disaster (evacuation, warning etc.), and after a disaster (short time after a disaster, CDCCCs
should carry out assessment report, and in a longer term they should support their community to
rebuild). Very interesting, CDCCCs in North Tanna feel confident that they can support their
community in all of those steps. In other KAP survey carried out in other province within FRC project,
very often CDCCCs see their role more strongly during a disaster than before or after such events.
This shows therefore that CDCCCs have well identified their roles at different stage of the disaster
management cycle. Nonetheless, they feel less confident about the assessment stage. One reason for
that is that if CDCCCs have been trained theoretically on the assessment process, they have never
really carried out one real assessment, while they already carried out some preparedness activities
(awareness), response activities (cyclone DONNA) or recovery activities (cyclone PAM recovery)
Out of CDCCCs interview, all CDCCCs members that are not “Chairman’s” have been asked about
their trust toward their chairman. If 70% of CDCCS seem to trust their chairman, 30% of them do not.
Reasons from those who do not trust their chairman is given as followed (in order of priority
mentioned by CDCCCs): i) Lack of involvement of the community, ii) Lack of information shared with
the community, iii) Lack of meetings, iv) Lack of cooperation with chiefs
Finally, CDCCC member have been asked about the main challenges they face in the daily duty in
their community. Mostly (80%), CDC mentioned that they have too many commitments in their
community. Indeed, CDCCCs are leaders from the community, thus inducing that they have other
important commitment to fulfill. The main challenges expressed by CDC seem to come from CDC
members (not active enough, commitment) or from a lack of support but do not seem to come too
much from the community (lack of interest, lack of trust mentioned as lower challenges).
73% 71%
61%
73%
Prepare before adisaster
(awareness)
During Response(pass alert,evacuation)
Assessment after adisaster
Recovery (helpcommunity to re-
build)
Graph 6: Confidence of CDC to be useful in various DRM stages
27% 30% 46%
56%
79%
Communitymember don't
trust CDC
Community notinterested onthe topic of
disaster
CDC not active CDC don't haveenough support
CDC memberhave too much
comittment
Graph 7: Challenges faces by CDCCC members

Page 18 / 33
3.3. DRR KAP SURVEY RESULTS
Recognition of CDCCCs can be analyzed through endline survey results by assessing:
If people are really aware of the roles and responsibilities of their CDCCCs and of their
existence;
If people trust them to carry out awareness.
Therefore, both knowledge and trust toward CDCCs have been assessed throughout the survey.
3.3.1. Knowledge of CDCCCs:
Nonetheless, this shows that at least more than 70% of people are able to recognize the existence of committees set up in their community. When asked about the existence of CDCCCs in their communities, 89% of people are mentioning at endline stage that those committees do exist in their community.
Secondly, people seem to have a comprehensive understanding of CDCCCs roles, as they can identify the main CDCCCs roles and responsibilities. Indeed, people recognized that:
CDCCCs should do awareness (75%)
CDCCCs should lead community work do mitigate risks (36%)
CDCCCs should pass warnings (32%)
CDCCCs should support in evacuation (24%)
CDCCCs should support in post disaster assessment (22%) At baseline stage, 64% of people were not able to mention at least one CDC role, while every respondent at endline stage is able to mention at least one of the CDCCCs roles.
52,78%
24,07%
0,93%
22,22%
CDC Red CrossCommittee
Watercommittee
Don’t know
75,90%
24,10% 32,00%
36,10%
4,60%
22,22%
10,20%
0%
12%
25%
6% 7% 3% 1% 1%
64,80%
Makingawareness
Evacuatepeople
Pass warnings Lead thecommunity
disaster work
Fundraising To makeassessment
after disaster
Do thedisaster plan
Don't know
Endline Baseline
Firstly, at endline stage, 52% of people are really able to say what is a CDC, while 24% are sometimes confusing CDCCCs as being a Red Cross committee. This confusion is quite commonly accepted in Vanuatu when starting a project to build capacities of CDCCCs. Indeed, often people tend to associate the CDCCCs with the partner involved in the project.
Graph 8: % of people able to mention what a CDC is
Graph 9: CDCCCs roles and responsibilities identified by community members
Page 19 / 33
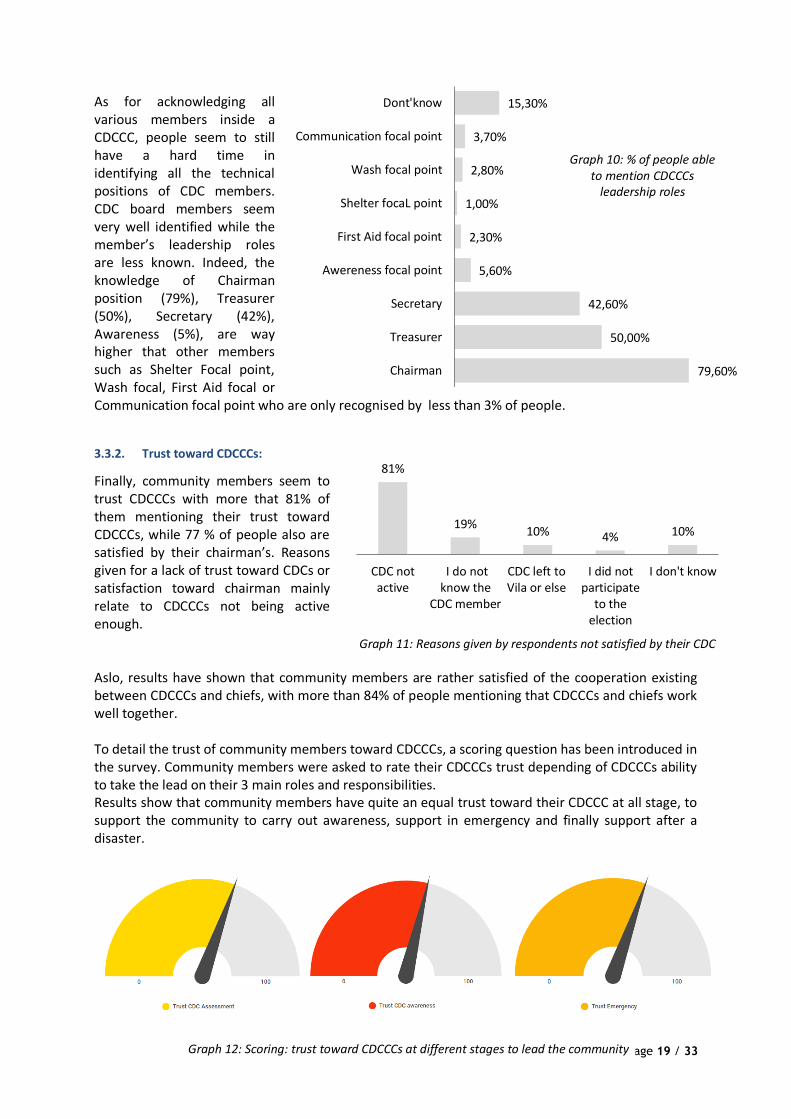
As for acknowledging all various members inside a CDCCC, people seem to still have a hard time in identifying all the technical positions of CDC members. CDC board members seem very well identified while the member’s leadership roles are less known. Indeed, the knowledge of Chairman position (79%), Treasurer (50%), Secretary (42%), Awareness (5%), are way higher that other members such as Shelter Focal point, Wash focal, First Aid focal or Communication focal point who are only recognised by less than 3% of people.
3.3.2. Trust toward CDCCCs:
Finally, community members seem to trust CDCCCs with more that 81% of them mentioning their trust toward CDCCCs, while 77 % of people also are satisfied by their chairman’s. Reasons given for a lack of trust toward CDCs or satisfaction toward chairman mainly relate to CDCCCs not being active enough. Aslo, results have shown that community members are rather satisfied of the cooperation existing between CDCCCs and chiefs, with more than 84% of people mentioning that CDCCCs and chiefs work well together. To detail the trust of community members toward CDCCCs, a scoring question has been introduced in the survey. Community members were asked to rate their CDCCCs trust depending of CDCCCs ability to take the lead on their 3 main roles and responsibilities. Results show that community members have quite an equal trust toward their CDCCC at all stage, to support the community to carry out awareness, support in emergency and finally support after a disaster.
79,60%
50,00%
42,60%
5,60%
2,30%
1,00%
2,80%
3,70%
15,30%
Chairman
Treasurer
Secretary
Awereness focal point
First Aid focal point
Shelter focaL point
Wash focal point
Communication focal point
Dont'know
81%
19% 10% 4% 10%
CDC notactive
I do notknow the
CDC member
CDC left toVila or else
I did notparticipate
to theelection
I don't know
Graph 10: % of people able to mention CDCCCs
leadership roles
Graph 11: Reasons given by respondents not satisfied by their CDC
Graph 12: Scoring: trust toward CDCCCs at different stages to lead the community
Page 20 / 33
I In other surveys carried out on other projects in Torba and Malekula, results were quite different, with most of people mentioning the lack of trust toward CDCs in preparedness time (carrying out awareness). This is likely to be due to the good awareness sessions carried out both by CDCCCs on disaster and by shelter focal point on Shelter Awareness. Indeed, among all respondents, more than 60% of them have already taken part in an awareness session, with 75% of them mentioning having taken part to awareness on cyclone / disaster, 48% mentioning shelter
awareness and 10% mentioning awareness around traditional signs and alert systems.
3.3.3. Knowledge of alert
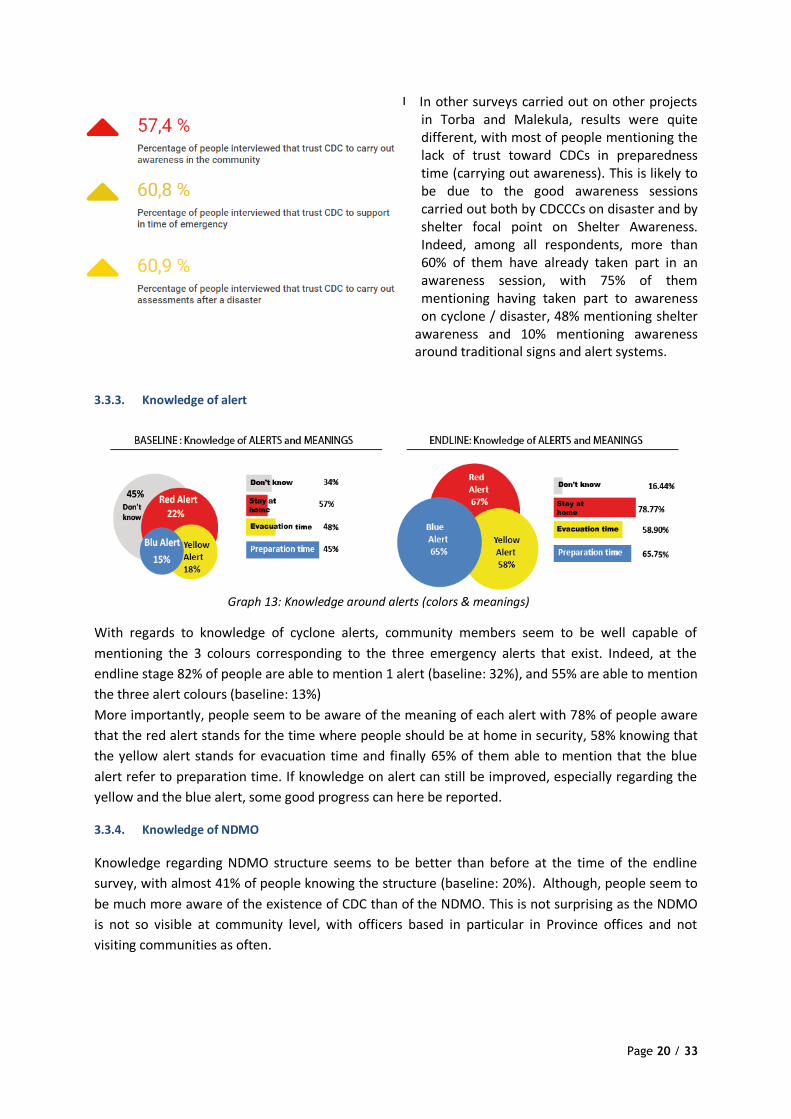
With regards to knowledge of cyclone alerts, community members seem to be well capable of
mentioning the 3 colours corresponding to the three emergency alerts that exist. Indeed, at the
endline stage 82% of people are able to mention 1 alert (baseline: 32%), and 55% are able to mention
the three alert colours (baseline: 13%)
More importantly, people seem to be aware of the meaning of each alert with 78% of people aware
that the red alert stands for the time where people should be at home in security, 58% knowing that
the yellow alert stands for evacuation time and finally 65% of them able to mention that the blue
alert refer to preparation time. If knowledge on alert can still be improved, especially regarding the
yellow and the blue alert, some good progress can here be reported.
3.3.4. Knowledge of NDMO
Knowledge regarding NDMO structure seems to be better than before at the time of the endline
survey, with almost 41% of people knowing the structure (baseline: 20%). Although, people seem to
be much more aware of the existence of CDC than of the NDMO. This is not surprising as the NDMO
is not so visible at community level, with officers based in particular in Province offices and not
visiting communities as often.
Graph 13: Knowledge around alerts (colors & meanings)
Page 21 / 33
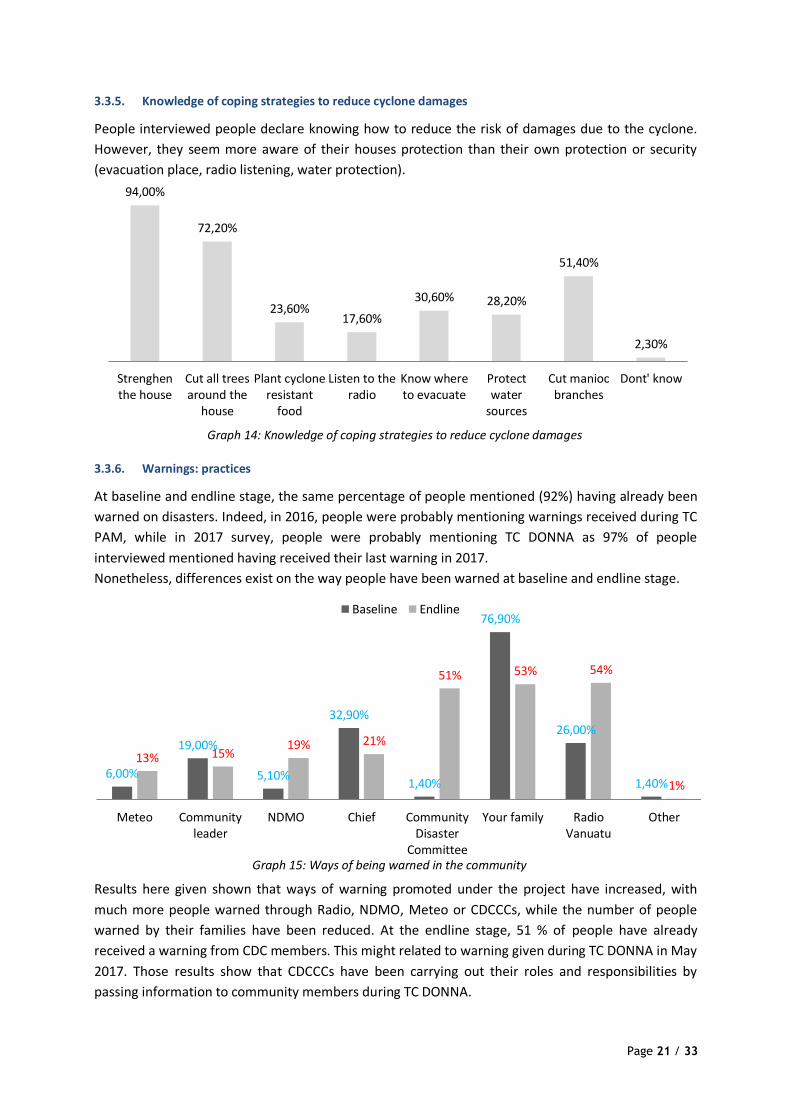
3.3.5. Knowledge of coping strategies to reduce cyclone damages
People interviewed people declare knowing how to reduce the risk of damages due to the cyclone.
However, they seem more aware of their houses protection than their own protection or security
(evacuation place, radio listening, water protection).
3.3.6. Warnings: practices
At baseline and endline stage, the same percentage of people mentioned (92%) having already been
warned on disasters. Indeed, in 2016, people were probably mentioning warnings received during TC
PAM, while in 2017 survey, people were probably mentioning TC DONNA as 97% of people
interviewed mentioned having received their last warning in 2017.
Nonetheless, differences exist on the way people have been warned at baseline and endline stage.
Results here given shown that ways of warning promoted under the project have increased, with
much more people warned through Radio, NDMO, Meteo or CDCCCs, while the number of people
warned by their families have been reduced. At the endline stage, 51 % of people have already
received a warning from CDC members. This might related to warning given during TC DONNA in May
2017. Those results show that CDCCCs have been carrying out their roles and responsibilities by
passing information to community members during TC DONNA.
94,00%
72,20%
23,60% 17,60%
30,60% 28,20%
51,40%
2,30%
Strenghenthe house
Cut all treesaround the
house
Plant cycloneresistant
food
Listen to theradio
Know whereto evacuate
Protectwater
sources
Cut maniocbranches
Dont' know
6,00%
19,00%
5,10%
32,90%
1,40%
76,90%
26,00%
1,40%
13% 15% 19% 21%
51% 53% 54%
1%
Meteo Communityleader
NDMO Chief CommunityDisaster
Committee
Your family RadioVanuatu
Other
Baseline Endline
Graph 14: Knowledge of coping strategies to reduce cyclone damages
Graph 15: Ways of being warned in the community
Page 22 / 33
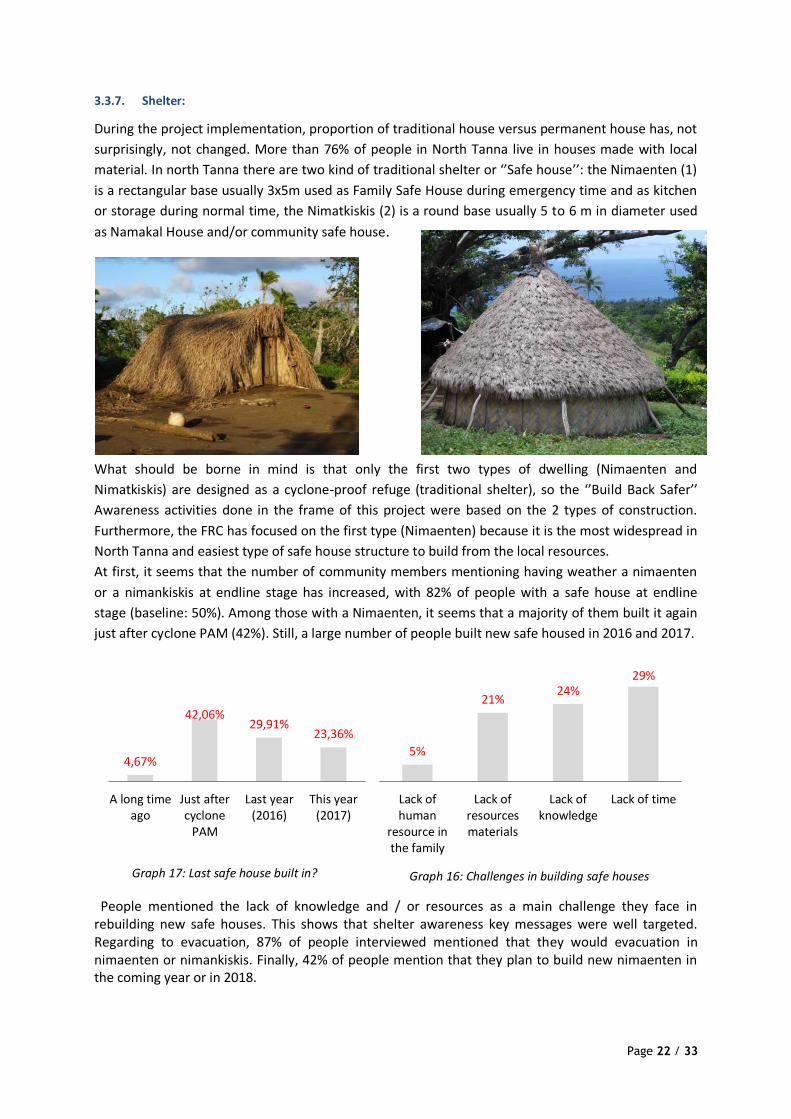
3.3.7. Shelter:
During the project implementation, proportion of traditional house versus permanent house has, not
surprisingly, not changed. More than 76% of people in North Tanna live in houses made with local
material. In north Tanna there are two kind of traditional shelter or ‘’Safe house’’: the Nimaenten (1)
is a rectangular base usually 3x5m used as Family Safe House during emergency time and as kitchen
or storage during normal time, the Nimatkiskis (2) is a round base usually 5 to 6 m in diameter used
as Namakal House and/or community safe house.
What should be borne in mind is that only the first two types of dwelling (Nimaenten and
Nimatkiskis) are designed as a cyclone-proof refuge (traditional shelter), so the ‘’Build Back Safer’’
Awareness activities done in the frame of this project were based on the 2 types of construction.
Furthermore, the FRC has focused on the first type (Nimaenten) because it is the most widespread in
North Tanna and easiest type of safe house structure to build from the local resources.
At first, it seems that the number of community members mentioning having weather a nimaenten
or a nimankiskis at endline stage has increased, with 82% of people with a safe house at endline
stage (baseline: 50%). Among those with a Nimaenten, it seems that a majority of them built it again
just after cyclone PAM (42%). Still, a large number of people built new safe housed in 2016 and 2017.
People mentioned the lack of knowledge and / or resources as a main challenge they face in rebuilding new safe houses. This shows that shelter awareness key messages were well targeted. Regarding to evacuation, 87% of people interviewed mentioned that they would evacuation in nimaenten or nimankiskis. Finally, 42% of people mention that they plan to build new nimaenten in the coming year or in 2018.
4,67%
42,06% 29,91%
23,36%
A long timeago
Just aftercyclone
PAM
Last year(2016)
This year(2017)
5%
21% 24%
29%
Lack ofhuman
resource inthe family
Lack ofresourcesmaterials
Lack ofknowledge
Lack of time
Graph 17: Last safe house built in? Graph 16: Challenges in building safe houses

Page 23 / 33
4. WASH KAP SURVEY RESULTS (FOCUS HYGIENE)
4.1. IDENTIFICATION OF HYGIENE PROMITION KEY MESSAGES
Results show that progresses have been made toward identification of key hygiene messages. It seems that people are able to really recognize the importance of washing their hands. At baseline stage, only 3 % of people are able mention 3 key messages, 6% ae able to mention 2 key messages and 88% of people are able to mention at least 1 key message. At endline stage, increase in knowledge among all people interviewed seems to be quite limited, with:
78 % of people of able to mention 1 key messages
7 % of people of able to mention 1 key messages
14 % of people of able to mention 3 key messages Nonetheless, at endline stage if those general results are compared with those from people who had attended awareness, evidence is given that awareness has a good impact on people knowledge. Indeed, the following results are here given for people who attending hygiene awareness:
21 % of people of able to mention 1 key messages
28 % of people of able to mention 1 key messages
49 % of people of able to mention 3 key messages
The output 3.2 stated in the project proposal was targeting people who attending awareness sessions being capable of remembering at least 3 key messages: washing hands, good water management at home, management and preparation of food. Therefore, the final indicator for this output is 49 %. (Target : 75%). Those results show therefore that objectives are not quite achieved. Indeed, hygiene promotion activities started only in January / February 2017, with trainings of facilitators held until June and July 2017. Therefore, people trained have started awareness in the community very late in the project, which can explain limited results based on a limited number of awareness carried out at this stage. Most importantly, results show an increase of people identifying a link between good hygiene behaviors and coping strategies to prevent diarrheas. Indeed, people’s knowledge relating to diarrheas causes but also to ways to prevent diarrheas seems to have increased.
75,9%
13,4% 7,9% 2,8%
95,1%
65,6% 63,9%
6,6%
Washing hands Good watermangemen at
home
Management andpreparation of
food stuff
Other
Graph 18: Knowledge of Hygiene Key messages

Page 24 / 33
For example, at endline stage, 68% of people identified that the protection of food, and a good drinking water reduce the risk of diarrhea, while 51% of people identify that washing hands reduce the risk of diarrhea. Also, at endline stage, 27 % of people identified that dirty hands can increase to diarrheas episodes.
Important times to wash hands: Firstly, at baseline stage, 10% of people are not able to mention when is it important to wash hands (Don’t know), while everybody was able to provide some information at endline stage on such question.
4,60% 6,90% 13,90%
35,20% 43,50%
2,30%
31,50%
5%
27% 39%
45%
76%
3% 11%
Use latrine Not havewashed hands
Dirty hands ordirty utensilsin the mouth
Eat raw ordirty food
Drink dirtywater
Other Don’t know
Baseline Endline
12,50% 6,50% 20,40%
43,10% 46,30% 26,40%
3,70% 10% 14%
42% 51%
68% 68%
6%
Protectenvironment
Use latrine Good personalhygiene
Wash hands Protect food Good drinkingwater
Other
Baseline Endline
3% 2% 5%
17% 17% 15%
33%
1% 10,40%
18% 22%
43%
64% 66% 71%
98%
2%
Baseline Endline
Graph 19: Causes of diarrheas
Graph 20: Coping strategies to prevent diarrheas
Graph 21: When is it important to wash hands?

Page 25 / 33
At baseline stage, 65 % of people are able to mention only 1 to 3 crucial time to wash hands, while only 5 % of people seem to know more than 5 crucial steps. At endline stage, an very good increase can be noted with 42 % of people yet mentioning 1 to 3 crucial time to wash hands, while 37 % of people seem to know more than 5 crucial steps. If those results from the endline are crossed with only people having participated in hygiene awarenesss, results seem even higher, showing therefore the impact of such awareness on people’s knowledge. Indeed, at endline stage, among people having participated to hygiene awareness, 90% of them are able to mention more than 5 crucial times to wash hands.
4.2. ACCESS TO SOAP / ASH
Results in endline survey show a good increase in accessibility of soap. Precaution must be taken in analysis of such data as those differences seem quite important. One explanation for this very good increase in accessibility could be that at early stage, people in the community were affected by cyclone PAM yet. Therefore, their priority was probably not to have soap available at home. After 2 years now, people have started to recover from cyclone, thus allowing them to take more care at home around hygiene. Also, it seems that at baseline stage, soap was less accessible for people as 80% of people mentioned the problem of access to soap as a main issue while only 60% of them mentioned it at endline stage. Even though biases in survey results are always possible, it is likely that availability of soap and/or ash from initial to endline stage has increased.
Based on those results, we can say that 91,1% of people have access to ash, while 53,2% of people have access to soap by then end of the project.
4.3. USE OF SOAP / ASH
Results seem to show a good increase in practices around handwashing as 75% of people mentioned at endline stage that they wash their hands after defecation (baseline:25%); also 98% of people identify that it is important to wash hands after defecation (baseline: 75%). Nonetheless, precaution need to be taken toward those results as it seems that only 50% of people really mean that they use water and soap.
3,70% 13,90%
80,10%
6,00%
50,00%
18%
40%
61%
2% 6%
Soap is tooexpensive
I am not useto it
Soap is notavailable
I don't know Other
Baseline Endline
3,24%
53,24% 51,39%
91,16%
Baseline Endline
Soap Ash
25,00%
75,00%
Baseline Endline
Graph 22: Soap/ash available
Graph 23: Reasons for “no soap used”
Graph 24: Practice handwashing after defecation

Page 26 / 33
It is not easy to access practices through surveys as the risk of bias is always important. Indeed, people might tend to say things they do that do not reflect realistically practices in their homes. Nonetheless, practices can be assessed here through observation around diarrhea cases. Indeed, both surveys have been carried out in a dry time (March 2016, during El Nino event and in July 2017, during the dry season in Vanuatu). When asking people about presence of diarrhea among kids, a decrease of diarrhea can be noted from baseline to endline. Indeed, at endline stage more than 55% of people mentioned that diarrheas episodes arrive more than every 6 months. Those results are highly useful to support the evidence of improvement not only in people’s knowledge but also in hygiene practices in North Tanna throughout the program. Improvements regarding these figures can also explained by the increase of people boiling water to clean their water (Baseline: 29% / Endline: 59,8%)
6,50% 9,30%
93,50%
0,90% 12%
50%
89%
2%
Soil/Ash Water and soap Only water Other
Baseline Endline
15% 13%
3% 7%
12%
34%
21% 22,20% 20,80% 11,60%
8,00% 15,70%
9,70% 13,40%
Multipletime in amonth
Once amonth
One every3 months
One every6 months
One peryear
Rarely I don'tknow
Endline Baseline
Graph 25: What is used for handwashing
Graph 26: Frequency of diarrhea episodes among kids

Page 27 / 33
5. RECOMMENDATIONS
5.1. RECOMMENDATION ON SURVEY METHODOLOGY
Based on the analysis given in this report, some key recommendations can be given to improve survey results and avoid all bias or limits recognised after field survey and results analisis. Length of the questionnaire: We should review the number of questions either by combining some of them or review the questions’ order so that the questions dealing with our priority issues are asked at the beginning of the interview. When setting up his questionnaire, the surveyor should remember to have less but more precise questions. Questions relevance: We should therefore reorganize the way we collect the information and try to get some ahead (like the community profiles) to be able to better adapt our questionnaire to the targeted population. Questionnaire translation: Without entering into deep linguistic considerations, we should remember to design the questionnaires in English first and then translate it into Bislama, as English language has a higher precision level than Bislama. Also, making sure that people on the field translating in language should take precautions in their translation is very important. Indeed, translation in language was critical to ensure that people would understand but there is therefore higher risk to translate differently of what is said in Bislama. Rejection reasons: when an interviewee refuses to answer the questionnaire, the surveyor should at least get information on location, gender and age of the interviewee and reason of refusal. Data collecting tool (ODK):
- When using it, the surveyor should not focus only on the phone and should remember to
look around to establish eye contact with the interviewee and be able t notice small details
- The surveyor should be careful in the choice of the reference names as it cannot be viewed
or changed before receiving the analysis
- The surveyor should not put too many and/or too heavy pictures
- The necessary time to gather all data, transferring and converting them before the analysis
phase should be planned ahead very carefully.
Sample size and location: We need to get more information about the communities beforehand to have a more representative sample Surveyors’ training:
- We should spend and take more time with the surveyors to explain them the objectives, the
process and the use of this survey. This is particularly true for the WASH questionnaire which
requires a more technical approach.
- We should also give them more time to do the survey (reduce daily objectives?) to get better
quality results and not only quantity.
- We also should systematically do a debriefing with them after the daily surveys.

Page 28 / 33
5.2. RECOMMENDATION ON ACTIVITES
This survey was conducted to give primarily quantitative data on people’s knowledge, attitudes and practices at the community level in order to best plan the implementation of the result 1 & 4 of the North Tanna project, which is aiming at building safer and more resilient communities. Regarding the results of this survey, it seems that the indicators selected primarily for the result 1 seem to be consistent with the overall objective of the project. Nonetheless, the analysis of this survey shows, in more detail, that some specific attentions must be given to certain elements, in order to make sure that project activities are really taking into consideration people knowledges and attitudes toward disasters in order to build upon the existing to reinforce capacities and knowledge, but also to build upon people priorities. The following recommendations are based on the survey results and are stated by sector:
5.2.1. DISASTER RELATED RECOMMENDATIONS
1. KNOWLEDGE DRR
Graphic ref Analyze summary Recommendation
Graphic 8, 9, 10
- People already have an idea on CDC’s roles and responsibilities but in detailed, people seem to still not clearly identify all CDC roles
- Make sure than community members are informed properly on CDC roles and on detailed roles inside the committee
- Detail membership leadership roles to community members for them to know who is the WASH focal point and what is his specific role etc…
Graphic 13
- Cyclone alerts are only partially known by the people
- Continue awareness on alerts to ensure that people really know what to do in case of cyclone alerts
Paragraph 2.5.4
- People do not largely know the NDMO, color alerts and either the CDC
- Develop awareness tools that will focus for people on key actions to carry on during alerts (movie, participatory video)
- Organize simulation exercises in all communities to test the alert system during cyclone scenario
Graphic 14
- People have good knowledge of coping strategies to reduce cyclone damages but it seems to focus at the household level on both shelters, avoiding danger around the house. Key messages such as protecting water sources, protecting food supply (increase of “cyclone food”) or information management could be improved
- Awareness on how to reduce cyclone damages specific to food security
- Awareness on information management such as early warning systems to ensure that people can easily know how to access information on warnings
Graphic 17
- Challenge in building traditional safe houses linked to both knowledge and availability of local ressources
- Continue to promote “Build Back Better approach” with the key messages identified as those key messages seem to suit the need identified through this KAP survey
2. ATTITUDE & PRACTICES DRR
Graphic ref Analyze summary Recommendation
Graphic 12
- People seem to trust their CDCCCs to support communities reduce effects of disasters
- Monitoring of CDCCCs to make sure that they keep active
- Engage CDC to work with the community to reduce disasters effects by designing Community Action Plan that fits people’s priority and concerns to ensure
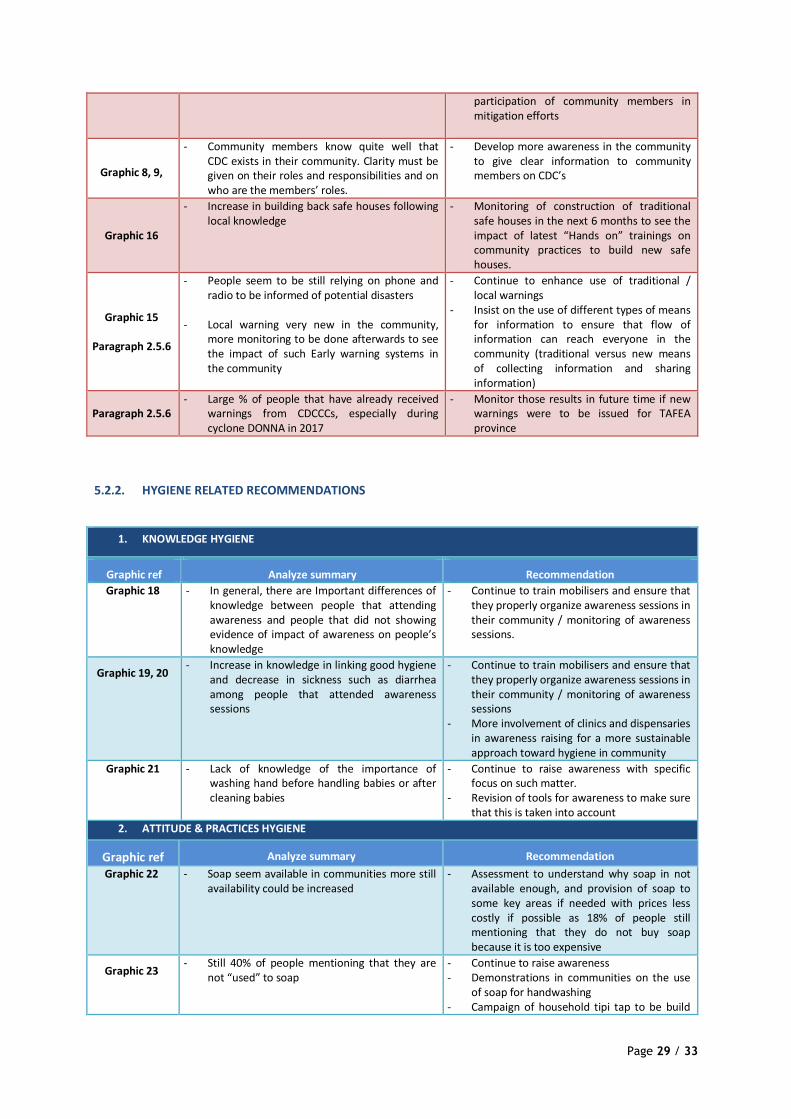
Page 29 / 33
participation of community members in mitigation efforts
Graphic 8, 9,
- Community members know quite well that CDC exists in their community. Clarity must be given on their roles and responsibilities and on who are the members’ roles.
- Develop more awareness in the community to give clear information to community members on CDC’s
Graphic 16
- Increase in building back safe houses following local knowledge
- Monitoring of construction of traditional safe houses in the next 6 months to see the impact of latest “Hands on” trainings on community practices to build new safe houses.
Graphic 15
Paragraph 2.5.6
- People seem to be still relying on phone and radio to be informed of potential disasters
- Local warning very new in the community, more monitoring to be done afterwards to see the impact of such Early warning systems in the community
- Continue to enhance use of traditional / local warnings
- Insist on the use of different types of means for information to ensure that flow of information can reach everyone in the community (traditional versus new means of collecting information and sharing information)
Paragraph 2.5.6 - Large % of people that have already received
warnings from CDCCCs, especially during cyclone DONNA in 2017
- Monitor those results in future time if new warnings were to be issued for TAFEA province
5.2.2. HYGIENE RELATED RECOMMENDATIONS
1. KNOWLEDGE HYGIENE
Graphic ref Analyze summary Recommendation
Graphic 18 - In general, there are Important differences of knowledge between people that attending awareness and people that did not showing evidence of impact of awareness on people’s knowledge
- Continue to train mobilisers and ensure that they properly organize awareness sessions in their community / monitoring of awareness sessions.
Graphic 19, 20 - Increase in knowledge in linking good hygiene
and decrease in sickness such as diarrhea among people that attended awareness sessions
- Continue to train mobilisers and ensure that they properly organize awareness sessions in their community / monitoring of awareness sessions
- More involvement of clinics and dispensaries in awareness raising for a more sustainable approach toward hygiene in community
Graphic 21 - Lack of knowledge of the importance of washing hand before handling babies or after cleaning babies
- Continue to raise awareness with specific focus on such matter.
- Revision of tools for awareness to make sure that this is taken into account
2. ATTITUDE & PRACTICES HYGIENE
Graphic ref Analyze summary Recommendation
Graphic 22 - Soap seem available in communities more still availability could be increased
- Assessment to understand why soap in not available enough, and provision of soap to some key areas if needed with prices less costly if possible as 18% of people still mentioning that they do not buy soap because it is too expensive
Graphic 23 - Still 40% of people mentioning that they are
not “used” to soap - Continue to raise awareness - Demonstrations in communities on the use
of soap for handwashing - Campaign of household tipi tap to be build

Page 30 / 33
with local material to be held. CDCCC wash focal point could organise campaign and provide each family that managed to build its household tipi - tap with 1 or 2 free soaps as an example. This kind of activity could be carried out by the VRCS in support to CDCCC as an ongoing activity.
- Build tipi tap in schools and kindergarten and monitor practices changing in kindi and schools.
Graphic 25 - % of People mentioning that they wash their hand with “only water” still very important
- Monitor with qualitative information the reason why people do not use soap. In general, it seems that customs believes in North Tanna do not really help in ensuring that people would use soap. Indeed, in focus groups interviews, people have reported that they though that soap would bring bacteria instead of killing them. Mostly people would use soap to wash clothes.
- Continue to raise awareness on the importance of using soap
Graphic 24, 25 - Good increase of people mentioning that they
do wash their hand after defecation. Nonetheless, those results seem yet limited as 50°% of people mentioned that they use only water to wash their hands
- Awareness rising to keep ongoing through churches, schools, CDCCCs and Kindergarten as “low cost” activities that the VRCS could follow up on.
Graphic 26 - Decrease in diarrhea episodes between
baseline and endline survey. Even though it is hard to attributes this changes only to awareness made on hygiene promotion, this still gives evidence of the impact of awareness at the community level. Also, it seems that there is a good increase of people boiling water, which could help in such results increase.
- Awareness rising to keep ongoing through churches, schools, CDCCCs and Kindergarten as “low cost” activities that the VRCS could follow up on.
- Insist on “boiling water” messages
6. EXIT STRATEGY ACTIVITIES PROPOSED
6.1. DRR LOW COST ACTIVITIES FOR THE VRCS AS EXIT STRATEGY:
As a general conclusion of the endline, those main recommendations can be given for further achievements to be reached during further implantation phases of DRR activities:
- Continue to encourage CDC members to raise awareness with a focus given to cyclone
yet, even though endline results seem really good, in order to ensure that the level of
knowledge does not decrease. >>> Low cost activity for the VRCS
- Encourage CDC to raise awareness on droughts and coping mechanism to better manage
food and water in difficult contextual situations such as cyclone preparedness or
recovery but also droughts. >>> Low cost activity for the VRCS
- Focus on Family Disaster plan along with the support of CDC members as Community
Disaster Plan seem to provide a good tool for a prepared community but with yet some
gaps identified at the family level in terms of advice given at family level to better

Page 31 / 33
prepare for disasters. >>> Cost activity for the VRCS (Funded require to pay for the
printing of “Family Disaster Plans”).
- Support CDC members for the design of their action plan by organising trainings to draft
with CDC and community members a Community Action Plan. The VRCS could support
CDCCCs in such activities and monitor after a few months progress made by CDC
members. This approach could be very effective in order to :
o Reduce turnover within a CDC as members will probably be more inclined to be
active if they have a project to create, conduct and manage over a few months
o Will help to provide CDC with some acknowledgement of their role during
preparation time and not only during response time by their community
o Will help CDC member to take better ownership of their specific roles internally
(Chairman, treasurer, secretary, etc.)
This could be a >>> low cost activity for the VRCS.
6.2. HYGIENE PROMOTION LOW COST ACTIVITIES FOR THE VRCS AS EXIT STRATEGY:
As a general conclusion of the endline, those main recommendations can be given for further achievements to be reached during further implantation phases of HYGIENE activities:
- Continue to monitor that awareness are made in the communities by all mobilisers
trained such as CDCCCs, Schools teachers, Kindergarten teachers, and Church leaders >>>
low cost activity for the VRCS
- Encourage CDCCCs to develop “Tipi tap” campaign in their community to build their own
family handwashing stations with local material and provide if possible those with soaps
if built. >>> Cost activity for the VRCS (funded needed if soap provided in such
campaigns)
- Involve more actors from the health clinics in the delivery of awareness in the
community >>> low cost activity
- Organise awareness events with VRCS volunteers during key days such as “Handwashing
Day” or “Water Day” by involving schools and CDCCCs in such event. Focus on key
messages and make sure that demonstrations are made to people >>> low cost activity

Page 32 / 33
7. BIBLIOGRAPHY – WEBOGRAPHY
American Red Cross (2011) -Community based disaster risk reduction household survey guide Croix Rouge Française (2014) – Fixed Obligation Grant (FOG) Award No. AID-OFDA-F-14-00010, under "Together Becoming Resilient (TBR4)", Proposition de projet, USAID Croix Rouge Française (2014) - Community selection, assessment report, 35 p., document opérationnel Medecin du Monde (2011) - collecte de données, Méthodes quantitatives l’exemple des enquêtes CAP, 40p., document méthodologique
8. LIST OF APPENDICES
1. Baseline Infographic POSTER DRR & WASH
2. Baseline and Endline Survey Questionnaires
3. CDC Quizz & Survey Questionnaire
4. Baseline & Endline Database
This report was prepared on August 2017. This report reflects the work carried on by the
Vanuatu & French Red Cross in North Tanna in order to train CDCCC members under a
RECOVERY Project funded by International Federation of Red Cross & Red Crescent
Societies.
Author: Isabelle CHOUTET, Disaster Risk Reduction Head of Project for the French Red
Cross

Page 33 / 33
v
DAVID BOISSON – FRC HEAD OF DELEGATION
PH. (678) 774 7330
EMAIL: [email protected]
VANUATU RED CROSS SOCIETY
P.O. BOX 618
PORT VILA
VANUATU
TELEPHONE: (678) 27418 / FAX: (678) 22599
EMAIL: [email protected]