frequency and cumulative frequency modes symmetry …jackd/stat203_2011/wk01_2_full.pdf · -...
TRANSCRIPT
Today’s agenda:
- Frequency and Cumulative Frequency
- Modes
- Symmetry and Skew
- Mean and Median
- Which is best?
- Video: The mean
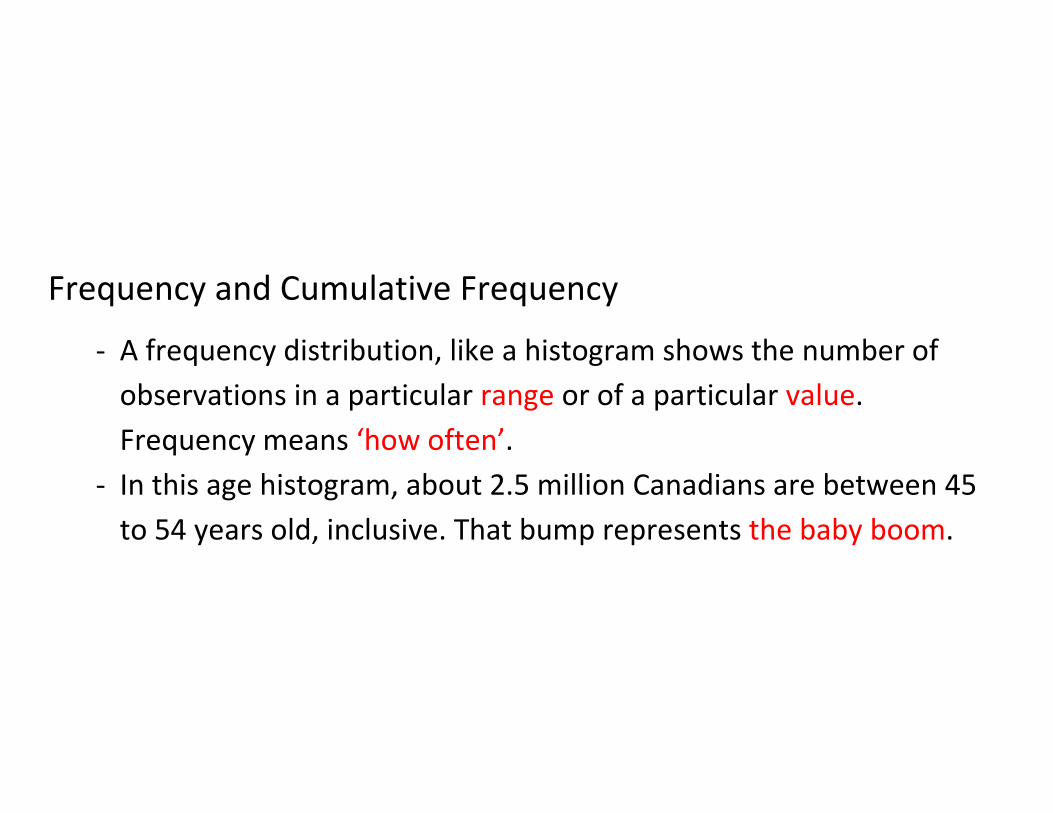
Frequency and Cumulative Frequency
- A frequency distribution, like a histogram shows the number of
observations in a particular range or of a particular value.
Frequency means ‘how often’.
- In this age histogram, about 2.5 million Canadians are between 45
to 54 years old, inclusive. That bump represents the baby boom.

http://www12.statcan.ca/english/census01/products/analytic/companion/age/cda01pymd.cfm


Frequency is expressed as a raw number sometimes. This
would be useful for predicting something like hospital loads.
(Population in thousands)

Relative frequency, or percentage frequency is also used to find
ratios or to compare two sets of different sizes. Possible uses:
International comparison, pension system planning.
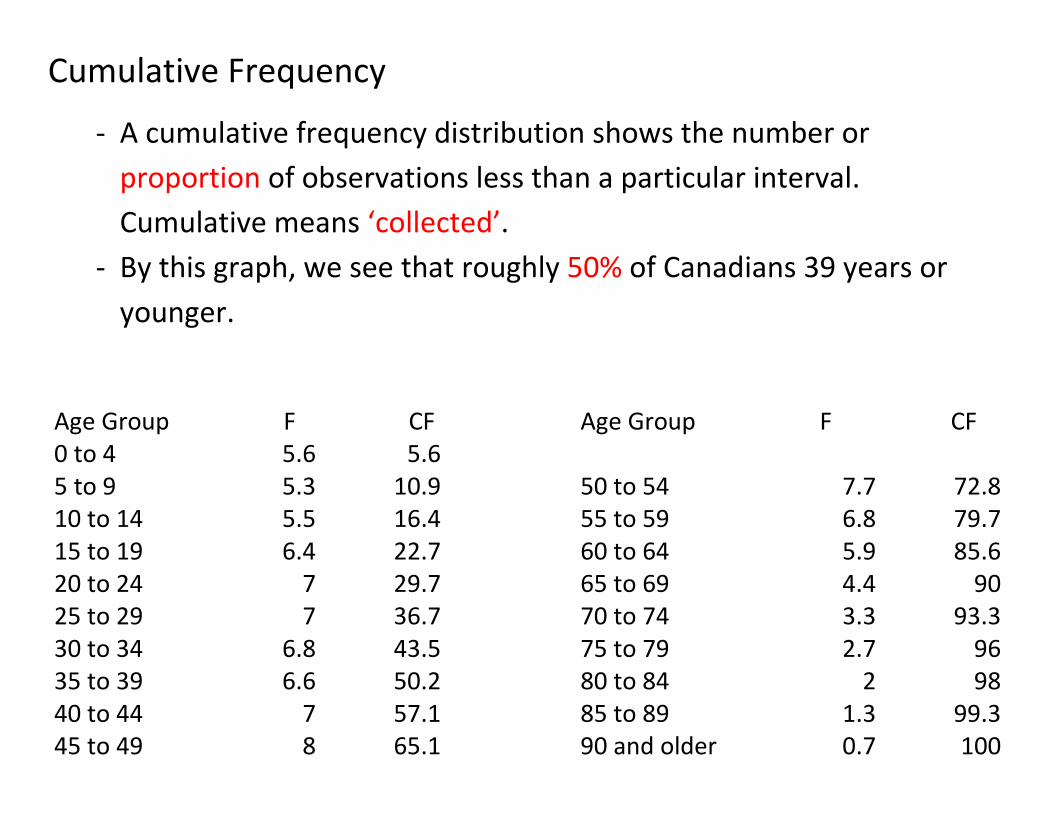
Cumulative Frequency
- A cumulative frequency distribution shows the number or
proportion of observations less than a particular interval.
Cumulative means ‘collected’.
- By this graph, we see that roughly 50% of Canadians 39 years or
younger.
Age Group F CF
Age Group F CF 0 to 4 5.6 5.6
5 to 9 5.3 10.9
50 to 54 7.7 72.8 10 to 14 5.5 16.4
55 to 59 6.8 79.7
15 to 19 6.4 22.7
60 to 64 5.9 85.6 20 to 24 7 29.7
65 to 69 4.4 90
25 to 29 7 36.7
70 to 74 3.3 93.3 30 to 34 6.8 43.5
75 to 79 2.7 96
35 to 39 6.6 50.2
80 to 84 2 98 40 to 44 7 57.1
85 to 89 1.3 99.3
45 to 49 8 65.1
90 and older 0.7 100
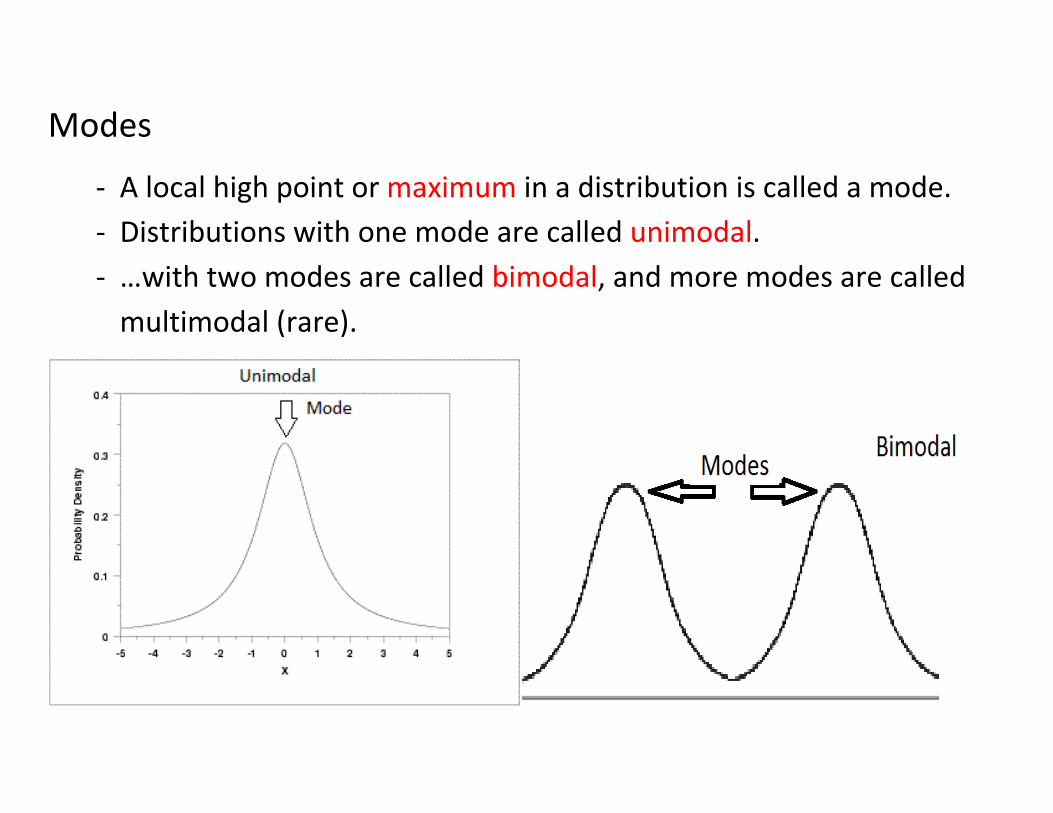
Modes
- A local high point or maximum in a distribution is called a mode.
- Distributions with one mode are called unimodal.
- …with two modes are called bimodal, and more modes are called
multimodal (rare).
Modes
- A lot of distributions are naturally unimodal, so seeing a
bimodal distribution often implies there are two distinct
populations being measured. (Weight of people? Running
speeds of novice and pro joggers?)
- Most (not all) of what we deal with will be unimodal
graphs.
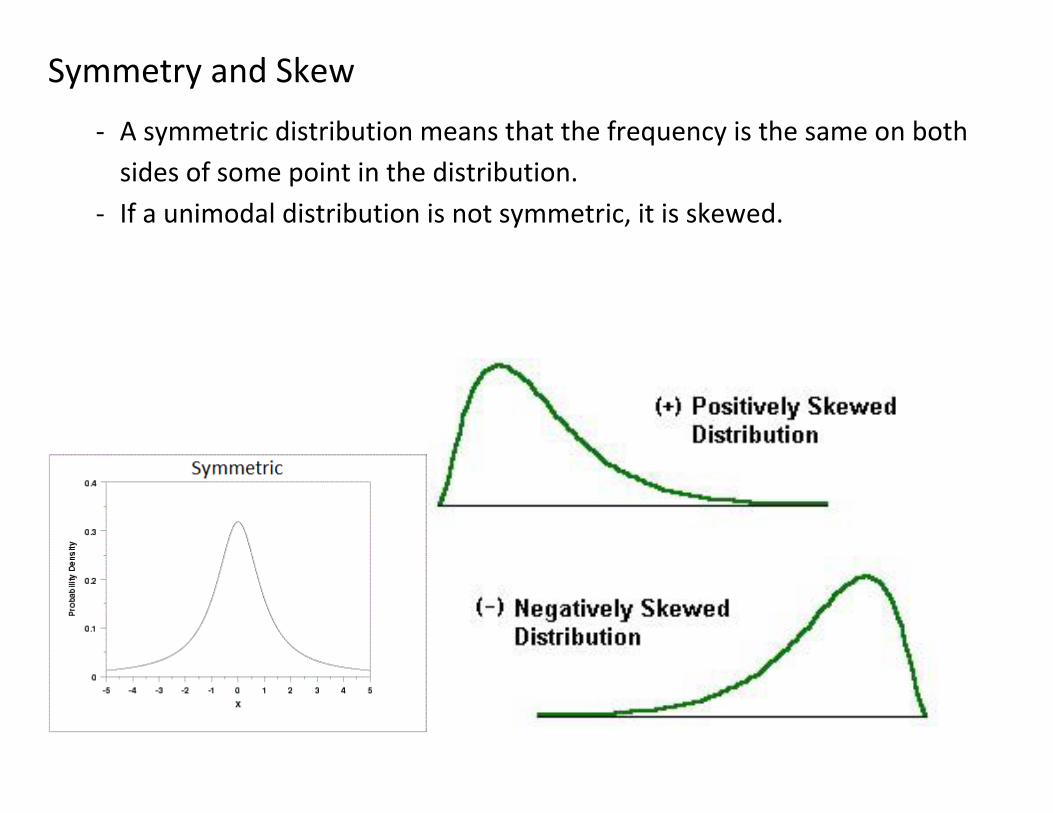
Symmetry and Skew
- A symmetric distribution means that the frequency is the same on both
sides of some point in the distribution.
- If a unimodal distribution is not symmetric, it is skewed.

- A positive skew or right skew means there are more extreme values above
the mode, or to the right of it on a graph.
- A negative skew or left skew implies more extreme values in the lower
values to the left of the mode.

The ‘skew’ is the mass of extreme values.
- A distribution is positively skewed if the mass of observations are at the
low end of the scale. Examples: Income, Drug use, word frequency.
- Most of the observations from a negatively skewed distribution are near
the top of the distribution with a few low exceptions. Examples: Birth
Weight, Olympic Running Speeds.
- When does a bimodal distribution become a skewed one? If there is a
notable upturn in the frequency somewhere away from the mean.

Mean
- The mean is generally referred to as the “average”.
- It is calculated by adding up all the values you observe and dividing by
how many there are
- (Total of all observed values) / (number of values observed)
- (Note: ∑ means ‘add up all the…’, x refers to the observed value, and n is
the number of observations.

Mean
- You can only take the mean of interval data. (There’s no
such thing as the average gender, or the average flavour
of ice cream)
- (for interest) If you could make a sculpture of a
distribution, you could balance the sculpture on your
finger if your finger was at the mean.
- Example: The mean of 4,5,6,7,30 is 69/5 = 13.8.
Median
- The median is the middle value. There are an equal
number of observations that are more than the median as
there are less than it.
- This does NOT mean that the median is in the middle of
the range.
- To find the median, arrange the observations in order and
take the middle. (Or halfway between the middle two if
there’s an even number)

Example – Odd number of values
- Start with 5,30,7,4,6
- Sorted: 4,5,6,7,30
- The median is 6. (The 3rd value)
Example – Even number of values
- Start with -3, -1, 0, 4, 10, 20
- There is no need to sort.
- The median is 2 (The 3.5th value, halfway between the 3rd
and 4th)

Formal rule for Medians
- Take the ½ x (n+1)th value
- For 5 data points, we took the ½ x (5+1)th =
½ * 6 = 3rd value
- For 6 data points, we took the ½ x (6 + 1)th =
½ * 7 = 3.5th value, which is halfway between
the 3rd and 4th values.
- If you have the cumulative frequency, whichever value
includes the halfway point of the data is the median.
- Example: When looking at the cumulative frequency of
Canadian ages, we found 50% of Canadians were 39 or
younger. Therefore 50% are older than 39 as well, so 39 is the
median.
- Note: The range of Canadian ages extends past 80, so we
would NOT say the median is the middle of the range 0 to 80.
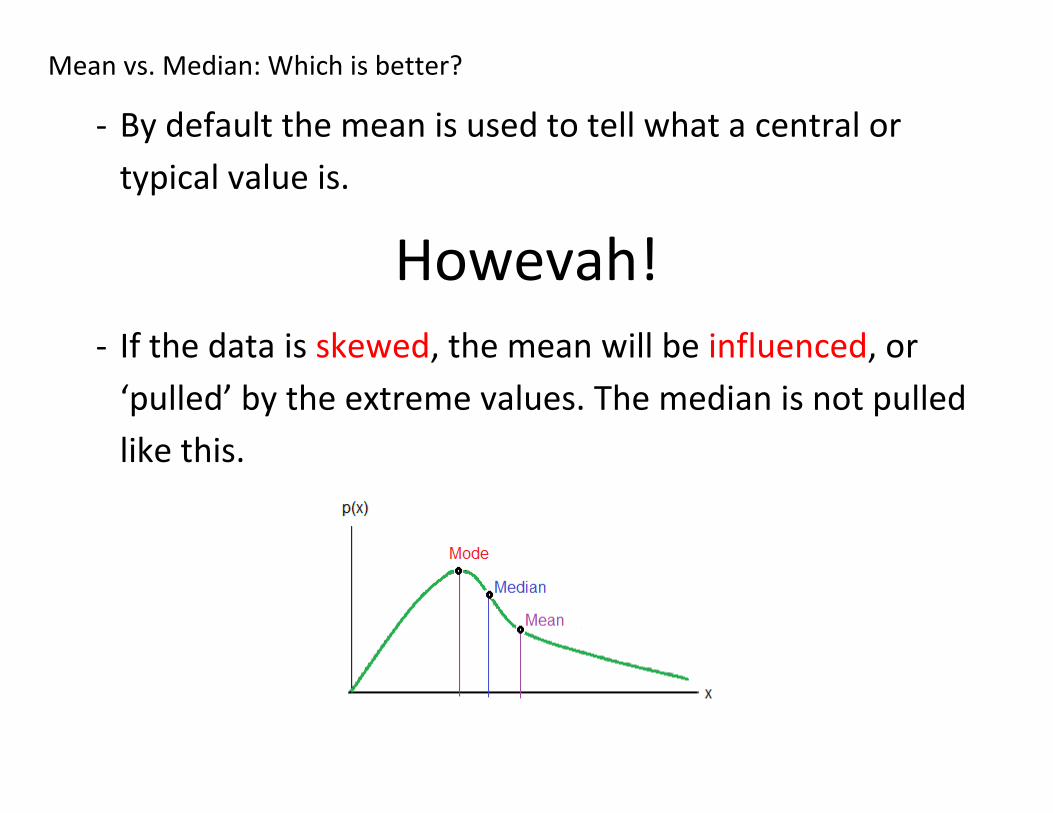
Mean vs. Median: Which is better?
- By default the mean is used to tell what a central or
typical value is.
Howevah! - If the data is skewed, the mean will be influenced, or
‘pulled’ by the extreme values. The median is not pulled
like this.

Mean vs. Median – Which is better?
- Because the median only cares about how many values are above
or below it, a value far above the median affects it just as much as
one slightly above it.
- We say that the median is robust (meaning ‘tough’, or ‘not
sensitive’) to extreme values.
Mean vs. Median – Which is better?
- For positive/right skew, the mean is more than the median.
- For negative/left skew, the mean is less than the median.
- If you’re interested in a ‘typical’ or central value of a skewed
distribution, the median is the most appropriate.
- If you’re interested in the total values, the mean is better,
even in a skewed situation. This is because the formula for the
mean is related to the total.
Mean vs. Median – Which is better?
- Example: The height of women is typically symmetric, so by
default we use the mean.
- Example: You find the amount of cocaine people use has a
strong positive skew. For the typical amount used, the median
is best, which will be at zero (or near zero if only drug users
are considered).
- Example: If you’re the one SELLING the coke, the mean is more
interesting because you’ll want to know the total demand, not
what the casual user is looking for.
Trimmed Mean (for interest)
- One method to sacrifice some but not all of the sensitivity
to extreme values is the trimmed mean, which ‘trims’ or
discards some of the data on either end of a dataset.
- Example: A 10% trimmed mean is the mean of something
that ignores the lowest 10% and the highest 10% of the
values and THEN takes the mean.
- Not very common because it tosses away potentially good
data.
Video - Mean: Joy of Stats 16:45 to 20:15
Next Lecture
- SPSS Demo: Input data, draw a histogram, get the mean and median