frequency meter and discriminator - iet labs freq mtr & discr.pdf · instruction manual type...
TRANSCRIPT

INSTRUCTION MANUAL
TYPE 1142-A
FREQUENCY METER AND
DISCRIMINATOR Form 1142-0100-E
ID B740 July, 1969
GENERAL RADIO COMPANY
WEST CONCORD, MASSACHUSETTS, USA
INTili\I'OLII110N OPPSBT PI\~UE:-lCY
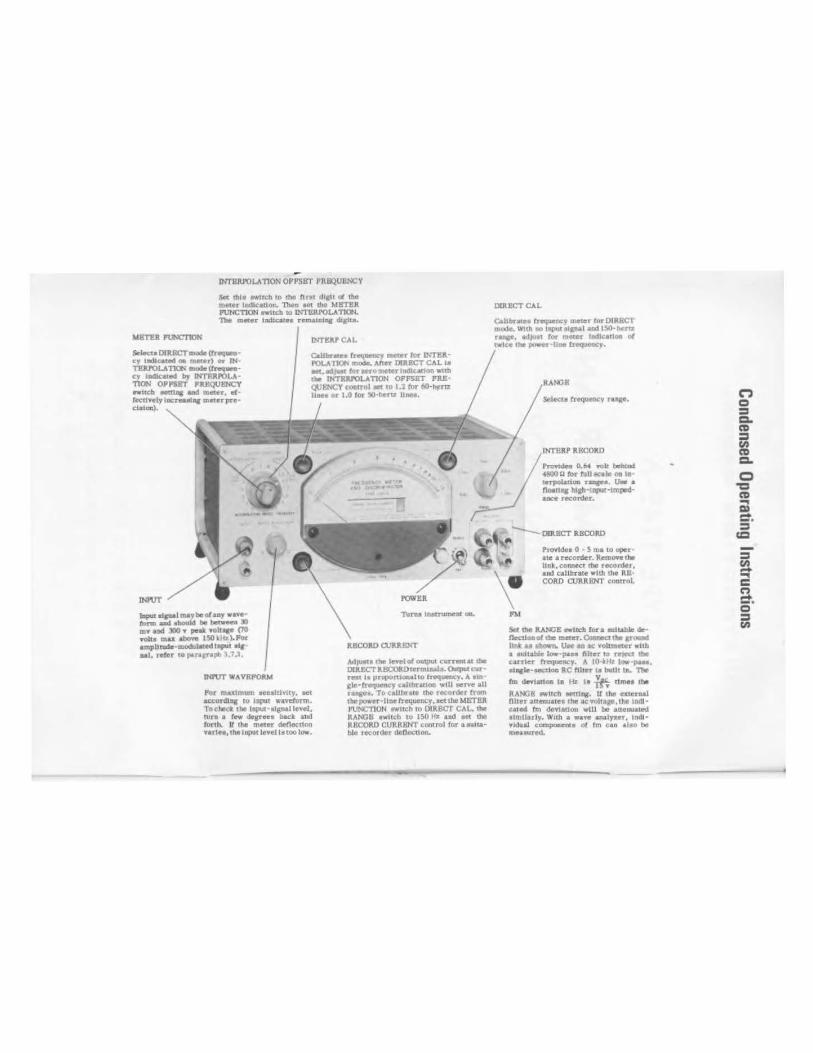
Sec ttu• tJW\cd~ {o cno n ret dtr;tc at tt\e ntter lrtd!l<:atlou.. n-..a »4rt llto MB'TER PVNCTION orwltdt IU INI1li\POLII110N. 1lut mdcr hxhc.ate• rem.tJU• ~J1ta.
WIITI::J. PI.INCT10N
S.I«U DllUICTIIIOIIo (If-· cy Ideated • ...c.•r) or lN • TEUOLA TIOI\ 111Wo (frwq-· ey la6:otocl by INT~POI.A· TION OPPSKT I'JlfQUENCY fWttch eiii"'1.JC ud ftlelCJ', d• !H:d~ely UIICr.-. meter pre· c:Uolm\.
L"ll'I!I\P CAL
C.Ubr&te• fr«;;uncy mer•r ror L'"TU" I'OLIIIIOI' ""ode. ,\!tOT OIIU!CT CAL to -.aii)Uat l~nnomtttr locllc.ot1oo wttll the II>'TBJli'OLATION OPFSBT PllB• Qt.:U.CY coerrol,... to 1.2 fnor 60·hfm: llnf'• or 1.0 fvt '!i,l·hc-ra Un:ea.
011\ECTCAL
C.llloror .. tr_ac, rr.eter lorDIIIBCT ft)tW;kr. \'tith l\t'IIJI(1\Jtatpal•nd t\0-htrO rug•. 6d)ut Cvr ftlfltt todJc.afloe tl( rwlce tbt puwn•llne h*ltl->•
V:::.~~:~o:k bch•"" 4iiOO II lot !UIIocole 00 Ill• ~cT'pol&ttoa. ruce•· u- • ttoon-e hll(ii·IJIJ"•·Imf'Od· ~ rec:onlrtr.
INPUT
loptt•lpo.lmoy bo oi OJI'f wove· to .... -- bohotweealO m• ollll .100 • fl""lt •oltop (lO .-o1u awt ollo'to t50kllz ).Por omplttude·m-ocll.,.. oiJ• Ml, reter to fliiUcnph 3 .7 .. 1.
INPUT WAVRPOI\M
!'or mula.Ult •"••IUvLty, •t •cconltn1 to Jnput: wavctonn. lochoclt tho Lnput• olgaoll~ol, tura a faw dqr~• back abd ,..,.,h, IJ tho m.,er dcnoct1"" var1 ... tM luputleveJ hltOOlow.
1\I!COIW CI:Jll\llNT
NJJU"' rbc: IC"''elol o1.t1put Cllrri!IDt&t cbe 011\I!CT J!.I!COI\IJt<rmlulo. Outpur cur· rene t1 praport1l&<o fTerqu.ftiC'\·. A aiD• ~tr·troqtJC'"nc") c.alt.br.mor. W111 •ne all rang"•· To<&llbrtt• Che r«-OJdtr tram th<-P""..-·liD<fTequerxy.•ettho MBTBI\ I'UI'CnON I'Witch to OIJ.BC I CAl .. me 1\AI'OB owlt<b tu 1~0 Hx I.IUl at< tile RRCOI\0 CURRRNl control lor aoul""· bitt recorder oonoct1o""
--OIIU!CT 1\BCOI\0 411
PrOY'Idel 0 • 5 ttla tu .-r• ate •recorder. 'Rcmuve1he Uak, cnnDtCt N recorder. a.nd c.allbra.te with tJt• RB• COI\0 CUIUU!NI contra!.
soc tile !lANGE owl a r .... o IIIIi tal> Ior dcfl«d""ot tbt m<rer.Coaoeatho p-.1 lmlc •• llbowft. Uee n ac woltmttcr •1lb a IIWla.hh:· low-pa_u f\lter ta reteQ cho coni« fr"''""""f· A IO·UI• IOW"P''", lll•l•·•ccri<ID llC ftlttr Ia bvlll IO, n. fm dmartoe ID t-b: t tt if; 11tnet tbe
RANG!! owtrcb -~~~. It 1bo utnul Olttor .lrtea.J<~.te-lt d ue ac 'lo•t•,_, t.l'tl indl• C.lfod tm doYI•dOD will bo .. tteOJIIlcd llnltl6dy. With a wave 1Jlaty7cr, tnd:ivJcJu..:al componeme of tm can lllf') t'le me;urured.
n Q
= a. CD = (I) CD a. 0 -= CD .... m -s· cc
= (I) -.... = a.. Q = (I)
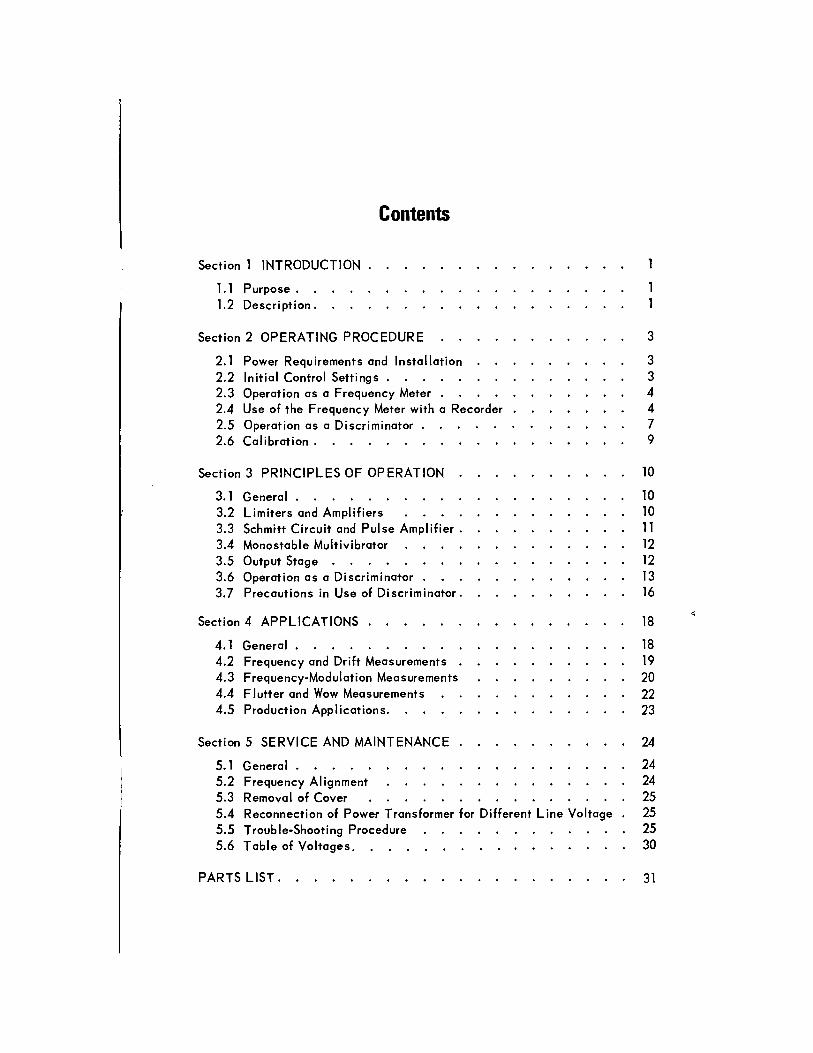
Section 1 INTRODUCTION
1.1 Purpose . 1.2 Description.
Contents
Section 2 OPERATING PROCEDURE
2.1 Power Requirements and Installation 2.2 Initial Control Settings . 2.3 Operation as a Frequency Meter . 2.4 Use of the Frequency Meter with a Recorder 2.5 Operation as a Discriminator 2.6 Calibration .
Section 3 PRINCIPLES OF OPERATION
3.1 General . 3.2 Limiters and Amplifiers 3.3 Schmitt Circuit and Pulse Amplifier. 3.4 Monostable Multivibrator 3.5 Output Stage . 3.6 Operation as a Discriminator 3.7 Precautions in Use of Discriminator.
Section 4 APPLICATIONS . .
4. 1 General . 4.2 Frequency and Drift Measurements 4.3 Frequency-Modulation Measurements 4.4 F Iutter and Wow Measurements 4.5 Production Applications.
Section 5 SERVICE AND MAINTENANCE
3
3 3 4 4 7 9
10
10 10 11 12 12 13 16
18
18 19 20 22 23
24
5.1 General . 24 5.2 Frequency Alignment 24 5.3 Removal of Cover 25 5.4 Reconnection of Power Transformer for Different Line Voltage 25 5.5 Trouble-Shooting Procedure 25 5.6 Table of Voltages. 30
PARTS LIST. 31
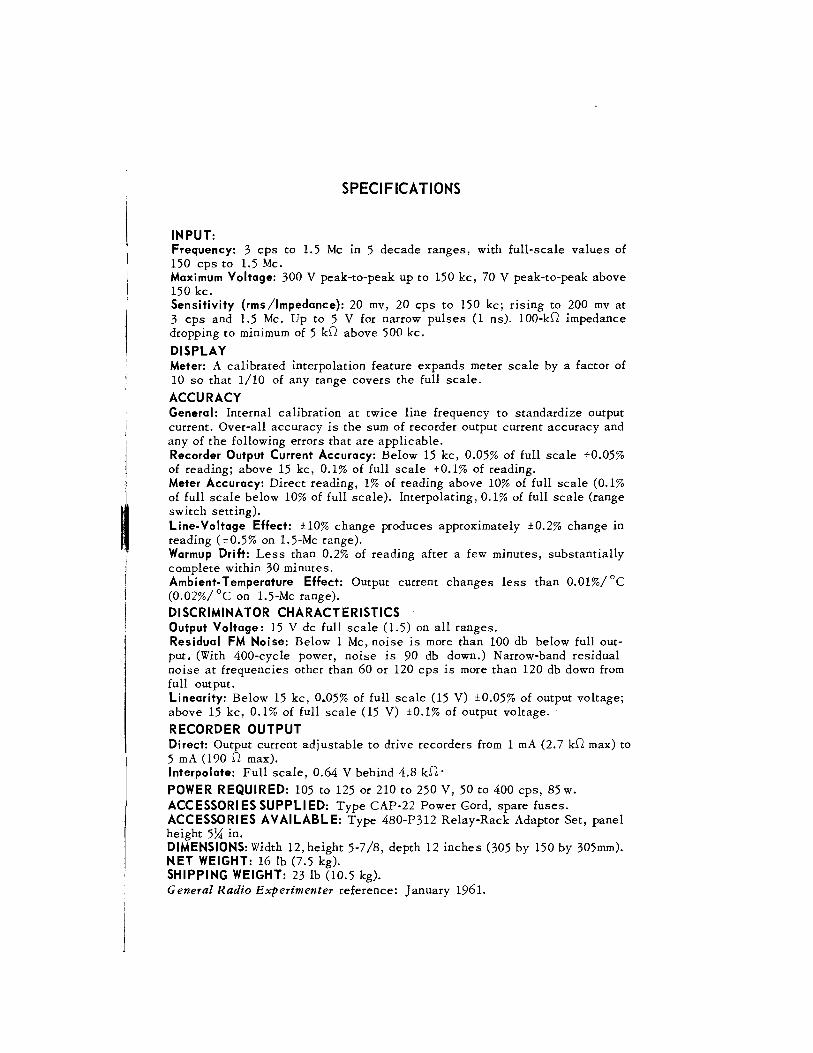
SPECIFICATIONS
INPUT: Frequency: 3 cps to 1.5 Me in 5 decade ranges, with full-scale values of 150 cps to 1.5 Me. Maximum Voltage: 300 V peak-to-peak up to 150 kc, 70 V peak-to-peak above 150 kc. Sensitivity (rms/lmpedance}: 20 mv, 20 cps to 150 kc; rising to 200 mv at 3 cps and 1.5 Me. Up to 5 V for narrow pulses (1 ns). lOO-kf2 impedance dropping to minimum of 5 kf2 above 500 kc.
DISPLAY Meter: A calibrated interpolation feature expands meter scale by a factor of 10 so that 1/10 of any range covers the full scale.
ACCURACY General: Internal calibration at twice line frequency to standardize output current. Over-all accuracy is the sum of recorder output current accuracy and any of the following errors that are applicable. Recorder Output Current Accuracy: Below 15 kc, 0.05% of full scale +0.05% of reading; above 15 kc, 0.1% of full scale +0.1% of reading. Meter Accuracy: Direct reading, 1% of reading above 10% of full scale (0.1% of full scale below 10% of full scale). Interpolating, 0.1% of full scale (range switch setting). Line-Voltage Effect: ±10% change produces approximately ±0.2% change in reading ( ±0.5% on 1.5-Mc range). Warmup Drift: Less than 0.2% of reading after a few minutes, substantially complete within 30 minutes. Ambient-Temperature Effect: Output current changes less than 0.01%/°C (0.02%/ °C on 1.5-Mc range).
DISCRIMINATOR CHARACTERISTICS Output Voltage: 15 V de full scale (1.5) on all ranges. Residual FM Noise: Below 1 Me, noise is more than 100 db below full output, (With 400-cycle power, noise is 90 db down.) Narrow-band residual noise at frequencies other than 60 or 120 cps is more than 120 db down from full output. Linearity: Below 15 kc, 0.05% of full scale (15 V) ±0.05% of output voltage; above 15 kc, 0.1% of full scale (15 V) ±0.1% of output voltage. ·
RECORDER OUTPUT Direct: Output current adjustable to drive recorders from 1 rnA (2.7 kD. max) to 5 rnA (190 D. max). Interpolate: Full scale, 0.64 V behind 4.8 kD. ·
POWER REQUIRED: 105 to 125 or 210 to 250 V, 50 to 400 cps, 85 w. ACCESSORIES SUPPLIED: Type CAP-22 Power Gord, spare fuses. ACCESSORIES AVAILABLE: Type 480-P312 Relay-Rack Adaptor Set, panel height 5~ in. DIMENSIONS: Width 12, height 5-7/8, depth 12 inches (305 by 150 by 305mm). NET WEIGHT: 16 lb (7.5 kg). SHIPPING WEIGHT: 23 lb (10.5 kg). General Radio Experimenter reference: January 1961.

7
Figure 1. Type 1142-A Frequency Meter and Discriminator. (For legend, see page 2.)

TYPE 1142-A
FREQUENCY METER AND
DISCRIMINATOR
Section 1
INTRODUCTION
1.1 PURPOSE. The Type 1142-A Frequency Meter and Discriminator directly measures
the frequency of any signal (sine wave, square wave, or pulse) from 3 cps to 1.5 Me. As a discriminator, the Type 1142-A can be used in combination with an ac voltmeter to measure fm deviation. With a wave analyzer, individual components of incidental fm in oscillators and multipliers can be measured. The usable frequency range, particularly for frequency-drift and incidental fm measurements, can be extended upward to thousands of megacycles if the frequency to be measured is heterodyned with a frequency standard. This gives a proportionate increase in resolution. With the addition of a recorder, such as the Type 1521-B Graphic Level Recorder, a recording of the measured frequency or of drift can be made.
1.2 DESCRIPTION. 1.2. 1 GENERAL. The Type 1142-A Frequency Meter and Discriminator is basically a frequency-to-de converter operating on the principles of a pulsecount discriminator. The input signal is fed to two stages of limiters and amplifiers and then to a Schmitt circuit, which generates a 0.1-J.Lsec pulse for each input cycle. This pulse is amplified and used to trigger a monostable
1

GENERAL RADIO COMPANY
multivibrator, which generates a constant-duration pulse. The output of the monostable multivibrator is fed to an output stage, which supplies a constantduration, constant-amplitude pulse to the meter circuit. The meter indicates the average current of the output stage, and thus the input frequency.
To ensure low-noise operation of the discriminator, each output pulse is generated at the positive-going zero crossings of the input signal. The pulse train is pulse-frequency-modulated (pfm) by an fm input signal. If the carrier frequency is filtered, the modulating signal can be recovered and measured by an ac voltmeter.
The residual noise level of the discriminator is 100 db below full scale for carrier frequencies below 1 Me, consisting mainly of the fundamental
and second harmonic of the power-line frequency. All other frequencies are down 120 db or more, permitting a resolution of one part per million of full scale (of the range in use).
Because the meter indicates the average current in the output stage, the Type 1142-A Frequency Meter and Discriminator measures the average frequency of an aperiodic or random input signal. Signals may be derived from photocell devices, tachometers, geiger tubes, magnetic pickups, or any other transducer that can supply a 30-mv-peak signal. While the maximum full-scale range is 1.5Mc, the Type 1142-A responds to extremely short-duration pulses, e.g., 1 nsec or less, but requires an increase in input signal.
1.2.2 CONTROLS AND CONNECTORS. All controls and connectors except the power-cord receptacle are on the front panel of the Type 1142-A (see Figure 1). The functions of these controls and connectors are as follows (index numbers refer to Figure 1):
Fig. 1 Ref Name Type Function (Paragraph Reference)
1 POWER 2-pos toggle switch Turns instrument on (2.2).
2 RANGE 5-pos rotary selector Selects frequency range (2.3b). switch
3 INTERPOLATION OFFSET 16-pos rotary selector With METER FUNCTION at
FREQUENCY switch DIRECT, frequency is indi-cated on meter scale. At IN-TERPOLATION, frequency is indicated by OFFSET FRE-
4 METER FUNCTION 4-pos rotary selector QUENCY control setting and switch (coaxial with meter scale, effectively in· INTERPOLATION creasing meter precision [2.3c OFFSET FREQUENCY) (1) and (2)].
5 INPUT WAVEFORM Continuous rotary Adjusts sensitivity as a func· control tion of input waveform (3.3).
6 DIRECT CAL Thumbset adjustment Calibrates frequency meter for DIRECT mode (2.6).
(Continued)
2
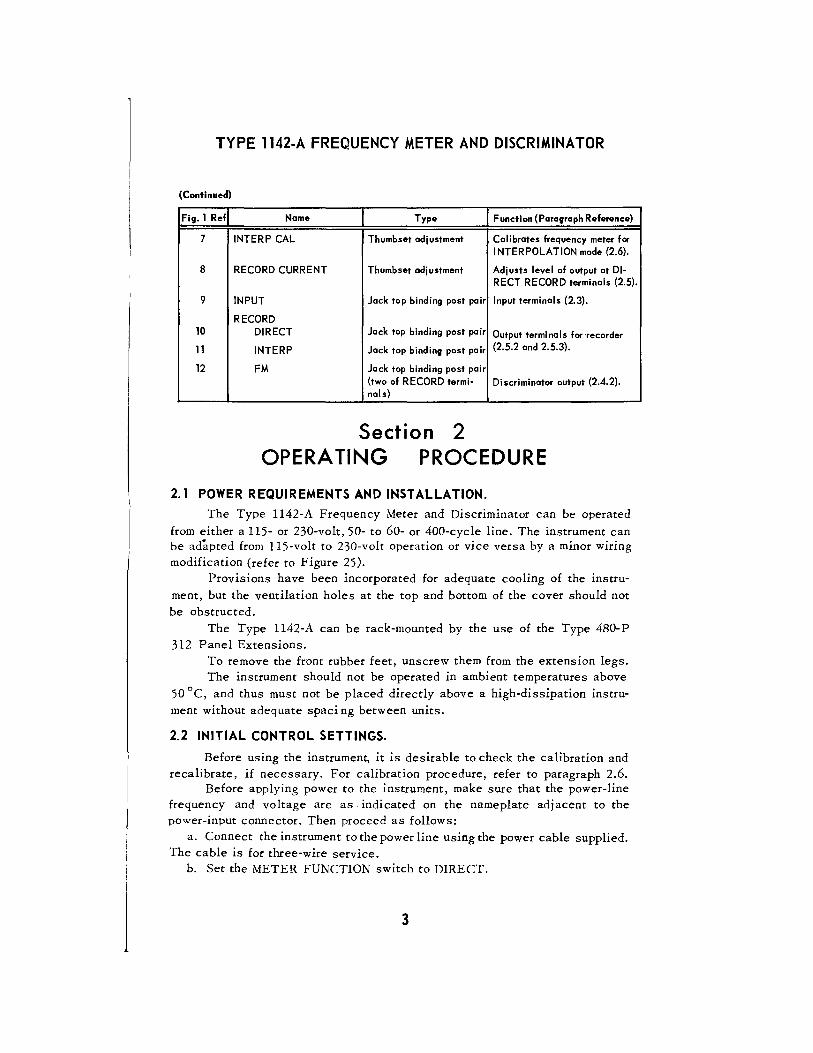
TYPE 1142-A FREQUENCY METER AND DISCRIMINATOR
(Continued)
Fig. 1 Ref Name Type Function (Paragraph Reference)
7 INTERP CAL Thumbset adjustment Calibrates frequency meter for INTERPOLATION mode (2.6).
8 RECORD CURRENT Thumbset adjustment Adjusts level of output at Dl-RECT RECORD terminals (2.5).
9 INPUT Jack top binding post pair Input terminals (2.3).
RECORD 10 DIRECT Jack top binding post pair Output termi na Is for ·recorder
11 INTERP Jack top binding post pair (2.5.2 and 2.5.3).
12 FM Jack top binding post pair (two of RECORD termi- Discriminator output (2.4.2). nals)
Section 2 OPERATING PROCEDURE
2.1 POWER REQUIREMENTS AND INSTALLATION.
The Type 1142-A Frequency Meter and Discriminator can be operated
from either a 115- or 230-volt, 50- to 60- or 400-cycle line. The instrument can be adapted from 115-volt to 230-volt operation or vice versa by a minor wiring modification (refer to Figure 25).
Provisions have been incorporated for adequate cooling of the instru
ment, but the ventilation holes at the top and bottom of the cover should not be obstructed.
The Type 1142-A can be rack-mounted by the use of the Type 480-P 312 Panel Extensions.
To remove the front rubber feet, unscrew them from the extension legs. The instrument should not be operated in ambient temperatures above
50 °C, and thus must not be placed directly above a high-dissipation instrument without adequate spacing between units.
2.2 INITIAL CONTROL SETTINGS.
Before using the instrument, it is desirable to check the calibration and recalibrate, if necessary. For calibration procedure, refer to paragraph 2.6.
Before applying power to the instrument, make sure that the power-line frequency and voltage are as indicated on the nameplate adjacent to the power-input connector. Then proceed as follows:
a. Connect the instrument to the power line using the power cable supplied. The cable is for three-wire service.
b. Set the METER FUNCTION switch to DIRECT.
3

"' I
GENERAL RADIO COMPANY
c. Set the RANGE switch to 1.5 Me. d. Snap the POWER switch on. The pilot lamp should light.
It is best to allow the instrument to warm up for about 30 minutes before checking or setting calibration
2.3 OPERATION AS A FREQUENCY METER. a. With controls set as described in paragraph 2.2, connect the signal
whose frequency is to be measured to the INPUT terminals. Note that the lower INPUT terminal is grounded. The input signal may be of any waveform and should be between 30 mv and 300 v peak voltage.
b. Set the RANGE switch for the highest on-scale deflection of the meter. To check that the input-signal level is adequate, turn the INPUT WAVEFORM control a few degrees back and forth. If the meter deflection varies, the input leve 1 is too low.
c. Read the frequency on the meter scale, taking into account the position of the RANGE switch. The accuracy of this reading is ±1% of reading. If greater precision is desired, use the following INTER PO LA TION procedure.
(1) Set the INTERPOLATION OFFSET FREQUENCY switch (the outer of the two coaxial switches) to the digit corresponding to the first digit (or first two digits of numbers between 1.0 and 1.5) of the meter indication. (For example, if the meter indication is 0.38, the switch should be set to 0.3. If the indication is 1. 26, the switch should be set to 1. 2.)
(2) Set the METER FUNCTION switch to INTERPOLATION. The position of the INTERPOLATION OFFSET FREQUENCY switch now indicates the first digit (or digits) of the frequency, and the meter indicates the following digits. For instance, if the INTERPOLATION OFFSET FREQUENCY switch is at 0.3 and the meter indication is 0. 79, the significant figures of the frequency are 379. If the switch is at 1.2 and the meter indication is 0.61, the significant figures are 1261. (The actual frequency in each case depends, of course, on the position of the RANGE switch. With the RANGE switch at 1.5 kc, the frequencies in the above examples would be 379 cps and 1.261 kc, respectively.)
d. For use with a recorder, refer to paragraph 2.4.
2.4 USE OF THE FREQUENCY METER WITH A RECORDER. 2.4.1 GENERAL. Frequency measurements made with the Type 1142-A can be displayed on most standard 1- and 5-ma recorders, such as the General Radio Type 1521-B Graphic Level Recorder. The meter on the Type 1142-A will continue to indicate the frequency being measured during recording, and can thus be used in the calibration of the recorder. In addition to conventional DIRECT recorder output terminals, the Type 1142-A includes separate output connections for recording in the interpolation mode of operation. Refer to paragraph 2.4.3.
4
TYPE 1142-A FREQUENCY METER AND DISCRIMINATOR
2.4.2 DIRECT RECORD OPERATION. Before making recordings, it will be
necessary to calibrate the recorder. A simple method of calibrating is as follows:
a. Set controls for normal frequency-meter operation, as described in paragraph 2.2.
b. Set the METER FUNCTION switch to DIRECT CAL and the RANGE switch to 150 C.
c. Disconnect the ground link from the DIRECT RECORD terminals and coanect the recorder to these binding posts.
d. Adjust the RECORD CURRENT. control to place the calibrating frequency (120 cps) as desired on the recorder paper. If the 120-cycle point is set at 4/5 of full scale, full scale on the recorder will thereafter correspond to full scale on the meter. This calibration will hold for all positions of the
RANGE switch. If the recorder pen vibrates excessively, because of its
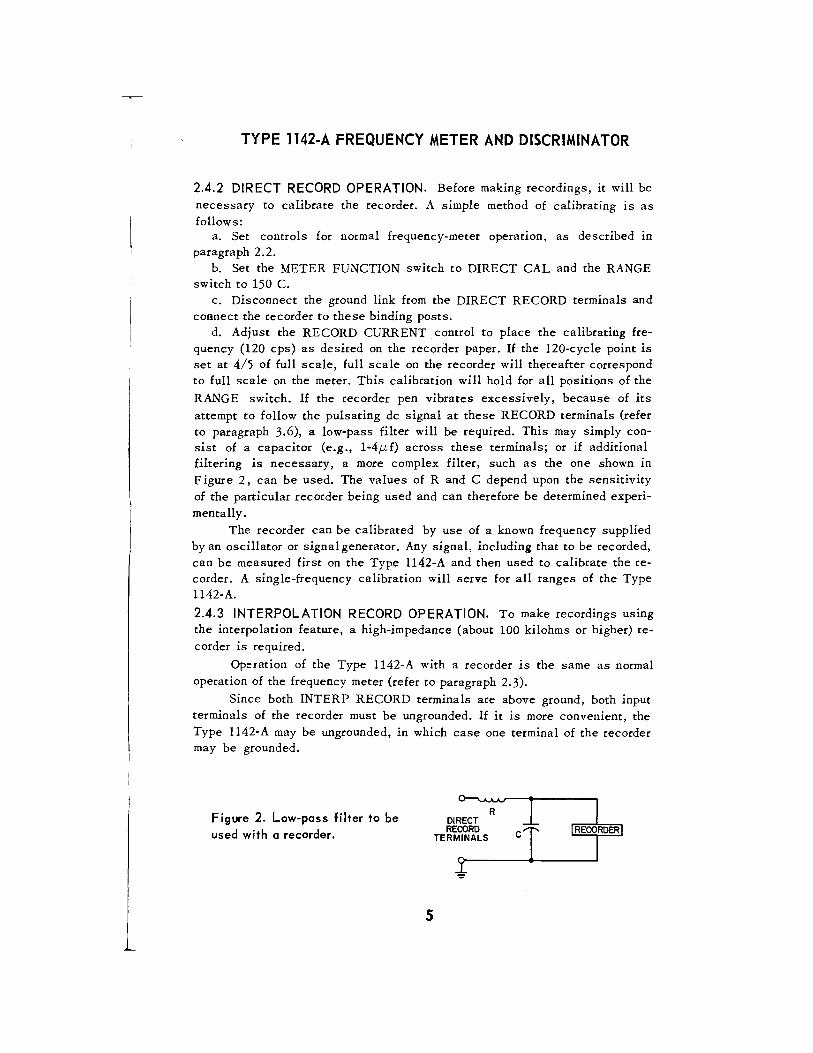
attempt to follow the pulsating de signal at these RECORD terminals (refer to paragraph 3.6), a low-pass filter will be required. This may simply consist of a capacitor (e.g., 1-4J.Lf) across these terminals; or if additional filtering is necessary, a more complex filter, such as the one shown in Figure 2, can be used. The values of R and C depend upon the sensitivity of the particular recorder being used and can therefore be determined experimentally.
The recorder can be calibrated by use of a known frequency supplied by an oscillator or signal generator. Any signal, including that to be recorded, can be measured first on the Type 1142-A and then used to calibrate the recorder. A single-frequency calibration will serve for all ranges of the Type 1142-A.
2.4.3 INTERPOLATION RECORD OPERATION. To make recordings using the interpolation feature, a high-impedance (about 100 kilohms or higher) re
corder is required.
Operation of the Type 1142-A with a recorder is the same as normal
operation of the frequency meter (refer to paragraph 2.3).
Since both INTERP RECORD terminals are above ground, both input terminals of the recorder must be ungrounded. If it is more convenient, the Type 1142-A may be ungrounded, in which case one terminal of the recorder may be grounded.
Figure 2. Low-pass filter to be used with a recorder.
5

GENERAL RADIO COMPANY
The recorder must be calibrated before use with the frequency meter. The calibration procedure is as follows:
a. Set the controls for normal frequency-meter operation, as described in paragraph 2.2.
b. Connect a variable-frequency oscillator, with the same' frequency range as the Type 1142-A, to the INPUT terminals.
c. Measure this frequency as described in paragraph 2.3, using the interpolation feature.
d. At the conclusion of the interpolation measurement (step c (2) of paragraph 2.3), adjust the frequency of the variable-frequency oscillator so that the meter of the Type 1142-A indicates 0.
e. Connect the recorder to the INTERP RECORD terminals and set the recorder pen to the desired zero position on paper. If the recorder pen vibrates excessively, because of its attempt to follow the pulsating de signal at these INTERP RECORD terminals (refer to paragraph 3.6) a low-pass filter will be required. This may simply consist of a capacitor ( 1-4 J.L f) across these terminals; or, if additional filtering is necessary, a more complex filter, such as the one shown in Figure 2, may be used, except that the DIRECT RECORD terminals are replaced by the INTERP RECORD terminals.
Disconnect the recorder from the Type 1142-A.
f. Increase the frequency of the variable-frequency oscillator by an amount equal to the desired full-scale indication on the recorder. If the oscillator does not cover the frequencies to be recorded, increase the frequency by an amount equal to
Rc f
r R r
I where fr = frequency spread to be recorded
Rc RANGE setting for calibration
Rr RANGE setting for recording.
This amount can be read directly from the meter of the Type 1142-A. Reconnect the recorder to the frequency meter.
g. Adjust the sensitivity control on the recorder so that the pen is at full scale.
The recorder calibration is now constant in percentage of RANGE switch setting for any position of the RANGE switch. For any one position of the switch, therefore, the frequency coverage of the recorder is constant for any position of the INTERPOLATION OFFSET FREQUENCY switch.
Suppose we wish to record the drift of an oscillator whose frequency varies between 1.000 and 1.007 Me. Choose a frequency scale of 1.00 to 1.01 Me on the recorder, to allow for some overlap. Note that the frequencies will be recorded on the 1.5 MC RANGE setting and the desired frequency spread (1.00 to 1.01 Me) is 10 kc.
6

TYPE 1142-A FREQUENCY METER AND DISCRIMINATOR
Use a variable-frequency oscillator to supply a signal of unknown frequency to the INPUT t~rminals of the Type 1142-A. Measure this frequency in the direct mode; suppose the meter indicates that it is 5.1 kc on the 15 KC range. Therefore, set the INTERPOLATION OFFSET FREQUENCY switch to 0.5 (the first digit) and the METER FUNCTION switch to INTERPOLATION. The meter will now indicate on scale, say at 0.12. Decrease the frequency of the oscillator until the meter on the Type 1142-A indicates 0. The output voltage at the INTERP RECORD terminals is now 0. Attach the recorder to these terminals and set the pen at zero by means of the recorder zero-set control. Then disconnect the recorder from the INTERP RECORD terminals.
Increase the oscillator frequency by an amount given by the formula in
paragraph 2.4.3,f. In this case it is 10 kc x i~5 ~~ or 100 cps. This 100 cps
is indicated by a meter reading of 0.10 on the Type 1142-A. Then reconnect the recorder and adjust its sensitivity for full-scale indication. The recorder coverage is now 100 cps with the Type 1142-A RANGE switch at 15 KC. If the RANGE switch setting is changed to 150 C, 1.5 KC, 150 KC, or 1.5 MC, the recorder coverage becomes 1 cps, 10 cps, 1 kc, or 10 kc, respectively.
Returning to the example, set the RANGE switch to 1.5 MC and the INTERPOLATION OFFSET FREQUENCY switch to 1.0. The recorder now has a frequency coverage of 1.00 to 1.01 Me.
2.5 OPERATION AS A DISCRIMINATOR.
2.5.1 GENERAL. The Type 1142-A always operates as both frequency meter and discriminator, and during measurement of fm deviation will continue to indicate the carrier frequency on its meter. The operation of the controls is as described in paragraph 2.3, except that the INTERPOLATION mode of operation is not used in fm deviation measurements. Therefore, the METER FUNCTION switch is left at DIRECT.
2.5.2 MEASUREMENT OF FM DEVIATION. a. With the controls set as described in paragraph 2.2, connect the signal
whose fm deviation is to be measured to the INPUT terminals. Note that the lower INPUT terminal is grounded. The input signal may be of any waveform and should be between 30 mv and 300 v peak voltage.
b. Set the RANGE switch for the highest on-scale deflection of the meter. If the meter does not indicate at any position of the RANGE switch, adjust the INPUT WAVEFORM control as necessary, to obtain a deflection.
c. To check that the input, signal level is adequate, turn the INPUT WAVEFORM control a few degrees back and forth. If the meter deflection varies, the input level is too low.
7
GENERAL RADIO COMPANY
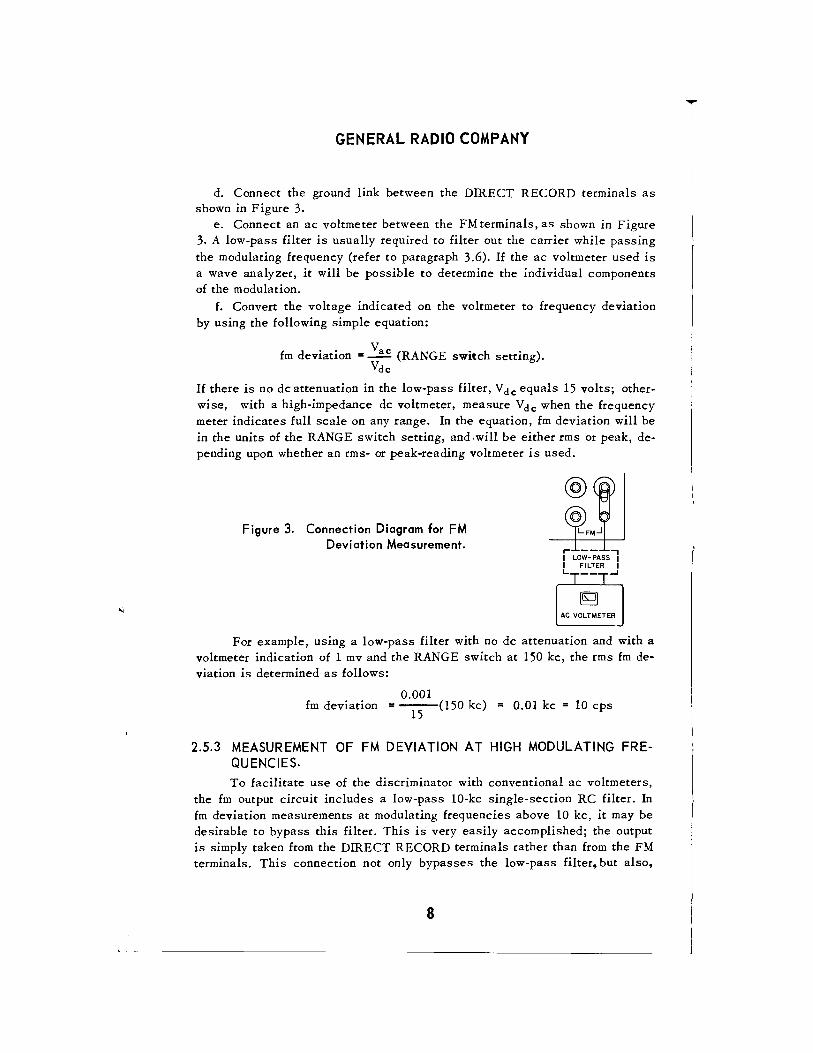
d. Connect the ground link between the DIRECT RECORD terminals as shown in Figure 3.
e. Connect an ac voltmeter between the FM terminals, as shown in Figure 3. A low-pass filter is usually required to filter out the carrier while passing the modulating frequency (refer to paragraph 3.6). If the ac voltmeter used is a wave analyzer, it will be possible to determine the individual components of the modulation.
f. Convert the voltage indicated on the voltmeter to frequency deviation by using the following simple equation:
fm deviation = Vac (RANGE switch setting). Vdc
If there is no de attenuation in the low-pass filter, V de equals 15 volts; otherwise, with a high-impedance de voltmeter, measure Vdc when the frequency meter indicates full scale on any range. In the equation, fm deviation will be in the units of the RANGE switch setting, and rwill be either rms or peak, depending upon whether an rms- or peak-reading voltmeter is used.
Figure 3. Connection Diagram for FM Deviation Measurement.
AC VOLTMETER
For example, using a low-pass filter with no de attenuation and with a voltmeter indication of 1 mv and the RANGE switch at 150 kc, the rms fm deviation is determined as follows:
0.001 fm deviation = ---(150 kc) = 0.01 kc
15 10 cps
2.5.3 MEASUREMENT OF FM DEVIATION AT HIGH MODULATING FREQUENCIES.
To facilitate use of the discriminator with conventional ac voltmeters, the fm output circuit includes a low-pass 10-kc single-section RC filter. In fm deviation measurements at modulating frequencies above 10 kc, it may be desirable to bypass this filter. This is very easily accomplished; the output is simply taken from the DIRECT RECORD terminals rather than from the FM terminals. This connection not only bypasses the low-pass filter, but also,
8
T

TYPE 1142-A FREQUENCY METER AND DISCRIMINATOR
since it is a lower impedance, effectively raises the maximum modulating frequency that can be measured. With this connection, however, the output voltage is reduced and is uncalibrated. t
The procedure for measuring fm deviation using the output at the DIRECT RECORD terminals is as follows:
a. Move the ground link from the DIRECT RECORD to the FM terminals. If a wide-band ac voltmeter is to be used, a low-pass filter should be connected between the DIRECT RECORD terminals and the voltmeter, to filter out the carrier while passing the modulating frequency (refer to paragraph 3.6).
b. Connect a 3- or 5-volt de voltmeter, whose input impedance is high compared with the filter resistance, across the filter output, or across the DIRECT RECORD terminals if no filter is used.
c. It will now be necessary to calibrate the de output voltage against a known frequency. The known frequency may be the 120 -cycle internal calibrating signai or an external signal applied at the INPUT terminals. (The frequency of the external signal may have been measured as described in paragraph 2. 3.) If the internal 120-cycle calibrating signal is to be used, set the METER FUNCTION switch to DIRECT CAL and the RANGE switch to 150 C. If an external calibrating signal is to be used, set the METER FUNCTION switch to DIRECT and the RANGE switch to produce an on-scale meter deflection.
d. Adjust the RECORD CURRENT control for any convenient de output
voltage. (The maximum available de output is about 3 volts.) Note the de
voltage, calibrating frequency, and RANGE switch setting for later use in fm deviation calculation.
e. Disconnect the de voltmeter.
f. Follow the procedure outlined in steps a through c of paragraph 2.5.2. g. Connect an ac voltmeter to the DIRECT RECORD terminals. Note the
ac voltmeter reading. h. Convert the voltage indicated on the voltmeter to frequency deviation
by means of the following equation:
fcal V acRm fm deviation = ----:R---
Vdc cal
where f c a! = calibrating frequency noted in step d V ac = ac voltage measured in step g Rm =position of RANGE switch during fm deviation measurement
V d c = de voltage noted in step d Real= position of RANGE switch noted in step d.
2.6 CALIBRATION.
At periodic intervals, the frequency calibration of the Type 1142-A should be checked and reset if necessary. The procedure is as follows:
9
GENERAL RADIO COMPANY
a. Turn the instrument on and let it warm up for at least 30 minutes. Make sure no signal is connected to the INPUT terminals.
b. Connect the ground link between the DIRECT RECORD terminals. c. Set the RANGE switch to 150 C and the METER FUNCTION switch to
DIRECT CAL. d. The meter should now indicate exactly twice the power- line frequency
(i.e., 120 cps with a 60-cycle line). If it does not, adjust the DIRECT CAL
thumbset, a dual potentiometer with a single panel control. This arrangement makes possible a more precise setting of the meter. To adjust it, turn the thumbset until the meter indicates beyond the desired reading; then reverse the direction of adjustment, to set the meter precisely.
e. Set the INTERPOLATION OFFSET FREQUENCY to 1.2 for 60-cycle lines, 1.0 for 50-cycle lines.
f. Set the METER FUNCTION switch to INTERPOLATION CAL. g. The meter should now indicate 0. If it does not, adjust the INTERP
CAL control as necessary. This controlfunctions in the same manner as the DIRECT CAL control (refer to step d, above).
If a source of standard frequency, such as 100 cps, is available, it may be connected to the INPUT terminals and used to calibrate the Type 1142-A. The procedure is as described above, except that the meter should indicate the standard frequency in step d, and the INTERPOLATION OFFSET FREQUENCY switch should be set at 1.0 (for 100 cps) in step e.
After tube replacement or in abnormal ambient temperatures, ranges may have to be calibrated individually (refer to paragraph 5. 2).
Section 3
PRINCIPLES OF OPERATION
3.1 GENERAL.
General principles of operation are described in paragraph 1. 2.1. This section will-describe operation in greater detail and will discuss sources of
error in fm deviation measurements. (Refer to the block diagram, Figure 4, as
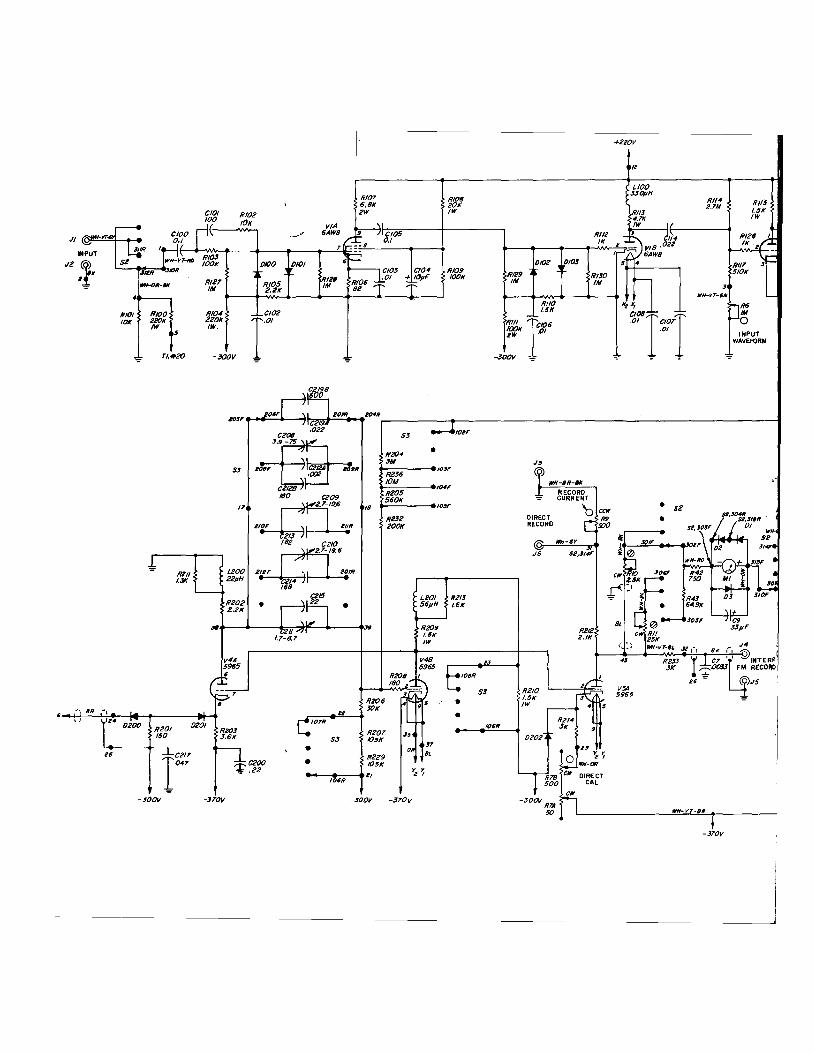
well as the complete circuit diagram, Figure 25).
3.2 LIMITERS AND AMPLIFIERS.
The input circuit is a shunt diode limiter. Its input impedance, and hence that of the Type 1142-A, varies from 100 kilohms at low frequencies to a minimum of 5 kilohms at frequencies above 500 kc. The diodes are biased to limit signals to approximately a 2-v peak-to-peak amplitude, a level
10
1 I

l I
TYPE 1142-A FREQUENCY METER AND DISCRIMINATOR
~Q.----1-~~~~~~--,
I ~~~~~1 Figure 4. Block diagram ofT ype 1142~!'-·
INPUT
l
STANDARDIZED PULSE (CONS~ ANT AREAl TO METER FLM CIRCUIT. PULSE DURATION CHANGES IN DECADE Q-1"""-"Wv--+--{ STEPS WITH RANGE SWITCH~NTERP
RECORD
+E, 6-----~~~~~-
.A_ Jl
- E4 (REG)
sufficient to drive the first amplifiedrom saturation to cutoff. A low-impedance
biasing circuit is used, so that the limiter is symmetrical even under conditions of very large input of amplitude-modulated signals. Thus, the limiter ensures
that the output of the first amplifier is an amplified replica of the input signal near its zero crossings. This would not be true if the input signal were directly applied to the first amplifier, because of grid current flow and the attendant grid bias change at high input levels.
Amplifier No. 1 is a conventional pentode amplifier (the pentode section of a Type 6AW8 tube), whose bias signal is derived from a combination of fixed grid bias and cathode bias. The output of this amplifier feeds a second limiter, which clips excessive drive signals at the second amplifier and thereby minimizes zero-crossing shifts. Amplifier No. 2 is a conventional triode
amplifier (the triode section of the Type 6A WB tube), whose output, because
of the high gain (approximately 60 db) and limiting of the two amplifiers and limiters, is a square wave for sine-wave inputs, with zero crossings coinciding in time with the zero crossing of the input signal.
3.3 SCHMITT CIRCUIT AND PULSE AMPLIFIER.
The output of Amplifier No. 2 is fed to a Schmitt circuit or cathodecoupled binary. An inductive load on one plate differentiates the signal. The inclusion of a diode across this inductor clips the negative-going pulse, leaving a 0.1-,J.Lsec positive pulse for each positive-going zero crossing of the input signal. This positive pulse is amplified and inverted by the pulse amplifier, a Type 6AN5 tube.
The INPUT WAVEFORM control positions the input signal with reference to the Schmitt circuit hysteresis loop so that the circuit operates at a given peak-to-peak amplitude of the input signal regardless of waveform. To understand the function of the INPUT WAVEFORM control, consider the drawings of Figure 5 .. In Figure 5a, with the grid-bias level set midway between the Schmitt triggering levels by the INPUT WAVEFORM control, the
11

r
GENERAL RADIO COMPANY
(b)
, II II II I
n II II II UPPER TRIGGER LEVEL----.
II I II HYSTERESIS OF SCHMITT
II I I CIRCUIT
-'(;;!_~~~TAGE SETTING FOR J SINE-OR SQUARE-WAVE INPUT
LOWER TRIGGER LEVEL
i_BIA5-VOLTAGE SETTING FOR LOW DUTY-RATIO POSITIVE PULSE
Figure 5. Diagram Showing Function of INPUT WAVE
FORM Control.
sine wave shown triggers the Schmitt circuit, while the positive pulse, though of equal peak-to-peak amplitude, does not reach both triggering levels. In Figure 5b, the grid bias is reduced by means of the INPUT WAVEFORM control, so that the positive pulse spans the range between triggering levels;
3.4 MONOSTABLE MULTIVIBRATOR. The output of the pulse amplifier is applied to a monostable multivibra
tor, a twin-triode, Type 5965. This stage produces an output pulse of constant amplitude and duration for each input pulse. The pulse duration is determined by resistor-capacitors, with accuracy and stability ensured by the use of precision, temperature-compensated capacitors and General Radio wire-wound resistors. Range switching changes the timing resistors and capacitors to produce decade changes in pulse duration.
Resistors R204, R236, R205, and R232 (see Figure 25) are included in the multivibrator circuit to minimize the effects of line-voltage variation.
3.5 OUTPUT STAGE. The output of the multivibrator is applied to the grid of one section of
a Type 5965 twin-triode (V5A), turning this section on for precisely the duration of the pulse. The current during conduction is a function of the regulated voltage E 4 and the cathode resistor (R214), a stable, wire-wound resistor in series with the DIRECT CAL potentiometer. The average current through the plate load resistor is directly proportional to the number of input pulses per second, and thus to the input frequency. A meter across this load resistor indicates this frequency, full-scale meter deflection corresponding to a voltage drop of 15volts across the plate-load resistor R212. The other section of the twin-triode, V5B, is a constant-current source with a plate load consisting of 0.1-percent wire-wound resistors that are switched to provide constant voltages from 0 to 15 volts in 1-volt steps. Its plate current is adjusted by the INTERP CAL control so that the total voltage drop across these resis-
12

TYPE 1142-A FREQUENCY METER AND DISCRIMINATOR
tors is 15 volts. In the interpolation mode of operation, the meter is switched between the plate load of V5B and the plate of V5A. The meter then indicates the difference between the plate voltage of V5A, which corresponds to the fre
quency of the input signal, and the voltage from the voltage divider, which depends upon the setting of the INTERPOLATION OFFSET FREQUENCY
switch. Thus, the input frequency is indicated by the sum of the setting of the INTERPOLATION OFFSET FREQUENCY switch and the reading on the meter.
A maximum current of 7 rna is available at the DIRECT RECORD terminals, so that most 1-ma and 5-ma recorders can be used. The RECORD CURRENT potentiometer is a convenient sensitivity control for these recorders, and has no visible interaction on the meter indication.
A second set of recorder output terminals (INTERP RECORD) makes available the interpolation signal from the meter circuit. Full-scale voltage is 0.64 volt behind 4800 ohms. Use of a high-impedance recorder eliminates any interaction on the meter indication.
3.6 OPERATION AS A DISCRIMINATOR.
3.6.1 GENERAL. The frequency meter operates by generating a constantamplitude, constant-duration pulse for each cycle of the input signal. These standardized pulses have a fixed time relation with respect to the incoming
signal, thus making possible the operation of the frequency meter as a pulsecount discriminator.
3.6.2 FM TERMINALS. With a constant-frequency input signal (Figure 6a), the standard pulses are uniformly spaced (Figure 6b). If a low-pass filter is used to attenuate the carrier-frequency components, a de signal results
(Figure 6c). If the input frequency varies, i.e., is frequency modulated, as in Figure 6d, th,e standardized pulses are no longer uniformly spaced (Figure
CW FM
(a) MJ\f\f\f\} INPUT ~(d) I "I -! -1 -1 -1 - I . i I
(blo:">J Ommnr (P~~J:g~OUT-mnnnr(el PUT STAGE}
-45
AC READ WITH AC VTVM, WAVE ANALYZER, ETC.
AVERA~(fl Figure 6. Diagram Showing Operation of the Pulse-Count Discriminator for
(left) Constant Input Frequency and (right) Frequency-Modulated Input.
13
GENERAL RADIO COMPANY
6e). If a low-pass filter is used to attenuate the carrier-frequency components of the pulse train, an ac signal identical to the original modulating
signal results (Figure 6f). The output at the FM terminals is in the form of pulses with a peak
value of -45 volts and an average value, at full scale on all ranges, of -15
volts de. In order to measure the ac output voltage corresponding to the modu
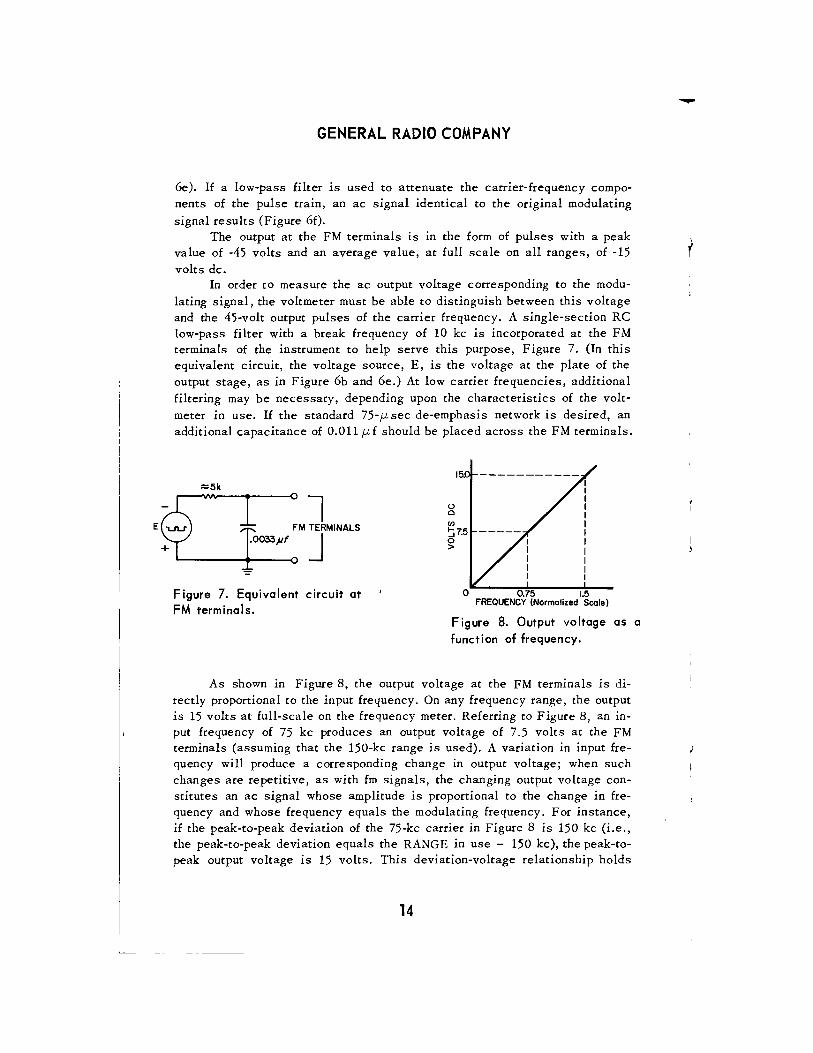
lating signal, the voltmeter must be able to distinguish between this voltage and the 45-volt output pulses of the carrier frequency. A single-section RC low-pass filter with a break frequency of 10 kc is incorporated at the FM terminals of the instrument to help serve this purpose, Figure 7. (In this equivalent circuit, the voltage source, E, is the voltage at the plate of the output stage, as in Figure 6b and 6e.) At low carrier frequencies, additional filtering may be necessary, depending upon the characteristics of the volt
meter in use. If the standard 75-J..L sec de-emphasis network is desired, an additional capacitance of 0.011 J.Lf should be placed across the FM terminals.
:::5k
l FM TERMINALS
.0033pf J Figure 7. Equivalent circuit at FM terminals.
(.) 0
en t::i7.5 0 >
0.75 1.5 FREQUENCY (Normalized Scale)
Figure 8. Output voltage as a function of frequency.
As shown in Figure 8, the output voltage at the FM terminals is directly proportional to the input frequency. On any frequency range, the output is 15 volts at full-scale on the frequency meter. Referring to Figure 8, an input frequency of 75 kc produces an output voltage of 7.5 volts at the FM terminals (assuming that the 150-kc range is used). A variation in input frequency will produce a corresponding change in output voltage; when such changes are repetitive, as with fm signals, the changing output voltage constitutes an ac signal whose amplitude is proportional to the change in frequency and whose frequency equals the modulating frequency. For instance, if the peak-to-peak deviation of the 75-kc carrier in Figure 8 is 150 kc (i.e., the peak-to-peak deviation equals the RANGE in use - 150 kc), the peak-topeak output voltage is 15 volts. This deviation-voltage relationship holds
14

TYPE 1142-A FREQUENCY METER AND DISCRIMINATOR
throughout any range, so that, for instance, a 15-,I.Lv change in output voltage (peak, peak-to-peak, or rms) would indicate a 1-ppm change in input frequency (peak, peak-to-peak, or rms).
The narrow-band noise is more than 120 db down from full output; therefore, peak deviation as small as 1.5 cps on the 1.5-Mc range or 0.0015 cps on the 1.5-kc range can be measured. 3.6.3 DIRECT RECORD TERMINALS. The signal" at the DIRECT RECORD terminals is similar to that at the FM terminals (paragraph 3.6.2) except that the maximum output voltage is 3.5 volts de instead of 15 volts at full scale on any range, the maximum output impedance is 500 ohms instead of 5000 ohms, and the 10-kc low-pass filter is not used. The equivalent circuit at the DIRECT RECORD terminals is shown in Figure 9.
500.0.
DIRECT RECORD
22ma
I
Figure 9. Equivalent circuit at the DIRECT RECORD terminals (a) and corresponding current-source waveform (b).
3.6.4 INTERP RECORD TERMINALS. When zero suppression is desirable such as for frequency-drift measurements using a recorder, the INTERP RE· CORD terminals should be used. The output at these terminals is shown in Figure 10. The position of the base line A-A varies with respect to ground potential as the setting of the INTERPOLATION OFFSET FREQUENCY
switch is changed. Furthermore, the position of the pulse train with respect to base line A-A varies with the input frequency. Accordingly, a useful equivalent circuit for the INTERP RECORD terminals is not reasonable.
If excessive vibration of the recorder pen occurs because of this pulse train, insert a capacitor of one or more microfarads across the INTERP RECORD terminals.
Figure 10. Voltage across the INTERP terminals.
15

r
GENERAL RADIO COMPANY
3.7 PRECAUTIONS IN USE OF DISCRIMINATOR.
3.7.1 GENERAL. While the use of the discriminator poses no problems peculiar to this instrument, certain precautions should be taken to ensure ac
curate measurement of low values of fm deviation. Obviously, sufficient signal must be available. Furthermore, measurements cannot be made if noise generates extraneous zero crossings. 3.7.2 EFFECTS OF ADDITIVE NOISE. A more subtle error in incidental fm measurements can be caused by a low-frequency noise signal superimposed on the input signal. The generated pulse does not start precisely at the zero crossing of the input signal but at a time when the input signal reaches some fixed voltage (usually less than 10 mv). Noise introduced with the signal will result in some variation in the time relationship between the input signal and the output pulses and will be measured as fm. The amount of this fm is a function of the frequency of the noise as well as of the signal-to-noise ratio. The peak deviation of the extraneous fm is approximately:
A noise
A signal
where A = amplitude of noise and input signals.
For example, a 1-volt, 100-kc carrie~, with a noise signal of 1 mv at 100 cps, would give an equivalent fm output of 0.1 cycle or 1 ppm deviation.
A simple RC ~igh-pass filter can be used to reduce the low-frequency noise signal and usually is adequate to eliminate this problem. This filter should be used (1) to remove the recovered amplitude modulation in the measurement of incidental fm on an· amplitude-modulated signal that has been heterodyned in a diode mixer or (2) to remove 60-cycle hum pickup in the input.
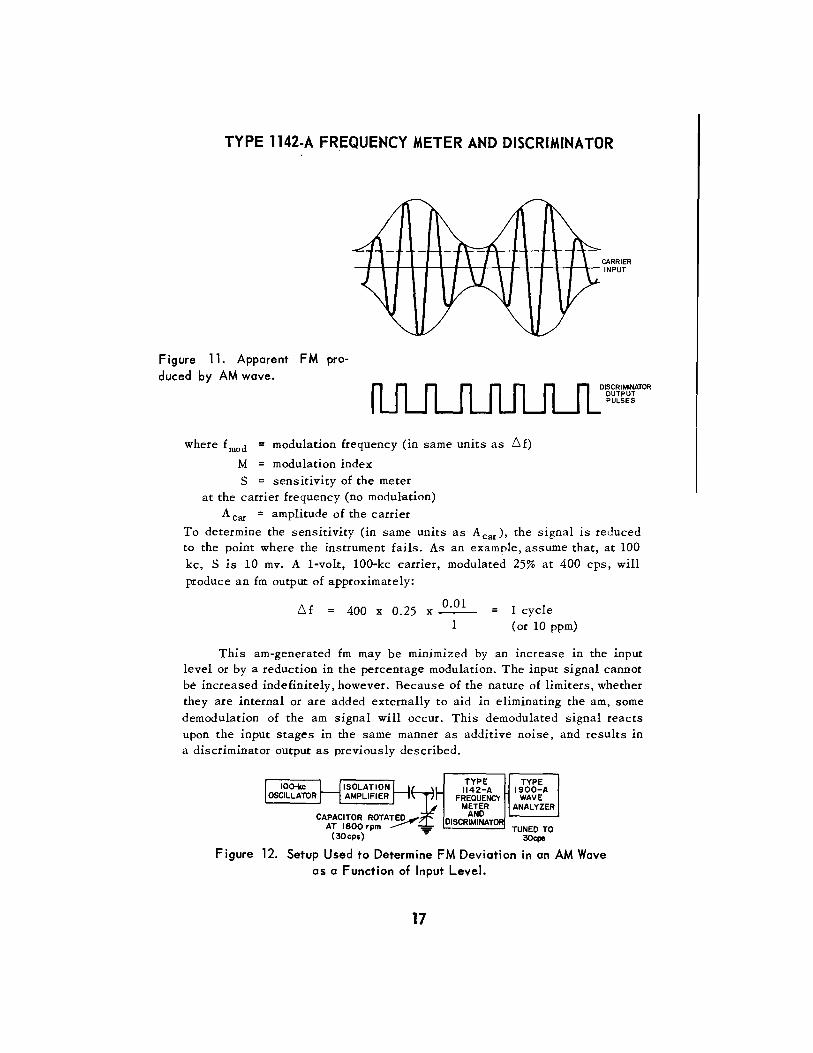
3.7.3 EFFECTS OF AMPLITUDE MODULATION. The presence of high levels of amplitude modulation on the input signal can also produce errors. Obviously, as the modulation approaches 100%, the input carrier is near zero amplitude during a c'onsiderable number of carrier-frequency cycles, and the
input level may be too low for proper operation of the Type 1142-A. Even with sufficient signal a difficulty exists, as shown in Figure 11. The start time of the output pulses is determined by the time at which the input signal reaches a given instantaneous value; therefore, any change in the slope of the input signal affects the time of these pulses with respect to the zero crossing of the input signal. The fm deviation produced by amplitude modulation is approximately:
6f fmod M -f-ear
16
I I
TYPE 1142-A FREQUENCY METER AND DISCRIMINATOR
Figure 11. Apparent F M pro-duced by AM wave.
where fmod
M
modulation frequency (in same units as 6f)
modulation index
S sensitivity of the meter at the carrier frequency (no modulation)
Acar = amplitude of the carrier
DISCRIMINATOR OUTPUT PULSES
To determine the sensitivity (in same units as A car), the signal is reduced to the point where the instrument fails. As an example, assume that, at 100 kc, S is 10 mv. A 1-volt, 100-kc carrier, modulated 25% at 400 cps, will
produce an fm output of approximately:
6f 0.01 x--- 1 cycle 400 X 0.25 1 (or 10 ppm)
This am-generated fm may be minimized by an increase in the input level or by a reduction in the percentage modulation. The input signal cannot be increased indefinitely, however. Because of the nature of limiters, whether they are internal or are added externally to aid in eliminating the am, some demodulation of the am signal will occur. This demodulated signal reacts upon the input stages in the same manner as additive noise, and results in a discriminator output as previously described.
TYPE TYPE
r- 1142-A 1900-A FREQUENCY WAVE
METER ANALYZER AND
DISCRIMINATOR TUNED TO AT 1800 rpm ~
(30cps) 30cps
Figure 12. Setup Used to Determine FM Deviation in an AM Wave as a Function of Input Level.
17

r I
GENERAL RADIO COMPANY
It is difficult, if not impossible, to measure this effect with available amplitude-modulated oscillators or signal generators because of the difficulty of separating the fm generated in the source from that of the discriminator.
To measure this effect, a motor-driven capacitivre voltage divider (Figure 12) was used t~ generate an amplitude-modulated wave relatively free of any fm or phase-modulation effects. A plot of effective fm as a function of
Figure 13. Results of measurements of Figure 12.
input carrier level is shown in Figure 13. It is apparent that an input level between approximately 0.5 volt and 2.0 volts is optimum. On either side of this range there is an increase in measured fm. At low voltages there is insufficient signal for accurate measurement, and above 2.0 volts the limiters produce some demodulation.
A knowledge of these sources of error in measurements with the discriminator should be helpful in explaining the functions of the various filters used in the measurements of fm, flutter, and wow, described in Section 4.
4.1 GENERAL.
Section 4
APPLICATIONS
The Type 1142-A Frequency Meter and Discriminator can be used to measure and to record frequency and frequency changes, or used as an extremely linear and low-noise discriminator for fm demodulation and incidentalfm measurements. There are, however, many additional applications utilizing this meter as the main element in a measurement system, which greatly extend its range and utility.
18
TYPE 1142-A FREQUENCY METER AND DISCRIMINATOR
4.2 FREQUENCY AND DRIFT MEASUREMENTS
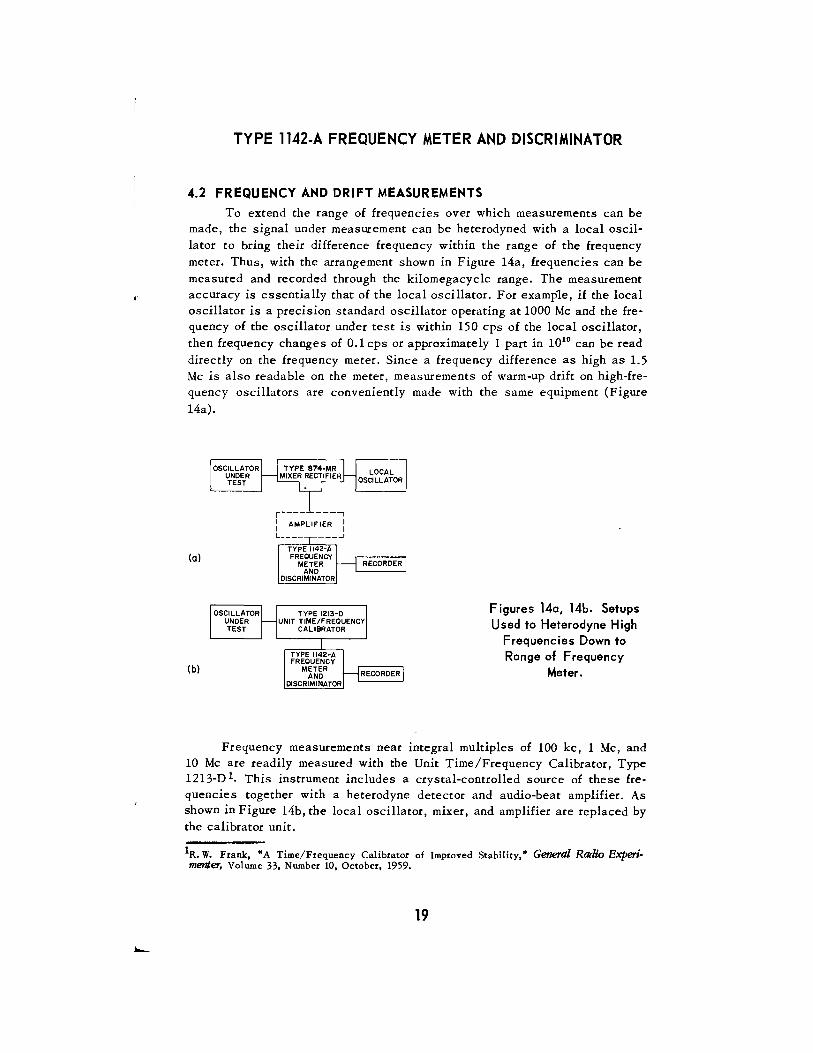
To extend the range of frequencies over which measurements can be made, the signal under measurement can be heterodyned with a local oscillator to bring their difference frequency within the range of the frequency meter. Thus, with the arrangement shown in Figure 14a, frequencies can be
measured and recorded through the kilomegacycle range. The measurement accuracy is essentially that of the local oscillator. For example, if the local oscillator is a precision standard oscillator operating at 1000 Me and the frequency of the oscillator under test is within 150 cps of the local oscillator, then frequency changes of 0.1 cps or approximately 1 part in 1010 can be read
directly on the frequency meter. Since a frequency difference as high as 1.5 Me is also readable on the meter, measurements of warm-up drift on high-frequency oscillators are conveniently made with the same equipment (Figure
14a).
(a)
(b)
r---- -----, : AMPLIFIER :
L----~-----'
TYPE 1142-A FREQUENCY
METER H RECORDERJ AND
DISCRIMINATOR
Figures 14a, 14b. Setups Used to Heterodyne High
Frequencies Down to Range of Frequency
Meter.
Frequency measurements near integral multiples of 100 kc, 1 Me, and 10 Me are readily measured with the Unit Time/Frequency Calibrator, Type 1213-D 1. This instrument includes a crystal-controlled source of these frequencies together with a heterodyne detector and audio-beat amplifier. As shown in Figure 14b, the local oscillator, mixer, and amplifier are replaced by the calibrator unit.
1R. W. Frank, "A Time/Frequency Calibrator of Improved Stability,• General Radio Experimenter, Volume 33, Number 10, October, 1959.
19

r
GENERAL RADIO COMPANY
IOOOMc
TYPE 1142-A FREQUENCY
METER
DISC~~I~ATOR f------4----t~~~--'-----___l
Figure 15. Setup Used to Measure Relative Drift of Two 5-Mc Oscillators. The 5-Mc frequencies were multiplied up to
1000 Me to magnify frequency drift.
The arrangement shown in Figure 15 was used to obtain the record (Figure 16) of the relative drift of two 5-Mc crystal oscillators. The 4-f.lf capacitor on the interpolation recorder output provides sufficient filtering to prevent the recorder pen from responding to the pulse frequency in the frequencymeter output. The shunt resistor was used to adjust the full-scale sensitivity
of the recorder, in this instance to one part in 10 8 .
4.3 FREQUENCY -MODULATION MEASUREMENTS.
Fm deviation measurements are made by substitution of an ac voltmeter for the de recorder shown in Figure 14a. The use of heterodyne techniques not only extends the frequency range but also increases the resolution.
As an example, incidental-fm measurements of a 50-Mc oscillator were
made with the use of a battery-powered 49.5-Mc local oscillator; battery power was used to eliminate incidental-fm components of the ac power-supply frequencies from the local oscillator, because these were the primary fm components of interest in the oscillator under measurement. The results, however, showed that, while 60- and 120-cycle fm components of a normal level did exist, even larger peak __ deviations at 25- and 45-cycle rates were also present. These fm components were finally -traced to microphonics in the
Figure 16. Recording of the Measurement
of Figure 15.
'---\----
~r----
-1---- ---=1------= ---+-:___ ---=------+--
---+-
20
=

.·
TYPE 1142-A FREQUENCY METER AND DISCRIMINATOR
oscillator under test. The sources of the vibrations were a blower-cooled oscilloscope and power supply resting on the same bench as the 50-Mc oscillator, with fan speeds of 1500 and 2700 rpm respectively.
A measurement that demanded the full utilization of the techniques and precautions previously discussed was the determination of the fm noise level of the Type 1112-A Standard-Frequency Multiplier2. A block diagram of the measuring setup is shown in Figure 17. Inasmuch as the predominant fm components were expected to be harmonics of the power-line frequency, the multiplier was powered by a variable-frequency power supply set to approximately 70 cps, so as to permit separation of the multiplier's fm noise level from that of the rest of the system. The low output level of the 9.9988-Mc
IOOKc TYPE lOMe 1112-A
MlA.TIPLIER
TYPE 874-MR MIXER
RECTIFIER
9.9988Mc
70"'·----' POWER INPUT
1.2KC ±I'M DEVIATIONi--.==,..,.,.,.,...,..., TYPE1142·A FREQUENCY
METER AND
DISCRIMINATOR 1.5-KcRANGE
Figure 17. Setup Used to Measure FM Noise Level of Type 1112-A Standard-Frequency Multiplier.
local oscillator necessitated the use of an amplifier (Type 1206-B) to drive the frequency meter. A band-pass filter consisting of a 2-kc, low-pass, RC, section together with a 1-kc, high-pass, RC, section attenuated extraneous signals (60- and 70-cycle hum as well as high-frequency carrier noise) while passing the 1. 2-kc carrier and sidebands. The 800-cycle and 500-cycle filters shown in Figure 17 prevent the 45-volt, 1.2-kc pulses from overloading the wave analyzer.
In the above setup, i.e., with a 10-Mc carrier and a 1.2-kc beat, a 7 f.lV reading on the wave analyzer corresponds to a peak deviation of approximately one part in 10 10. The total noise level of the Type 1112-A Standard
Frequ.ency Multiplier was found to be approximately 5 parts in 10 10 .
While the previous examples have been concerned primarily with small peak deviations at low modulation rates, there are occasions when the measurement of large frequency deviations or high modulation frequencies is desired. The sum of the peak deviations above the carrier frequency and the
2F. D. Lewis, "New Standard-Frequency Multipliers," General nadio Experimenter, Volume 32, Number 14, July, 1958.
21
GENERAL RADIO COMPANY
earner frequency must not exceed 1.5 Me. The peak deviation below the carrier frequency cannot enter the pass band of the filter, which must pass the highest modulation frequency. For modulating frequencies above 10 kc, the output is decreased because of the internal 10-kc filter. If a higher rolloff frequency is desired, it is necessary either to remove this filter or to use DIRECT RECORD terminals (paragraph 2.5.3). The roll-off frequency now depends upon the capacitive load of the external voltmeter or filter. However, with a total shunt capacitance of 500 pf, it is possible to maintain the response within 1 db out to a 200-kc modulation frequency.
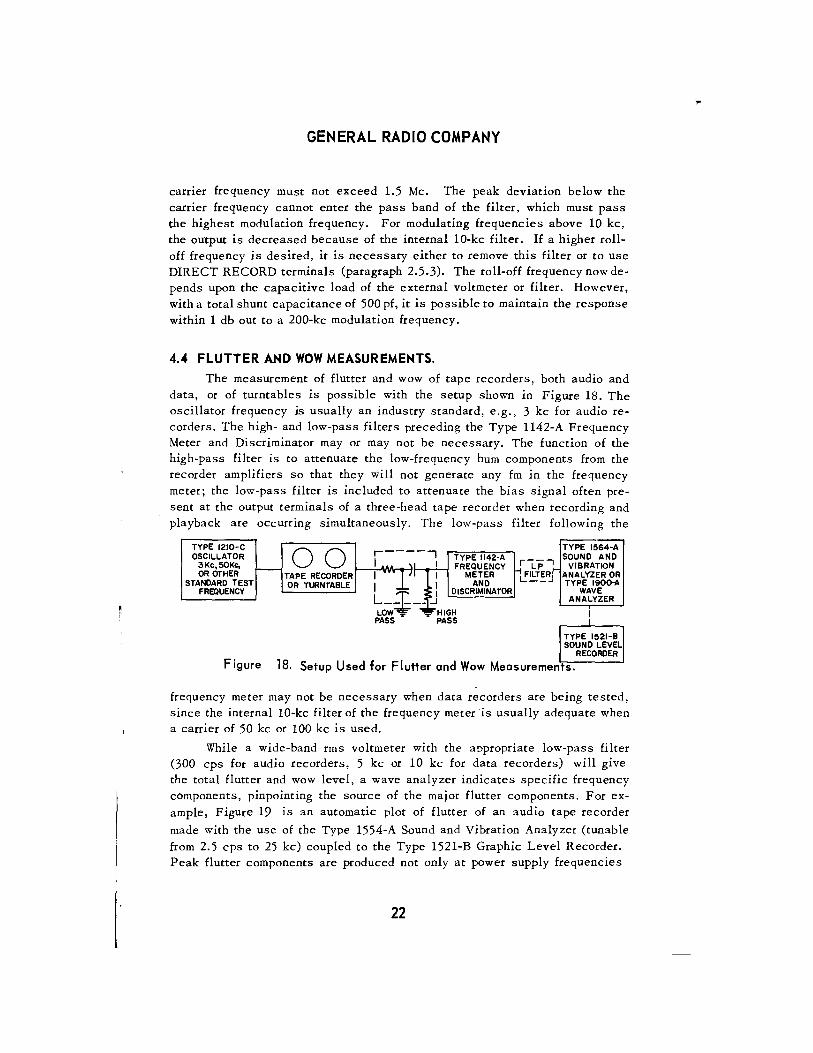
4.4 FLUTTER AND WOW MEASUREMENTS. The measurement of flutter and wow of tape recorders, both audio and
data, or of turntables is possible with the setup shown in Figure 18. The oscillator frequency is usually an industry standard, e.g., 3 kc for audio recorders. The high- and low-pass filters preceding the Type 1142-A Frequency Meter and Discriminator may or may not be necessary. The function of the high-pass filter is to attenuate the low-frequency hum components from the recorder amplifiers so that they will not generate any fm in the frequency meter; the low-pass filter is included to attenuate the bias signal often present at the output terminals of a three-head tape recorder when recording and playback are occurring simultaneously. The low-pass filter following the
TYPE 1210-C
00 OSCILLATOR 3Kc,50Kc, r--OR OTHER TAPE RECORDER
STANDARD TEST OR TURNTABLE FREQUENCY
Figure 18.
r-----, TYPE 1142·A
I \I I FREQUENCY
: "l" I METER I AND
L-1:-~ I DiSCRIMINATOR
...I ... LOW ... ... HIGH PASS PASS
TYPE 1564-A
L! _ SOUND AND
r LP'... viBRATioN t!ILTERj ANALYZER OR -- TYPE 1900-A
WAVE ANALYZER
frequency meter may not be necessary when data recorders are being tested, since the internal 10-kc filter of the frequency meter 'is usually adequate when a carrier of 50 kc or 100 kc is used.
While a wide-band rms voltmeter with the appropriate low-pass filter (300 cps for audio recorders, 5 kc or 10 kc for data recorders) will give the total flutter and wow level, a wave analyzer indicates specific frequency components, pinpointing the source of the major flutter components. For example, Figure 19 is an automatic plot of flutter of an audio tape recorder
made with the use of the Type 1554-A Sound and Vibration Analyzer (tunable from 2.5 cps to 25 kc) coupled to the Type 1521-B Graphic Level Recorder. Peak flutter components are produced not only at power supply frequencies
22
.,.

TYPE 1142-A FREQUENCY METER AND DISCRIMINATOR
ANALVZI!:R
BANDWIDTH
01/3 OCTAVE
JINARROW
-60
RECORDER
m 0
CHART SPEED ~ o 2.s o 2s_70m )(7,5 07!1 z
IN/MIN ~ 13 0:
RECORDER -80 WRITING SPEED
01 D(to 03 020
IN/SEC
2::>
DIEnriiD e OCTAVE e IAIID e CEIITEI e FREOS e • • • • e OIE-TIIID
+--
50 I 0 250 FREQUENCY (cps)
Figure 19. Recording of Flutter in an Audio Tape Recorder, Made with Setup Shown in Figure 14. A response of -60 db corresponds to a
frequency deviation of 0.1% of the test frequency.
but also at frequencies directly related to motor speed, capstan speed, idler speed, etc.
Automatic plots like that of Figure 19 can be made over a frequency range of 20 cps to 25 kc. The response of the Graphic Level Recorder drops off below 20 cps so that hand-plotting is necessary at lower frequencies.
4.5 PRODUCTION APPLICATIONS.
Since the frequency meter generates a standardized pulse for each input cycle, it follows that it will measure the average of a frequency that is changing, even if it is aperiodic or random. This fact is made use of ion production testing of the Type 1300-A Beat-Frequency Video Generator. To calibrate the sweep-frequency circuits, the peak deviation with sine wave sweep is set to 1 Me by measurement of the average output frequency. Since the average of a sine wave is 0.636 of peak, the frequency is adjusted for a frequency-meter indication of 636 kc.
It is also apparent that signals to be counted may be derived from simple photocell devices, tachometers, geiger tubes, magnetic pickups, or any other transducers capable of supplying a 30-mv peak signal.
23
GENERAL RADIO COMPANY
Section 5
SERVICE AND MAINTENANCE
5.1 GENERAL. The two-year warranty given with every General Radio instrument at
tests the quality of materials and workmanship in our products. When difficulties do occur, our service engineers will assist in any way possible.
In case of difficulties that cannot be eliminated by the use of these service instructions, please write or phone our Service Department, giving full information of the trouble and of steps taken to remedy it. Be sure to mention the serial and type numbers of the instrument.
Before returning an instrument to General Radio for service, please write to our Service Department or nearest District Office (see back cover), requesting a Returned Material Tag. Use of this tag will ensure proper handling and identification. For instruments not covered by the warranty, a purchase order should be forwarded to avoid unnecessary delay.
5.2 FREQUENCY ALIGNMENT. The frequency calibration of individual frequency ranges can be adjusted
easily without removal of the instrument cover. Such alignment may be required under the following conditions:
a. after replacement of tubes, especially of V4 and V5, b. under conditions of extreme ambient temperatures, c. if, after calibration in accordance with paragraph 2.6, the upper ranges
do not appear to be calibrated. Before making the following adjustments, calibrate the lowest range
against a 100-cycle standard as described in paragraph 2.6. Then proceed as follows:
a. Connect the standard 1-Mc signal to the INPUT terminals. Measure the frequency of this signal, using the INTERPOLATION mode of operation (paragraph 2.3).
b. With the INTERPOLATION OFFSET FREQUENCY switch at 1.0, the meter should indicate 0. If it does not, adjust trimmer capacitor C211 (see Figure 20) as necessary to zero the meter.
c. Align the remaining three ranges in a similar manner, using standard frequencies of 1, 10, and 100 kc as appropriate. Adjust trimmer capacitors
C208, C209, and C210 for the 1.5-, 15-, and 150-kc ranges, respectively. Locations of these adjustments are shown in Figure 20.
24

TYPE 1142-A FREQUENCY METER AND DISCRIMINATOR
Figure 20. Location of Frequency Adjustments.
5.3 REMOVAL OF COVER.
1.5 MC ~ C211
15KC C209~
~ 150KC C210
~1.5KC C208
To open the instrument for access to tubes and components, loosen the two fluted captive screws at the rear of the instrument and slide the U-shaped dust cover away from the panel. All tubes and adjustments and most components are now accessible. Occasionally, it may be necessary to remove the side panels of the instrument. To do this, remove the four screws from the corners of the front pane 1 and the two screws at the rear of each side panel.
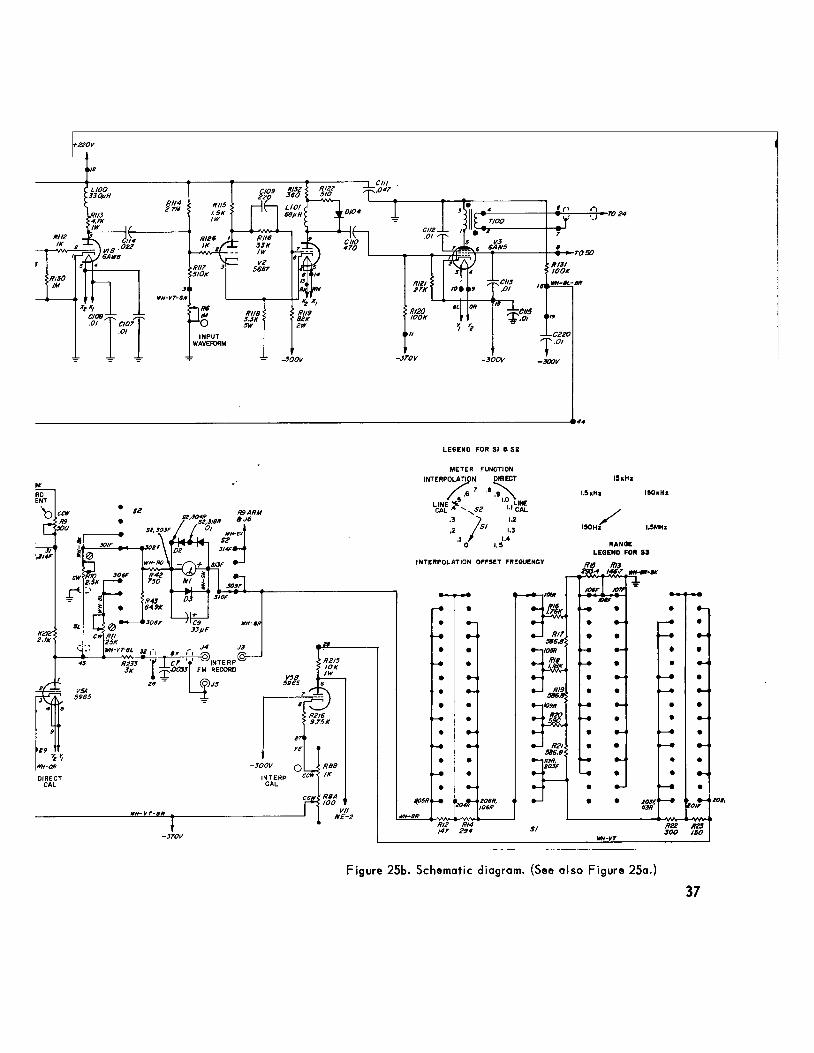
5.4 RECONNECTION OF POWER TRANSFORMER FOR DIFFERENT LINE VOLTAGE.
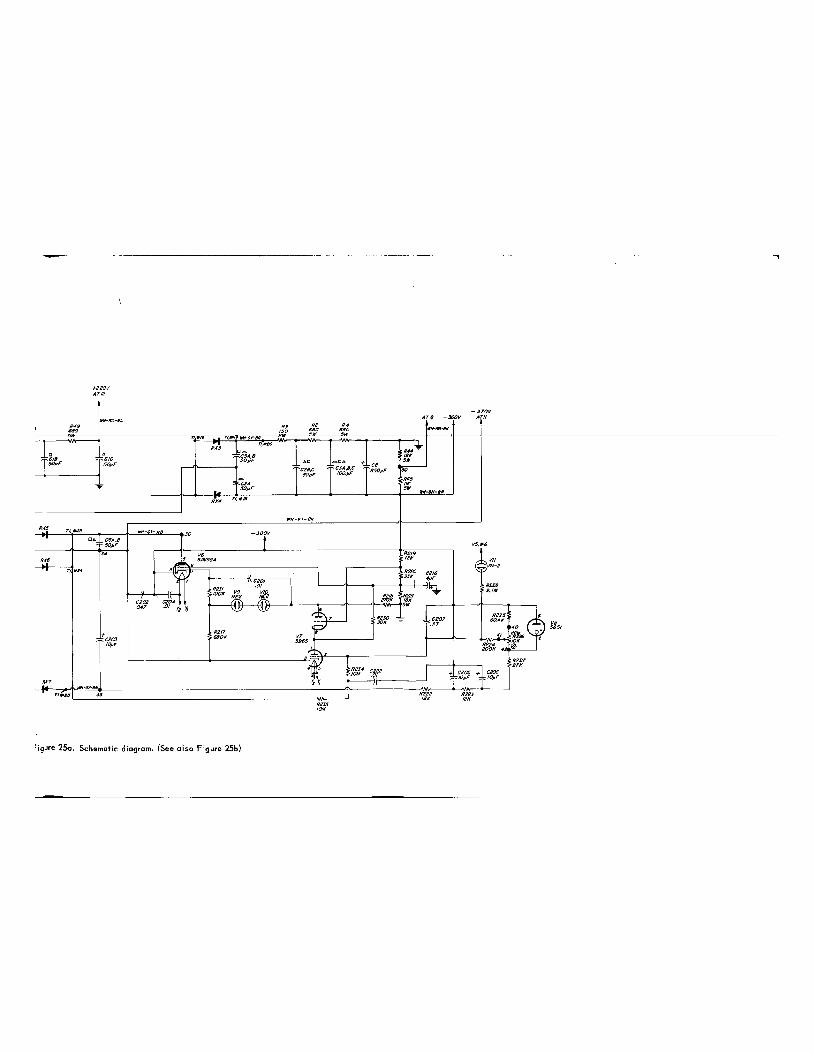
Unless otherwise ordered, the Type 1142-A Frequency Meter and Discriminator is shipped with its power transformer wired for 115-volt, 50-60-cycle input. A simple wiring change at the transformer primary is all that is required to convert the instrument for 230-volt operation, or to convert a 230-volt model for 115-volt service. Refer to the schematic diagram, Figure 25, for proper connections. When rewiring the transformer primary for a different line voltage, be sure to change the input plate adjacent to the power·
input connector so that the legend indicates the appropriate input voltage
and frequency. The instrument is normally supplied for 115-volt operation, with a corresponding plate (Type LAP-166E). A 230-volt plate (Type LAP-166E2) is supplied with a 230-volt instrument. When the line voltage is changed, the appropriate plate may be ordered from General Radio. Also install fuses appropriate to the line voltage used, as indicated in the parts list.
5.5 TROUBLE-SHOOTING PROCEDURE.
If the instrument is inoperative and the pilot light is not on, look through the ventilation holes in the top of the dust cover to see if the tube filaments are lit. If the filaments are lit, the pilot light is defective and must be replaced (refer to parts list). If neither the tube filaments nor the pilot light are lit, check to see that the instrument is connected to a source of proper voltage. Then remove the dust cover (refer to paragraph 5.3) and check the two fuses mounted on the power transformer at the rear of the instrument. If either fuse is defective, insert a replacement of the proper rating (refer to parts list).
If, after the above checks have been made, the instrument does not respond to an input signal, check the following power-supply voltages, using
25
l
GENERAL RADIO COMPANY
either a vacuum-tube voltmeter or a 20,000-ohm-per-volt multimeter. Voltages in the following table are from the anchor terminals indicated to ground and may vary ±10%.
Anchor Terminal No.
12 15 or 25
34
DC volts to ground
+220
-300 -370
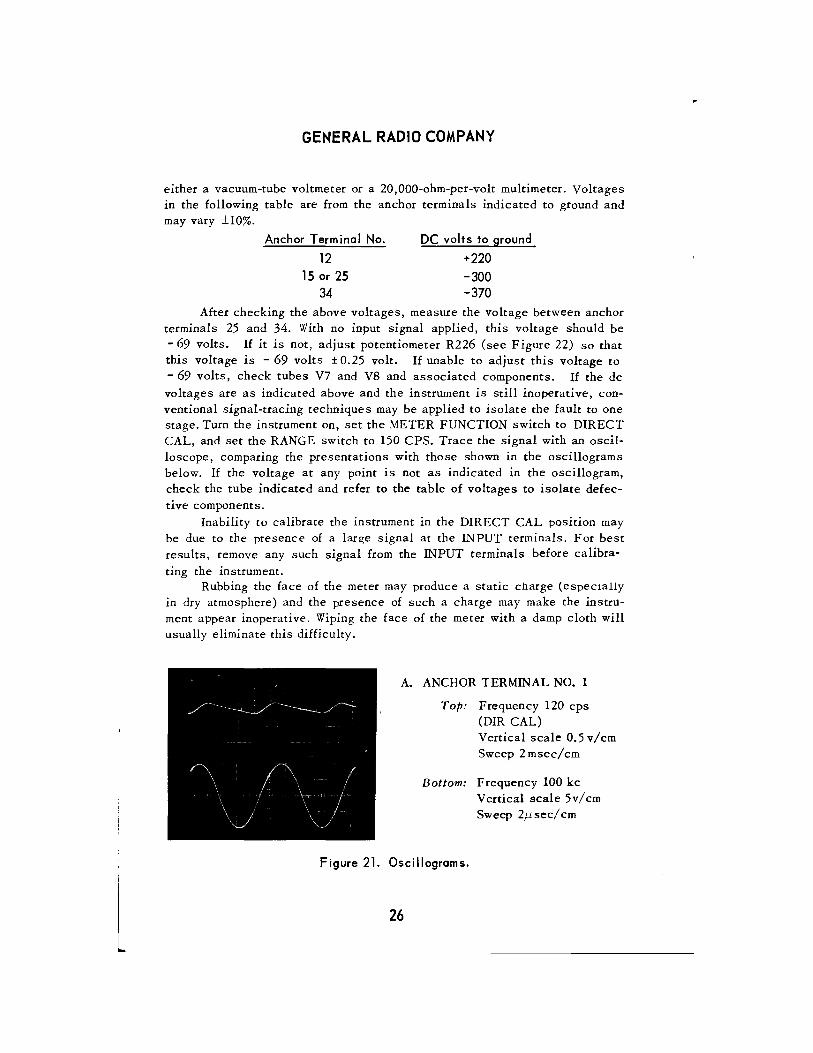
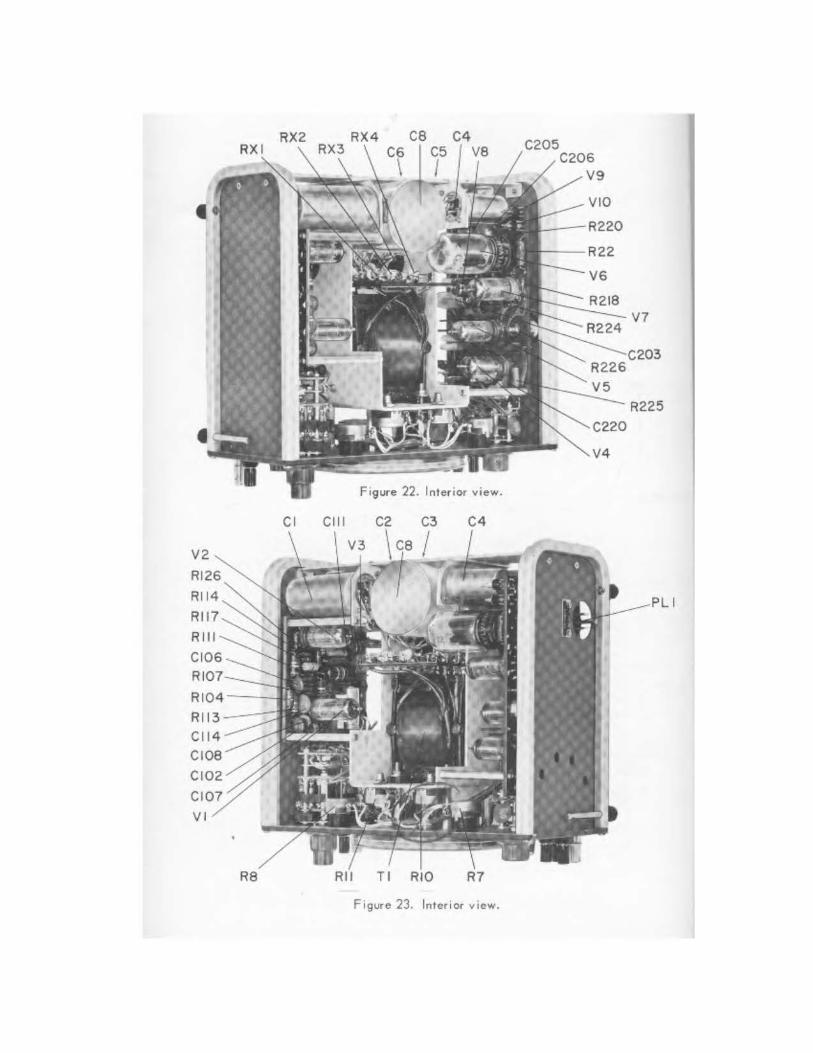
After checking the above voltages, measure the voltage between anchor terminals 25 and 34. With no input signal applied, this voltage should be -69 volts. If it is not, adjust potentiometer R226 (see Figure 22) so that this voltage is - 69 volts ± 0. 25 volt. If unable to adjust this voltage to - 69 volts, check tubes V7 and V8 and associated components. If the de voltages are as indicated above and the instrument is still inoperative, conventional signal-tracing techniques may be applied to isolate the fault to one stage. Turn the instrument on, set the METER FUNCTION switch to DIRECT CAL, and set the RANGE switch to 150 CPS. Trace the signal with an oscilloscope, comparing the presentations with those shown in the oscillograms below. If the voltage at any point is not as indicated in the oscillogram, check the tube indicated and refer to the table of voltages to isolate defective components.
Inability to calibrate the instrument in the DIRECT CAL position may be due to the presence of a lar11;e signal at the INPUT terminals. For best results, remove any such signal from the INPUT terminals before calibra
ting the instrument. Rubbing the face of the meter may produce a static charge (especially
in dry atmosphere) and the presence of such a charge may make the instrument appear inoperative. Wiping the face of the meter with a damp cloth will usually eliminate this difficulty.
A. ANCHOR TERMINAL NO. 1
Top: Frequency 120 cps (DIR CAL) Vertical scale 0.5 v/cm Sweep 2 msec/cm
Bottom: Frequency 100 kc Vertical scale 5v/cm Sweep 2f.1sec/cm
Figure 21. Oscillograms.
26
TYPE 1142~A FREQUENCY METER AND DISCRIMINATOR
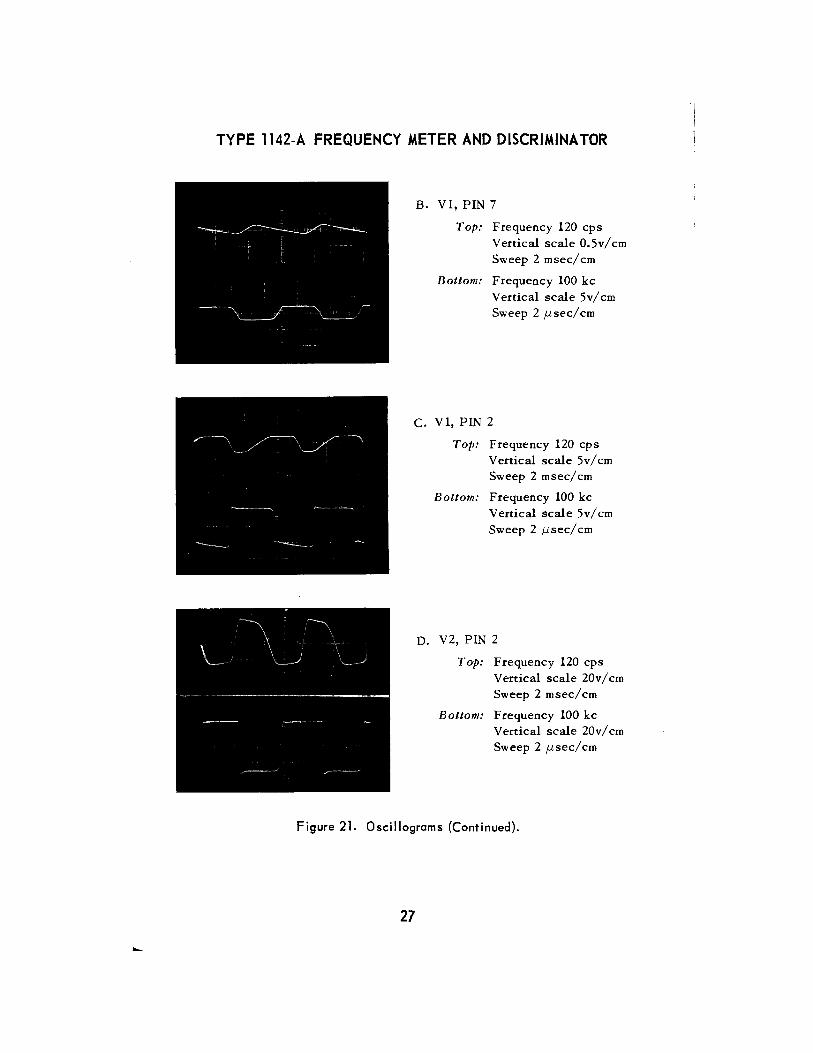
B. V1, PIN 7
Top: Frequency 120 cps Vertical scale 0.5vlcm Sweep 2 mseclcm
Bottom: Frequency 100 kc Vertical scale Svlcm Sweep 2 jJ.secl em
C. Vl, PIN 2
Top: Frequency 120 cps Vertical scale 5vlcm Sweep 2 msecl em
Bottom: Frequency 100 kc Vertical scale Svlcm Sweep 2 jJ.Secl em
D. V2, PIN 2
Top: Frequency 120 cps Vertical scale 20v I em Sweep 2 msecl em
Bottom: Frequency 100 kc Vertical scale 20v I em Sweep 2 fJ.seclcm
Figure 21. Oscillograms (Continued).
27

GENERAL RADIO COMPANY
E. V3, PIN 1
Top: Frequency 120 cps Vertical scale lOv I em Sweep 1 f.1Secl em
Bottom: Frequency 100 kc Vertical scale lOv I em Sweep 1 f.1secl em
F. ANCHOR TERMINAL NO. 6 or 24
Top: Frequency 120 cps Vertical scale 20vlcm Sweep 0.1 f.1secl em
Bottom: Frequency 100 kc Vertical scale 20vlcm Sweep 0.1 f.1Seclcm
G. V4, PIN 8
Top: Freq•Jency 120 cps Vertical scale lOv I em Sweep 2 mseclcm
Bottom: Frequency 100 kc Vertical scale 10vlcm Sweep 2 f.1Seclcm
Figure 21. Oscillograms (Continued).
28
TYPE 1142-A FREQUENCY METER AND DISCRIMINATOR
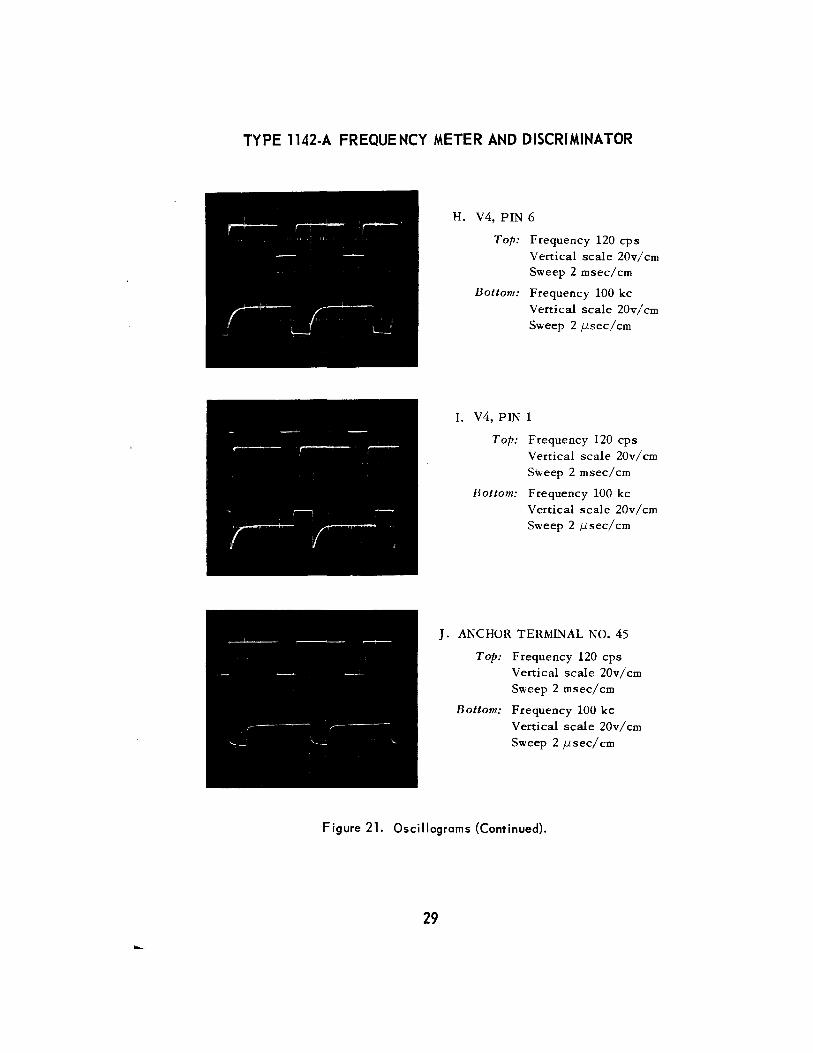
H. V4, PIN 6
Top: Frequency 120 cps Vertical scale 20v/cm Sweep 2 msec/ em
Bottom: Frequency 100 kc
Vertical scale 20v/ em Sweep 2 f.1sec/cm
I. V4, PIN 1
Top: Frequency 120 cps Vertical scale 20v/cm Sweep 2 msec/cm
Bottom: Frequency 100 kc Vertical scale 20v/cm Sweep 2 f.1sec/cm
J. ANCHOR TERMINAL NO. 45
Top: Frequency 120 cps Vertical scale 20v/cm Sweep 2 msec/cm
Bottom: Frequency 100 kc Vertical scale 20v /em Sweep 2 f.1sec/ em
Figure 21. Oscillograms (Continued).
29

GENERAL RADIO COMPANY
5.6 TABLE OF VOLTAGES
TUBE PIN DC TUBE PIN DC TUBE PIN DC (TYPE) VOLTS (TYPE) VOLTS (TYPE) VOLTS
V1 1 0 V3 3 -370f V5 7 -300 (6AW8} 2 -2.2 (6AN5) 4 -370f (5965) 8 -295
3 205 (Cont) 5 -0.2v (Cont) 9 -370f 4 f 6 -185 V6 1 -318 5 0 7 -300 (6AV5GA 2 -370f 6 1.1 3 -300 7 -1.5 V4 1 -330
4 (5965) 2 -370 -8 140 5 -200 9 147 3 -368 6 -4 -370f 7 -370f
V2 1 215 5 -370f 8 -175 (5687) 2 35 6 0
3 70 7 -330 V7 1 -265
4 0 8 -305 (5965) 2 -370
5 f 9 -370f 3 -368
6 70 4 -370
7 64 V5 1 -0 5 -370
8 0 (5965) 2 -330 6 -195
9 220 3 -305 7 -268
4 -370f 8 -265
V3 1 -320 5 -370f 9 -370
(6AN5) 2 -300 6 -81 v8 2 -385 f indicates filaments elevated above £round (5651) 5 -304
DC Supplies to Ground Transformer Voltages
AT DC Volts Terminals Volts ac
12 220 5-6 103 25 -3001 7-8 130 34 -370 1 11- 9 125 33 -535 11- 10 125
1 Voltage without input signal
12 - 13 6.3 14- 15 6.3
Conditions of Measurement: 1. Set panel controls as follows: METER FUNCTION - DIRECT INPUT WAVEFORM - CCW INTERPOLATION OFFSET FREQ - 0 RANGE - 150 C
2. Measure voltages with no input signal.
30

PARTS LIST Ref, No. Description Part No.
Capacitors
CIA} 60 f.!F ClB Electrolytic, 50 f.!F 300 V 4450-2650 ClC 50 f.!F
C2A } 50 f.!F C2B Electrolytic, 25 f.!F 450 V 4450-Q800 C2C 25 f.!F
C3A } 50 f.!F C3B Electrolytic, 25 f.!F 450 V 4450-0800 C3C 25 f.!F C4A} C4B Electrolytic, 30 f.!F 150 V 4450-1700
C5A} C5B Electrolytic, 25 f.!F 200 V 4450-3300
C6A} C6B Electrolytic, 25 f.!F 200 V 4450-3300
C7 Ceramic, 0.0033 f.!F ±5% 500 V 4409-2335 C8 Electrolytic, 650 f.!F 350 V 4450-5599 C9 Electrolytic, 33 f.!F ±20% 10 V 4450-5400 ClO Ceramic, 0.022 f.!F +80-20% 500 V 4407-3229 ClOO Plastic, 0.1 f.!F ±10% 400 V 4860-9300 ClOl Mica, 100 pF ±10% 500 V 4570-0900 Cl02 Ceramic, 0.01 uF +80-20% 500 V 4406-3109 Cl03 Ceramic, 0.01 f.!F +80-20% 500 V 4406-3109 C104- Electrolytic, 10 f.!F +100-10% 250 V 4450-2100 Cl05 Plastic, 0.1 f.!F +10% 400 V 4860-9300 C106 Ceramic, 0.01 f.!F +80-20% 500 V 4406-3109 C107 Ceramic, 0.01 f.lF +80-20% 500 V 4406-3109 C108 Ceramic, 0.01 f.!F +80-20% 500 V 4406-3109 C109 Mica, 220 pF ±10% 500 V 4570-1100 CliO Mica, 470 pF ±10% 500 V 4570-1150 C111 Oil, 0.047 f.lF ±10% 600 V 4510-4200 Cl12 Ceramic, 0.01 f.!F +80-20% 500 V 4406-3109 Cl13 Ceramic, 0.01 f.!F +80-20% 500 V 4406-3109 Cl14 Ceramic, 0.022 f.!F +80-20% 500 V 4407-3229 Cl15 Ceramic, 0.01 f.!F +80-20% 500 V 4406-3109 C200 Plastic, 0.22 f.lF ±10% 400 V 4860-9501
' C201 Ceramic, 0.01 f.!F +80-20% 500 V 4406-3109 C202 Plastic, 0.47 f.lF ±10% 200 V 4860-8247 C203 Electrolytic, 10 f.lF +100-10% 250 V 4450-2100 C204 Ceramic, 0.01 f.!F -1-80-20% 500 V 4406-3109 C205 Electrolytic, 10 f.!F +100-10% 250 V 4450-2100 C206 Electrolytic, 10 f.!F +100-10% 250 V 4450-2100 C207 Plastic, 0,33 f.!F ±10% 400 V 4860-9700 C208 Air, 3.9- 7.5 pF 4380-3300 C209 Air, 2.7 - 19.6 pF 4380-3700 C210 Air, 2.7 - 19.6 pF 4380-3700 C211 Air, 1.7 - 8.7 pF 4380-3600 C212A Mica, 2000 pF ±1/2% 500 V 4600-1198 C212B Ceramic, 180 pF ±5% 500 V 4417-1805 C213 Ceramic, 182 pF ±1% 500 V 4411-1821 C214 Ceramic, 168 pF ±1% 500 V 4411-1681 C215 Ceramic, 22 pF ±5% 500 V 4422-0225 C216 Electrolytic, 4 pF +100-10% 300 V 4450-3200 C217 Ceramic, 0.047 f.!F +80-20% 250 V 4409-3479 C219A Mica, 0.022 iJF ±1/2% 500 V 4565-9223 C219B Ceramic, 600 pF ±5% 500 V N1500 4418-1605 C220 Ceramic, 0.01 f.!F +80-20% 500 V 4406-3109 C22I Ceramic, 0.05 f.!F ±20% 500 V 4408-3509 C222 Ceramic, 0.01 f.!F +80-20% 500 V 4406-3109
31
PARTS LIST (cont) Ref. No. Description Part No.
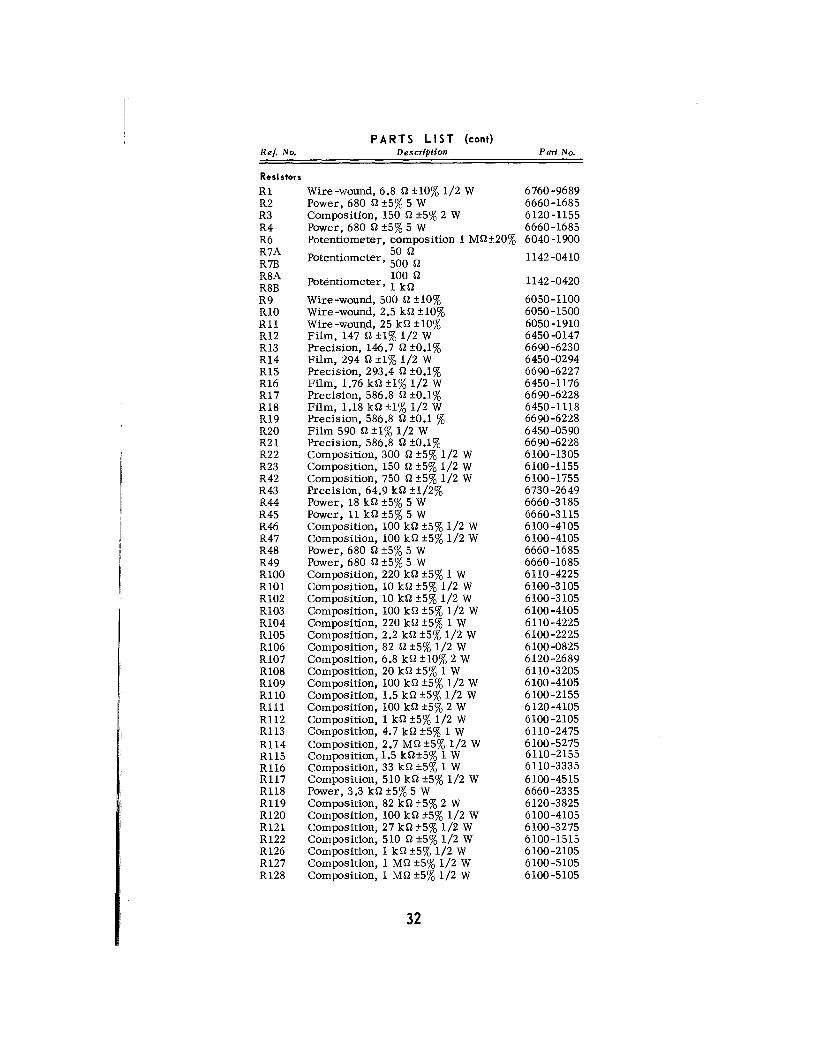
Resistors
R1 Wire-wound, 6.8 Q ±10% 1/2 W 6760-9689 R2 Power, 680 n ±5% 5 W 6660-1685 R3 Composition, 150 Q ±5% 2 W 6120-1155 R4 Power, 680 n ±5% 5 W 6660-1685 R6 Potentiometer, composition 1 MQ±20% 6040-1900 R7A p . 50 Q 1142-0410 R7B otentwmeter, 500 Q
R8A p . . 100 Q 1142-0420 R8B otentwmeter, 1 kQ
R9 Wire-wound, 500 Q ±10% 6050-1100 R10 Wire-wound, 2.5 kn ±10% 6050-1500 Rll Wire-wound, 25 kQ ±10% 6050-1910 R12 Film, 147 Q ±1% 1/2 W 6450-0147 R13 Precision, 146.7 Q ±0.1% 6690-6230 R14 Film, 294 Q ±1% 1/2 W 6450-0294 R15 Precision, 293.4 n ±0.1% 6690-6227 R16 Film, 1.76 kQ ±1% 1/2 W 6450-1176 R17 Precision, 586.8 n ±0.1% 6690-6228 R18 Film, 1.18 kQ ±1% 1/2 W 6450-1118 R19 Precision, 586.8 n ±0.1 % 6690-6228 R20 Film 590 Q ±1% 1/2 W 6450-0590 R21 Precision, 586.8 n ±0.1% 6690-6228 R22 Composition, 300 Q ±5% 1/2 W 6100-1305 R23 Composition, 150 Q ±5% 1/2 W 6100-1155 R42 Composition, 750 Q ±5% 1/2 W 6100-1755 R43 Precision, 64.9 kQ ±1/2% 6730-2649 R44 Power, 18 kQ ±5% 5 W 6660-3185 R45 Power, 11 kQ ±5% 5 W 6660-3115 R46 Composition, 100 kQ ±5% 1/2 W 6100-4105 R47 Composition, 100 kQ ±5% 1/2 W 6100-4105 R48 Power, 680 Q ±5% 5 W 6660-1685 R49 Power, 680 n ±5% 5 W 6660-1685 R100 Composition, 220 kQ ±5% 1 W 6110-4225 R101 Composition, 10 kQ ±5% 1/2 W 6100-3105 R102 Composition, 10 kQ ±5% 1/2 W 6100-3105 R103 Composition, 100 kQ ±5% 1/2 W 6100-4105 R104 Composition, 220 kQ ±5% 1 W 6110-4225 R105 Composition, 2.2 kQ ±5% 1/2 W 6100-2225 R106 Composition, 82 Q ±5% 1/2 W 6100-0825 R107 Composition, 6.8 kQ ±10% 2 W 6120-2689 R108 Composition, 20 kQ ±5% 1 W 6110-3205 R109 Composition, 100 kQ ±5% 1/2 W 6100-4105 RHO Composition, 1.5 kQ ±5% 1/2 W 6100-2155 R111 Composition, 100 kQ ±5% 2 W 6120-4105 R112 Composition, 1 kQ ±5% 1/2 W 6100-2105 R113 Composition, 4. 7 kQ ±5% 1 W 6110-2475 R114 Composition, 2.7 MQ ±5% 1/2 W 6100-5275 Rl15 Composition, 1.5 kQ±S% 1 W 6110-2155 Rll6 Composition, 33 kQ ±5% 1 W 6110-3335 R117 Composition, 510 kQ ±5% 1/2 W 6100-4515 R118 Power, 3.3 kQ±S%5 W 6660-2335 R119 Composition, 82 kQ ±5% 2 W 6120-3825 R120 Composition, 100 kQ ±5% 1/2 W 6100-4105 R121 Composition, 27 kQ ±5% 1/2 W 6100-3275 R122 Composition, 510 Q ±5% 1/2 W 6100-1515 R126 Composition, 1 kQ ±5% 1/2 W 6100-2105 R127 Composition, 1 MQ ±5% 1/2 W 6100-5105 R128 Composition, 1 MQ ±5% 1/2 W 6100-5105
32
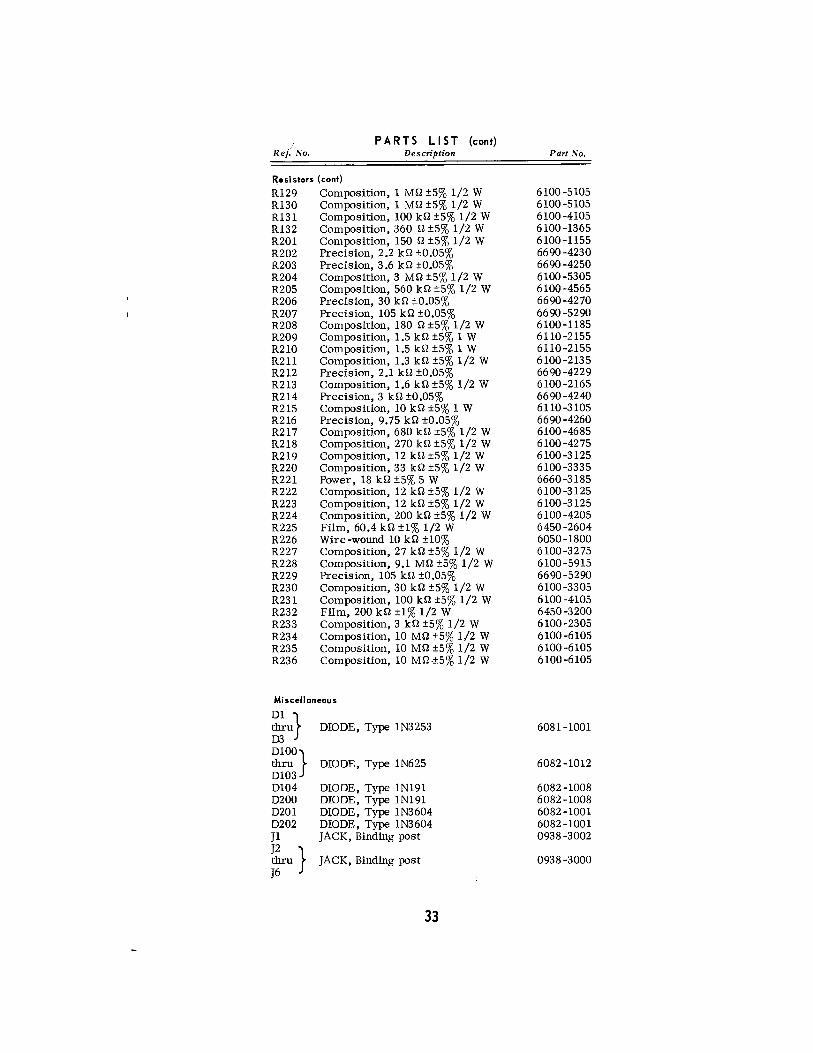
Re/ No. PARTS LIST (cont)
Description
R,esistors (cont)
R129 R130 R131 R132 R201 R202 R203 R204 R205 R206 R207 R208 R209 R210 R211 R212 R213 R214 R215 R216 R217 R218 R219 R220 R.221 R222 R223 R224 R225 R226 R227 R228 R229 R230 R231 R232 R233 R234 R235 R236
Composition, 1 MQ ±5% 1/2 W Composition, 1 MQ ±5% 1/2 W Composition, 100 kQ ±5% 1/2 W Composition, 360 Q ±5% 1/2 W Composition, 150 Q ±5% 1/2 W Precision, 2.2 kQ ±0.05% Precision, 3.6 kQ ±0.05% Composition, 3 MQ ±5% 1/2 W Composition, 560 kQ ±5% 1/2 W Precision, 30 kQ ±0.05% Precision, 105 kQ ±0.05% Composition, 180 Q ±5% 1/2 W Composition, 1.5 kQ ±5% 1 W Composition, 1.5 kQ ±5% 1 W Composition, 1.3 kQ ±5% 1/2 W Precision, 2.1 kQ ±0.05% Composition, 1.6 kQ ±5% 1/2 W Precision, 3 kQ ±0.05% Composition, 10 kQ ±5% 1 W Precision, 9.75 kQ ±0.05% Composition, 680 kQ ±5% 1/2 W Composition, 270 kQ ±5% 1/2 W Composition, 12 kQ ±5% 1/2 W Composition, 33 kQ ±5% 1/2 W Power, 18 kQ ±5% 5 W Composition, 12 kQ ±5% 1/2 W Composition, 12 kQ ±5% 1/2 W Composition, 200 kQ ±5% 1/2 W Film, 60.4 kQ ±1% 1/2 W Wire-wound 10 kQ ±10% Composition, 27 kQ ±5% 1/2 W Composition, 9.1 MQ ±5% 1/2 W Precision, 105 kQ ±0.05% Composition, 30 kQ ±5% 1/2 W Composition, 100 kQ ±5% 1/2 W Film, 200 kQ ±1% 1/2 W Composition, 3 kQ ±5% 1/2 W Composition, 10 MQ ±5% 1/2 W Composition, 10 MQ ±5% 1/2 W Composition, 10 MQ-±5% 1/2 W
Miscellaneous
Dl} ~u
DlOO} thru D103 Dl04 D200 D201 D202 J1 J2 } thru J6
DIODE, Type 1N3253
DIODE, Type 1N625
DIODE, Type 1N191 DIODE, Type 1N191 DIODE, Type 1N3604 DIODE, Type 1N3604 JACK, Binding post
JACK, Binding post
33
Part No.
6100-5105 6100-5105 6100-4105 6100-1365 6100-1155 6690-4230 6690-4250 6100-5305 6100-4565 6690-4270 6690-5290 6100-1185 6110-2155 6110-2155 6100-2135 6690-4229 6100-2165 6690-4240 6110-3105 6690-4260 6100-4685 6100-4275 6100-3125 6100-3335 6660-3185 6100-3125 6100-3125 6100-4205 6450-2604 6050-1800 6100-3275 6100-5915 6690-5290 6100-3305 6100-4105 6450-3200 6100-2305 6100-6105 6100-6105 6100-6105
6081-1001
6082-1012
6082-1008 6082-1008 6082-1001 6082-1001 0938-3002
0938-3000
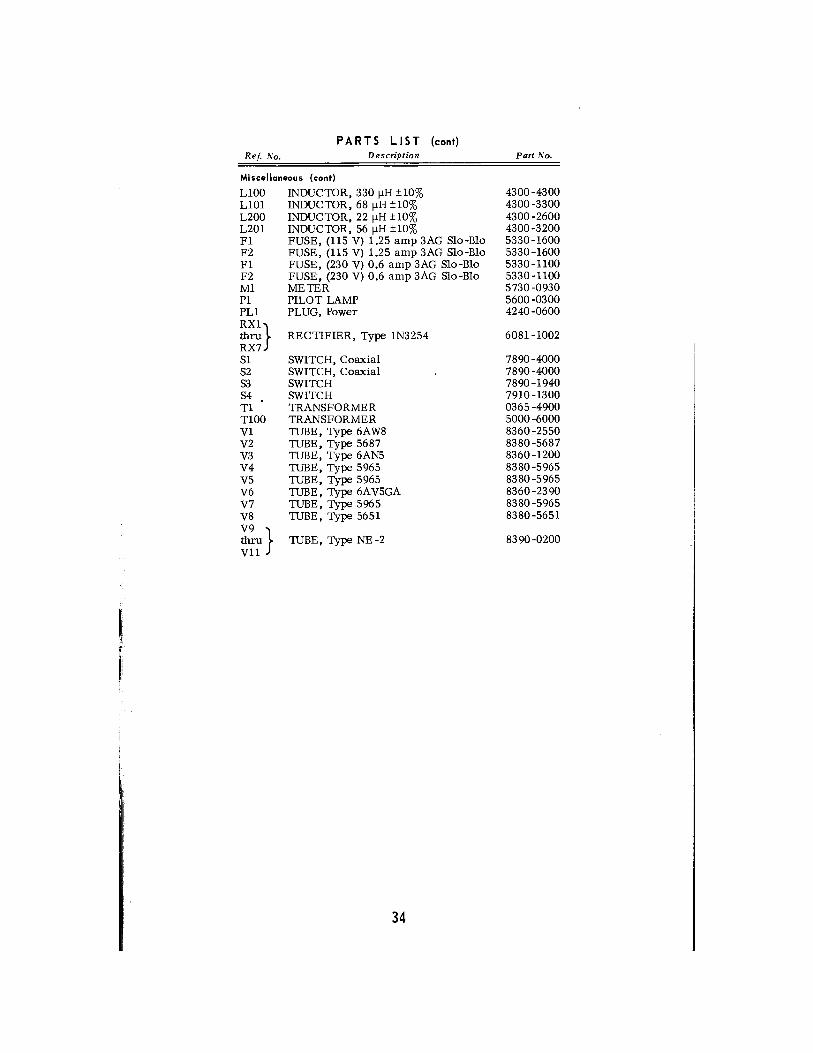
PARTS LIST (cont) Ref, No. Description
Miscellaneous (cont)
L100 INDUCTOR, 330 f.!H ±10% L101 INDUCTOR, 68 f.!H ±10% L200 INDUCTOR, 22 f.!H ±10% L201 INDUCTOR, 56 f.!H ±10% F1 FUSE, (115 V) 1.25 amp 3AG Slo-Blo F2 FUSE, (115 V) 1.25 amp 3AG Slo-Blo F1 FUSE, (230 V) 0.6 amp 3AG Slo-Blo F2 FUSE, (230 V) 0.6 amp 3AG Slo-Blo M1 METER P1 PILOT LAMP PL1 PLUG, Power
RX1} thru RECTIFIER, Type 1N3254 RX7 S1 S2 S3 S4 T1 T100 V1 V2 V3 V4 vs V6 V7 V8
SWITCH, Coaxial SWITCH, Coaxial SWITCH SWITCH TRANSFORMER TRANSFORMER TUBE, Type 6A W8 TUBE, Type 5687 TUBE, Type 6AN5 TUBE, Type 5965 TUBE, Type 5965 TUBE, Type 6A VSGA TUBE, Type 5965 TUBE, Type 5651
V9 } thru TUBE, Type NE-2 V11
34
Part No.
4300-4300 4300-3300 4300-2600 4300-3200 5330-1600 5330-1600 5330-1100 5330-1100 5730-0930 5600-0300 4240-0600
6081-1002
7890-4000 7890-4000 7890-1940 7910-1300 0365-4900 5000-6000 8360-2550 8380-5687 8360-1200 8380-5965 8380-5965 8360-2390 8380-5965 8380-5651
8390-0200

(,.J U"
r I
0
C209
0
0
\ 0 0 o ..
Figure 24. Etched ctl'cutt boords.

RX2
203
Figure 22. Interior view.
PLI
Figure 23. Interior view.

36
RESISTORS I/2WATT, IINL£SS OTHERWISE SP£C!FI£D
R£SISTA#Hob'b OHMf; .lllj';,~~~f!:ERWIS£ SP£CIFI£0
CAPACITANCE VALVES ON£ AND OVER IN PICOFARADS LESS THAN ON£ IN MICHOFARDS, IINL£SS OTHERWISE SF£CIF!£D.
~ SCREWDRIVER ADJI/STM£NT
Q KNOB CONTROL
NOTE FOR Tl FOR llSV OPERATION, CONNECT #lto#3T0#4 FOR 230V OPERATION, CONNECT #2T0#3
AT5
RXI
lllc+-~----~-----~
'"~+-~~~~--~-~
+220V AT/2
R49 680 5W
" CIC 50pF
v
RK5 71,#2~
OA C6A,B 50pF
34 fl/(6
Figure 25a. Schematic diagram. (See also Figure 25b)
R3 !50 2W
R2 680 5W
AO
C28,C 50pF
R235 !OM
R4 680 5W
<:>OA
C3A,B,C IOO.pF
C8
R4< 18/1. 5W
650pF "50
R4~ IlK 5W
' R49 680
tg,. '"pF
I
-
RX' rt,#Z:J
~ I .,.
RX7
+Z20V Ar/2
WH-Ro-BL
5(}pF t'c ....
D• C6A,B 50pF ..
+ C2l>' 1/?F
WH•GY·BN
""'" "
Tlt/o/6 Tl,. WH-GY:...BR
RX3 D=
Tt,#H
C5A,B 50pF
F~:F RX4 TI,N-18
WH-6Y-RD .. -Jofv
l- V6 6AV5GA
~ C201
R231 .01
lOOK V9 V/0
C202 ~4J )/ ~ :f{, IMT \!..V \!..V
RZ/7 680K
'igure 25a. Schematic diagram. (See also Figure 25b)
R3 R2 R4 1,0 680 6f..0
•D =D• + CZB,C CJA,B,C 50JIF /00-JIF
WH-VT-BR
l I
V7 ~ .5965
-::t:--·.~-~
'" R23.5 /OM
R23'4 JON
ce 6S011F
RZ/8 NOK
R2>0 JOK
C222 .01
-J?OV ATS -.JOOV A rtf
WH-R0-61(
R44 "*" IBK 5W
rw-R45 IlK ,w
WH-IIN- R
V5,#6
HZ/9 12K
@:" NE-Z R22< CZI6 33K
I 4pF
"-:L RZZB
RZZI ~ !J.IM
18K 5W
t_~ RZ25 , CZ07 60.4K
·" 5651
41 2
ve
:bb't 42 @
~$f' + C20' ++;""' IOpF IOpF
R222 R223 12K 12K
CIOI R/02
I R/07 6,8K 2W
R/08 20.K /W
/00 !OK ,-. CIOO r.·(
"' =--"""' ~_/
IN:T -~R I ~-}
VIA \1 6AW8 ,.-:_ f! / 5_f05
,(. -:::s IwH-~',.....,.
.12 i 52 8K 6UR '31DR
I JWHJR·IIK
·~ RIO/ /OK
-=-
RIOO 220K IW
5
T/,*20
R2!1 1.-'K
R/0:1 lOOK
R/27 IM
R/04 220K IW.
-300V
0100
Rt05 2.2K
C/02 r 0101 6r--
R~03 C/04
R/28 Of "!:_J!lpF IM ..-["
"~7Jga
R/09 lOOK
206Fl ~L i 20m auF.-~~~---i ,lb~,.~~~~--~Hf
204R
......JIOZF /2'%
5:1 eo 9R
C2128
" ·r L ~=·~~ -r L200 22pH
v4A 5965
r! po' 8
•r C~:"f'~-,68
C215 \ 22
ee
53
R204 3M
R236 tOM
R205 560K
IS
R232 200/(
39
R206 30K
• !OSF
J04F
10/JF
L201 R213 56pH !.6K
~ R209 I.SK IW
v48 5965
t:IOSR
• •
0200 R201 ISO
0201 c:IOTR
~f
26
-300v
-4-
1.C217 047
R203 3.6K
l1c2oo -=- ,22
~70V
53 ; •
• !06R
R207 u lOSK
67 o• BL R229
105K
21 tzr,
-300v -370v
R/29 IM
Rl/0 lSK
-::
~~K .01
RI:JO IM
Rill TC/06
--300v -=-
23
5:1
/06R
.15 @ 'I WH-BR-Mt
-!-DIRECT RECORD
RECORD CURRENT
'o ccw
L:~ WH-Gr
52,31:,.
R212 2./K
~~ R2!0 1.5K /W -[16
R214 3K 9
0202• 29
0 '2 r, ~WH-OR
R?B t:w DIRECT 500 CAL
-300V n RTA 30
+220V
-:
LIOO 330pH
R/13 4.7K IW If
·;JIC/07I_ .... .01
Rl/4 2.7M
3
R/15 I.SK IW
R/26 .) tK ·er·
Rfl7 \3~ 5/0K
WH-VT-6N ~
bg INPUT
WAVEFORM
WH-Vr-SR
~ -370V
220V
R/32 R/22 360 510
R/14 2.7'M 6() t'"l
I '.) 7024 T/00
I R/12 R/26 /K !K v3
'I 6AN5 8 T0 50
R/17' R/31
Ri30 5/0K lOOK
/M C/13 .J ,0/
WH-VT-GN
XrAt R6 1$
a~ I 1M .C/15 .,r, 0 .01
,0/ '2 INPUT II
WAVEFORM
-!OOV -3TOV -300V -J'OOV
--------------------------------------------------------------------------------------------'44
R212 2./K
t
l9 ~r,
WH-OR
DIRECT CAL
V511 5965
• $2
• $2 .JtHR 119 ARM
' S2-Ji8R ~IJJ6
.JO/F
WH-GY $2
3/<IF
J13F
cw R/1 '25K WH-VT-6L » (l 8X ,-, J4 J~
R233 '! C7' '~' @INTERP@ 3K 'I'.oaD' FM RECORD
26 -= @J5
WH-VT- R
-370V
V58 5965
INTERP CAL
26
R215 !OK IW
1188 /K
'RBA 100
VII N£-2
LEGEND FOR 51 a 52
METER FUNCTION
INTERPOL~N DIRECT
/_.6 1 .a~ LINE ~ I.O LINE
CAL·~ 'jsl 1
1~tL ,I O 1.~.4
INTERPOLATION OFFSET FREQUENCY
R/2 R/4 !41' 2!14 $/
lhHa
I.!IKHI 150KHZ
I!IOH~ I,!IMHa
R22 1123 300 150
WH-Vr
Figure 25b. Schematic diagram. (See also Figure 25a.)
37

r-----<~R/0 ARM
Figure 26. Switching diagram for Type 1142-A Frequency Meter and Discrimnator.

ATLANTA 404 633-6183 "BOSTON 617 646-0500
BRIDGEPORT 203 377-0165 "CHICAGO 312 992-0800 CLEVELAND 216 886-0150 COCOA BEACH 800 241-5122
"DALLAS 214 637-2240 DAYTON 513 434-6979
AUSTRALIA W~<b~>rton FrankllndL>st<i"'
Pry. Ltd. Sydney, Melbourne, Brisbane, Adelaod&
CANADA-•Gene<el Radio Canada Limited
Toronto, Montreal, Ottawa
DEMOCRATIC REPUBLIC OF THE CONGO ~~!o.:.."o~kDesco Co., Inc
HONG KONG end MACAU Gilman &Co., Ud HongKong,B.C.C
INDIA MotwanePrlvenoLomoted Bombay,Calcutta,Lucknow, Kanpur, New Delhi, Bangalore,Madres
JAPAN Modo<lveEiectricCo, Ltd. Tokyo
KOREA M·Cinte<natoonel SanF<encioco, Seoul, Korea
MALAYSIA end SINGAPORE V&n9Ua<dComp.,ny KL>alaLL>mpL>r,Melevsoe
MEXICO F<edinS.A Me~lco,O.F.
W.&K.McLotenLomited Auckland
PAKISTAN ~~~~~~~ Con>o<et1on
PHILIPPINES T.J.Wolff&Companv Meketo,Rizel
PORTUGAL end SPAIN Ad. AL><iem~,lnc NewVo<k, Madrid,Losbon
GENERAL RADIO WEST CONCORD, MASSACHUSETTS 01781
617 369-4400
SALES AND SERVICE
DENVER DETROIT GREENSBORO HARTFORD HOUSTON
303 447-9225 313 261-1750 919 288-4316 203658-2496 713464-5112
HUNTSVILLE 800241-5122 INDIANAPOLIS 317 636-3907
'"LOS ANGELES 213 469-6201 "NEW YORK (NY) 212 964-2722
(NJ) 201 943-3140
INTERNATIONAL DIVISION
ROCHESTER 315 394-2037 PHILADELPHIA 215 646-8030 SAN DIEGO 714 232-2727
'"SAN FRANCISCO 415 948-8233 SEATTLE 206 G L4- 7545 SYRACUSE 315 454-9323
'"WASHINGTON, BALTIMORE 301 946-1600
WEST CONCORD, MASSACHUSETTS 01781, USA
REPUBLIC OF SOUTH AFRICA
*GENERAL RADIO COMPA~Y (OVERSEAS) G. H. Langler&Co, Ltd Johannesburg
SOUTH end CENTRAL AMERICA ~~w Ayu~;:ma, Inc
G. ~~on Radio Company
Bangkok
TURKEY Meve11En11ineerinii.Tradlng lsta~':.~11ndL>St<iel Corporation
AUSTRIA ~:~~ tng Peter Marchetti
BELGIUM G,oenpoi·Bel9oques A B<uxelles
EIRE GeneraiFiadooCompany
(Overseas) General RadooCompanv
(UK.) Limited
FINLAND lntoO/V Halsonko
•Repalrservtcesereavailableattheseoffices.
Helenastrasse 3, CH-8034. Zi.lroch 34. Swotzerland
FRANCE Gene<al R~dio France Parls,Lvon
GERMANY General FladooGmbH Miinct.en NorddeutscheVert<&tung ~~d';g NU .. Ieon
GREECE ~:~~~. Oalle111110
ITALY lng.S & Dr Gt11doBelotto Molano, Genova,
Ftoma, Napolo
NETHERLANDS ~~:;:.~!~'oep VerkooP
NORWAY ~~~tavA.FIIngA/S
SWEDEN ~:~~: Johan La9"rcrenu KB
SWITZERLAND Sevfler &Co AG ZUroch
UNITED KINGDOM *General Radio Company
IU.K.l Limited BOU<ni!End,
Buckinghamshore
YUGOSLAVIA Sanlo<ddOlBrun Wien,cineueoch
PRINTED IN U.S.A,