"frequency of occurence of phonemes in american spanish"
TRANSCRIPT
Document généré le 12 fév. 2018 01:47
Revue québécoise de linguistique
Frequency of Occurence of Phonemes in AmericanSpanish
Miguelina Guirao et María A. García Jurado
La phonétiqueVolume 19, numéro 2, 1990
URI : id.erudit.org/iderudit/602680arDOI : 10.7202/602680ar
Aller au sommaire du numéro
Éditeur(s)
Université du Québec à Montréal
ISSN 0710-0167 (imprimé)
1705-4591 (numérique)
Découvrir la revue
Citer cet article
Guirao, M. & García Jurado, M. (1990). Frequency ofOccurence of Phonemes in American Spanish. Revuequébécoise de linguistique, 19(2), 135–149.doi:10.7202/602680ar
Ce document est protégé par la loi sur le droit d'auteur. L'utilisation des servicesd'Érudit (y compris la reproduction) est assujettie à sa politique d'utilisation que vouspouvez consulter en ligne. [https://apropos.erudit.org/fr/usagers/politique-dutilisation/]
Cet article est diffusé et préservé par Érudit.
Érudit est un consortium interuniversitaire sans but lucratif composé de l’Universitéde Montréal, l’Université Laval et l’Université du Québec à Montréal. Il a pourmission la promotion et la valorisation de la recherche. www.erudit.org
Tous droits réservés © Université du Québec à Montréal,1990

FREQUENCY OF OCCURRENCE OF PHONEMES IN AMERICAN SPANISH*
Miguelina Guirao and Maria A. Garcia Jurado
This work is part of a more extensive computer-aided statistical analysis of Spanish phonological units now in progress.
The main purpose of this paper was to enlarge our knowledge in the frequency and distribution of Spanish phonemes counted in isolation as well as in syllable and word position. Our interest was also centered on the distribution of phonemes according to their articulatory configurations.
Another purpose was to provide a basic phoneme inventory to researchers working in the field of Automatic Speech Recognition Systems. The material could also be useful for cross-language phonological comparisons and for the teaching of the Spanish language.
In particular we examined five different statistics of phoneme frequency distribution: 1) single phonemes, 2) distribution in the most frequent syllables, 3) in syllables of initial and final positions, 4) distribution according to articulatory classes, 5) distribution according to the occurrences of manner of articulation as well as whether in initial or final word position.
Most of the statistical work presented in the past is based in the Peninsular Spanish phonological system. It is known that in the Latin American, as well as in other non-Castilian pronunciations, the sounds of 10/ (spelled z) and /s/ (spelled s and c) do not have a phonological distinction. The same is true with the pair /X j / spelled // and y, that have only one pnoneme for both type of words. For this reason, and because we counted two different vowels per each diphthong, our
Wc are particularly indebted to Carlos R. Luis and Guillermo A. Toledo for their collaboration in the phonetic transcription of the speech material, and to Jorge L. Brischetto for his technical assistance with the computer programs.
136 MIGUELINA GUIRAO et MARIA A. GARCÎA JURADO
system consisted of 22 phonemes (17 consonants and 5 vowels). Alarcos Llorach (1961) adopted 24 phonemes (19 consonants and 5 vowels), transcribed by 25 informal letters. He also counted the five archiphonemes /N/, /R/, /B/JD/ and /G/ separately.
In the classic work of Navarro Tomâs (1946) 42 elements are listed, including 14 diphthongs and 4 triphthongs, that he considered monophonemes. In turn, a sample of 5000 Spanish sounds previously transcribed by Navarro Tomâs (1926) was used by Zipf and Roger (1939), who compared phoneme frequencies in four Romance Languages and Classic Latin. A similar work was performed by Delattre (1965), who examined phoneme frequencies in four languages. He selected small oral samples (the number of items is not specified) that were expressed in casual and colloquial style. An extensive corpus of 70755 words used by Lloyd and Schnitzer (1967) is not included in our comparison because their text was taken from dictionaries. Quilis and Esgueva (1980) adopted the same transcription used by Alarcos Llorach to count 160000 phonemes. They tape recorded conversational speech of 16 talkers, half men and half women, between the ages of 18 and 65 years, spanning four generations.
A few other surveys provide quantitative data on American Spanish phoneme statistics. Tato et al. (1949) presented an inventory of 45952 elements counted from 10000 words. Since they adopted 23 symbols and did not use a phonetic transcription, their data could only be approximately compared with ours. A comparison is also difficult with the results of Saporta (1955) who worked with a single Mexican informant and adopted a peninsular Spanish transcription. Guirao and Borzone de Manrique (1972) analysed, with computer assistance, a total of 62980 phonemes distributed in 14577 words. In their inventory frequencies of syllables, syllabic types and words were also calculated. Samples were taken from tape recorded informal TV dialogues, newspaper notes and passages of modern plays. In the present study, since we added distributional aspects of phoneme statistics, the size was 2.6 bigger than in the 1972 paper.
Speech material Our corpus was drawn from five modern plays written by contemporary
authors: Roberto Cossa Tor siempre alegre", Ricardo Taleisnik "La fiaca", Carlos Gorostiza "El puente", "El pan de la locura" and "Los prôjimos". Because of their
FREQUENCY OF OCCURENCE 137
everyday life consersational style and the spontaneity of expression the material was considered sufficienUy representative of the average Spanish American talker. The total transcribed phonemic units altogether summated 163861 phonemes, 74460 syllables and 43306 words. Specific computer programs were devised to be used for the analysis.
Since Spanish orthography is largely phonetic, a relativately simple phonemic transcription was adopted so that we could use the minimum number of symbols without introducing ambiguity in the identification of each one of the sounds. As seen in Table 1, all but four phonemes ft (spelled y and II), (ch) /x/ (j) and /ji/ (fl) are represented with orthographic symbols. Allophonic variants are described by Guirao and Borzone de Manrique (1972). Three trained phoneticians were in charge of the phonemic transcription. They also marked in the text the boundaries between phonological syllables and between words according to the norms of the language.
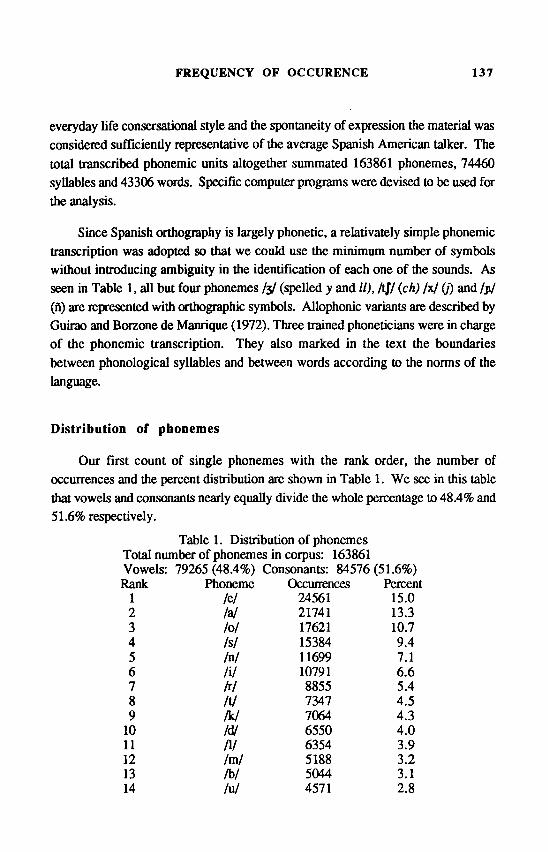
Distribution of phonemes Our first count of single phonemes with the rank order, the number of
occurrences and the percent distribution are shown in Table 1. We see in this table that vowels and consonants nearly equally divide the whole percentage to 48.4% and 51.6% respectively.
Table 1. Distribution of phonemes Total number of phonemes in corpus: 163861 Vowels: 79265(48.4%) Consonants: 84576(51.6%) Rank Phoneme Occurrences Percent
1 /e/ 24561 15.0 2 /a/ 21741 13.3 3 loi 17621 10.7 4 Is/ 15384 9.4 5 M 11699 7.1 6 HI 10791 6.6 7 M 8855 5.4 8 N 7347 4.5 9 M 7064 4.3
10 I'M 6550 4.0 11 N 6354 3.9 12 /ml 5188 3.2 13 Ibl 5044 3.1 14 lui 4571 2.8
13 8 MIGUELINA GUIRAO et MARIA A. GARCIA JURADO
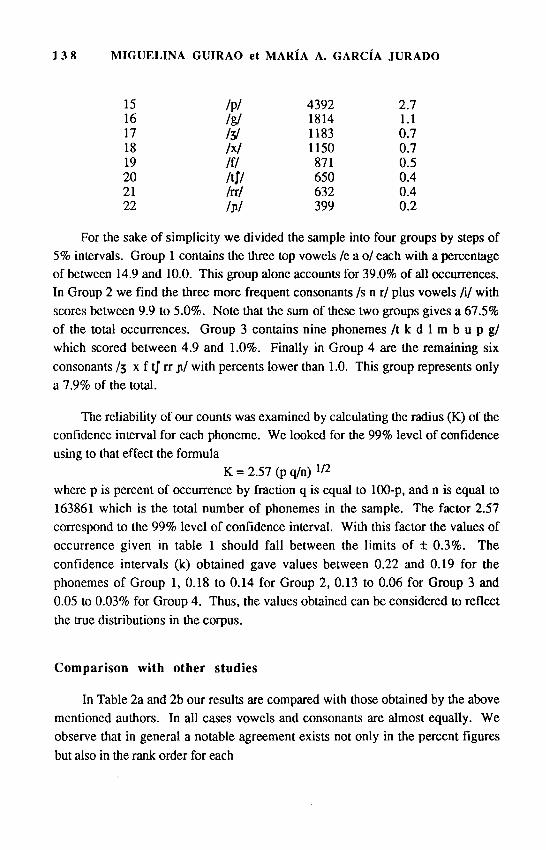
15 /p/ 4392 2.7 16 Igl 1814 1.1 17 Izl 1183 0.7 18 M 1150 0.7 19 /f/ 871 0.5 20 Ml 650 0.4 21 /rr/ 632 0.4 22 / j i / 399 0.2
For the sake of simplicity we divided the sample into four groups by steps of 5% intervals. Group 1 contains the three top vowels /e a o/ each with a percentage of between 14.9 and 10.0. This group alone accounts for 39.0% of all occurrences. In Group 2 we find the three more frequent consonants /s n r/ plus vowels li/ with scores between 9.9 to 5.0%. Note that the sum of these two groups gives a 67.5% of the total occurrences. Group 3 contains nine phonemes /t k d 1 m b u p g/ which scored between 4.9 and 1.0%. Finally in Group 4 are the remaining six consonants /3 x f tj rr ji/ with percents lower than 1.0. This group represents only a 7.9% of the total.
The reliability of our counts was examined by calculating the radius (K) of the confidence interval for each phoneme. We looked for the 99% level of confidence using to that effect the formula
K = 2.57 (p q/n) ^ where p is percent of occurrence by fraction q is equal to 100-p, and n is equal to 163861 which is the total number of phonemes in the sample. The factor 2.57 correspond to the 99% level of confidence interval. With this factor the values of occurrence given in table 1 should fall between the limits of ± 0.3%. The confidence intervals (k) obtained gave values between 0.22 and 0.19 for the phonemes of Group 1, 0.18 to 0.14 for Group 2, 0.13 to 0.06 for Group 3 and 0.05 to 0.03% for Group 4. Thus, the values obtained can be considered to reflect the true distributions in the corpus.
Comparison with other studies In Table 2a and 2b our results are compared with those obtained by the above
mentioned authors. In all cases vowels and consonants are almost equally. We observe that in general a notable agreement exists not only in the percent figures but also in the rank order for each
FREQUENCY OF OCCURENCE 139
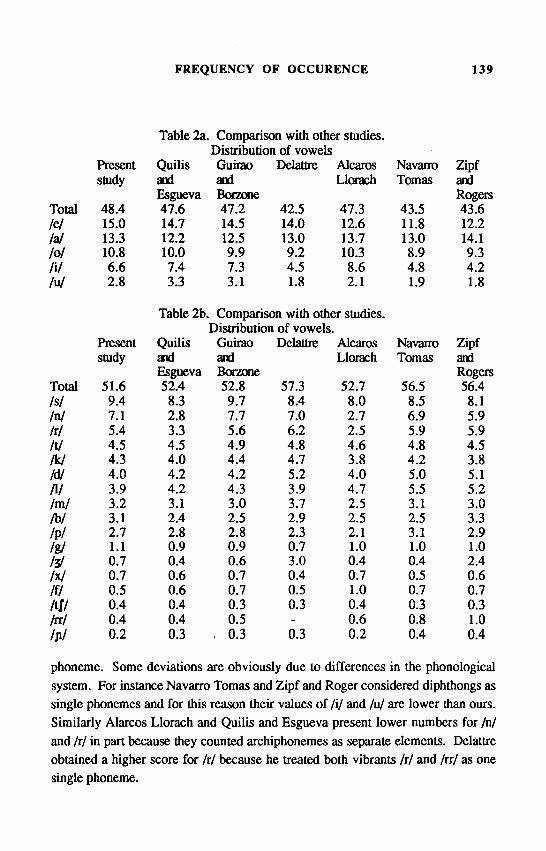
Table 2a. Comparison with other studies. Distribution of vowels
Present Quilis Guirao Delattre Alcaros Navarro Zipf study and and Llorach Tomas and
Esgueva Borzone Rogers Total 48.4 47.6 47.2 42.5 47.3 43.5 43.6 /e/ 15.0 14.7 14.5 14.0 12.6 11.8 12.2 /a/ 13.3 12.2 12.5 13.0 13.7 13.0 14.1 loi 10.8 10.0 9.9 9.2 10.3 8.9 9.3 N 6.6 7.4 7.3 4.5 8.6 4.8 4.2 M 2.8 3.3 3.1 1.8 2.1 1.9 1.8
Table 2b. Comparison with other studies. Distribution of vowels.
Present Quilis Guirao Delattre Alcaros Navarro Zipf study and and Llorach Tomas and study
Esgueva Borzone Rogers Total 51.6 52.4 52.8 57.3 52.7 56.5 56.4 Is/ 9.4 8.3 9.7 8.4 8.0 8.5 8.1 M 7.1 2.8 7.7 7.0 2.7 6.9 5.9 in 5.4 3.3 5.6 6.2 2.5 5.9 5.9 N 4.5 4.5 4.9 4.8 4.6 4.8 4.5 M 4.3 4.0 4.4 4.7 3.8 4.2 3.8 Idl 4.0 4.2 4.2 5.2 4.0 5.0 5.1 III 3.9 4.2 4.3 3.9 4.7 5.5 5.2 Iml 3.2 3.1 3.0 3.7 2.5 3.1 3.0 fbl 3.1 2.4 2.5 2.9 2.5 2.5 3.3 Ipl 2.7 2.8 2.8 2.3 2.1 3.1 2.9 is/ 1.1 0.9 0.9 0.7 1.0 1.0 1.0 111 0.7 0.4 0.6 3.0 0.4 0.4 2.4 M 0.7 0.6 0.7 0.4 0.7 0.5 0.6 HI 0.5 0.6 0.7 0.5 1.0 0.7 0.7 Ml 0.4 0.4 0.3 0.3 0.4 0.3 0.3 M 0.4 0.4 0.5 - 0.6 0.8 1.0 Ipl 0.2 0.3 . 0.3 0.3 0.2 0.4 0.4 phoneme. Some deviations are obviously due to differences in the phonological system. For instance Navarro Tomas and Zipf and Roger considered diphthongs as single phonemes and for this reason their values of I'll and lui are lower than ours. Similarly Alarcos Llorach and Quilis and Esgueva present lower numbers for /n/ and IT/ in part because they counted archiphonemes as separate elements. Delattre obtained a higher score for /r/ because he treated both vibrants /r/ and /rr/ as one single phoneme.
140 MIGUELINA GUIRAO et MARIA A. GARCIA JURADO
In the same way the peninsular Spanish phonemes 10/ should be discounted from our percent for /s/ and /X/ from our /s/. The figures obtained by the various authors were Navarro Tomas 0.60 and 2.23 for 101 and /X/ respectively, Zipf and Roger 1.74 and 0.60, Alarcos Llorach 1.70 and 0.50, Delattre 1.42 and 0.47 and Quilis and Esgueva 1.45 and 0.38%.
We note in Table 2a a slight discrepancy in the vowel /a/ and /e/ which Quilis and Esgueva attributed to differences between written and oral language. However we found a systematic predominance of vowel /e/ in our text as well as in the oral samples selected by Quilis and Esgueva and Delattre. Vowel /e/ is also the first phoneme in the count of Guirao and Borzone where both styles were combined.
As for the size of the corpus it seems that the samples could still be considerably decreased before we notice a substantial modification in the results. See for instance that the quantity of peninsular Spanish speech material collected by the various authors was wedely different. The agreement is still very close with the Spanish American count by Guirao and Borzone in spite of the fact that the sample was much smaller than ours.
On the other hand, as reported by Quilis and Esgueva, significant differences were not found neither between talkers of different generations nor between men and women.
Finally, it must be noted that these high correlations were obtained in spite of the difference in literary and conversational styles with the consequent variations in vocabulary. Given the consistency of these findings, we have reason to believe that the frequency of occurrence of phonemes seems to be a fonction of the internal structure of the Spanish language.
Distribution of phonemes in syllables An interesting point was to examine to what extent the predominance of
certain phonemes could result from a small number of syllables which also have a high incidence (Guirao and Garcia Jurado, 1987). In this instance we calculated the percent frequency of the phonemes that occurred in the first 27 different syllables, the list is presented in Table 3a and the results in Table 3b.
FREQUENCY OF OCCURENCE 141
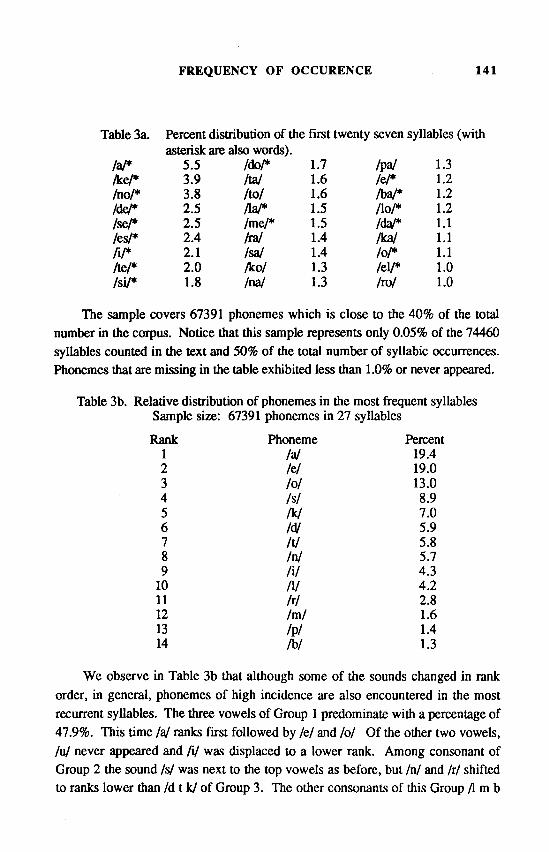
Table 3a. Percent distribution of the first twenty seven syllables (with asterisk are also words).
/a/* 5.5 /do/* 1.7 /pa/ 1.3 W* 3.9 /ta/ 1.6 /e/* 1.2 /no/* 3.8 Ao/ 1.6 A>a/* 1.2 /de/* 2.5 Aa/* 1.5 Ao/* 1.2 /se/* 2.5 /me/* 1.5 /da/* 1.1 /es/* 2.4 frai 1.4 /ka/ 1.1 A/* 2.1 /sa/ 1.4 M* 1.1 Ae/* 2.0 /ko/ 1.3 /eV* 1.0 /si/* 1.8 /na/ 1.3 /TO/ 1.0
The sample covers 67391 phonemes which is close to the 40% of the total number in the corpus. Notice that this sample represents only 0.05% of the 74460 syllables counted in the text and 50% of the total number of syllabic occurrences. Phonemes that are missing in the table exhibited less than 1.0% or never appeared.
Table 3b. Relative distribution of phonemes in the most frequent syllables Sample size: 67391 phonemes in 27 syllables Rank Phoneme Percent
1 N 19.4 2 M 19.0 3 loi 13.0 4 Is/ 8.9 5 N 7.0 6 161 5.9 7 III 5.8 8 AV 5.7 9 N 4.3
10 IM 4.2 11 in 2.8 12 Iml 1.6 13 ivl 1.4 14 AV 1.3
We observe in Table 3b that although some of the sounds changed in rank order, in general, phonemes of high incidence are also encountered in the most recurrent syllables. The three vowels of Group 1 predominate with a percentage of 47.9%. This time /a/ ranks first followed by /e/ and loi Of the other two vowels, /u/ never appeared and /i/ was displaced to a lower rank. Among consonant of Group 2 the sound Is/ was next to the top vowels as before, but /n/ and /r/ shifted to ranks lower than /d t k/ of Group 3. The other consonants of this Group fl m b
142 MIGUELINA GUIRAO et MARIA A. GARCIA JURADO
p/ kept in a similar ranking order as in table 1. The sound Igl and consonants of Group 4 are not registered as components of the most frequent syllables.
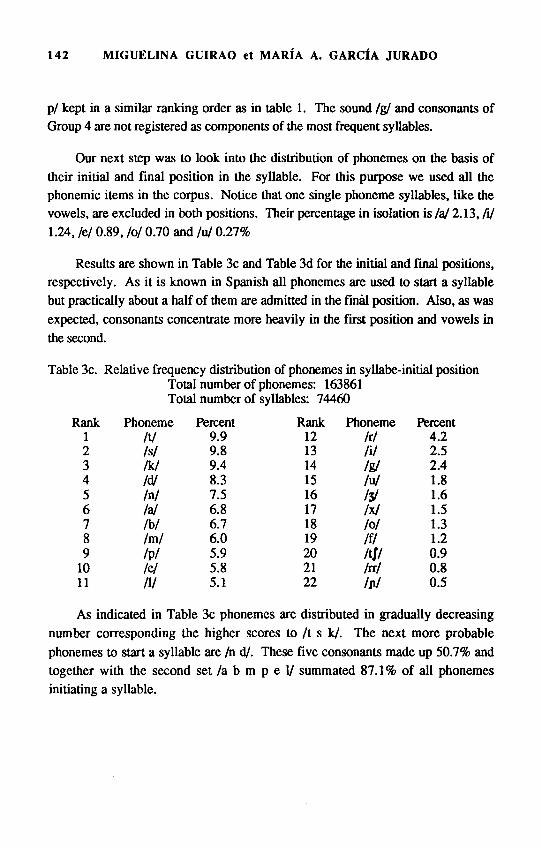
Our next step was to look into the distribution of phonemes on the basis of their initial and final position in the syllable. For this purpose we used all the phonemic items in the corpus. Notice that one single phoneme syllables, like the vowels, are excluded in both positions. Their percentage in isolation is la/ 2.13, fil 1.24, /e/ 0.89, loi 0.70 and /u/ 0.27%
Results are shown in Table 3c and Table 3d for the initial and final positions, respectively. As it is known in Spanish all phonemes are used to start a syllable but practically about a half of them are admitted in the final position. Also, as was expected, consonants concentrate more heavily in the first position and vowels in the second. Table 3c. Relative frequency distribution of phonemes in syllabe-initial position
Total number of phonemes: 163861 Total number of syllables: 74460
Rank Phoneme Percent Rank Phoneme Percent 1 N 9.9 12 M 4.2 2 M 9.8 13 N 2.5 3 Ikl 9.4 14 Isl 2.4 4 AV 8.3 15 M 1.8 5 M 7.5 16 1.6 6 /a/ 6.8 17 M 1.5 7 /b/ 6.7 18 loi 1.3 8 /m/ 6.0 19 m 1.2 9 /P/ 5.9 20 Ml 0.9
10 /e/ 5.8 21 M 0.8 11 N 5.1 22 0.5 As indicated in Table 3c phonemes are distributed in gradually decreasing
number corresponding the higher scores to /t s k/. The next more probable phonemes to start a syllable are /n d/. These five consonants made up 50.7% and together with the second set /a b m p e 1/ summated 87.1% of all phonemes initiating a syllable.
FREQUENCY OF OCCURENCE 143
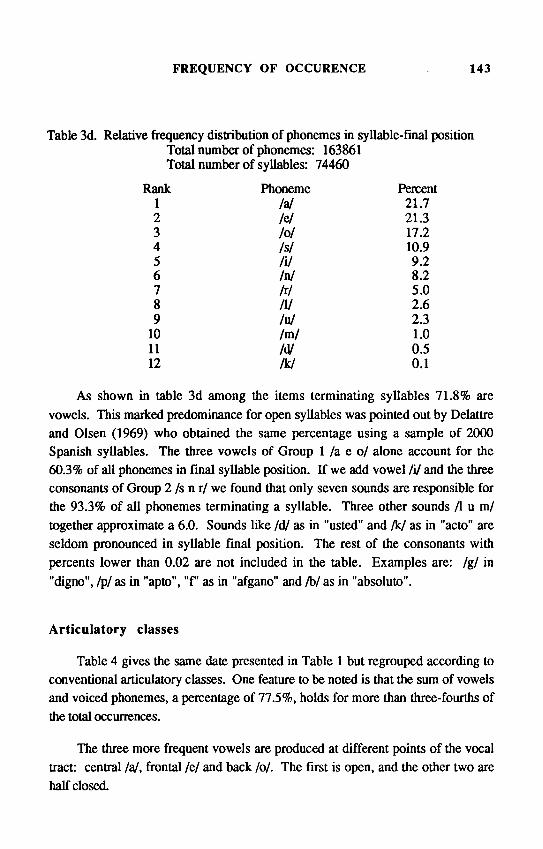
Table 3d. Relative frequency distribution of phonemes in syllable-final position Total number of phonemes: 163861 Total number of syllables: 74460
Rank Phoneme Percent 1 /a/ 21.7 2 /e/ 21.3 3 loi 17.2 4 Isl 10.9 5 HI 9.2 6 hi 8.2 7 HI 5.0 8 HI 2.6 9 M 2.3
10 /ml 1.0 11 Ml 0.5 12 M 0.1
As shown in table 3d among the items terminating syllables 71.8% are vowels. This marked predominance for open syllables was pointed out by Delattre and Olsen (1969) who obtained the same percentage using a sample of 2000 Spanish syllables. The three vowels of Group 1 /a e o/ alone account for the 60.3% of all phonemes in final syllable position. If we add vowel /i/ and the three consonants of Group 2 / s n r / we found that only seven sounds are responsible for the 93.3% of all phonemes terminating a syllable. Three other sounds /l u m/ together approximate a 6.0. Sounds like /d/ as in "usted" and /k/ as in "acto" are seldom pronounced in syllable final position. The rest of the consonants with percents lower than 0.02 are not included in the table. Examples are: /g/ in "digno", /p/ as in "apto", "F as in "afgano" and /b/ as in "absoluto".
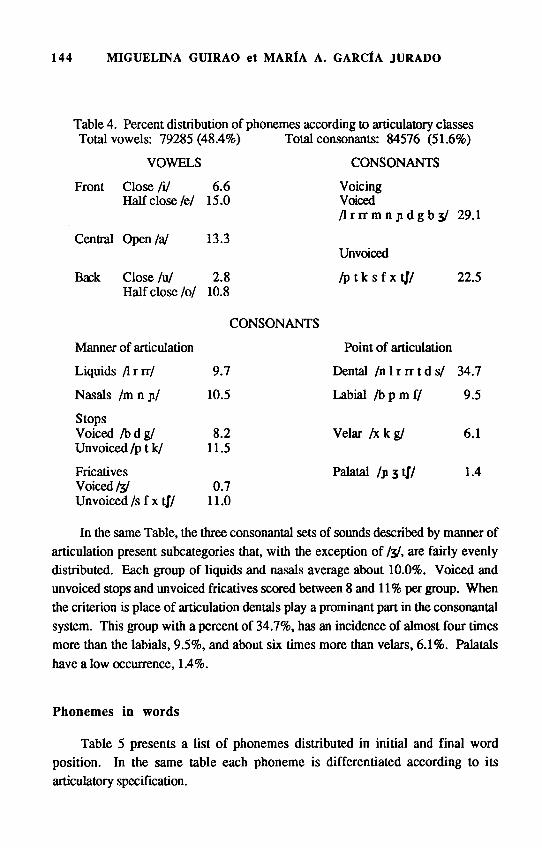
Articulatory classes Table 4 gives the same date presented in Table 1 but regrouped according to
conventional articulatory classes. One feature to be noted is that the sum of vowels and voiced phonemes, a percentage of 77.5%, holds for more than three-fourths of the total occurrences.
The three more frequent vowels are produced at different points of the vocal tract: central /a/, frontal /e/ and back /o/. The first is open, and the other two are half closed.
144 MIGUELINA GUIRAO et MARIA A. G ARC* A JURADO
Table 4. Percent distribution of phonemes according to articulatory classes Total consonants: 84576 (51.6%) Total vowels: 79285 (48.4%)
VOWELS Front Close HI 6.6
Half close/e/ 15.0
Central Open/a/ 13.3 Back Close /u/ 2.8
Half close/o/ 10.8
CONSONANTS Manner of articulation Liquids / l r rr / 9.7 Nasals /m n ji/ 10.5 Stops Voiced lb Agi 8.2 Unvoiced/ptk/ 11.5 Fricatives Voiced Isl 0.7 Unvoiced /sf x t / / 11.0
CONSONANTS Voicing Voiced / l r r r m n j i d g b 3 / 29.1
Unvoiced /p t k s f x t// 22.5
Point of articulation Dental / n l r r r t d s / 34.7 Labial /bpmf / 9.5
Velar /x k g/
Palatal /ji 31//
6.1
1.4
In the same Table, the three consonantal sets of sounds described by manner of articulation present subcategories that, with the exception of /3/, are fairly evenly distributed. Each group of liquids and nasals average about 10.0%. Voiced and unvoiced stops and unvoiced fricatives scored between 8 and 11% per group. When the criterion is place of articulation dentals play a prominant part in the consonantal system. This group with a percent of 34.7%, has an incidence of almost four times more than the labials, 9.5%, and about six times more than velars, 6.1%. Palatals have a low occurrence, 1.4%.
Phonemes in words Table 5 presents a list of phonemes distributed in initial and final word
position. In the same table each phoneme is differentiated according to its articulatory specification.

FREQUENCY OF OCCURENCE 145
Table 5. Percent distribution of each phoneme by articulatory configurations and by word position
Total phonemes: 163861 Total words: 43306 Phoneme classes Position in the word
Initial Final VOWELS Front close HI 3.7 7.2 Front half close /e/ 9.9 21.7 Central open /a/ 9.9 19.8 Backclose lu/ 3.0 0.3 Back half close /o/ 1.4 21.5 CONSONANTS HI 7.0 3.0 Liquids fr/ 6.1 M 0.9
/m/ 6.1 Nasals /n/ 6.7 6.6
/ji/ 0.1 lb/ 6.0
Voiced stops 161 6.2 0.8 Igl 1.0 IVI 7.4 Unvoiced stops III 5.8 /kl 12.6
Voiced fricatives /•$/ 1.8 Is/ 8.0 13.0 If I 1.4
Unvoiced fricatives /x/ 0.7 Ml 0.5 In examining this table it should be kept in mind that figures represent
subtotals of the grand total which include internal occurrences. Also, the five vowels, which in isolation form words by themselves, are excluded from this list.
As it was expected, in general consonants have a high predominance at the onset of the words while vowels have the opposite tendency. Exceptions are lui and /s/. Vowel lui seldom appears as a final word sound. The fricative /§/, which makes most of the plural Spanish words, gives the higher score at the final position. Still it appears in both margins with a relativately high rank. In fact, as
146 MIGUELINA GUIRAO et MARIA A. GARCfA JURADO
a first component with 8.0%, it is next to the unvoiced stop /k/, which in turn with a percent of 12.6%, is the most probable phoneme for starting a word. This figure duplicates the incidence of the other two unvoiced stops /t/ and /p/. Both are articulated in the initial position as often as their voiced counterparts /d/ and /b/. Likewise, nasals /m n/ and the liquid lateral III averaged between 6.0 and 7.0%. Of the other two liquids /rr/ is quite infrequent (0.9%) and single vibrant M never takes the initial position. Fricatives /3 f x tj/ appeared with very low incidence, between 0.5% and 1.8%, and the unvoiced stop /g/ ranked only around 1.0%.
In words starting with vowels, central open /a/ and frontal half closed /e/, each with an average of 10.0%, are three times more frequent than front closed /i/ and back closed /u/. Back half closed /o/ (14.0%) is the least numerous in an initial position. Instead this vowel had an average of 21.0% in the final position, the same as /a/ and /e/ which together cover 62.0% of all phonemes located at the end of words. Vowel /i/ follows with 7.0% while /u/ seldom is produced to terminate words.
As for consonantal sounds in a final position, due to the phonological rules of the system, only four phonemes have a significant number of occurrences. The fricative sound /s/ close to 13.0% outnumbers the vibrant /r/ and nasal /n/ in a proportion of almost 2 to 1. The same proportion holds between these two sounds and lateral / l / . Voiced stop /d/ seldom appears in this position though it occurs in carefully pronounced words as in "alud". Phonemes with scores lower than 0.03% are not included in this table. Example of those cases are nasal /m/ as in "album"; the fricatives /f/ and /x/ as in the interjections "uf ' and "puaj"; and the stops /k b t/ which appear in names as in "Isaac", or in borrowed words as in "club" from the English and "complot" from the French language.
In comparing the data in Table 3c and 3d with those in Table 5, we first observe that results are consistent with our phonological expectations. It is clear that there is less uncertainty about the termination of a syllable, or word, than about its onset. In fact, the end of both segmental units is marked by vowels 70.0%, voiced consonants /r 1 n/ 16.0% and fricative /s/ nearly 12.0%. These phonemes maintain approximately the same rank order whether syllables are counted as a part or outside of the words.
The situation is different when items are marking the onset of segmental units. A phoneme may score quite differently whether or not the syllable is
FREQUENCY OF OCCURENCE 147
initiating a word. For example in syllables that start words vowel /a/ ranked second and /e/ third but when syllabic segments were counted alone the same vowels scored tenth and sixth respectively (Table c). Conversely the stop /t/, the most probable phoneme to initiate a syllable, changed to rank order number 11 when the syllable is initiating a word. Voiced stops /b/ /d/ Igl are more likely to start a syllable than to start a word while the reverse is true with unvoiced stops /p/ and /k/. In Table 3c we see that N and /r/ are almost equally probable to initiate a syllable though lateral N is practically the only one to initiate a word since vibrant /rr/ is rather infrequent and /r/ is never placed in that position.
Only two sounds /s/ and /n/ are encountered with equal probability at any of the two margins of the syllables counted alone or in initial and final word position, though their articulatory features vary to a great extent from one position to the other. This is generally true for all sounds that mark boundaries at any of the two borders of syllables. Consonants located at the onset of phonological segments are relativately more strongly articulated and more résistent to effacement. On the contrary, sounds produced in closed syllables as apico-alveolars /l/ HI and nasal In/ are in general weakly articulated, and as a consequence these phonemes are neutralized. Similarly, fricative /s/ when closing a syllable is articulated as an aspirate [h] as in [lo*1 mih mo11] written "los mismos". In all four cases the effect is a more open articulation of the preceding vowel with the corresponding increment in its duration.
Also, the fact that 7 out of the 10 phonemes encountered in this position are vowels reflects the strong tendency of the Spanish language for the open syllables (Guirao and Garcia Jurado, 1989). Hence the phonetic vocalic character of this language could be attributed, in part, to the enhancement of vowels when placed at the boundaries between syllables.
Concluding remarks The present inventory shows that voicing is an important dimension of the
Spanish language. In fact, vowels and voiced consonants cover more than three quarters of all phoneme occurrences.
Front half closed vowel /e/, the most frequent of all items, plus open central /a/ and back half closed /o/ account for 40.0% of all phoneme occurrences.
148 MIGUELINA GUIRAO et MARIA A. GARCÎA JURADO
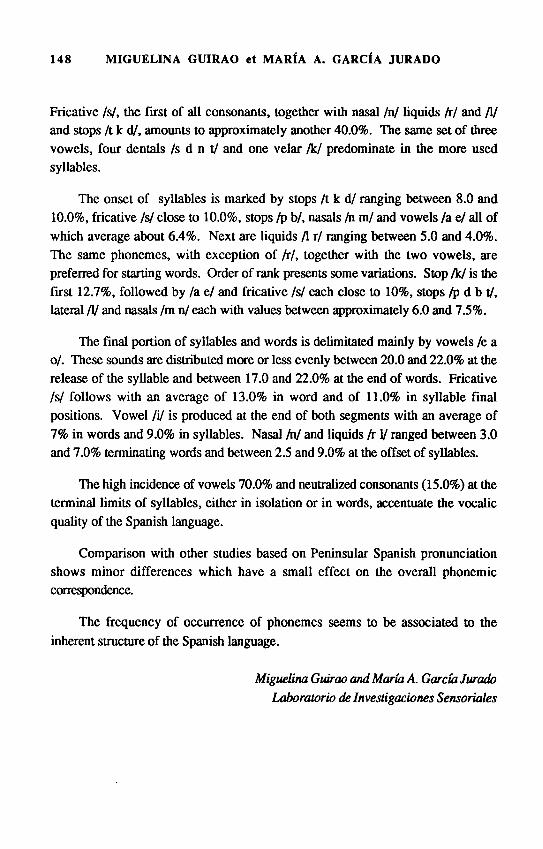
Fricative /s/, the first of all consonants, together with nasal /n/ liquids /r/ and /l/ and stops It k d/, amounts to approximately another 40.0%. The same set of three vowels, four dentals / s d n t / and one velar /k/ predominate in the more used syllables.
The onset of syllables is marked by stops /t k d/ ranging between 8.0 and 10.0%, fricative /s/ close to 10.0%, stops /p b/, nasals /n m/ and vowels /a e/ all of which average about 6.4%. Next are liquids /l r/ ranging between 5.0 and 4.0%. The same phonemes, with exception of /r/, together with the two vowels, are preferred for starting words. Order of rank presents some variations. Stop /k/ is the first 12.7%, followed by /a e/ and fricative /s/ each close to 10%, stops /p d b t/, lateral /!/ and nasals /m n/ each with values between approximately 6.0 and 7.5%.
The final portion of syllables and words is delimitated mainly by vowels /e a o/. These sounds are distributed more or less evenly between 20.0 and 22.0% at the release of the syllable and between 17.0 and 22.0% at the end of words. Fricative Is/ follows with an average of 13.0% in word and of 11.0% in syllable final positions. Vowel is produced at the end of both segments with an average of 7% in words and 9.0% in syllables. Nasal /n/ and liquids /r 1/ ranged between 3.0 and 7.0% terminating words and between 2.5 and 9.0% at the offset of syllables.
The high incidence of vowels 70.0% and neutralized consonants (15.0%) at the terminal limits of syllables, either in isolation or in words, accentuate the vocalic quality of the Spanish language.
Comparison with other studies based on Peninsular Spanish pronunciation shows minor differences which have a small effect on the overall phonemic correspondence.
The frequency of occurrence of phonemes seems to be associated to the inherent structure of the Spanish language.
Miguelina Guirao and Maria A. Garcia Jurado Laboratorio de Investigaciones Sensorials
FREQUENCY OF OCCURENCE 149
Références
ALARCOS LLORACH, E., (1961), Fonologia Espanola. Madrid, Gredos. DELATTRE, P., (1965), Comparing the phonetic features of English, German, Spanish and
French. Heidelberg: J. Groos. DELATTRE, P. and Olsen, C , (1969), Syllabic features and phonic impression in English,
German, French and Spanish. Lingua, 22: 160-175. GUIRAO, M. and Borzone de Manrique, A. M., (1972), Fonemas, silabas y palabras del
espanol de Buenos Aires. Filologia, XVI: 135-165. GUIRAO, M. and Garcia Jurado, M. A., (1987), A statistical approach to Spanish American
phonological units. Proceedings of the Xlth International Congress of Phonetic Sciences, 4, 132-135.
GUIRAO, M. and Garcia Jurado, M. A., (1989), Las silabas basicas del espanol segun sus restricciones fonotacticas. Revue de Phonétique Appliquée, no 90.
LLOYD, P. and Schnitzer, R. D., (1967), A statistical study of the structure of Spanish syllable. Linguistics, 37: 58-72.
NAVARRO TOMAS, T., (1946), Estudios de Fonologia Espanola. Syracruse, New York, University Press.
NAVARRO TOMAS, T., (1926), Manual de Pronunciacion Espanola. Madrid, Consejo Superior de Investigations Cientificas.
QUILIS, A. and Esgueva, M., (1980), Frecuencia de fonemas en el espanol hablado. Linguistic a Espanola Actual, 2: 1-25.
SAPORTA, S., (1955), Frequency of consonants clusters. Language, 31: 25-30. TATO, J. M., Llorente Sanjurjo, F., Bello, J. and Tato, J. M., (1949), Caracteristicas
acusticas de nuestro idioma. Revista Otolaringologica, 1: 17-34. ZIPF, G. K. and Rogers, F. M., (1939), Phonemes and variphones in four present-day
romance languages and classical Latin from the viewpoint of dynamic philology. Archives Néerlandaises de Phonétique Expérimentale. 15: 111-147.