from - sequent.in 12-13 ar_final.pdf · management discussion & analysis 30 corporate...
TRANSCRIPT


Forward-looking Statements
The report contains forward-looking statements that involve risks and uncertainties. When used in this discussion, the words like ‘plans’, ‘expects’, ‘anticipates’, ‘believes’, ‘intends’, ‘estimates’, or other similar expressions as they relate to Company or its business are intended to identity such forward-looking statements. Forward-looking statements are based on certain assumptions and expectations of future events. The Company’s actual results, performance or achievements could differ materially from those expressed or implied in such forward-looking statements. The Company undertakes no obligation or responsibility to publicly amend, update, modify or revise any forward-looking statements, on the basis of any new information, future event, subsequent development or otherwise.
Navigatingthis reportThe winds beneath our wings 4The dots that define us 6The year of smaller steps and larger impact 8Financial snapshots 10From the Management’s desk 12Connecting the dots 14Board of Directors’ profiles 18Our product pipeline 19Directors’ report 20Equity history 29Management discussion & analysis 30Corporate governance report 44Financial statements
Standalone 55Consolidated 82Key financial parameters & Ratios 106Key information pertaining to subsidiary companies 107Corporate information 109

The big picture doesn’t just come from distance; it also comes from time.- Simon Sinek
SeQu
ent Scien
tific Limited

One can’t connect the dots looking forward. It’s only by doing small things right, consistently that one can
achieve greater goals. At SeQuent Scientific, we have been working
harder each day to overcome the odds– be it building a robust
yet unconventional business model or creating a niche in highly
competitive segments or growing amidst constraints emanating
from internal as well as external environment. In the process of
pursuing excellence, we managed to transform the stumbling
blocks into stepping-stones.
The year 2012-13 was equally challenging. The input costs continued to increase and with the
rising competition, our margins remained under
pressure. We continued to emerge as a leaner
and efficient organisation, thereby limiting the
losses to a large extent. We focused on efficient
utilisation of our capacities and persisted with
de-bottlenecking initiatives. Additional capacities
led to addition of newer clients, which helped us
stem the tide. At the same time, our research and
development initiatives fructified into six newer
products and filing of four DMFs. We continued
to invest into development of non-infringing
processes and kept our intellectual capital intact
amidst weakened economic sentiment.
SeQ
uen
t Sc
ien
tifi
c Li
mit
ed2

It feels good when the pieces start fitting together and in the process, the big picture starts emerging. Our perseverance finally started showing signs of paying off in the
beginning of 2013-14. In April 2013, our API Drug manufacturing
facility at Mangalore received an USFDA approval. This approval
would enable us to tap the large pharmaceuticals markets and
demonstrate our strengths related to economies, quality, product
portfolio and processes to craft a new journey of value creation.
At the same time, we also decided to leverage upon our in-depth
knowledge in veterinary segment by forming a joint venture
company along with Shasun Pharmaceuticals, a leading player
in Indian API industry. The JV Company will focus on developing,
manufacturing and selling veterinary products inclusive of both API
and formulations in the global market.
Having laid a strong foundation, we remain confident and optimistic. Confident – of our vision to create
sustained value for our stakeholders and
optimistic, that the dots would connect in
the future too.
An
nu
al Rep
ort 2012-13
3
The winds beneath
SeQ
uen
t Sc
ien
tifi
c Li
mit
ed4

our wings.Our visionTo be a reliable source in the mature generic and niche molecule areas while
building a sustainable CRAMS resource for our customer.
Our MissionTo deliver quality products competitively while adhering to high quality standards
and safety of our people and our environment.
Our quality policySeQuent Scientific Limited is engaged in development & manufacture of
pharmaceuticals and specialty chemicals. Every product manufactured in our
premises shall adhere to the prescribed quality norms for the product and focused
efforts shall be taken towards continual improvement of the product and processes
involved. We shall achieve this by ensuring excellent Quality Standards in:
OUR PEOPLE
Through constant training and motivation programs to imbibe the goals and
objectives of the Company in their work
OUR INPUTS
Through strict adherence to Quality standards prescribed for the respective inputs
OUR FACILITIES
Through stringent in-house manufacturing & documentation standards complying
to cGMP and all applicable legal and regulatory requirements
An
nu
al Rep
ort 2012-13
5

The
dotsthat define us.
The figures that define us
Rs.3.14
billion operational revenues
FIvethree
manufacturing locations in
900+ employees
billion market capitalization
(as on 31.03.2013)
Indian states
Rs.3.12
SeQ
uen
t Sc
ien
tifi
c Li
mit
ed6
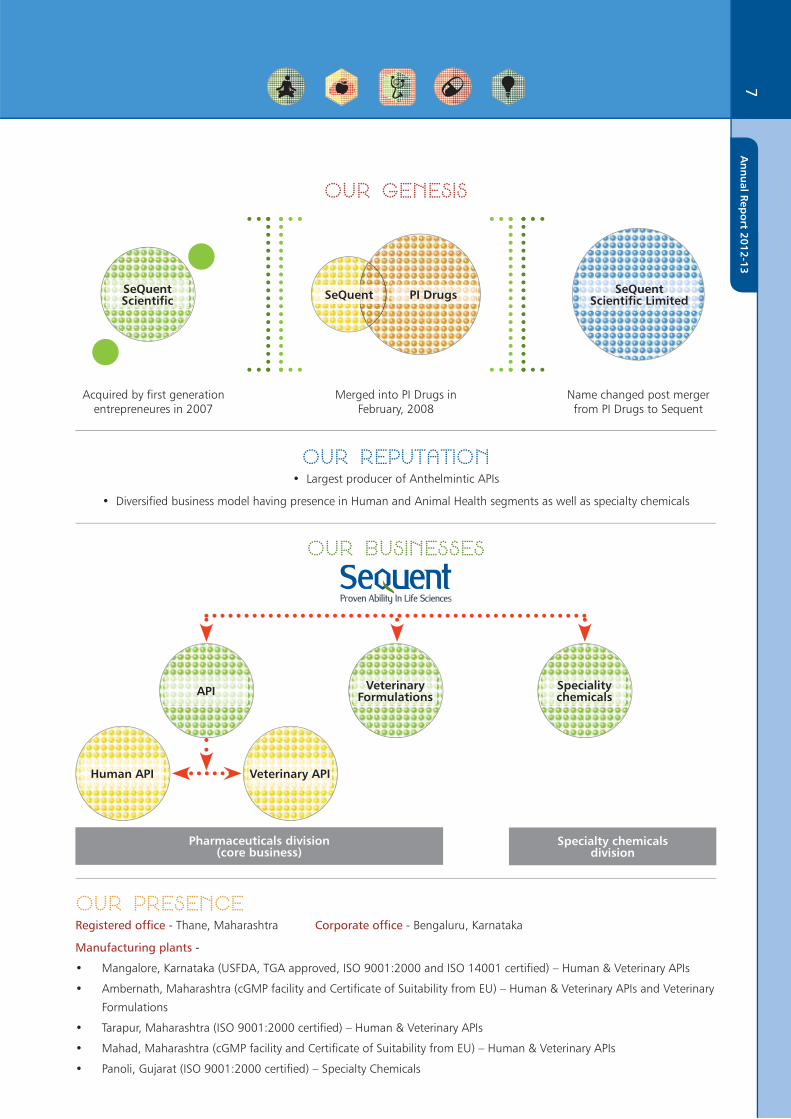
Our genesis
SeQuentScientific
Acquired by first generation entrepreneures in 2007
SeQuent PI Drugs
Merged into PI Drugs in February, 2008
SeQuentScientific Limited
Name changed post merger from PI Drugs to Sequent
Our reputation• Largest producer of Anthelmintic APIs
• Diversified business model having presence in Human and Animal Health segments as well as specialty chemicals
Our presenceRegistered office - Thane, Maharashtra Corporate office - Bengaluru, Karnataka
Manufacturing plants -
• Mangalore, Karnataka (USFDA, TGA approved, ISO 9001:2000 and ISO 14001 certified) – Human & Veterinary APIs
• Ambernath, Maharashtra (cGMP facility and Certificate of Suitability from EU) – Human & Veterinary APIs and Veterinary
Formulations
• Tarapur, Maharashtra (ISO 9001:2000 certified) – Human & Veterinary APIs
• Mahad, Maharashtra (cGMP facility and Certificate of Suitability from EU) – Human & Veterinary APIs
• Panoli, Gujarat (ISO 9001:2000 certified) – Specialty Chemicals
Our businesses
Pharmaceuticals division(core business)
Specialty chemicalsdivision
Human API Veterinary API
API Veterinary Formulations
Speciality chemicals
An
nu
al Rep
ort 2012-13
7

The year of smaller steps and larger impact
SeQ
uen
t Sc
ien
tifi
c Li
mit
ed8

Human APIs• Mangalore unit received US FDA approval; to expand
focus from lesser regulated markets to regulated ones
in the coming years
• 2nd largest in terms of divisional revenues
• Offers a wide range of large volume APIs as well as
Niche APIs and Drug intermediates
• Demonstrated range of synthetic chemistry skills
with capacity, manufacturing flexibility and quality
certifications
• R&D focused model; consistent investments has led
to increased filings
• 21 APIs under-development; 37 DMFs filed till date
• Focus on forging long term partnerships with
innovator companies
Veterinary Formulations• Forayed into the segment as a forward integration for
veterinary APIs
• Divisional revenues registered an increase of 56%
during 2012-13
• Caters to a wide product range in the Anthelmintic
category
• Exports dominated revenues
• One of the few companies in India in its product
space
• Products registered in various markets in Africa
• Building its market share in the attractive and less-
competitive Indian market
Veterinary APIs• The largest segment in the company in terms of
revenues
• Divisional revenues registered an increase of 13%
during 2012-13
• A preferred supplier to top veterinary drug
manufacturers across the globe
• Leading producer of animal Anthelmintic APIs
• Focus on creating an extensive product pipeline
• The division’s growth is not innovator-dependent
and therefore offers huge scope across regulated and
unregulated markets
Specialty chemicals• Niche operation catering to non-pharma products
• Divisional revenues registered an increase of 5%
during 2012-13
• Introduced two new products during 2012-13
• Commenced exports during 2012-13
An
nu
al Rep
ort 2012-13
9
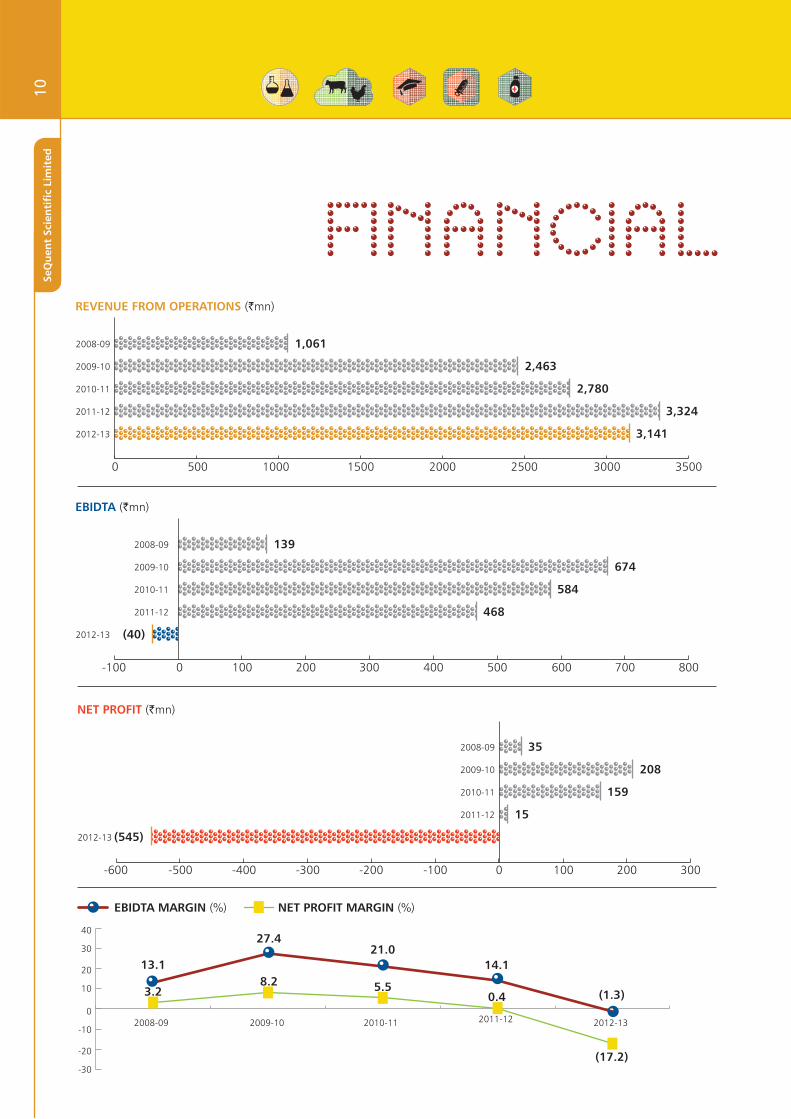
financialREVENUE FROM OPERATIONS (`mn)
3,141
3,324
2,780
2,463
1,061
0 500 1000 1500 2000 2500 3000 3500
2012-13
2011-12
2010-11
2009-10
2008-09
EBIDTA (`mn)
(40)
468
584
674
139
-100 0 100 200 300 400 500 600 700 800
2012-13
2011-12
2010-11
2009-10
2008-09
NET PROFIT (`mn)
(545)
15
159
208
35
-600 -500 -400 -300 -200 -100 0 100 200 300
2012-13
2011-12
2010-11
2009-10
2008-09
3.28.2 5.5
0.4
(17.2)
2012-132011-122010-112009-102008-09
40
0
20
-20
30
-10
10
-30
13.1
27.421.0
14.1
(1.3)
EBIDTA MARGIN (%) NET PROFIT MARGIN (%)
SeQ
uen
t Sc
ien
tifi
c Li
mit
ed10

snapshots
SEG
MEN
T-W
ISE
REV
ENU
E B
REA
K-U
P
API - VET
API - HUMAN
SPECIALITY CHEMICALS
FORMULATIONS - VET
46%
16%
8%
30%
2012-13
API - VET
API - HUMAN
SPECIALITY CHEMICALS
FORMULATIONS - VET
2011-12 38%
15%
5%
42%
GEO
GR
APH
Y-W
ISE
REV
ENU
E B
REA
K-U
P
INDIA
EUROPE
ASIA (EX-INDIA)
AFRICA
REST OF WORLD
2012-13 56%
12%
9% 2%
21%
INDIA
EUROPE
ASIA (EX-INDIA)
AFRICA
REST OF WORLD
2011-12 59%
17%
4% 4%
16%
An
nu
al Rep
ort 2012-13
11
2012-13 WAS A TOUGH YEAR
Like every tough year, it made us stronger. We strived harder to protect our margins despite rising costs. We
continued to streamline and consolidate our manufacturing processes to improve economies and efficiencies.
We continued to focus on key segments like Human APIs and Animal Health, thereby laying a foundation for
our future growth. We also continued to expand our product pipeline to newer markets – in domestic as well
as overseas countries. The impact of these initiatives will start translating to improvement in our operational
performance from the current financial year onwards.
2012-13 WAS ALSO A YEAR OF TAKING HARD DECISIONS
Like every time, we chose future gain over immediate pain. We chose a somber economic environment to critically
examine and review our existing operations. We chose to consolidate our focus, by exiting non-remunerative
markets and discontinuing low margin products. We continued to assess each investment carefully to ensure
that it adds critical value to the organisation. We also took a brave decision of creating higher provisions for our
doubtful debts, which led to an optical impact on our bottom-line. We registered a net loss of Rs. 545 million,
the largest since our inception, mainly on account of depreciating product margins and higher provisioning. We
continued to pursue our research and development initiatives, thereby further strengthening our product pipeline
to 37 DMFs.
2012-13 WAS ALSO A YEAR OF BROADENING HORIZONS
We commenced our journey as a specialty chemicals manufacturer and forayed into Animal Health on account
of acquisition. At the same time, we invested into our Human API facilities and emerged as a diversified
pharmaceuticals solutions provider with presence across the value chain. However, with each business now gained
a decent size, it was time for us to think on exploring greater value from our businesses. Being a preferred partner
to global pharmaceuticals companies, we also chose to partner our peers to this end. The seeds of thoughts planted
during 2012-13 finally bloomed into an initiative on ground, with the proposed joint venture company with Shasun
Pharmaceuticals Limited. Together, through this joint venture company, we would develop, manufacture and
sell veterinary products inclusive of both APIs and formulations in the global market and also offer a wide range
of products to both the domestic and global clients. While Shasun Pharmaceuticals would hold 27% in this JV
Company, we would hold the remaining 73%. We would progressively transfer our interests in veterinary API and
formulations to this company, thereby further strengthening our market share in the coming years.
The night is darkest before the dawn.
From the Management’s Desk
SeQ
uen
t Sc
ien
tifi
c Li
mit
ed12

able to offer our products to the regulated markets. This in turn would also lead to better profitability for the company in the
coming years. At the same time our foray to domestic formulations market has started giving encouraging results and we
are confident to build a decent share in fast growing animal health market such as India. We also believe that the input costs
have peaked in 2012-13 and going forward, we would see the margins improving across our segments of presence.
HAVING CREATED A STEADY FOUNDATION, 2013-14 WILL BE A CRUCIAL YEAR FOR US
The foundation that we strived to build over the pastseven years is now almost ready. Our deep-rooted customer
relationships, coupled with our marketing initiatives and best-in-class product quality across our segments of presence makes
us confident of shaping sustainable growth going forward. Our confidence also emanates from the ability of our employees
and is further fortified by the trust of our stakeholders – investors, bankers, clients, employees, vendors and communities in
and around our locations of presence. We would like to extend a heartfelt appreciation of your support.
Dr. Gautam Kumar Das
Joint Managing Director
2013-14 MARKS A NEW BEGINNING
Since the past three years, we at SeQuent have
awaited our US FDA approval patiently. It gives me
great pleasure to communicate that our efforts have
paid off well. In April 2013, our API manufacturing
facility at Mangalore received USFDA approval,
marking the beginning of an exciting phase for
us at SeQuent. With our ability to manufacture
niche and complex APIs coupled with our tight cost
structure and flexible capacities, we would now be
Dr. Gautam Kumar DasJoint Managing Director
An
nu
al Rep
ort 2012-13
13
Connecting the dots
From looking aheadto thinking beyond
Since our inception, we have treaded a road less travelled. Having commenced our journey as a specialty
chemicals player, we identified a huge untapped opportunity in animal health, leading to our foray into veterinary
APIs. In the past seven years, we expanded our capabilities to emerge as a diverse-yet integrated player in the
pharmaceuticals value chain – from animal health to human and from APIs to formulations and contract research.
We continued to expand our product profile to cater to extreme ends – from delivering complex molecules to
manufacturing bulk drugs.
Having developed a broad base not only enabled us to withstand cyclicality in one business but more importantly
have helped us evolve into a preferred supplier to global companies. Today, each of our business has achieved
a respected size and are attractively poised across key stages in the business cycle – from early stage (Contract
research) to growth-ready (veterinary formulations, Human APIs) to fast growing (veterinary APIs) and maturity
(specialty chemicals). This mix of businesses has enabled us to rise above short-term obstacles and stay focused on
unlocking long-term value.
SeQ
uen
t Sc
ien
tifi
c Li
mit
ed14

Connecting the dots
From scaling upto slimming down
At SeQuent, we have continued to invest into capacity expansion across our major businesses.
In the past five years, our gross block has increased by five times, reflecting our initiatives to this end. We have
continued to improve capacity utilization through cost efficient measures including de-bottlenecking and
modernizing existing capacities at incremental costs. We continued to identify non-core processes and opt for
outsourcing without compromising on the end-quality. At the same time, having instilled a strong culture of
fiduciary discipline, we have continuously focused on improving our cost structures by identifying and eliminating
wastages across processes.
With the past three years being highly demanding in terms of rising input costs and high competition driving realisations
to lower levels, we resorted to more intensive cost control measures across our units. We also consolidated our
product portfolio to exit or discontinue low margin products. We focused on research and development extensively,
thereby redesigning our processes to be more efficient and economical. All this, without impairing the quality in any
way. With the input costs peaking, we expect our margins to improve in the coming years.
An
nu
al Rep
ort 2012-13
15
Connecting the dots
From narrowing focusto widening presence
At SeQuent we believe that the pharmerging markets, led by India and China will drive the growth of
global pharmaceuticals industry in the coming years. Being an Indian company and having a manufacturing
base in India therefore have multiple implications: one, with a huge untapped consumption potential, India is
the key market for our products. And two, with the global pharmaceuticals coming to India, our capabilities
relating to products, efficiency and delivery will offer a win-win proposition in terms of partnerships. In 2012-13 we
strengthened our market share in domestic animal health formulations space.
In 2013-14, our Mangalore facility was approved by USFDA. This will enable us to market our Human APIs in highly
profitable regulated markets. At the same time, we have also started our foray into USA, a large market for our
veterinary APIs too. We would supply a few niche products to this market besides tapping Europe, another key
market for this product segment. During 2012-13, our specialty chemicals division also commenced exports to
several countries.
SeQ
uen
t Sc
ien
tifi
c Li
mit
ed16

Connecting the dots
From creating possibilities to delivering value
At SeQuent, we have always sustained our passion for innovation and value addition. Owing to our
investments in state-of-the-art R&D facilities across two locations – Mangalore and Bengaluru we have evolved
from offering commodity to producing high value niche molecules and specialised products across our business
segments. In the process, we have also refined our chemistry skills to niche products within carbohydrate
chemistry and heterocyclic chemistry (Pyridines, Pyrimidines, Pyrroles, Pyrrolidine and Indoles). In addition to
our traditional products in the anthelmetic category, we have now introduced APIs in various other therapeutic
categories.
On the other hand, we have retained our flexibility to offer varied volumes and quality of products to our clients.
Our in-house team comprising of more than 50 scientists have been instrumental creating a large pipeline of
niche products. We are among the few Indian players in animal health space to utilize captive research to develop
non-infringing processes. This has not only enabled us to evolve into a preferred partner to our clients but also
establish our brand in unregulated and semi-regulated markets.
An
nu
al Rep
ort 2012-13
17

Board ofDirectors’ profiles
K R Ravishankar
Chairman & Managing Director
Mr. K R Ravishankar has been in the pharmaceutical
business for over 20 years. He started as an entrepreneur,
and then joined Strides Arcolab Ltd as co-promoter in
1991. He was Executive Director of Strides Arcolab Limited
till he resigned from the executive post in Dec 2007 (he
continues on the Board of Strides Arcolab Ltd). He took
over as CMD of SeQuent Scientific Limited in January
2008.
Dr. Gautam Kumar Das
Joint Managing Director
Dr. Gautam Kumar Das is a Joint Managing Director on
the Board and has over thirty years of in depth experience
in the pharmaceutical industry. Dr. Das has extensive
experience in R&D, Plant Operations, Project Management,
Material Management, Resource Management and
Man Management. He has a proven track record in
developing several cost effective processes, driving
these processes from the laboratory to the plant and
increasing productivity of plants. Dr. Das, a Doctorate
in Synthetic Organic Chemistry from IIT Kharagpur, has
authored several publications on chemical processes. In his
immediate previous assignment, Dr. Das was with Orchid
Chemicals & Pharmaceuticals Ltd., Chennai as President –
API.
Kannan Ramanujam
Independent Director
Mr. Kannan Ramanujam, a Chartered Accountant by
qualification has over 24 years of business and professional
experience. He is the Promoter, CEO and Managing
Director of Emerge Learning Services Ltd, a company in
learning space. The company offers complete solutions
in Education, Training, e-governance and Information
management areas. He is an Independent Director on the
Board.
Dr. Gopakumar G Nair
Independent Director
Dr. Gopakumar Nair is an Independent Director on the
Board. With his 40 years experience and knowledge in
pharmaceutical and chemical industry at different levels
and positions like Director, Chairman & Managing Director,
as well as Past-President of Indian Drug Manufacturers’
Association, Dr. Gopakumar Nair had the opportunity to
familiarise himself with GATT, WTO, TRIPs and other IP
laws over the years. It is with this wealth of experience that
Dr. Nair became an IP/ Patent practitioner under the name
Gopakumar Nair Associates.
SeQ
uen
t Sc
ien
tifi
c Li
mit
ed18
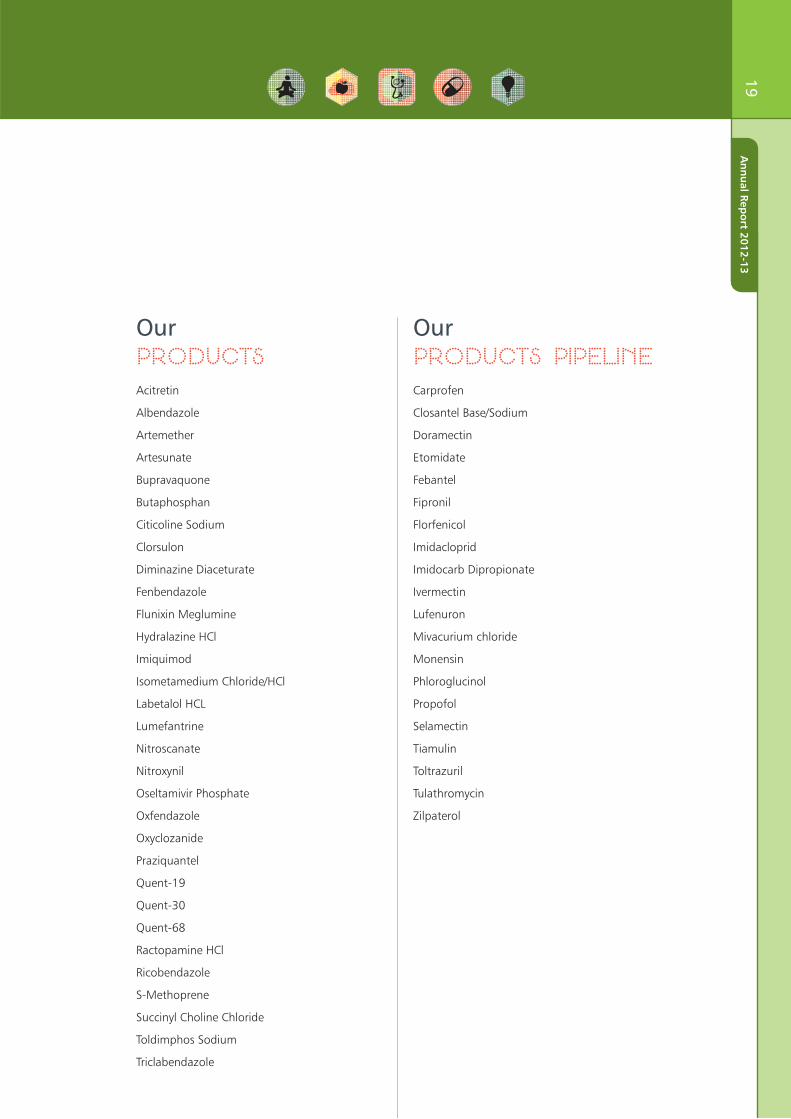
OurProductsAcitretin
Albendazole
Artemether
Artesunate
Bupravaquone
Butaphosphan
Citicoline Sodium
Clorsulon
Diminazine Diaceturate
Fenbendazole
Flunixin Meglumine
Hydralazine HCl
Imiquimod
Isometamedium Chloride/HCl
Labetalol HCL
Lumefantrine
Nitroscanate
Nitroxynil
Oseltamivir Phosphate
Oxfendazole
Oxyclozanide
Praziquantel
Quent-19
Quent-30
Quent-68
Ractopamine HCl
Ricobendazole
S-Methoprene
Succinyl Choline Chloride
Toldimphos Sodium
Triclabendazole
OurProducts pipelineCarprofen
Closantel Base/Sodium
Doramectin
Etomidate
Febantel
Fipronil
Florfenicol
Imidacloprid
Imidocarb Dipropionate
Ivermectin
Lufenuron
Mivacurium chloride
Monensin
Phloroglucinol
Propofol
Selamectin
Tiamulin
Toltrazuril
Tulathromycin
Zilpaterol
An
nu
al Rep
ort 2012-13
19
DIRECTORS’ REPORT
Dear Members,We take pleasure in presenting the 28th Annual Report of your
Company along with the Audited Financial Statements for the
financial year ended March 31, 2013.
20Se
Qu
ent
Scie
nti
fic
Lim
ited

1. FINANCIAL RESULTS
The Financial Performance of the Company (Standalone) for the Financial Year ended March 31, 2013 is given below:
(` In Million) Particulars 2012-13 2011-12
Total revenues 3,140.50 3,324.30
Other Income 24.90 113.27
Earnings before Interest, Depreciation & Tax (40.23) 467.97
Less : Interest (320.45) 282.65
: Depreciation and amortisation expenses (267.43) 210.28
Profit/(Loss) Before Tax & Exceptional Items (628.11) (24.96)
Profit/(Loss) Before Tax (628.11) (24.96)
Provision for - Current Tax - 0.86
- Deferred Tax [Net] (83.10) (40.50)
Profit after Tax (545.01) 14.68
Add: - Balance brought forward from Previous Year 385.24 370.56
Profit/(Loss) available for appropriation (159.77) 385.24
Surplus/(Deficit) carried to Balance Sheet (159.77) 385.24
2. BUSINESS PERFORMANCE REVIEW
During the financial year 2012-13, on a standalone
basis, your Company’s revenues stood at Rs. 3,165.40
Million as against Rs. 3,437.57 in 2011-12. The
Company posted an EBITDA of Rs. (40.23) Million in
the year as against Rs. 467.97 Million in 2011-2012.
The Company registered a net loss of Rs. 545.01
Million.
On a consolidated basis, your Company’s revenues
for the year 2012-13 stood at Rs. 3,294.26 Million
as against Rs. 3,562.93 Million in 2011-12. The
Company posted an EBITDA of Rs. (106.97) Million
as against Rs. 475.58 Million in 2011-2012. The
Company made a loss of Rs.646.94 Million.
A detailed analysis on the Company’s operational and
financial performance for the year is covered under
‘Management’s Discussion and Analysis Report’
which forms part of the Annual Report.
3. DIVIDEND
The Board of Directors of the Company has not
recommended any Dividend for the financial year
ended March 31, 2013.
4. SHARE CAPITAL
As at March 31, 2013, the authorized capital of the
Company stood at Rs.320,000,000.00 divided in to
32,000,000 equity shares of Rs. 10/- each.
The issued, subscribed and paid up equity capital
of the Company as at March 31, 2013 is Rs.
240,351,910.00 divided into 24,035,191 equity
shares of Rs. 10/- each.
During the year, the Company has allotted 2,100,000
equity shares of Rs. 10 each at a premium of Rs.
110.75 per equity share upon conversion of equal
number of warrants which were allotted to Promoter
Group entilies on preferential basis.
Director’s Report21
An
nu
al Rep
ort 2012-13
Pursuant to this, the issued, subscribed and paid up equity capital of the Company increased from Rs. 219. 35 Million to Rs. 240.35 Mio
Issue of Warrants on preferential basis
On September 28, 2012, the Company issued 2,100,000 warrants convertible into equivalent number of equity shares at a price of Rs. 120.75 per warrant (including a premium of Rs. 110.75 per warrant) to promoter group entities. These warrants have already been converted into equity shares in 3 tranches during the year.
On March 30, 2013, the Company issued 2,750,000 warrants convertible into equivalent number of equity shares at a price of Rs. 172.00 per warrant (including a premium of Rs. 162.00 per warrant) to promoter group entities. As at March 31, 2013 these warrants are outstanding.
5. SUBSIDIARIES During the year ended March 31, 2013 Elysian Life
Sciences Private Limited became wholly owned subsidiary of the Company and Elysian Healthcare Private Limited, a step-down subsidiary of the Company, ceased to be a subsidiary of the Company.
6. CONSOLIDATED ACCOUNTS In accordance with Accounting Standard 21
on consolidated financial statements read with Accounting Standard 27 on Accounting for Joint Ventures, the audited consolidated financial
statements are provided in this Annual report.
In terms of the General Circular 2 of 2011 dated
February 8, 2011 issued by the Ministry of Corporate
affairs, the audited Financial Statements of the
Company’s subsidiaries have not been attached to
this Report. The Financial Statements of the said
subsidiaries will be kept for inspection by any investor
at the registered office of the Company during
business hours.
7. PUBLIC DEPOSIT
The Company has not accepted or renewed any
public deposits under section 58A of the Companies
Act, 1956.
8. DIRECTORS
Dr. Gopakumar G Nair retires by rotation at the
ensuing Annual General Meeting and being eligible,
offers himself for re-appointment.
A brief profile of Dr. Gopakumar G Nair is given in the
corporate governance report which forms part of this
report.
Dr. Gautam Kumar Das was re-appointed as an
Executive Director w.e.f. January 7, 2013 for a further
period of 3 years. Further on May 30, 2013, Dr. Das
was re-designated as Joint Managing Director.
9. DIRECTOR’S RESPONSIBILITY STATEMENT
Pursuant to Section 217(2AA) of the act, as amended
by the companies (amendment) Act, 2000, the
director confirms that:
1. In the preparation of annual accounts, the
applicable accounting standards have been
followed along with proper explanation related
to the material departures.
2. Appropriate Accounting Policies have been
selected and applied consistently and have made
adjustments and estimates that are reasonable
and prudent, so as to give a true and fair view of
the state of affairs of the Company as on March
31, 2013 and of the loss of the Company for
the year ended March 31, 2013.
3. Proper and sufficient care has been taken for
the maintenance of adequate accounting
records in accordance with the provisions of
the Companies Act, 1956 for safeguarding the
assets of the Company and for preventing and
detecting fraud and other irregularities.
22Se
Qu
ent
Scie
nti
fic
Lim
ited
4. The Annual Accounts have been prepared on a
going concern basis.
10. AUDITORS The Statutory Auditors viz., M/s. Deloitte Haskins &
Sells, Chartered Accountants, Bangalore (Registration
No. 008072S) retire at the ensuing Annual General
Meeting and being eligible, offer themselves for
re-appointment. Your directors recommend their re-
appointment.
Pursuant to the directives of the Central Government
under the provisions of Section 233B of the
Companies Act, 1956, in respect of the audit of Cost
Records of the Company, Girish Kambadaraya, Cost
Accountant, has been appointed as the Cost Auditor
for the financial year 2013-14. The due date for filing
the Cost Audit Reports in XBRL mode for the financial
year ended March 31, 2012 was February 28, 2013
and the Cost Audit Reports were filed by the Cost
Auditor on January, 31, 2013. The due date for filing
the Cost Audit Reports for the financial year ended
March 31, 2013 is September 30, 2013.
11. CONSERVATION OF ENERGY, TECHNOLOGY ABSORPTION AND FOREIGN EXCHANGE EARNING / OUTGO
The particulars as prescribed under Section 217 (1)(e)
of the Companies Act, 1956 read with the Companies
(Disclosure of Particulars in the Report of Board of
Directors) Rules, 1988 are given as Annexure to the
Directors’ Report.
12. CORPORATE GOVERNANCE The Company has complied with all the mandatory
requirements of Corporate Governance specified by
the Securities and Exchange Board of India through
clause 49 of the Listing Agreement. As required
by the said clause, a separate Report on Corporate
Governance forms part of this report. A certificate
from the Statutory Auditors of the Company
regarding compliance with Corporate Governance
requirements as stipulated in Clause 49 of the Listing
Agreement entered with Stock Exchange also forms
part of the Annual Report.
Board also confirms that the Company has devised
proper systems to ensure compliance of all laws
applicable to the Company.
13. MANAGEMENT DISCUSSION AND ANALYSIS Pursuant to clause 49 of the Listing Agreement
entered into with the Stock Exchanges, Management Discussion and Analysis Report forms part of this Report.
14. RESEARCH AND DEVELOPMENT Detailed write-up on Research and Development
activity is given as an annexure to the Directors’ Report.
15. EMPLOYEE STOCK OPTION SCHEME The Company has formulated an Employee Stock
Option Plan titled ‘SSL ESOP Scheme 2010’ and the scheme is administered through a trust. As on date 700,000 shares have been issued to the trust. However no ESOPs are outstanding as on March 31, 2013.
Further, Statement giving additional information in terms of Regulation 12 of Securities and Exchange Board of India (Employee Stock Option Scheme and Employee Stock Purchase Scheme) Guidelines, 1999 is annexed to this report.
16. PARTICULARS OF EMPLOYEES U/S 217 OF THE COMPANIES ACT, 1956
Any shareholder interested in obtaining a copy of the statement of particulars of employees referred to in section 217 (2A) of the Companies Act, 1956, may write to the Company Secretary at the Registered Office of the Company.
17. APPRECIATION Your Directors would like to express their grateful
appreciation for the excellent support and cooperation received from the Shareholders, Customers, Financial Institutions, Banks, Government Authorities, Reserve Bank of India, Securities and Exchange Board of India, Stock Exchanges, Manufacturers and Suppliers to the Company.
At this point, we would like to place on record our sincere appreciation for the total commitment, dedication, untiring efforts and hard work put in by the employee members at all levels of the Company in realisation of the corporate goals in the years ahead.
For and on behalf of the Board of Directors
Dr. Gautam Kumar Das Dr. Gopakumar Nair
Joint Managing Director Director
Place: Bangalore
Date: August 14, 2013
Director’s Report23
An
nu
al Rep
ort 2012-13
RESEARCH AND DEVELOPMENT (R&D):
Core areas of R&D
Process chemistry aspects of Active Pharmaceutical Ingredients (APIs) which comprises
a. Developing alternate synthetic routes for the existing routes to achieve improvement in quality, cost and productivity.
b. Development of new and cost effective reagents for eliminating hazardous and expensive reagents in the processes.
c. Identification and characterization of impurities and improve the quality of APIs and their intermediates.
d. Continuous improvement on critical process parameters in the processes to improve yields and achieve high throughput.
e. Developing processes by backward integration to have effective control over quality and supply of intermediates and
their cost.
Benefits derived as a result of R&D
a. Ensuring regulated market through new Drug Master Files (DMF’s) using non-infringing processes.
b. Niche products for early filing and to have market advantages.
c. Generation of intellectual wealth for the company.
d. Interaction with high end customers with effective R&D services.
Future plan of Action
a. In the animal health segment, the company will continue to focus on therapeutic segments of anthelmintic and anti
-parasiticide.
b. New Research activity on plant based Pharmaceuticals.
c. Focus on new projects for contract research and specialty chemicals.
d. Continued focus on alternate cost effective processes for existing products.
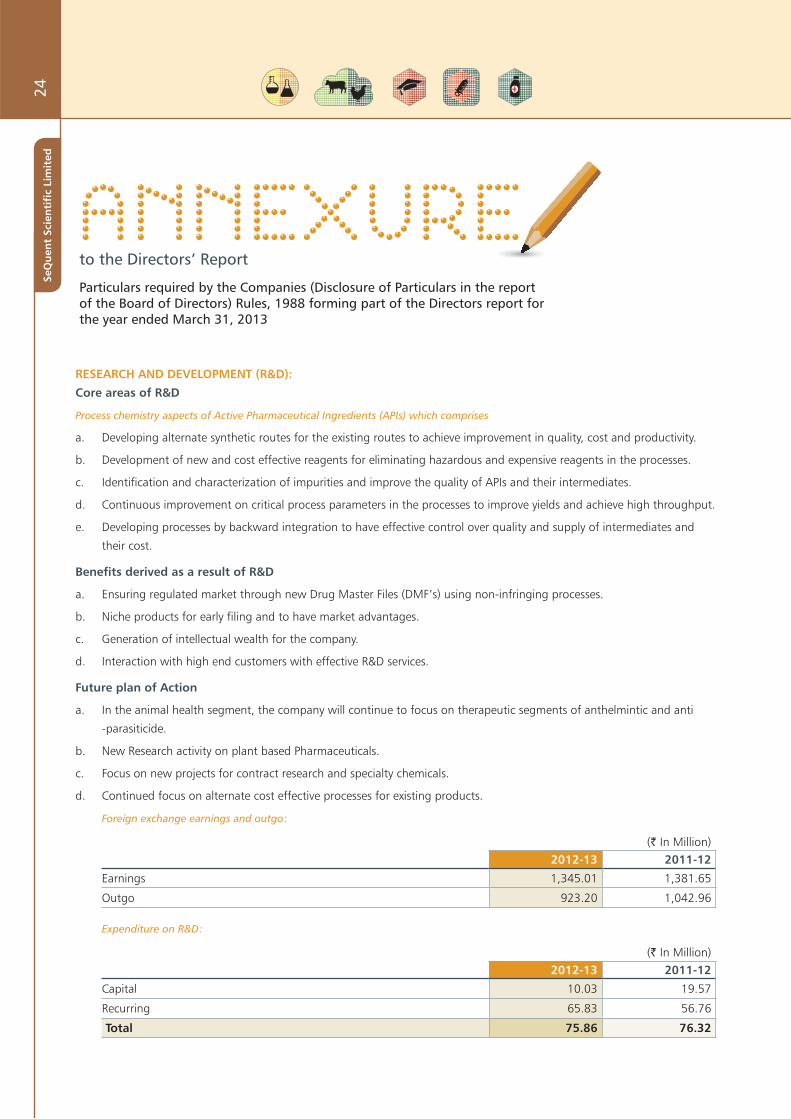
Foreign exchange earnings and outgo:
(` In Million) 2012-13 2011-12
Earnings 1,345.01 1,381.65
Outgo 923.20 1,042.96
Expenditure on R&D:
(` In Million) 2012-13 2011-12
Capital 10.03 19.57
Recurring 65.83 56.76
Total 75.86 76.32
Annexure to the Directors’ Report
Particulars required by the Companies (Disclosure of Particulars in the report of the Board of Directors) Rules, 1988 forming part of the Directors report for the year ended March 31, 2013
24Se
Qu
ent
Scie
nti
fic
Lim
ited

form-a Form for Disclosure of Particulars with respect to Conservation of Energy.
2012-13 2011-12A. POWER AND FUEL CONSUMPTION :
1 ELECTRICITY
(a) Purchased (Units) 20,142,135 19,318,280
Total amount (Rs. in Millions) 131.89 115.57
Rate / Unit (Rs.) 6.55 5.98
(b) Own Generation - through Diesel
Generator Set :
Unit 489,339 823,553
Units per-litre of diesel oil 2.95 3.20
Cost / Unit (Rs.) 15.07 12.87
2 COAL
Quantity (tonnes) NIL NIL
Total Cost (Rs. in Millions) NIL NIL
Average rate (Rs.) NIL NIL
3 FURNACE OIL / LIGHT DIESEL OIL
(a) Light Diesel Oil:
Quantity (Litres) 114,062 135,356
Total amount (Rs. in Millions) 7.14 7.29
Rate / Litre (Rs.) 62.58 53.83
(b) Furnace Oil :
Quantity (Litres) 1,278,058 1,053,327
Total amount (Rs. in Millions) 51.37 38.84
Rate / Litre (Rs.) 40.19 36.87
4 OTHERS / INTERNAL GENERATION
(a) Natural Gas
Quantity (Scm) 713,176 828,508
Total Cost (Rs. in Millions) 21.78 17.71
Rate / Unit (Rs.) 30.54 21.37
(b) Briquettes
Quantity (Kg ) 2,451,958 2,157,577
Total Cost (Rs. in Millions) 12.70 10.50
Rate / Unit (Rs.) 5.18 4.87
Director’s Report25
An
nu
al Rep
ort 2012-13
MEASURES TAKEN DURING THE PERIOD 2012-13 FOR CONSERVATION OF ENERGY
Street lights with LED Operating Principal installed at Mahad unit, saves almost 50 % power compared to conventional Light system.
Purified water reject stream water used for domestic use at Mahad, Tarapur saves total water requirement.
Vent condensers installed for all major distillation operation thus reducing venting in atmosphere and further cost reduction for solvent requirement.
Screw/ Rotary Compressor for air and brine plant installed for Micronization operation/ Utility operation which are energy efficient in terms of operating cost.
RO system installed at Mahad unit for effluent treatment, treated permeate water used for various utilities thus reducing total water requirement by 20 KL/DAY.
Steam condensate recovery and reuse for utilities implemented at Mahad.
A Project is already under execution at Mangalore to significantly reduce Energy consumption at our R & D centre by completely revamping the existing Air conditioning system and by selectively providing split ACs or fans wherever required. This step alone is estimated to save substantial electrical energy now being consumed at R & D centre.
Replacement of Starters of Air Handling Units (AHUs) Ventilation systems at Mangalore by suitable Variable Frequency Drives (VFDs). This may lead to an estimated saving of 120 units of energy per day.
By providing additional Capacitor Banks wherever required efforts are being made to improve Power Factor to a level of < 0.995 at all our sites.
Nearly 40% of Power requirement for Mangalore unit is purchased directly from eco-friendly, non-fossil fuel, private power generating units.
PLANS FOR FUTURE- ONGOING (2013-14) CONSERVATION OF ENERGY
Briquette fired Thermo pack planned at Mahad location will reduce operating cost and eliminate usage of fossil fuel (F.O.).
Solvent transfer and handling system.
Energy conservation audit.
Energy efficient new Process and Utility equipment’s.
Planning for a full-fledged compact Effluent
Treatment Plant (ETP) including Multiple Effect
Evaporator to increase the capacity within the existing
area and operation cost.
A project has been initiated at Mangalore to reuse
the product permeate water to reduce consumption
of fresh water.
Planning to purchase 60% to 80% of power
requirement for Mangalore unit directly from eco-
friendly, non-fossil fuel, private power generating
units.
ENVIRONMENT HEALTH & SAFETY Plantation in the factory premises.
Sprucing up of facilities including upgrading toilets
and drinking water facilities at Mahad, Unit Training
& Awareness program on Fire safety, recycling of
waste and water conservation.
Full fledge fire hydrant system and smoke detection
system installed at Mahad unit to tackle any fire
emergency.
Full fledge Occupational Health Centre (OHC)
Occupatstarted facility at Mahad unit.
On line Total Organic Carbon (TOC) analyser to
monitor discharge effluent characteristics installed at
Mahad.
As a part of Corporate Social responsibility &
green nurturing program five public schools have
been identified and following facilities have been
upgraded.
1. Plantation in the school premises.
2. Sprucing up of facilities including upgrading
toilets and drinking water facilities.
3. Energy conservation programs including
changing the lighting with CFL lamps.
4. Training & Awareness program on fire safety,
recycling of waste and water conservation.
No reportable accidents during the year.
form-B Form for Disclosure of Particulars with respect to Absorption.
26Se
Qu
ent
Scie
nti
fic
Lim
ited

Details as per SEBI (Employees Stock Option Scheme and
Employees Stock Purchase Scheme) Guidelines, 1999 forming part of the Directors’
Report for the year ended March 31, 2013.
SL. NO DESCRIPTION SSL ESOP SCHEME 2010
A Options granted as on March 31, 2013 None
B The pricing formula Decided by the Compensation Committee from time to time
C Options vested None
D Options exercised None
E The total number of shares arising as a result of exercise of options None
F Options lapsed / surrendered None
G Variation of terms of options None
H Money realised by exercise of options (Rs.) None
I Total number of options in force at the end of the year None
J Employee-wise details of options granted during the year
i) Senior managerial personnel None
ii) Other identified employees None
iii) Any other employees who received a grant in any one year of option amount to 5% or more of options granted during that year
None
iv) Identified employees who were granted option, during any one year, equal to or exceeding 1% of the issued capital (excluding outstanding warrants and conversions) of the Company at the time of grant
None
K Diluted Earnings Per Share (DEPS) pursuant to issue of shares on exercise of option calculated in accordance with Accounting Standard 20 'Earnings Per Share'
Not Applicable
L Where the Company has calculated the employee compensation cost using the intrinsic value of the stock options, the difference between the employee compensation cost so computed and the employee compensation cost that shall have been recognised if it had used the fair value of the options, shall be disclosed. The impact of the difference on profits and EPS of the Company shall be disclosed
Not Applicable
M Weighted average exercise prices of options shall be disclosed separately for options whose exercise price either equals or exceeds or is less than the market price of the stock
Not Applicable
Director’s Report27
An
nu
al Rep
ort 2012-13
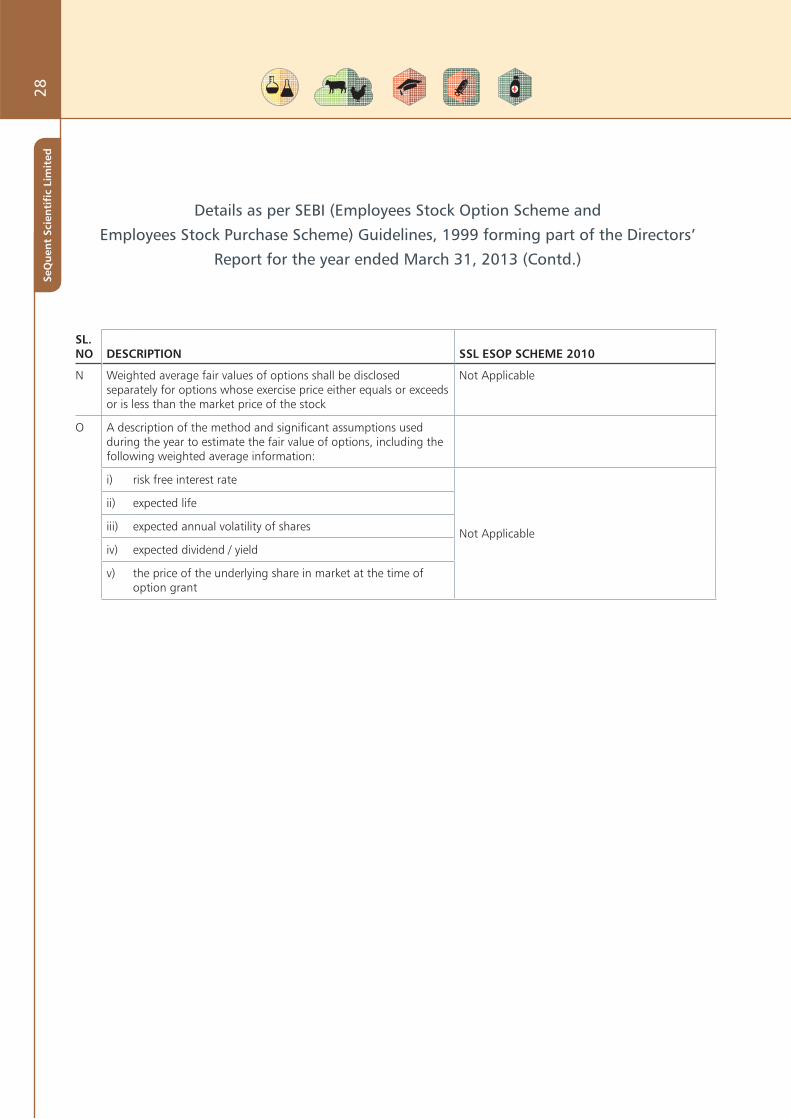
Details as per SEBI (Employees Stock Option Scheme and
Employees Stock Purchase Scheme) Guidelines, 1999 forming part of the Directors’
Report for the year ended March 31, 2013 (Contd.)
SL. NO DESCRIPTION SSL ESOP SCHEME 2010
N Weighted average fair values of options shall be disclosed separately for options whose exercise price either equals or exceeds or is less than the market price of the stock
Not Applicable
O A description of the method and significant assumptions used during the year to estimate the fair value of options, including the following weighted average information:
i) risk free interest rate
Not Applicable
ii) expected life
iii) expected annual volatility of shares
iv) expected dividend / yield
v) the price of the underlying share in market at the time of option grant
28Se
Qu
ent
Scie
nti
fic
Lim
ited

Date Particulars
Number of Shares
Issued
Cumulative Number of
SharesIssue Price Per Share
28.06.1985 Subscribers to the Memorandum 70 70 10.00
10.12.1985 Public Issue 239,930 240,000 10.00
14.01.2000 Preferential Issue 3,760,000 4,000,000 13.50
31.03.2004 Pursuant to a scheme of amalgamation 2,500,003 6,500,003 NA
31.01.2007 Conversion of warrants issued on preferential basis 1,000,000 7,500,003 47.00
09.07.2007 Preferential Issue 2,785,188 10,285,191 65.00
27.11.2007 Conversion of warrants issued on preferential basis 800,000 11,085,191 47.00
22.09.2009 Pursuant to a scheme of amalgamation 10,150,000 21,235,191 NA
29.03.2010 Issued to ESOP TRUST 700,000 21,935,191 113.00
21.11.2011 Cancelled (1,48,65,000 Equity Shares of Rs.10 in the paid up share capital of the Company pursuant to the sanction of scheme of amalgamation of Fraxis Life Sciences Limited with the Company)
(14,865,000) 7,070,191 NA
21.11.2011 Allotted (14,865,000 Equity Shares of Rs.10 each of the Company pursuant to the sanction of scheme of amalgamation of Fraxis Life Sciences Limited with the Company)
14,865,000 21,935,191 NA
10.10.2012 Conversion of warrants issued on preferential basis 1,000,000 22,935,191 120.75
16.11.2012 Conversion of warrants issued on preferential basis 700,000 23,635,191 120.75
08.03.2013 Conversion of warrants issued on preferential basis 400,000 24,035,191 120.75
Equity History
Equity History29
An
nu
al Rep
ort 2012-13
ManagementDiscussion & analysis
30Se
Qu
ent
Scie
nti
fic
Lim
ited

INDUSTRY OVERVIEW
Global overview
During 2012, the global pharmaceutical marketgrew by 2.5 per cent to US$839 billion (bn),on account of double-digit
growth registered in emerging markets.Average revenue growth in Established Markets was 1.5% while that in Emerging
Markets was over seven times higher at 11.1%. The top five pharmaceutical markets in the world remained the US, Japan,
Germany, France and China, with the US representing 39.3% of global pharmaceutical sales (2011: 38.1 %).
(Source: AstraZeneca & Company)
The world population is expected to rise from its current level of some seven billion and reach nine billion by 2050. In addition, the number of people who can access healthcare continues to increase, particularly among the elderly. Globally, it is estimated that between 2000 and 2050, the number of people aged 60 years and over will increase from 605 million (mn) to two billion.Faster-developing economies, such as China, India and Brazil, offer new opportunities for the pharmaceutical industry to help an expanding number of patients who can benefit from innovative medicines. Developing markets now represent approximately 85% of the world population and over 22% of the world’s pharmaceutical revenues. Pharmaceutical revenues in those markets therefore continued to grow faster than those in Established Markets in 2012.
WORLD PHARMACEUTICAL MARKET SALES
World US$bn (+2.5%)
8392012
8182011
7802010
Western Europe US$bn (-0.8%)
1812012
1822011
1812010
Established ROW US$bn (+1.5%)
1392012
1372011
1312010
Emerging ROW US$bn (+11.1%)
1892012
1712011
1522010
US US$bn (+0.4%)
3302012
3292011
3152010
Management Discussion & Analysis31
An
nu
al Rep
ort 2012-13
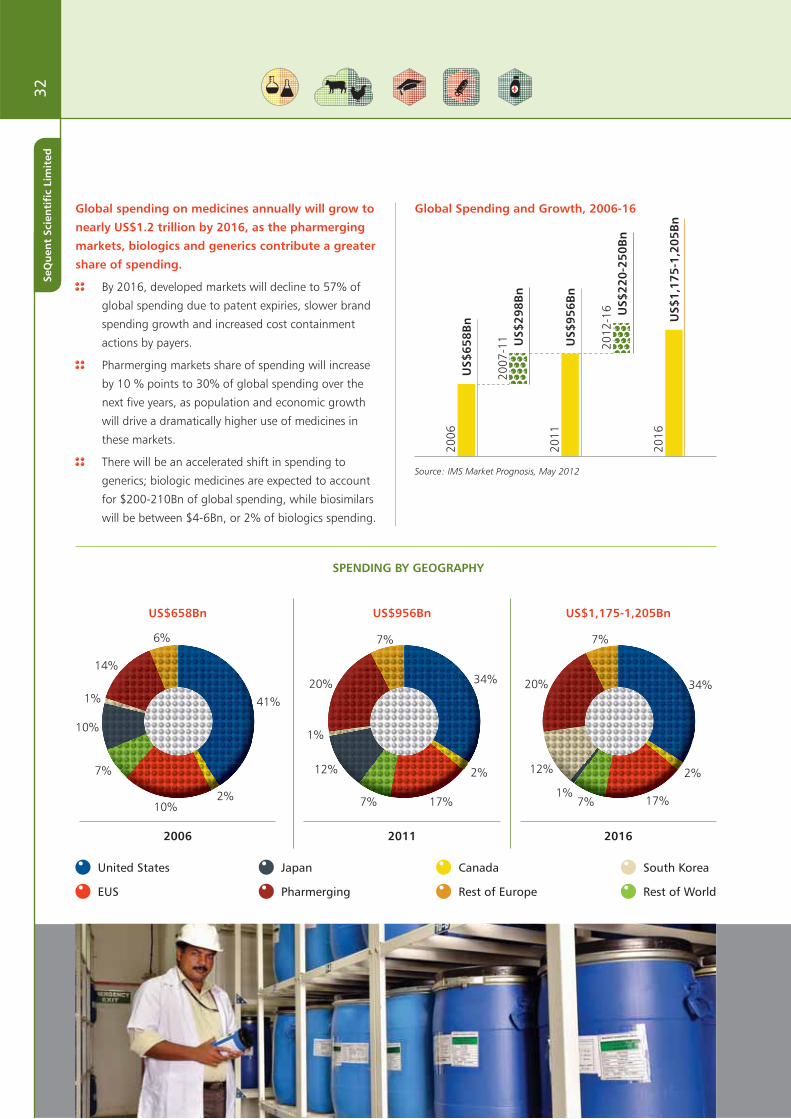
Global spending on medicines annually will grow to
nearly US$1.2 trillion by 2016, as the pharmerging
markets, biologics and generics contribute a greater
share of spending.
By 2016, developed markets will decline to 57% of
global spending due to patent expiries, slower brand
spending growth and increased cost containment
actions by payers.
Pharmerging markets share of spending will increase
by 10 % points to 30% of global spending over the
next five years, as population and economic growth
will drive a dramatically higher use of medicines in
these markets.
There will be an accelerated shift in spending to
generics; biologic medicines are expected to account
for $200-210Bn of global spending, while biosimilars
will be between $4-6Bn, or 2% of biologics spending.
Source: IMS Market Prognosis, May 2012
Global Spending and Growth, 2006-16
US$
658B
n20
06
US$
956B
n20
11
US$
1,17
5-1,
205B
n20
16
US$
298B
n20
07-1
1
US$
220-
250B
n20
12-1
6
United States
EUS
Japan
Pharmerging
Canada
Rest of Europe
South Korea
Rest of World
US$658Bn
2006
6%
2%
14%
1%
10%
41%
10%
7%
2016
US$1,175-1,205Bn
1%
12%
20%
7%
34%
2%
17%7%
2011
US$956Bn
7%
20%
1%
12%
7% 17%
2%
34%
SPENDING BY GEOGRAPHY
32Se
Qu
ent
Scie
nti
fic
Lim
ited
(Source: IMS Health)
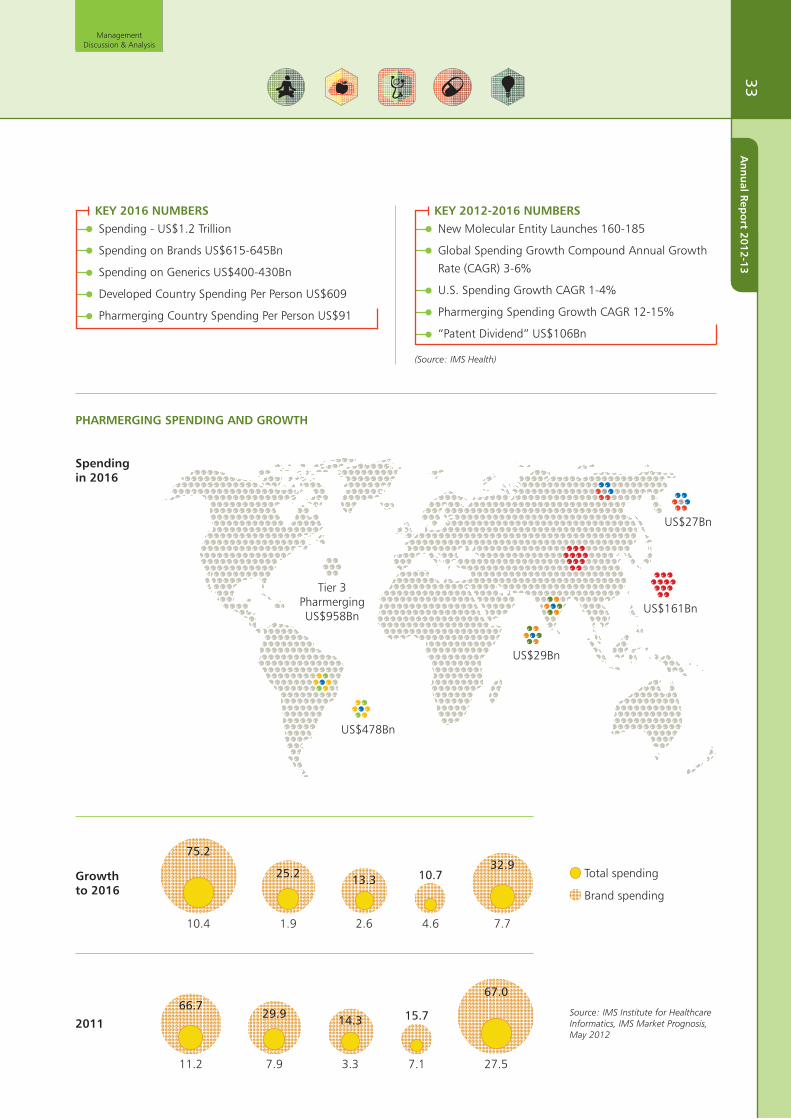
KEY 2016 NUMBERSSpending - US$1.2 Trillion
Spending on Brands US$615-645Bn
Spending on Generics US$400-430Bn
Developed Country Spending Per Person US$609
Pharmerging Country Spending Per Person US$91
KEY 2012-2016 NUMBERSNew Molecular Entity Launches 160-185
Global Spending Growth Compound Annual Growth
Rate (CAGR) 3-6%
U.S. Spending Growth CAGR 1-4%
Pharmerging Spending Growth CAGR 12-15%
“Patent Dividend” US$106Bn
US$478Bn
Tier 3PharmergingUS$958Bn
US$29Bn
US$161Bn
US$27Bn
Spending in 2016
PHARMERGING SPENDING AND GROWTH
2011
27.5
67.0
7.9
29.9
3.3
14.3
7.1
15.7
11.2
66.7
Total spending
Brand spending
Source: IMS Institute for Healthcare Informatics, IMS Market Prognosis, May 2012
Growthto 2016
10.4
75.2
1.9
25.2
2.6
13.3
4.6
10.7
7.7
32.9
Management Discussion & Analysis33
An
nu
al Rep
ort 2012-13

Generics
The generics market is expected to reach US$231 bn by 2017 compared to US$124 bn in 2010, with a compound annual
growth rate of 9.3%. The increase is mainly attributed to patent expiries, but the effect of increasingly ageing populations
and chronic diseases are also expected to contribute to growth in generics.
AN
NU
AL
PER
CA
PITA
DRU
G S
PEN
D U
S$
900
500
700
300
100
800
400
600
200
0
U.S. US$892 Pop. 326Mn
Japan US$644 Pop. 124Mn
Canada US$420 Pop. 36Mn
EU5 US$375 Pop. 320Mn
South Korea US$323 Pop. 50Mn
Brazil US$180 Pop. 201Mn
Rest of Europe US$321 Pop. 105Mn
Russia US$179 Pop. 140Mn
China US$121 Pop. 1,349Mn
PharmergingTier 3 US$96Pop. 1,021Mn
India US$33 Pop. 1,292Mn
Developed Pharmerging
POPULATION
Source : IMS Market Prognosis, May 2012; Economist Intelligence Unit, Jan 2012
2016 PHARMACEUTICAL SPEND PER CAPITA 2005US$ AND POPULATION
Global pharma and global generics sales
Source: IMS Health, Barclays Research
2005
484
121
2009
596
203
2007
538
157
2011
640
240
2014E
687
337
2006
510
138
2010
625
231
2013E
673
301
2008
567
178
2012E
657
269
2015E
700
378
Generic Mkt Branded Pharma Sales
34Se
Qu
ent
Scie
nti
fic
Lim
ited
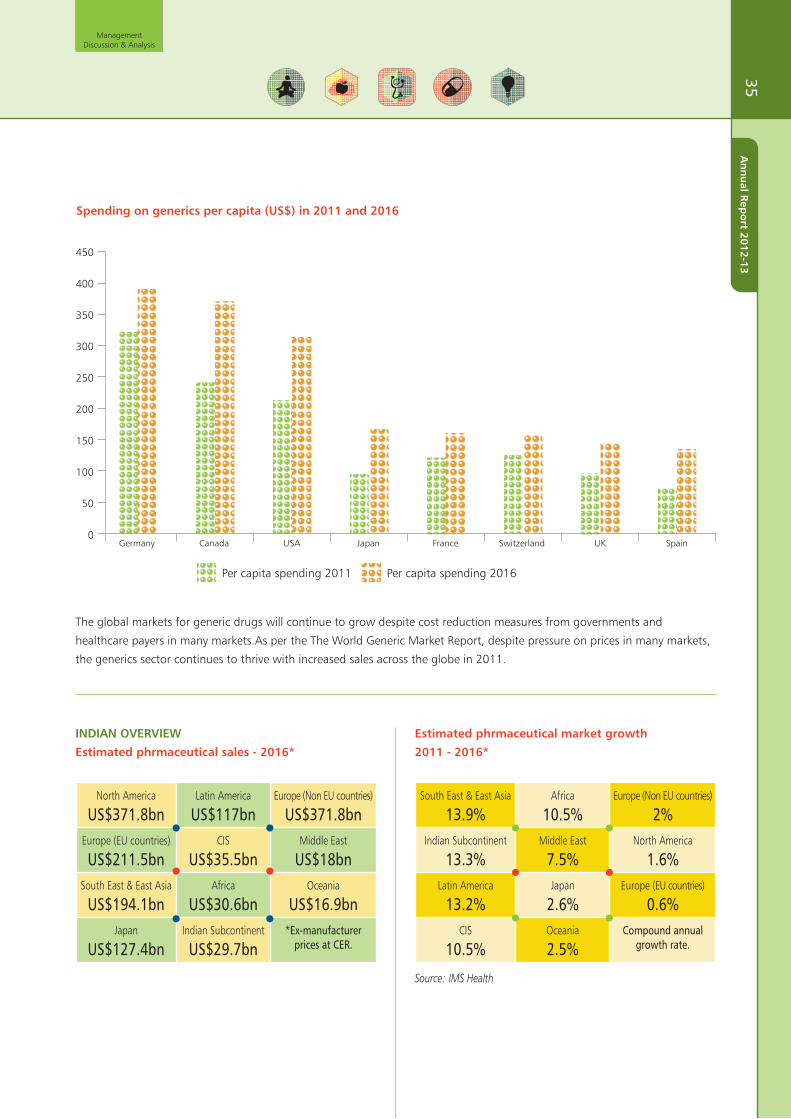
Spending on generics per capita (US$) in 2011 and 2016
Germany Canada USA Japan France Switzerland UK Spain0
50
100
150
200
250
300
350
400
450
Per capita spending 2011 Per capita spending 2016
The global markets for generic drugs will continue to grow despite cost reduction measures from governments and
healthcare payers in many markets.As per the The World Generic Market Report, despite pressure on prices in many markets,
the generics sector continues to thrive with increased sales across the globe in 2011.
INDIAN OVERVIEW
Estimated phrmaceutical sales - 2016*
North America
US$371.8bnLatin America
US$117bnEurope (Non EU countries)
US$371.8bnEurope (EU countries)
US$211.5bnCIS
US$35.5bnMiddle East
US$18bnSouth East & East Asia
US$194.1bnAfrica
US$30.6bnOceania
US$16.9bnJapan
US$127.4bnIndian Subcontinent
US$29.7bn*Ex-manufacturer
prices at CER.
Estimated phrmaceutical market growth
2011 - 2016*
South East & East Asia
13.9%Africa
10.5%Europe (Non EU countries)
2%Indian Subcontinent
13.3%Middle East
7.5%North America
1.6%Latin America
13.2%Japan
2.6%Europe (EU countries)
0.6%CIS
10.5%Oceania
2.5%Compound annual
growth rate.
Source: IMS Health
Management Discussion & Analysis35
An
nu
al Rep
ort 2012-13
India’s pharmaceutical sector can be classified into three
broad market segments namely Contract Research And
Manufacturing Services (CRAMS), Formulations, and Active
Pharmaceutical Ingredients (APIs).
The Indian Pharmaceutical industry is highly fragmented
with about 24,000 players (around 330 in the organised
sector). The top ten companies make up for more than
a third of the market. The Indian pharma industry (IPM)
grew by 16% YoY in 2012 to Rs. 629 bn. It accounts for
about 1.4% of the world’s pharma industry in value terms
and 10% in volume terms. (Source: equitymaster.com)
Advantage India Between 2010 and 2015 patent drugs worth US$171 bn
are estimated to go off-patent leading to a huge surge in generic products.
High margin pharma export business is expected to grow at a higher rate than domestic market given increased in outsourcing activities.
Increased M&A activities are set to consolidate the market, which widens geographic reach, strengthens distribution network and venture into new therapeutic segments.
Indian companies files the highest number of ANDA’s with USFDA leading to greater chances of approvals and
thereby increasing export to regulated markets especially the US.
There are currently approximately 175 USFDA and nearly 90 UK-MHRA approved pharma-manufacturing plants in India, which can supply high quality pharma products globally.
Growth from rural markets will outstrip overall pharma market growth, albeit at lower margins, given lower penetration of 18-19% coupled with rising income level and awareness.
Biopharmaceuticals is another potential high growth segment for Indian pharma growing at double digit driven by the vaccines market.
Fiscal 2012-13 was a year of strong operating
performance for the Indian pharmaceutical industry as it
benefitted from patent expiration wave in the US, strong
growth from the emerging markets and favourable
foreign exchange scenario. During the year, Indian
pharma companies also managed to gain traction in their
European businesses despite the challenging environment.
However, back home in India, the growth momentum
showed signs of moderation owing to relatively weak
seasonal demand, adverse impact of inflationary pressures
on disposable incomes coupled with uncertainties
surrounding the implementation of the new pricing policy
in the second half the financial year.
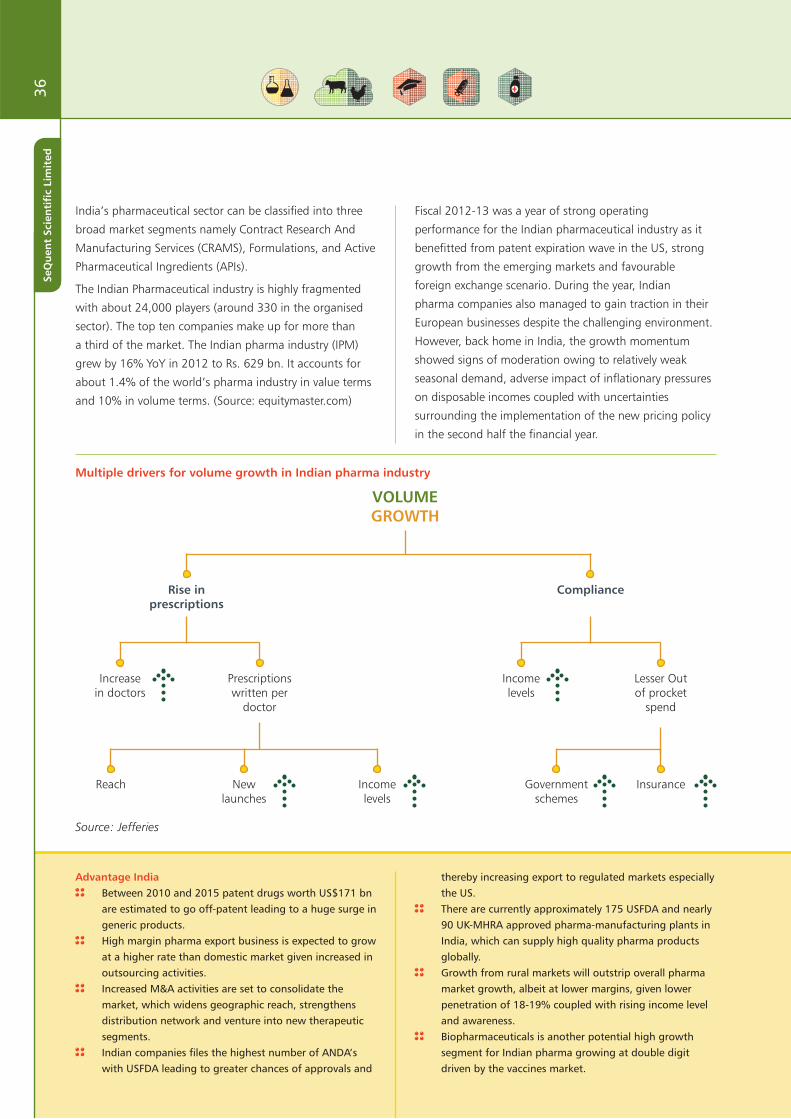
Multiple drivers for volume growth in Indian pharma industry
Source: Jefferies
VOLUME GROWTH
Rise in prescriptions
Compliance
Reach Newlaunches
Income levels
Government schemes
Insurance
Increase in doctors
Prescriptions written per
doctor
Income levels
Lesser Out of procket
spend
36Se
Qu
ent
Scie
nti
fic
Lim
ited
INDIAN GENERICS MARKET
India tops the world in exporting generic medicines worth
US$ 11 bn. The Indian generic drug market is to grow
at a CAGR of around 17 per cent between 2010-11 and
2012-13.Over the next few years, it is expected that the
patent laws will provide impetus to the launch of patent-
protected products. Such products have the potential to
capture upto a 10% share of the market by 2015, implying
the market size of US$ 2bn.
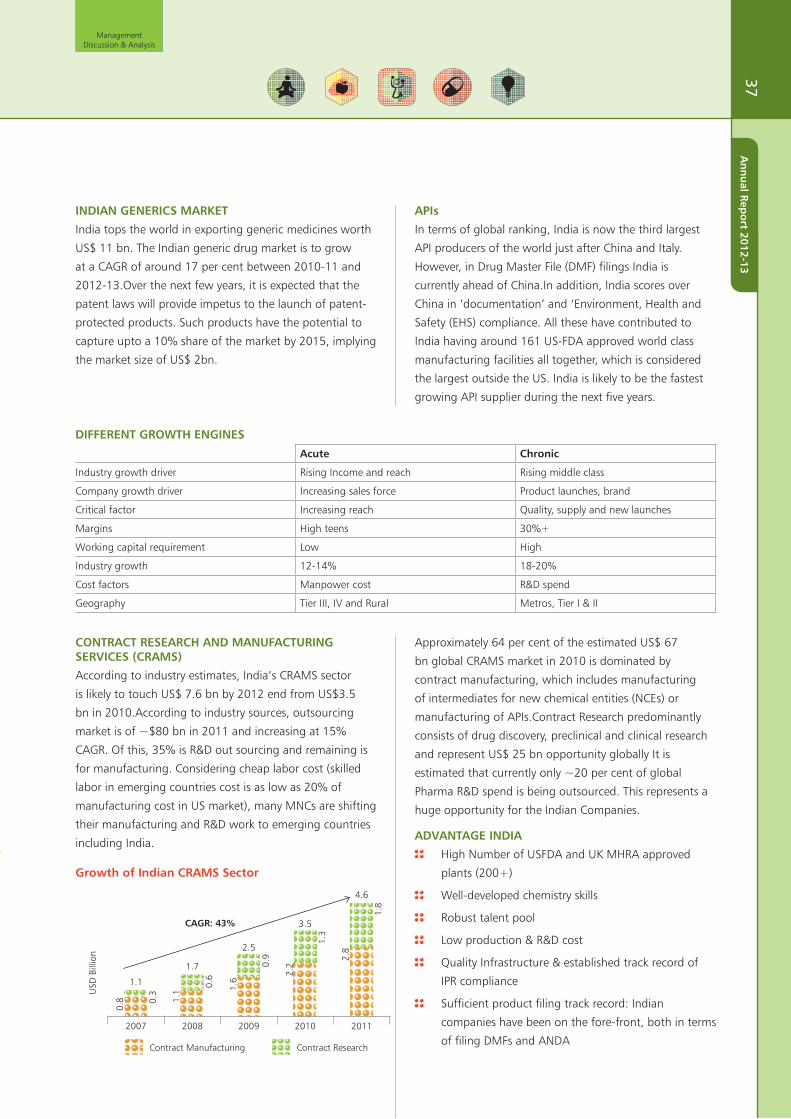
CONTRACT RESEARCH AND MANUFACTURING SERVICES (CRAMS)
According to industry estimates, India’s CRAMS sector
is likely to touch US$ 7.6 bn by 2012 end from US$3.5
bn in 2010.According to industry sources, outsourcing
market is of ~$80 bn in 2011 and increasing at 15%
CAGR. Of this, 35% is R&D out sourcing and remaining is
for manufacturing. Considering cheap labor cost (skilled
labor in emerging countries cost is as low as 20% of
manufacturing cost in US market), many MNCs are shifting
their manufacturing and R&D work to emerging countries
including India.
Approximately 64 per cent of the estimated US$ 67
bn global CRAMS market in 2010 is dominated by
contract manufacturing, which includes manufacturing
of intermediates for new chemical entities (NCEs) or
manufacturing of APIs.Contract Research predominantly
consists of drug discovery, preclinical and clinical research
and represent US$ 25 bn opportunity globally It is
estimated that currently only ~20 per cent of global
Pharma R&D spend is being outsourced. This represents a
huge opportunity for the Indian Companies.
ADVANTAGE INDIA
High Number of USFDA and UK MHRA approved
plants (200+)
Well-developed chemistry skills
Robust talent pool
Low production & R&D cost
Quality Infrastructure & established track record of
IPR compliance
Sufficient product filing track record: Indian
companies have been on the fore-front, both in terms
of filing DMFs and ANDA
APIs
In terms of global ranking, India is now the third largest
API producers of the world just after China and Italy.
However, in Drug Master File (DMF) filings India is
currently ahead of China.In addition, India scores over
China in ‘documentation’ and ‘Environment, Health and
Safety (EHS) compliance. All these have contributed to
India having around 161 US-FDA approved world class
manufacturing facilities all together, which is considered
the largest outside the US. India is likely to be the fastest
growing API supplier during the next five years.
DIFFERENT GROWTH ENGINES
Acute Chronic
Industry growth driver Rising Income and reach Rising middle class
Company growth driver Increasing sales force Product launches, brand
Critical factor Increasing reach Quality, supply and new launches
Margins High teens 30%+
Working capital requirement Low High
Industry growth 12-14% 18-20%
Cost factors Manpower cost R&D spend
Geography Tier III, IV and Rural Metros, Tier I & II
Growth of Indian CRAMS Sector
2007
1.1
1.7
2.5
3.5
4.6
CAGR: 43%
2008 2009 2010 2011
Contract Manufacturing Contract Research
0.3
0.8
0.6
1.1
0.9
1.6
1.3
2.2
1.8
2.8
USD
Bill
ion
Management Discussion & Analysis37
An
nu
al Rep
ort 2012-13
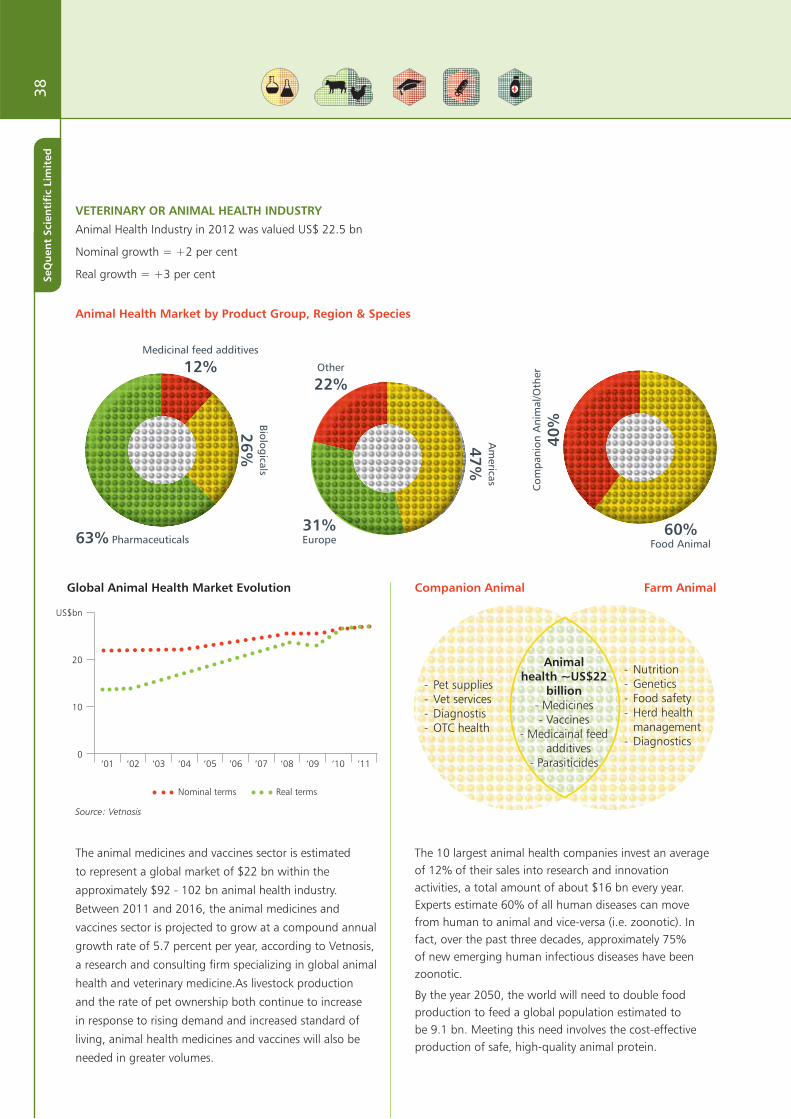
VETERINARY OR ANIMAL HEALTH INDUSTRY
Animal Health Industry in 2012 was valued US$ 22.5 bn
Nominal growth = +2 per cent
Real growth = +3 per cent
The animal medicines and vaccines sector is estimated
to represent a global market of $22 bn within the
approximately $92 - 102 bn animal health industry.
Between 2011 and 2016, the animal medicines and
vaccines sector is projected to grow at a compound annual
growth rate of 5.7 percent per year, according to Vetnosis,
a research and consulting firm specializing in global animal
health and veterinary medicine.As livestock production
and the rate of pet ownership both continue to increase
in response to rising demand and increased standard of
living, animal health medicines and vaccines will also be
needed in greater volumes.
The 10 largest animal health companies invest an average of 12% of their sales into research and innovation activities, a total amount of about $16 bn every year. Experts estimate 60% of all human diseases can move from human to animal and vice-versa (i.e. zoonotic). In fact, over the past three decades, approximately 75% of new emerging human infectious diseases have been zoonotic.
By the year 2050, the world will need to double food production to feed a global population estimated to be 9.1 bn. Meeting this need involves the cost-effective production of safe, high-quality animal protein.
Animal Health Market by Product Group, Region & Species
Medicinal feed additives
12%
Biologicals
26%63% Pharmaceuticals
Other
22%
31%Europe
Am
ericas
47%
60%Food Animal
Com
pani
on A
nim
al/O
ther
40%
Companion Animal Farm Animal
- Pet supplies- Vet services- Diagnostis- OTC health
- Nutrition- Genetics- Food safety- Herd health
management- Diagnostics
Animalhealth ~US$22
billion- Medicines- Vaccines
- Medicainal feed additives
- Parasiticides
Global Animal Health Market Evolution
0
US$bn
20
10
‘01 ‘03‘02 ‘04 ‘05 ‘06 ‘07 ‘08 ‘09 ‘10 ‘11
Nominal terms Real terms
Source: Vetnosis
38Se
Qu
ent
Scie
nti
fic
Lim
ited

There are several factors influencing the growing importance of livestock medicines and vaccines as a component of global food supply:
Growth in the global population and increasing standards of living are increasing demand for improved nutrition, particularly animal protein
Natural resource constraints, such as scarcity of arable land and fresh water and increased competition for cultivated land will restrict the resources available to meet this increased demand
Heightened focus on food safety
The Indian market for animal nutrition and health product is highly fragmented, and with a very large number of relatively small players. The top 10 players are estimated to control around 25% of the market, and more than 350 others companies making up the balance.
CATTLE (DAIRY) AND POULTRY – THE KEY PROMISING INDIAN SEGMENTSDairy Segment
No.1 milk producer in the world (106 mntonnes per year)
Meat products (Pork/Beef/Mutton) have a growth rate of 10 per cent (CII &Mckinsey)
Increasing urbanisation leading to greater consumerism (Packed milk & meat products)
All Poultry & Livestock related industries establishing base to encash from one of world largest growing economy
Poultry Segment
5th largest Egg Producer Growth rate of eggs & broilers are 16 per cent and 20 per cent respectively (CII &Mckinsey)
Productivity of hens equivalent to USA (300 - 305 eggs/year/hen)
Indian eggs cheapest in the world (75 cents/kg)
Production of egg powder for export greater than China
Union Budget 2012-13
It is proposed to extend concessional basic customs duty of 5 per cent with full exemption from excise duty/CVD to six specified life-saving drugs/ vaccines. These are used for the treatment or prevention of ailments such as HIV-AIDS, renal cancer, etc
Probiotics are a cost-effective means of combating bacterial infections. It is proposed to reduce the basic customs duty on this item from 10 per cent to 5 per cent
Basic customs duty and excise duty reduced on Soya products to address protein deficiency among women and children. Basic customs duty and excise duty reduced on Iodine Furthermore, a ‘Pharma Vision 2020’ has been prepared by the Department of Pharmaceuticals, for making India one of the leading destinations for end-to-end drug discovery and innovation and for that purpose, the department will provide requisite support by way of world class infrastructure, internationally competitive scientific manpower for pharma research and development (R&D), venture fund for research in the public and private domain and such other measures.
CORPORATE PERFORMANCE REVIEWBackground
About the Company
SeQuent Scientific Limited (hereinafter referred to as ‘SeQuent’) is a fast growing pharmaceuticals company having presence in Human and Veterinary segments. In 2007, first generation entrepreneurs, each having more than a decade’s experience, acquired SeQuent Scientific Limited. The Company has evolved into an integrated player in the pharmaceuticals segment, with footprints in API (Human and Veterinary), Formulations (Veterinary) and CRAMS. Besides, the Company is also a leading producer of specialty chemicals. The Company has seven units across the country, including two state-of-the-art R&D centres – in Mangalore and Bengaluru. SeQuent is also the leading producer of Anthelmentic APIs in the world.
The year 2012-13
2012-13 was a mixed year for SeQuent. While we continued to face external challenges including rising input costs, higher competition in key markets and rising finance costs, we continued to strengthen our product profile, made inroads into newer markets and improved capacity utilization through debottlenecking initiatives. In wake of the cost pressures, coupled with capacity constraints, we registered a mute financial performance for the year. We continued to utilize this phase to invest in key strengths like people, processes, products and markets. However, there were certain achievements during this year, which make us confident of posting a better performance in the coming years.
Management Discussion & Analysis39
An
nu
al Rep
ort 2012-13
We received an US FDA approval for our API Drug
Manufacturing facility at Mangalore, Karnataka
(SeQuent Mangalore). This facility has earlier received
quality approval from TGA, Australia and certified
by World Health Organisation, Geneva under its
Prequalification’s of Medicines Programme.The
SeQuent Mangalore facility is ISO 9001 certified for
Quality Management systems and ISO 14000 certified
for Environment Management systems. This state-
of-the-art facility engaged in the development and
manufacture of APIs and API Intermediaries.
We entered into a business relationship with Shasun
Pharmaceuticals Limited (Shasun) to form a Joint
Venture Company (JVC) to develop, manufacture
and sell veterinary products inclusive of both API
(Active Pharmaceutical Ingredients) and formulations
in the global market. Together, with Shasun we aim
to quickly and effectively offer a range of veterinary
products globally through the JVC. This joint venture
brings both the companies one step closer to
providing highest quality veterinary products and
supports their strategy to enter key, fast- growing
markets. SeQuent will own 73% of the JVC and
Shasun will own the remaining 27% ownership in
the JVC. The creation of the JVC is subject to the
requisite corporate and statutory approvals, as may
be applicable and is expected to operate from Q1
2014.
The Company filed 4 new drug master files, taking
the total DMFs filed as on March 31, 2013 to 37.
Launched six new products during the year
Commenced revenues from Vet Formulations division
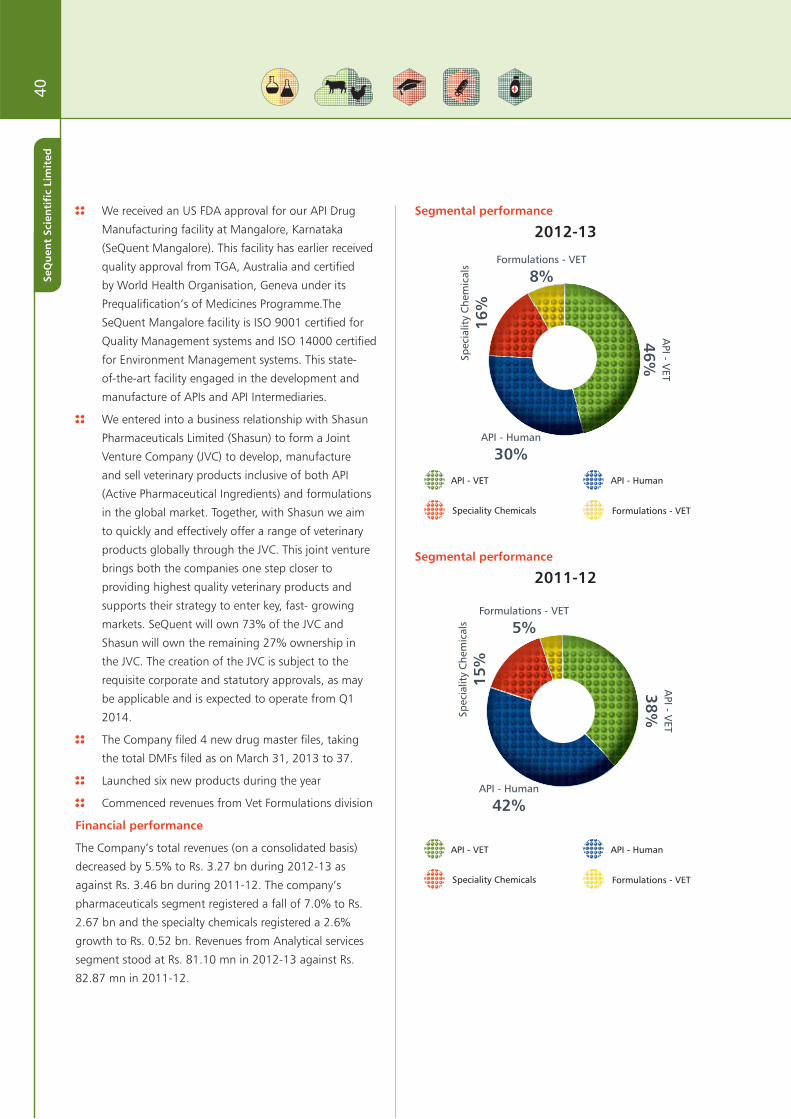
Financial performance
The Company’s total revenues (on a consolidated basis)
decreased by 5.5% to Rs. 3.27 bn during 2012-13 as
against Rs. 3.46 bn during 2011-12. The company’s
pharmaceuticals segment registered a fall of 7.0% to Rs.
2.67 bn and the specialty chemicals registered a 2.6%
growth to Rs. 0.52 bn. Revenues from Analytical services
segment stood at Rs. 81.10 mn in 2012-13 against Rs.
82.87 mn in 2011-12.
Segmental performance
2012-13
API - Human
Formulations - VETSpeciality Chemicals
API - VET
Formulations - VET
8%
API - V
ET
46%
API - Human
30% Sp
ecia
lity
Che
mic
als
16%
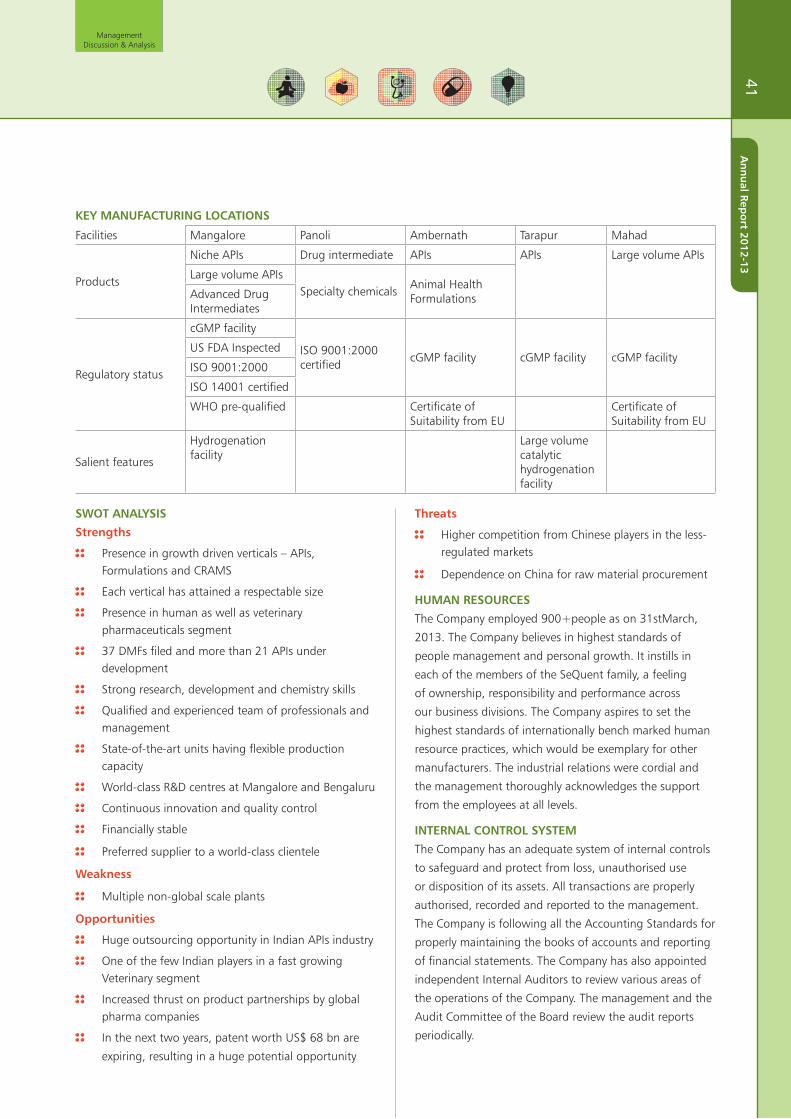
Segmental performance
2011-12
API - Human
Formulations - VETSpeciality Chemicals
API - VET
Formulations - VET
5%
API - V
ET
38%
API - Human
42%
Spec
ialit
y C
hem
ical
s
15%
40Se
Qu
ent
Scie
nti
fic
Lim
ited
SWOT ANALYSIS
Strengths
Presence in growth driven verticals – APIs, Formulations and CRAMS
Each vertical has attained a respectable size
Presence in human as well as veterinary pharmaceuticals segment
37 DMFs filed and more than 21 APIs under development
Strong research, development and chemistry skills
Qualified and experienced team of professionals and management
State-of-the-art units having flexible production capacity
World-class R&D centres at Mangalore and Bengaluru
Continuous innovation and quality control
Financially stable
Preferred supplier to a world-class clientele
Weakness
Multiple non-global scale plants
Opportunities
Huge outsourcing opportunity in Indian APIs industry
One of the few Indian players in a fast growing Veterinary segment
Increased thrust on product partnerships by global pharma companies
In the next two years, patent worth US$ 68 bn are
expiring, resulting in a huge potential opportunity
Threats
Higher competition from Chinese players in the less-regulated markets
Dependence on China for raw material procurement
HUMAN RESOURCES
The Company employed 900+people as on 31stMarch,
2013. The Company believes in highest standards of
people management and personal growth. It instills in
each of the members of the SeQuent family, a feeling
of ownership, responsibility and performance across
our business divisions. The Company aspires to set the
highest standards of internationally bench marked human
resource practices, which would be exemplary for other
manufacturers. The industrial relations were cordial and
the management thoroughly acknowledges the support
from the employees at all levels.
INTERNAL CONTROL SYSTEM
The Company has an adequate system of internal controls
to safeguard and protect from loss, unauthorised use
or disposition of its assets. All transactions are properly
authorised, recorded and reported to the management.
The Company is following all the Accounting Standards for
properly maintaining the books of accounts and reporting
of financial statements. The Company has also appointed
independent Internal Auditors to review various areas of
the operations of the Company. The management and the
Audit Committee of the Board review the audit reports
periodically.
KEY MANUFACTURING LOCATIONS
Facilities Mangalore Panoli Ambernath Tarapur Mahad
Products
Niche APIs Drug intermediate APIs APIs Large volume APIs
Large volume APIsSpecialty chemicals
Animal Health FormulationsAdvanced Drug
Intermediates
Regulatory status
cGMP facility
ISO 9001:2000 certified
cGMP facility cGMP facility cGMP facilityUS FDA Inspected
ISO 9001:2000
ISO 14001 certified
WHO pre-qualified Certificate of Suitability from EU
Certificate of Suitability from EU
Salient features
Hydrogenation facility
Large volume catalytic hydrogenation facility
Management Discussion & Analysis41
An
nu
al Rep
ort 2012-13
Risk Management
INVESTOR PERCEPTION RISK
Being an integrated pharmaceutical player
with presence in diversified segments can lead
to negative investor perception relating to core
business focus of the company.
Mitigation measures
The company’s core business is Pharmaceuticals (comprising of growth ready verticals in Human and Veterinary segments), while the specialty chemicals business remains non-core and generates liquidity for the Company on account of its novel products.
Each business vertical is headed by core sector specialists and dedicated professionals, bringing the requisite expertise and focus.
Over the years, the Company has invested in each of its core verticals and has attained a critical mass in each of them.
A diverse business mix has enabled the company to insulate itself from cyclicality or lower demand in a particular segment.
1
REGULATORY RISK
Getting approval for facilities and products
from various authorities is a time-taking
exercise. The delay caused can lead to loss of
potential revenues in wake of opportunity.
Mitigation measures
This is an industry-wide risk owing to the highly regulated nature of the sector in high-consumption markets
The risk of delay in regulatory inspection is non-controllable; however, the Company has invested in highest standards of quality practices and control and if confident of clearing inspections.
2
42Se
Qu
ent
Scie
nti
fic
Lim
ited

COMPETITION RISK
Competition from global as well as local
players can have an adverse impact on the
Company’s margins.
Mitigation measures
The global pharmaceuticals industry seeks not only cost arbitrage but also a proven expertise in creating quality products.
However, being cost efficient is the key towards sustained growth, given the falling margins and lower R&D spends of the global innovator companies.
Having proven our ability as an agile and efficient player, we have focused on offering niche products across our business verticals.
These products require dedicated expertise and specialisation that the global players are not willing to impart on account of their scale and cost-benefit parameters.
The Company’s ability to offer products has elevated it among the favoured producers of niche molecules and APIs in Human and Veterinary segments.
An inherent trait, we have remained focused on cost reduction on a continuous basis across our units.
3
QUALITY RISK
Any quality defect in the Company’s products
can lead to huge losses at client’s end as well
as its own loss of reputation.
Mitigation measures
The Company has a ‘zero tolerance‘ policy on quality.
Each of its units is certified by credible authorities and has successfully passed key client audits.
A dedicated department in each unit takes care of stringent quality control and quality assurance practices at every product/process level.
4
ENVIRONMENT AND SAFETY RISK
Non-compliance with environment protection
policies or safety related issues could dent
operation and can also impair quality
standards.
Mitigation measures
The Company lays a great emphasis on the proactive environment and health safety compliance.
A dedicated EHS Policy is formulated and strictly adhered to protect its employees, the environment and the public at every stage of its business activity.
During 2012-13, the company has critically examined and further strengthened its environment and safety practices/equipment/audits across all its units
Environment Management Systems are in place at each site to continuously monitor progress in this area.
5
Management Discussion & Analysis43
An
nu
al Rep
ort 2012-13
CORPORATE GOVERNANCE REPORT
44Se
Qu
ent
Scie
nti
fic
Lim
ited

The detailed report on Corporate Governance as per the format prescribed by SEBI and incorporated in Clause 49 of the
Listing Agreement is set out below:
1. COMPANY’S PHILOSOPHY ON CODE OF GOVERNANCE
Your Company believes in creating wealth for all its shareholders. In pursuit of this objective, the Policies of the Company
are designed to strengthen the ability of the Board of Directors to supervise the management and to enhance long-term
shareholder value.
All decisions are taken in the interest of the shareholders. The Board and the management are aware and conscious of
minority shareholder’s interest, and everything is done to enhance shareholders value in totality. Hence, considerable
emphasis is placed on accountability in decision-making and ethics in implementing them.
Adequate and timely information is critical to accountability. SeQuent Scientific Limited believes to act in the spirit of law
and not just the letter of law. We aim at providing complete transparency in our operations.
2. BOARD OF DIRECTORS:
Composition of Board
The composition of Board of directors of the Company is an appropriate combination of Executive and Non executive
Directors with right element of independence. As on date the Board consists of four Directors. Fifty percent of the Board
consists of Non-Executive Independent Directors.
Meetings held during the year
During the financial year ended March 31, 2013, 4 (Four) board meetings were held. These meetings were held on May
24, 2012, August 14, 2012, November 7, 2012 and February 14, 2013.
Composition of the board and directorships held as at March 31, 2013
Sl.No Name of the Director Category of Directorship
Number of other
Directorships
Number of memberships
in other Board committees
Chairmanships in other Board Committees
1 Mr. K R Ravishankar Promoter & Executive Director
4 1 -
2 Dr. Gopakumar G Nair Independent Director 3 - 2
3 Mr. Kannan Ramanujam Independent Director 1 - -
4 Dr. Gautam Kumar Das Executive Director 2 - -
Notes:
1. No. of other directorships include directorships in Public Limited Companies and Private Limited Companies which are subsidiaries
of Public Limited Companies and exclude directorships in Private Limited Companies, Foreign Companies, Section 25 Companies
and Alternate Directorships, if any.
2. The Disclosure excludes directorship and the committee chairmanships and memberships in the Company.
3. The disclosure includes memberships and chairmanships of Audit Committees and Shareholders/ Investors Grievance Committees
and excludes all other memberships and chairmanships in other committees.
4. No. of committee memberships and chairmanships in all Public Limited Companies considered for the purpose of disclosure and
all other companies including Private Limited Companies, Foreign Companies and Companies under Section 25 of the Companies
Act have been excluded.
5. None of the directors holds directorships in more than fifteen companies, memberships in more than ten Committees and
chairmanships in more than five Committees across all companies in which he is a director.
6. None of the directors is related to any other Director in the Company.
Corporate Governance Report
45A
nn
ual R
epo
rt 2012-13

Attendance at Board meetings and last Annual General Meeting
The attendance of each Director at Board Meeting held during the year and the last Annual General Meeting (AGM) is as under:
Sl. No Name of the Director No. of Meetings Held
Attendance at the Board Meetings
Attendance at the Last AGM
1 Mr. K R Ravishankar 4 2 --
2 Dr. Gopakumar G Nair 4 4 Present
3 Mr. Kannan Ramanujam 4 4 Present
4 Dr. Gautam Kumar Das 4 4 Present
3. AUDIT COMMITTEE:
Terms of Reference
The Company has an independent Audit Committee. The composition, procedures, powers and role/functions of the Audit Committee, constituted by the Company, comply with requirements of the Companies Act, 1956 and those of the Listing Agreement.
The Audit Committee has the following
responsibilities/ powers:
Overseeing the Company’s overall financial reporting process and to ensure that financial statements are correct, sufficient and credible.
Reviewing with management on the quarterly and annual financial statements, before submitting to the Board, with primary focus on accounting policies and practices and compliance therewith, stock exchange requirements and other legal requirements concerning financial statements.
Reviewing the adequacy of the internal control system, internal audit and their reports.
Role of Audit Committee
The role of the Audit Committee includes the following:
1. Oversight of the Company’s financial reporting process and the disclosure of its financial information to ensure that the financial statement is correct, sufficient and credible.
2. Recommending to the Board, the appointment, re-appointment and, if required, the replacement or removal of the statutory auditor and the fixation of audit fees.
3. Approval of payment of statutory auditors for any other services rendered by the statutory auditors.
4. Reviewing, with the management, the annual financial statements before submission to the board for approval, with particular reference to:
a. Matters required to be included in the Director’s Responsibility Statement to be included in the Board’s report in terms of Clause (2AA) of Section 217 of the Companies Act, 1956.
b. Changes, if any, in accounting policies and practices and reasons for the same.
c. Major accounting entries involving estimates based on the exercise of judgment by management.
d. Significant adjustments made in the financial statements arising out of audit findings.
e. Compliance with listing and other legal requirements relating to financial statements.
f. Disclosure of any related party transactions.
g. Qualifications in the draft audit report.
5. Reviewing with the management, the quarterly financial statements before submission to the board for approval.
6. Reviewing with the management, the statement of uses/ application of funds raised through an issue (public issue, right issue, preferential issue etc.), the statement of funds utilized for purposes other than those stated in the offer document/ prospectus/ notice and the report submitted by the monitoring agency monitoring the utilization of proceeds of a public or right issue, and making appropriate recommendations to the Board to take up steps in this matter.
46Se
Qu
ent
Scie
nti
fic
Lim
ited
7. Reviewing with the management, performance of statutory and internal auditors, and adequacy of the internal control systems.
8. Reviewing the adequacy of internal audit function, if any, including the structure of the internal audit department, staffing and seniority of the official heading the department, reporting structure coverage and frequency of internal audit.
9. Discussion with internal auditors any significant findings and follow up there on.
10. Reviewing the findings of any internal investigations by the internal auditors into matters where there is suspected fraud or irregularity or a failure of internal control
systems of a material nature and reporting the matter to the Board.
11. Discussion with statutory auditors before the audit commences, about the nature and scope of audit as well as post audit discussion to ascertain any area of concern.
12. To look into the reasons for substantial defaults in the payment to the depositors, debenture holders, shareholders (in case of non payment of declared dividends) and creditors, if any.
13. To seek information from any employee;
14. To obtain outside legal or other professional advice;
15. To secure attendance of outsiders with relevant expertise, if it considers necessary.
Composition of Audit Committee, Meetings held and attendance during the year
During the financial year ended March 31, 2013, 4 (Four) Audit Committee Meetings were held. These meetings were held on May 24, 2012, August 14, 2012, November 7, 2012 and February 14, 2013.
As on date the Committee has three members consisting of two non-executive Independent Directors and the Managing Director of the Company.
Details of Members and meetings attended by them during the year are as under:
Sl. No. Member Chairman/ Member No. of Meetings Held
No. of meetings attended
1 Mr. Kannan Ramanujam Chairman 4 4
2 Dr. Gopakumar G Nair Member 4 4
3 Mr. K R Ravishankar Member 4 2
The Company Secretary of the Company also acts as the secretary to the Committee.
4. REMUNERATION COMMITTEE:
Terms of Reference
The Company has constituted a committee called Remuneration Committee to determine on the behalf of the Board
and on behalf of the shareholders with agreed terms of reference, the company’s policy on specific remuneration
packages for executive directors including pension rights and any compensation payment.
The Committee also functions as the Compensation Committee as prescribed under the SEBI (Employees Stock Option
Scheme and Employees Stock Purchase Scheme) Guidelines, 1999.
Composition of Remuneration Committee
As on date, members of the Remuneration Committee are Mr. Kannan Ramanujam and Dr. Gopakumar G Nair, who are
non-executive independent directors of the Company. During the financial year ended March 31, 2013 the committee
met on August 14, 2012.
Details of Members and meetings attended by them during the year are as under:
Sl. No. Member Chairman/ Member No. of Meetings Held
No. of meetings attended
1 Mr. Kannan Ramanujam Chairman 1 1
2 Dr. Gopakumar G Nair Member 1 1
Corporate Governance Report
47A
nn
ual R
epo
rt 2012-13
Remuneration Policy
The Remuneration Committee recommends the compensation package to the executive directors of the Company. The remuneration will include salary, perquisite, allowances and commission. The remuneration policy is directed towards rewarding performance based on review of achievements. It is aimed at attracting and retaining high caliber talent.
Remuneration paid to Directors
(` In Milion)
Name of the Director Salary Benefits Bonus Sitting Fees Total
Mr. K R Ravishankar(Managing Director)(refer note 1)
47.86 - - - 47.86
Dr. Gautam Kumar Das(Joint Managing Director)(refer note 2)
14.95 - - - 14.95
Dr. Gopakumar G Nair (Independent Director)
- - - 0.08 0.08
Mr. Kannan Ramanujam(Independent Director)
- - - 0.08 0.08
Note 1 – Includes Rs. 23.80 Million of earlier years which is accounted in the current year pursuant to the central government approval.
Note 2 – Includes Rs. 4.32 Million of earlier years which is accounted in the current year pursuant to the central government approval.
As at March 31, 2013 none of the directors holds stock options of the Company.
5. THE SHAREHOLDERS/ INVESTORS GRIEVANCE COMMITTEE The Shareholders/ Investors grievance committee has been constituted in terms of the provisions related thereto in the
Listing agreement entered with the Stock Exchanges under the chairmanship of a non-executive independent director to specifically look into the redressal of shareholder and investors complaints like transfer of shares, non-receipt of annual reports, non-receipt of declared dividends etc.
As on the date Committee comprises of two independent directors and the Managing Director of the Company. Members of the Committee are Dr. Gopakumar G Nair, Mr. Kannan Ramanujam and Mr. K R Ravishankar. The Committee is headed by Mr. Kannan Ramanujam, a non-executive independent director of the Company.
During the financial year ended March 31, 2013, 4 (Four) Meetings were held. These meetings were held on May 24, 2012, August 14, 2012, November 7, 2012 and February 14, 2013.
Sl. No. Member Chairman/ Member No. of Meetings Held
No. of meetings attended
1 Mr. Kannan Ramanujam Chairman 4 4
2 Dr. Gopakumar G Nair Member 4 4
3 Mr. K R Ravishankar Member 4 2
Mr. Preetham Hebbar, Company Secretary also acts as the Compliance Officer of the Company.
The Committee has delegated the power of share transfer to the Compliance Officer of the Company. The delegated authority will attend for the matter of share transfer formalities on a regular basis.
48Se
Qu
ent
Scie
nti
fic
Lim
ited

Shareholders Complaint details
Type of Complaint
No. of shareholders’ complaints received
during the year
No. of Complaints not solved to the satisfaction
of shareholdersNo. of pending
complaints
Non receipt of Dividend Warrants 5 - -
Non receipt of Share Certificates - - -
Non receipt of Annual Reports - - -
Others - - -
Total 5 - -
All the complaints were solved to the satisfaction of the Shareholders.
The designated email address for shareholders complaints is [email protected]
6. GENERAL BODY MEETINGS The location and time of the last three Annual General Meetings of the Company are as below:
Financial Year Date Location of Meeting Time
2009-10 27.09.2010 Hotel Satkar Residency, Thane (W) 11.00 a.m.
2010-11 29.11.2011 Hotel Fortune Park Lake city,Thane (W)
11.30 a.m.
2011-12 26.09.2012 Hotel Fortune Park Lake city,Thane (W)
11.30 a.m.
Details of Special resolutions passed in Annual General Meetings held during the last three years:
Date of AGMWhether any special
resolution passed Special Resolutions passed
27.09.2010 Yes 1. Authorization to make loan, give guarantee or provide security exceeding the limits as prescribed under 372A of Companies Act, 1956.
29.11.2011 Yes 1. Confirmation of appointment of Mr. K.R.N. Moorthy as Whole Time Director
26.09.2012 Yes 1. Allotment of 2,100,000 warrants to promoter group entities
2. Increase in managerial remuneration of Dr. Guatam Kumar Das
Details of resolution passed through Postal Ballot:
During the year ended March 31, 2013, the Company sought the approval of its members, through a postal ballot, to provide a corporate guarantee of Rs. 900,000,000 (Rupees Nine Hundred Million) in favor of State Bank of Hyderabad and State Bank of Travancore in respect of credit facilities sanctioned by them to Sequent Penems Private Limited, a subsidiary of the Company under Sec 372A of the Companies Act, 1956.
Sl. No Item No. of Valid Votes Polled
Votes Cast
For Against
1. Approval under Sec 372A of the Companies Act, 1956
11,732,647 11,731,128(representing 99.99% of
the total valid votes polled)
1,519(representing 0.1% of the total valid votes polled)
The resolution was passed on September 25, 2012. Mr. Binoy Chacko, Practicing Company Secretary was appointed as Scrutinizer to conduct the postal ballot exercise.
The Company follows the procedure as provided in Companies (Passing of Resolution by Postal Ballot) Rules, 2001 and any amendments thereto to conduct postal ballots.
Corporate Governance Report
49A
nn
ual R
epo
rt 2012-13
7. DISCLOSURES: i. The Company has not entered into any transaction of a material nature with the promoters, Directors or
Management, their subsidiaries or relatives that may have potential conflict with the interest of the Company at large. The Register of Contracts containing the transactions in which Directors are interested is placed before the Board regularly for its approval. Transactions with related parties are disclosed in Note 28.3 (Standalone) and Note 29.4 (Consolidated) to the financial statements in the Annual Report.
ii. The Company has complied with the requirements of the Stock Exchanges, SEBI and other statutory authorities on matters relating to capital markets during the last 3 years. No penalties or strictures have been imposed on the Company by the Stock Exchange or SEBI or any statutory authorities relating to the above.
iii. Company is in compliance with all mandatory requirements of clause 49 of the listing agreement.
iv. As regards adoption of non-mandatory requirements as contained in Annexure 1-D to clause 49 of the listing agreement, the Company has implemented the requirements with relation to constitution of remuneration committee and matters related therewith.
v. The reports of internal auditors are regularly being placed before the Audit Committee on a quarterly basis and the risk assessment and mitigation recommendations forms part of their presentation to the Audit Committee. M/s. Mahajan & Aibara, Chartered Accountants were the internal auditors of the Company for the financial year 2012-13. For the financial year 2013-14 the Company has appointed Grant Thornton International as internal auditors of the Company.
8. RE-APPOINTMENT OF DIRECTOR Dr. Gopakumar G Nair, an Independent Director of the Company retires by rotation at this ensuing Annual General
Meeting and being eligible offered himself for re-appointment at the Annual General Meeting.
Dr. Nair is a non-executive Independent Director on the Board. With his 40 years’ experience and knowledge in pharmaceutical and chemical industry at different levels and positions like Director, Chairman & Managing Director, as well as Past-President of Indian Drug Manufacturers’ Association. Dr. Gopakumar Nair had the opportunity to familiarize himself with GATT, WTO, TRIPs and other IP laws over the years. It is with this wealth of experience that Dr. Nair became an IP/ Patent practitioner under the name Gopakumar Nair Associates. He is also Editor of various Scientific Research and Industry Publications.
As on March 31, 2013 Dr. Nair holds 23,348 shares of the Company.
Details of other directorship/ committee memberships of Dr. Nair
Sl.No. Name of Company Committee Membership
1. Ultramarine & Pigments Limited Audit Committee (Chairman) Shareholders Grievance Committee (Chairman)
2. Glochem Industries Limited Nil
3 Gnanlex Hermeneutics Private Limited Nil
Details of Shareholding of Non-Executive Directors
In terms of Clause 49(IV)(E)(iv) of the Listing Agreement, the details of shares held by Non-Executive Directors are as under:
Name No. of shares held as at March 31, 2013
Dr. Gopakumar G Nair 23,348
Mr. Kannan Ramanujam Nil
9. MEANS OF COMMUNICATION: (a) The quarterly results are forthwith communicated to the Bombay Stock Exchange as soon as they are approved and
taken on record by the Board of Directors of the Company.
(b) The results are published in the newspapers namely The Free Press Journal, The Business Standard (English) and Nav-Shakti (Marathi).
(c) The results and Share Holding Pattern of the Company are displayed on the website of the Company i.e. www.sequent.in.
(d) The official news releases, if released will be intimated to stock exchange and also displayed on the website of the Company.
50Se
Qu
ent
Scie
nti
fic
Lim
ited

10. GENERAL SHAREHOLDER INFORMATION:
AGM Day, Date and Time Friday, September 27, 2013, 11.30 a.m.
Venue Hotel Satkar Residency, Pokhran Road No. 01 Next to Cadbury, Opp. Singhania High School, Thane (W), Maharashtra - 400 606
Financial Year April 1, 2012 to March 31, 2013
Date of Book Closure September 25, 2013 to September 27, 2013
Dividend payment date NA
Listing on Stock Exchanges The equity shares of the Company are listed on the Bombay Stock Exchange Limited
Stock Code : 512529
ISIN : INE807F01019
The Company has paid listing fee for the year 2013 -2014 to the Stock Exchange and there are no outstanding payments from the Company.
Registrar & Transfer Agents M/s. Adroit Corporate Services Private Limited19, Jaferbhoy Industrial Estate, 1st Floor, Makhwana Road, Marol Naka, Andheri (E),Mumbai – 400 059.Contact Person: Mr. Pratap Pujare Phone No. +91 22 42270423Email Address: [email protected]
Share transfer system The shares of the Company tradable compulsorily in demat mode.
Physical share transfers are attended on a regular basis and the Company Secretary is authorized to approve such transfers.
Address for correspondence Mr. Preetham Hebbar Company SecretarySeQuent Scientific LimitedCorporate Office,Star -2 , Opp: IIM – B, Bannerghatta Road,Bilekahalli, Bangalore – 560 076Phone No. +91 80 67840338Email Address: [email protected]
Market Price Data (High, Low during each
month in financial year 2012-13)
Month High Low
Apr 12 95.00 68.50
May 12 93.95 75.00
Jun 12 107.50 74.05
Jul 12 129.90 101.00
Aug 12 133.70 104.00
Sep 12 149.80 105.40
Oct 12 191.60 142.00
Nov 12 199.00 141.00
Dec 12 257.00 171.10
Jan 13 239.00 163.00
Feb 13 187.75 145.00
Mar 13 168.00 105.00
Performance in comparison to SENSEX:
Monthly closing price analysis
Month Sensex SeQuent
Apr 12 17,318.81 91.15
May 12 16,218.53 78.15
Jun 12 17,429.98 107.50
Jul 12 17,236.18 105.00
Aug 12 17,429.56 109.05
Sep 12 18,762.74 144.10
Oct 12 18,505.38 161.35
Nov 12 19,339.90 184.70
Dec 12 19,426.71 228.20
Jan 13 19,894.98 179.65
Feb 13 18,861.54 154.55
Mar 13 18,835.77 129.85
Corporate Governance Report
51A
nn
ual R
epo
rt 2012-13
Distribution Schedule as at March 31, 2013:
Slab of Shareholding
No. of Shareholders
% to total number of Shareholders
Total No. of Shares
Amount (in Rs.)
% to total paid up capital
Upto 5,000 2,022 79.88 285,273 2,852,730.00 1.195,001 – 10,000 202 8.07 159,143 1,591,430.00 0.7110,001 – 20,000 132 5.26 191,925 1,919,250.00 0.8620,001 – 30,000 42 1.66 104,500 1045,000.00 0.4330,001 – 40,000 23 0.95 48,959 489,590.00 0.3540,001 – 50,000 19 0.75 92,133 921,330.00 0.3850,001-100,000 30 1.19 210,478 2,104,780.00 0.88100,001 & above 51 2.14 22,942,780 229,427,800.00 95.20Total 2,521 100.00 24,035,191 240,351,910.00 100.00
ParticularsNo. of
Shareholders% to total number
of ShareholdersTotal No. of
SharesAmount
(in Rs.)% to total paid
up capitalShares held in Electronic Mode
2,515 99.76 23,324,936 233,249,360.00 97.04
Shares held in physical mode
6 0.24 710,255 7,102,550.00 2.96
Total 2,521 100.00 24,035,191 240,351,910.00 100.00
Shareholding pattern as at March 31, 2013:
CategoryNumber of
shareholdersNumber of shares held
% to total paid up capital
Promoters & Promoter Group Companies 7 14,534,511 60.47Bodies Corporate 158 934,362 3.89Banks / Mutual Funds/ Financial Institutions (FIs) - - -Foreign Institutional Investors (FIIs) 1 41,000 0.17Non-Resident Individuals (NRIs)/ Foreign Corporate Bodies/ Overseas Corporate Bodies (OCBs)/ Foreign Banks
48 5,070,622 21.10
Resident Individuals 2,286 2,724,526 11.34Directors (Excluding promoter directors) & their
relatives
1 23,348 0.10
Trusts 2 700,050 2.91Others 18 6,772 0.03Total 2,521 24,035,191 100.00
Dematerialization of shares and liquidity:
The Company’s shares are tradable compulsorily in dematerialized form. The Company has established connectivity with both the Depositories viz., National Securities Depository Limited (NSDL) and Central Depository Services (India) Limited (CDSL) through Adroit Corporate Services Private Limited, Registrars and Share Transfer Agents.
Outstanding ADRs/GDRs/warrants/ other convertible instruments:
Warrants: The shareholders of the Company approved the allotment of 2,750,000 warrants on preferential basis to the promoter group companies in their Extra Ordinary General meeting held on March 20, 2013. Pursuant to this the Company issued 1,375,000 warrants to Chayadeep Ventures LLP and 1,375,000 warrants to Agnus Capital LLP on March 30, 2013. These warrants are convertible into equivalent number of fully paid up equity shares at a price of Rs.172.00 per warrant (including a premium of Rs. 162 per warrant) in one or more tranches, at any time within a period of 18 months from the date of issue.
ESOPs: Company has framed an Employee Stock Option plan titled ‘SSL ESOP Scheme 2010’ (ESOP Plan) to reward employees of the Company. The ESOP Plan of the Company was approved by the shareholders on March 28, 2008.
52Se
Qu
ent
Scie
nti
fic
Lim
ited
However Board in its meeting has modified some of the provisions of ESOP Plan. Modified ESOP Plan was approved by the shareholders on May 24, 2010 through Postal Ballot. The ESOP plan of the Company will be administered through a trust. For this purpose the Company had established a trust, having independent directors as its trustees. Under the said plan company has allotted 700,000 equity shares of Rs. 10/- each to the Trust at a price of Rs. 113/- per share. As at March 31, 2013 no stock options were outstanding.
As at March 31, 2013 the Company has no ourstanding ADRs and GDRs.
Plant Locations
1. Plot No. 7 & 8, MIDC Engineering Zone, Kalyan Badlapur Road, Ambernath, Maharashtra
2. B-32, G-2, G-3, MIDC, Mahad, Dist. Raigad, Maharashtra
3. A-68 & 69, Additional Ambernath, MIDC Indl. Area, Ambernath (East), Dist. Thane, Maharashtra
4. Plot No. 150, 151, 152, 136, 137, 138, 139, 140 &141 MIDC, Tarapur, Boisar, Thane, Maharashtra
5. 120 A & B Industrial Area, Baikampady, New Mangalore, Karnataka
6. Plot No. 26 & 26B, GIDC Industrial Estate, Panoli, Dist. Bharuch, Guajarat
7. A-14, MIDC, Phase I, Dombivali (E), Dist. Thane, Maharashtra
11. CODE OF CONDUCT The Board has prescribed Code of Conduct (“Code”) for all Board Members and Senior Management of the Company.
The Code of Conduct is also posted on the website of the Company.
All Board Members and Senior Management personnel have confirmed compliance with the code for the year 2012 – 2013.
A declaration to this effect signed by Dr. Gautam Kumar Das, Joint Managing Director is reproduced below:
“I confirm that the Company has in respect of the year ended March 31, 2013, received from its Board Members as well as Senior Management Personnel affirmation as to compliance with the Code of Conduct.”
Dr. Gautam Kumar Das Joint Managing Director
To the Members of SeQuent Scientific Limited
We have examined the compliance of conditions of corporate governance by SeQuent Scientific Limited (‘the Company’), for the year ended on March 31 2013, as stipulated in clause 49 of the Listing Agreement of the said Company with the said stock exchange.
The compliance of conditions of Corporate Governance is the responsibility of the management. Our examination has been limited to a review of the procedures and implementations thereof, adopted by the Company for ensuring compliance with the conditions of Corporate Governance. It is neither an audit nor an expression of opinion of the financial statements of the Company.
In our opinion and to the best of our information and according to the explanations given to us, and the representations made by the Directors and the management, we certify that the Company has complied with the conditions of Corporate Governance as stipulated in clause 49 of the above-mentioned Listing Agreement. We further state that such compliance is neither an assurance as to the future viability of the Company nor the efficiency or effectiveness with which the management has conducted the affairs of the Company.
For DELOITTE HASKINS & SELLS Chartered Accountants
(Registration No.008072S)
V. Srikumar Partner
Bangalore, August 14, 2013 (Membership No.84494)
Corporate Governance Report
53A
nn
ual R
epo
rt 2012-13

Financial statements
Standalone & Consolidated
SeQ
uen
t Sc
ien
tifi
c Li
mit
ed
To The Members ofSEQUENT SCIENTIFIC LIMITEDReport on the Financial StatementsWe have audited the accompanying financial statements of SEQUENT SCIENTIFIC LIMITED(“the Company”), which comprise the Balance Sheet as at March 31, 2013, the Statement of Profit and Loss and the Cash Flow Statement for the year then ended, and a summary of the significant accounting policies and other explanatory information.
Management’s Responsibility for the Financial StatementsThe Company’s Management is responsible for the preparation of these financial statements that give a true and fair view of the financial position, financial performance and cash flows of the Company in accordance with the Accounting Standards referred to in Section 211(3C) of the Companies Act, 1956 (“the Act”)and in accordance with the accounting principles generally accepted in India. This responsibility includes the design, implementation and maintenance of internal control relevant to the preparation and presentation of the financial statements that give a true and fair view and are free from material misstatement, whether due to fraud or error.
Auditors’ ResponsibilityOur responsibility is to express an opinion on these financial statements based on our audit. We conducted our audit in accordance with the Standards on Auditing issued by the Institute of Chartered Accountants of India. Those Standards require that we comply with ethical requirements and plan and perform the audit to obtain reasonable assurance about whether the financial statements are free from material misstatement.An audit involves performing procedures to obtain audit evidence about the amounts and the disclosures in the financial statements. The procedures selected depend on the auditor’s judgment, including the assessment of the risks of material misstatement of the financial statements, whether due to fraud or error. In making those risk assessments, the auditor considers internal control relevant to the Company’s preparation and fair presentation of the financial statements in order to design audit procedures that are appropriate in the circumstances, but not for the purpose of expressing an opinion on the effectiveness of the Company’s internal control. An audit also includes evaluating the appropriateness of the accounting policies used and the reasonableness of the accounting estimates made by the Management, as well as evaluating the overall presentation of the financial statements. We believe that the audit evidence we have obtained is sufficient and appropriate to provide a basis for our audit opinion.
OpinionIn our opinion and to the best of our information and according to the explanations given to us, the aforesaid financial statements give the information required by the Act in the manner so required and give a true and fair view in conformity with the accounting principles generally accepted in India:
(a) in the case of the Balance Sheet, of the state of affairs of the Company as at March 31, 2013;
(b) in the case of the Statement of Profit and Loss, of the loss of the Company for the year ended on that date; and
(c) in the case of the Cash Flow Statement, of the cash flows of the Company for the year ended on that date
Report on Other Legal and Regulatory Requirements1. As required by the Companies (Auditor’s Report) Order,
2003 (“the Order”) issued by the Central Government in terms of Section 227(4A) of the Act, we give in the Annexure a statement on the matters specified in paragraphs 4 and 5 of the Order.
2. As required by Section 227(3) of the Act, we report that:
(a) We have obtained all the information and explanations which to the best of our knowledge and belief were necessary for the purposes of our audit.
(b) In our opinion, proper books of account as required by law have been kept by the Company so far as it appears from our examination of those books.
(c) The Balance Sheet, the Statement of Profit and Loss and the Cash Flow Statement dealt with by this Report are in agreement with the books of account.
(d) In our opinion, the Balance Sheet, the Statement of Profit and Loss and the Cash Flow Statement comply with the Accounting Standards referred to in Section 211(3C) of the Act.
(e) As explained in Note 31, the Company has not received a written representation from one of the director of the Company as on March 31, 2013 confirming that he is not disqualified from being appointed as a director of the Company in terms of Section 274(1)(g) of the Companies Act,1956. In the absence of such a written representation, we are unable to comment on whether he is disqualified from being appointed as director of the Company in terms of Section 274(1)(g) of the Companies Act, 1956.On the basis of the written representations received from the other directors as on March 31, 2013 taken on record by the Board of Directors, none of the directors is disqualified as on March 31, 2013 from being appointed as a director in terms of Section 274(1)(g) of the Act.
For DELOITTE HASKINS & SELLS Chartered Accountants (Firm Registration No. 008072S)
V. Srikumar Partner (Membership No. 84494)
Mumbai, May 30, 2013
Independent AUDITORS’ REPORT
Financial Statements55
An
nu
al Rep
ort 2012-13
Having regard to the nature of the Company’s business/activities/results during the year, clauses iii (d), vi, xii, xiii, xiv, xix and xx of paragraph 4 of the Order are not applicable to the Company. (i) In respect of its fixed assets: (a) The Company has maintained proper records
showing full particulars, including quantitative details and situation of the fixed assets.
(b) The fixed assets were physically verified during the year by the Management in accordance with a regular programme of verification which, in our opinion, provides for physical verification of all the fixed assets at reasonable intervals. According to the information and explanation given to us, no material discrepancies were noticed on such verification.
(c) The fixed assets disposed off during the year, in our opinion, do not constitute a substantial part of the fixed assets of the Company and such disposal has, in our opinion, not affected the going concern status of the Company.
(ii) In respect of its inventory: (a) As explained to us, the inventories were physically
verified during the year by the Management at reasonable intervals.
(b) In our opinion and according to the information and explanation given to us, the procedures of physical verification of inventories followed by the Management were reasonable and adequate in relation to the size of the Company and the nature of its business.
(c) In our opinion and according to the information and explanations given to us, the Company has maintained proper records of its inventories and no material discrepancies were noticed on physical verification.
(iii) In respect of loans, secured or unsecured, granted by the Company to companies, firms or other parties covered in the Register under Section 301 of the Companies Act, 1956, according to the information and explanations given to us:
(a) The Company has granted loans aggregating Rs. 182.89 Million to 3 parties during the year. At the year-end, the outstanding balances of such loans aggregated Rs.110.37 Million (number of parties 2) and the maximum amount involved during the year was Rs.351.27 Million (number of parties 3).
(b) The rate of interest and other terms and conditions of such loans are, in our opinion, prima facie not prejudicial to the interests of the Company.
(c) The receipts of principal amounts and interest have been regular/as per stipulations.
In respect of loans, secured or unsecured, taken by the Company from companies, firms or other parties covered in the Register under Section 301 of the Companies Act, 1956, according to the information and explanations given to us:
a) The Company has taken loans aggregating
Rs.379.35 Million from 2 parties during the year. At the year-end, the outstanding balances of such loans aggregated Rs.349.81 Million (number of parties 2) and the maximum amount involved during the year was Rs.367.14 Million (number of parties 2).
b) The rate of interest and other terms and conditions of such loans are, in our opinion, prima facie not prejudicial to the interest of the Company.
c) The payment of principal amounts and interest in respect of such loans are regular/as per stipulations.
(iv) In our opinion and according to the information and explanations given to us, having regard to the explanations that some of the items purchased are of special nature and suitable alternative sources are not readily available for obtaining comparable quotations, there is an adequate internal control system commensurate with the size of the Company and the nature of its business with regard to purchases of inventory and fixed assets and for the sale of goods and services. During the course of our audit, we have not observed any major weakness in such internal control system.
(v) In respect of contracts or arrangements entered in the Register maintained in pursuance of Section 301 of the Companies Act, 1956, to the best of our knowledge and belief and according to the information and explanations given to us:
(a) The particulars of contracts or arrangements referred to Section 301 that needed to be entered in the Register maintained under the said Section have been so entered.
(b) In our opinion and having regard to our comments in paragraph (iv) above, with regard to purchase of certain items for which comparative quotes are not available, transactions made in pursuance of such contracts or arrangements, in excess of Rs. 5 lakhs in respect of any party, have been made at prices which are, prima facie, reasonable having regard to the prevailing market prices at the relevant times.
(vi) In our opinion, the internal audit functions carried out during the year by a firm of Chartered Accountants appointed by the Management have been commensurate with the size of the Company and the nature of its business.
(vii) We have broadly reviewed the cost records maintained by the Company pursuant to the Companies (Cost Accounting Record) Rules, 2011 prescribed by the Central Government under Section 209(1)(d) of the Companies Act, 1956 and are of the opinion that, prima facie, the prescribed cost records have been maintained. We have, however, not made a detailed examination of the cost records with a view to determine whether they are accurate or complete.
(viii) According to the information and explanations given to us in respect of statutory dues:
ANNEXURE To The Independent Auditors’ Report(Referred to in paragraph 1 under ‘Report on Other Legal and Regulatory Requirements’ section of our report of even date)
STANDALONE56
SeQ
uen
t Sc
ien
tifi
c Li
mit
ed
(a) The Company has generally been regular in depositing undisputed statutory dues, including Provident Fund, Investor Education and Protection Fund, Employees’ State Insurance, Income-tax, Sales Tax, Wealth Tax, Service Tax, Custom Duty, Excise Duty, Cess and other material statutory dues applicable to it with the appropriate authorities.
(b) There were no undisputed amounts payable in respect of Provident Fund, Investor Education and Protection Fund, Employees’ State Insurance, Income-tax, Sales Tax, Wealth Tax, Service Tax, Customs Duty, Excise Duty, Cess and other material statutory dues in arrears as at March 31, 2013 for a period of more than six months from the date they became payable.
(c) Details of dues of Income-tax, Sales Tax, Wealth Tax, Service Tax, Custom Duty, Excise Duty and Cess which have not been deposited as on March 31, 2013 on account of disputes are given below:
(` In Million)
StatuteNature of Dues
Forum where Dispute
is pending
Period to which the amount
relatesAmount involved
Income-tax Act, 1961 Income-tax Commissioner Income Tax
(Appeals), Mumbai
A.Y. 2006-2007 0.98
Income-tax Act, 1961 Income-tax Commissioner Income Tax
(Appeals), Mumbai
A.Y. 2007-2008 3.99
Income-tax Act, 1961 Income-tax Commissioner Income Tax
(Appeals), Mumbai
A.Y. 2010-2011 1.85
Maharashtra Value Added Tax Act, 2002 & Central Sales Tax Act, 1956
Value Added tax and Central
Sales tax
Deputy Commissioner of
Sales Tax
F.Y. 2005-2006 9.02
Karnataka Value Added Tax Value Added Tax
Joint Commissioner of Commercial Taxes
(Appeals)
F.Y. 2007-2008 3.31
Gujarat Value Added Tax Value Added Tax
Gujarat Value Added Tax Tribunal
F.Y. 2006-2007 0.07
(ix) The accumulated losses of the Company at the end of the financial year are not more than fifty per cent of its net worth and the Company has incurred cash losses only during the current financial year but has not incurred any cash loss during the preceding financial year.
(x) In our opinion and according to the information and explanations given to us, the Company has not defaulted in the repayment of dues to banks, financial institutions and has not issued any debenture.
(xi) In our opinion and according to the information and explanations given to us, the terms and conditions of the guarantees given by the Company for loans taken by others from banks and financial institutions are not,prima facie, prejudicial to the interests of the Company.
(xii) In our opinion and according to the information and explanations given to us, the term loans have been applied by the company during the year for the purposes for which they were obtained.
(xiii) In our opinion and according to the information and explanations given to us and on an overall examination of the Balance Sheet, we report that funds raised on short-term basis have been used during the year for long- term investment to the extent of Rs. 784.12 Million.
(xiv) According to the information and explanations given to us, the Company has made preferential allotment of shares to companies covered in the Register maintained under Section 301 of the Companies Act, 1956 at a price which, in our opinion, is prima facie not prejudicial to the interest of the Company.
(xv) To the best of our knowledge and according to the information and explanations given to us, no fraud by the Company and no material fraud on the Company has been noticed or reported during the year.
For DELOITTE HASKINS & SELLS Chartered Accountants (Firm Registration No. 008072S)
V. Srikumar Partner (Membership No. 84494)
Mumbai, May 30, 2013
Independent AUDITORS’ REPORT
Financial Statements57
An
nu
al Rep
ort 2012-13

(` In Million) NoteNo.
As at31 March 2013
As at31 March 2012
A EQUITY AND LIABILITIES1 Shareholders’ funds
(a) Share capital 2 234.40 213.40 (b) Reserves and surplus 3 741.30 1,053.73 (c) Money received against share warrants 27.1 118.79 -
1,094.49 1,267.13 2 Non-current liabilities
(a) Long-term borrowings 4 1,082.41 622.65 (b) Deferred tax liabilities (net) 28.7 - 82.41 (c) Other long-term liabilities 5 0.50 - (d) Long-term provisions 6 56.83 40.19
1,139.74 745.25 3 Current liabilities
(a) Short-term borrowings 7 1,394.65 980.87 (b) Trade payables 8 1,459.16 1,225.74 (c) Other current liabilities 9 277.42 716.01 (d) Short-term provisions 10 36.00 29.17
3,167.23 2,951.79 TOTAL 5,401.46 4,964.17
B ASSETS1 Non-current assets
(a) Fixed assets(i) Tangible assets 11 A 1,940.96 1,986.09 (ii) Intangible assets 11 B 110.00 76.79 (iii) Capital work-in-progress 160.58 93.13 (iv) Intangible assets under development 54.55 82.55
(b) Non-current investments 12 545.70 388.14 (c) Deferred tax assets (net) 28.7 0.69 - (d) Long-term loans and advances 13 341.42 162.98 (e) Other non-current assets 14 57.25 33.24
3,211.15 2,822.92 2 Current assets
(a) Current investments 15 1.77 2.77 (b) Inventories 16 826.74 631.08 (c) Trade receivables 17 701.61 824.80 (d) Cash and cash equivalents 18 310.70 157.67 (e) Short-term loans and advances 19 267.20 421.15 (f) Other current assets 20 82.29 103.78
2,190.31 2,141.25 See accompanying notes forming part of the financial statementsTOTAL 5,401.46 4,964.17
In terms of our report attachedFor DELOITTE HASKINS & SELLS For and On Behalf of the Board of DirectorsChartered Accountants
V. Srikumar Dr. Gautam Kumar Das Dr. Gopakumar G Nair Preetham HebbarPartner Joint Managing Director Director Company SecretaryMumbai, May 30, 2013
Balance Sheet as at 31 March 2013
STANDALONE58
SeQ
uen
t Sc
ien
tifi
c Li
mit
ed

(` In Million) NoteNo.
Year Ended31 March 2013
Year Ended31 March 2012
1 Revenue from operations (gross) 21 3,291.16 3,450.84 Less: Excise duty 150.66 126.54 Revenue from operations (net) 3,140.50 3,324.30
2 Other income 22 24.90 113.27 3 Total revenue (1 + 2) 3,165.40 3,437.57 4 Expenses
(a) Cost of materials consumed 23.a 1,790.60 1,807.48 (b) Purchases of stock-in-trade 23.b 99.42 85.13 (c) Changes in inventories of finished goods and
work-in-progress & intermediates23.c (129.14) 6.12
(d) Employee benefits expense 24 354.84 254.37 (e) Finance costs 25 320.45 282.65 (f) Depreciation and amortization expense 11 C 267.43 210.28 (g) Other expenses 26 1,089.91 816.50 Total expenses 3,793.51 3,462.53
5 Profit/(Loss) before tax (3-4) (628.11) (24.96)6 Tax expense:
(a) Current tax expense - 0.86(b) Deferred tax charge / (credit) (83.10) (40.50)
(83.10) (39.64)7 Profit/(Loss) for the year (5 - 6) (545.01) 14.68 8 Earnings per share (of Rs.10 each):
Basic and Diluted 28.6 (24.01) 0.67 See accompanying notes forming part of the financial statements
In terms of our report attachedFor DELOITTE HASKINS & SELLS For and On Behalf of the Board of DirectorsChartered Accountants
V. Srikumar Dr. Gautam Kumar Das Dr. Gopakumar G Nair Preetham HebbarPartner Joint Managing Director Director Company SecretaryMumbai, May 30, 2013
Statement of Profit & loss for the year ended 31 March 2013
Financial Statements59
An
nu
al Rep
ort 2012-13
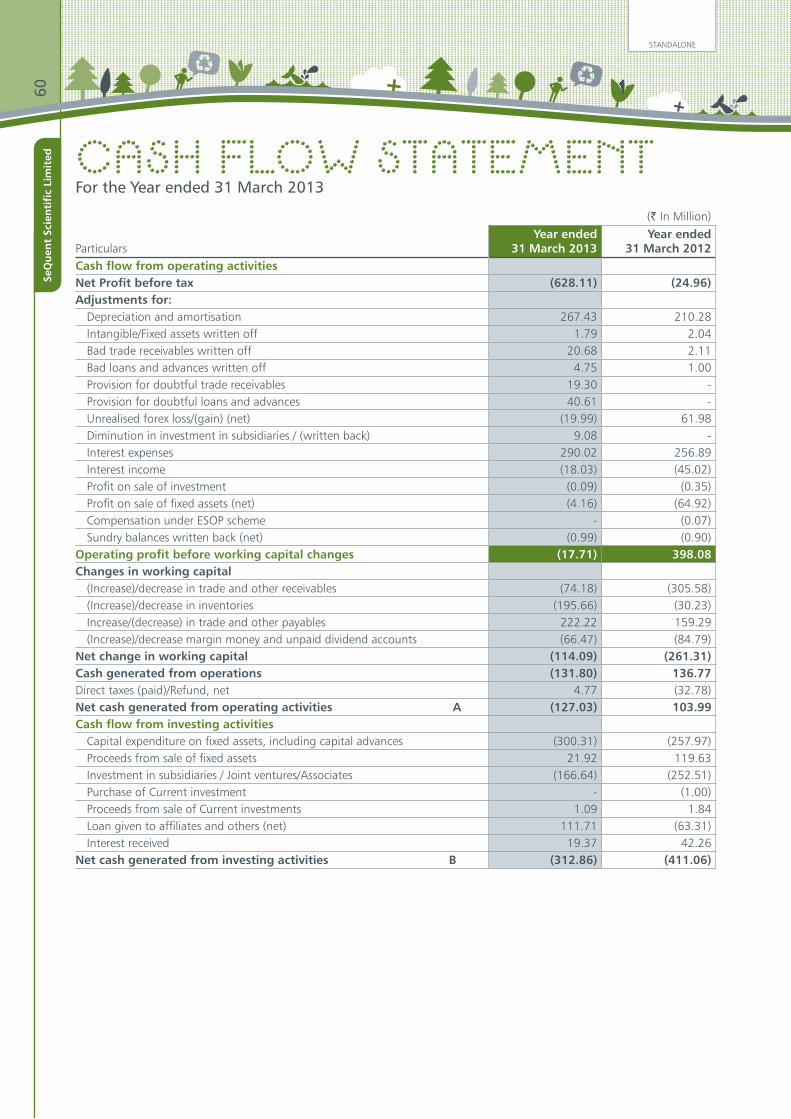
(` In Million)
ParticularsYear ended
31 March 2013 Year ended
31 March 2012 Cash flow from operating activitiesNet Profit before tax (628.11) (24.96)Adjustments for:
Depreciation and amortisation 267.43 210.28 Intangible/Fixed assets written off 1.79 2.04 Bad trade receivables written off 20.68 2.11 Bad loans and advances written off 4.75 1.00 Provision for doubtful trade receivables 19.30 - Provision for doubtful loans and advances 40.61 - Unrealised forex loss/(gain) (net) (19.99) 61.98 Diminution in investment in subsidiaries / (written back) 9.08 - Interest expenses 290.02 256.89 Interest income (18.03) (45.02)Profit on sale of investment (0.09) (0.35)Profit on sale of fixed assets (net) (4.16) (64.92)Compensation under ESOP scheme - (0.07)Sundry balances written back (net) (0.99) (0.90)
Operating profit before working capital changes (17.71) 398.08 Changes in working capital
(Increase)/decrease in trade and other receivables (74.18) (305.58)(Increase)/decrease in inventories (195.66) (30.23)Increase/(decrease) in trade and other payables 222.22 159.29 (Increase)/decrease margin money and unpaid dividend accounts (66.47) (84.79)
Net change in working capital (114.09) (261.31)Cash generated from operations (131.80) 136.77 Direct taxes (paid)/Refund, net 4.77 (32.78)Net cash generated from operating activities A (127.03) 103.99 Cash flow from investing activities
Capital expenditure on fixed assets, including capital advances (300.31) (257.97)Proceeds from sale of fixed assets 21.92 119.63 Investment in subsidiaries / Joint ventures/Associates (166.64) (252.51)Purchase of Current investment - (1.00)Proceeds from sale of Current investments 1.09 1.84 Loan given to affiliates and others (net) 111.71 (63.31)Interest received 19.37 42.26
Net cash generated from investing activities B (312.86) (411.06)
Cash Flow Statement For the Year ended 31 March 2013
STANDALONE60
SeQ
uen
t Sc
ien
tifi
c Li
mit
ed
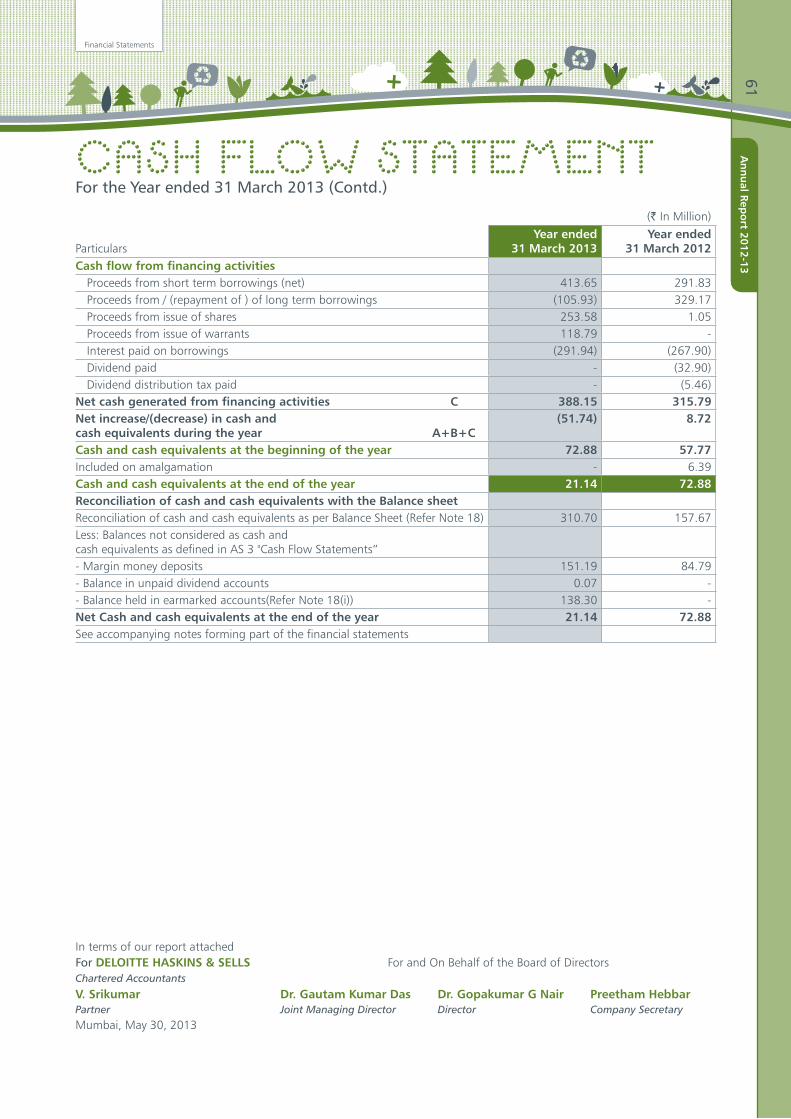
Cash Flow Statement For the Year ended 31 March 2013 (Contd.)
(` In Million)
ParticularsYear ended
31 March 2013 Year ended
31 March 2012 Cash flow from financing activities
Proceeds from short term borrowings (net) 413.65 291.83 Proceeds from / (repayment of ) of long term borrowings (105.93) 329.17 Proceeds from issue of shares 253.58 1.05 Proceeds from issue of warrants 118.79 - Interest paid on borrowings (291.94) (267.90)Dividend paid - (32.90)Dividend distribution tax paid - (5.46)
Net cash generated from financing activities C 388.15 315.79 Net increase/(decrease) in cash and cash equivalents during the year A+B+C
(51.74) 8.72
Cash and cash equivalents at the beginning of the year 72.88 57.77 Included on amalgamation - 6.39 Cash and cash equivalents at the end of the year 21.14 72.88 Reconciliation of cash and cash equivalents with the Balance sheetReconciliation of cash and cash equivalents as per Balance Sheet (Refer Note 18) 310.70 157.67 Less: Balances not considered as cash and cash equivalents as defined in AS 3 "Cash Flow Statements”- Margin money deposits 151.19 84.79- Balance in unpaid dividend accounts 0.07 - - Balance held in earmarked accounts(Refer Note 18(i)) 138.30 - Net Cash and cash equivalents at the end of the year 21.14 72.88 See accompanying notes forming part of the financial statements
In terms of our report attachedFor DELOITTE HASKINS & SELLS For and On Behalf of the Board of DirectorsChartered Accountants
V. Srikumar Dr. Gautam Kumar Das Dr. Gopakumar G Nair Preetham HebbarPartner Joint Managing Director Director Company SecretaryMumbai, May 30, 2013
Financial Statements61
An
nu
al Rep
ort 2012-13

1 SIGNIFICANT ACCOUNTING POLICIES
1.1 Basis of accounting and preparation of financial statements
The financial statements of SeQuent Scientific Limited (‘the Company’) have been prepared, in accordance with Generally Accepted Accounting principles in India (Indian GAAP), to comply with the mandatory Accounting Standards prescribed by the Companies (Accounting Standards) Rules, 2006 except for certain assets and liabilities which are measured on fair value basis as permitted by the Scheme of Arrangement approved by the Honorable High Court of Karnataka and the relevant provisions of the Companies Act, 1956. The Financial Statements have been prepared on accrual basis under the historical cost convention except for certain categories of fixed assets that are carried at revalued amounts. The accounting policies adopted in the preparation of the financial statements are consistent with those followed in the previous year.
1.2 Tangible fixed assets
Fixed assets are carried at cost less accumulated depreciation and impairment losses, if any. The cost of fixed assets includes interest on borrowings attributable to acquisition of qualifying fixed assets up to the date the asset is ready for its intended use and other incidental expenses incurred up to that date. Exchange differences arising on restatement / settlement of long-term foreign currency borrowings relating to acquisition of depreciable fixed assets are adjusted to the cost of the respective assets and depreciated over the remaining useful life of such assets. Subsequent expenditure relating to fixed assets is capitalised only if such expenditure results in an increase in the future benefits from such asset beyond its previously assessed standard of performance.
Capital work-in-progress:
Projects under which assets are not ready for their intended use and other capital work-in-progress are carried at cost, comprising direct cost, related incidental expenses and attributable interest.
1.3 Intangible assets
Intangible assets are carried at cost less accumulated amortisation and impairment losses, if any. The cost of an intangible assets comprises its purchase price, including any import duties and other taxes (other than those subsequently recoverable from the taxing authorities), and any directly attributable expenditure on making the asset ready for its intended use and net of any trade discounts and rebates. Subsequent expenditure on an intangible assets after its purchase / completion is recognised as an expense when incurred unless it is probable that such expenditure will enable the asset to generate future economic benefits in excess of its originally assessed standards of performance and such expenditure can be measured and attributed to the asset reliably, in which case such expenditure is added to the cost of the asset.
Refer Note 1.5 for accounting for research and development expenses.
1.4 Depreciation/amortisation
Depreciation is provided under the straight-line method at the rates and in the manner prescribed under Schedule XIV of the Companies Act, 1956, based on technical estimates that indicate the useful lives would be comparable with or higher than those arrived at using these rates,
Nature of the assets Remaining useful life in years
Buildings 10 - 28
Plant and Machinery 5 - 12
Office equipment 5 - 7
Computers 4
Furniture and fixtures 5 - 6
Motor vehicles 3 - 5
Leasehold land 85 - 96
Leasehold property development Over lease period
In the case of following intangible assets depreciation is provided/amortised under the straight line method over the useful life of assets as follows:
Product and process development 5 Years
Software licenses 3 Years
The estimated useful life of the intangible assets and its amortisation period are reviewed at the end of each financial year and the amortisation method is revised to reflect the changed pattern.
With respect to assets carried at revalued amounts as permitted under the Scheme of amalgamation, depreciation is recorded under the straight line method over the balance remaining useful life of the assets.
Individual assets costing less than Rs.5,000 are depreciated in full in the year of purchase.
1.5 Research and development costs
Revenue expenditure pertaining to research is charged to the Statement of Profit and Loss. Development costs of products are also charged to the Statement of Profit and Loss unless a product’s technological feasibility has been established, in which case such expenditure is capitalised. The amount capitalised comprises expenditure that can be directly attributed or allocated on a reasonable and consistent basis to creating, producing and making the asset ready for its intended use. Fixed assets utilised for research and development are capitalised and depreciated in accordance with the policies stated for tangible fixed assets and intangible assets.
1.6 Impairment of assets
As at each Balance Sheet date, the carrying amount of fixed assets is tested for impairment if impairment conditions exist. An impairment loss is recognized when the carrying amount of an asset exceeds its recoverable amount. Recoverable amount is determined:
(a) in the case of an individual asset, at the higher of the net selling price and value in use.
(b) in the case of cash generating units, at the higher of the unit’s net selling price and the value in use.
Value in use is determined as the present value of estimated future cash flows from the continuing use of an asset and from its disposal at the end of its useful life.
1.7 Investments
Current investments are carried at lower of cost and fair market value. Provision is made to recognize decline, if any, in the carrying value.
Long-term investments are carried individually at cost less provision for diminution, other than temporary in the value of the investment.
1.8 Inventory
Inventories comprise raw materials, packing materials, consumables, work in process, intermediates and finished goods. These are valued at the lower of cost and net realizable value. Cost is determined as follows:
(i) Raw materials, packing materials and consumables
First in first out basis
(ii) Work in process and Intermediates
At material cost, conversion costs and appropriate share of production overheads
(iii) Finished goods
At material cost, conversion costs and an appropriate share of production overheads and excise duty, wherever applicable.
1.9 Revenue recognition
Revenue from export sales is recognized on the basis of the shipping bills for exports. Revenue from domestic sales is recognized based on the passage of title to goods which generally coincides with dispatch. Sales include excise duty and are stated net of discounts, other taxes, and sales returns.
Income from sale of technical know-how is recognized, when the risk and right to use is transferred to the buyer as per terms of contract.
Dividend income is recognised when the right to receive the same is established.
Interest income is recognised on an accrual basis.
1.10 Employee benefits
The Company’s contribution to provident fund is charged to revenue on accrual basis.
Leave balances standing to the credit of the employees that are expected to be availed in the short term are provided for on full cost basis. Liability for unavailed leave considered to be long term is carried based on an actuarial valuation.
Liability for gratuity is funded with LIC and SBI Life Insurance Company Limited. Gratuity expenses for the year are accounted based on actuarial valuation carried out using Projected Unit Credit Method as at the end of the fiscal year. The obligation recognised in the balance sheet represents the present value of the defined benefit obligation as
Notes forming part of the financial statements
STANDALONE62
SeQ
uen
t Sc
ien
tifi
c Li
mit
ed
adjusted for unrecognized past service cost, and as reduced by the fair value of scheme assets. Any asset resulting from this calculation is limited to past service cost, plus the present value of available refunds and reductions in future contributions to the scheme.
Short term employee benefits like medical, leave travel, etc are accrued based on the terms of employment on a time proportion basis.
1.11 Foreign currency transactions
Initial recognition
Transactions in foreign currencies entered into by the Company and its integral foreign operations are accounted at the exchange rates prevailing on the date of the transaction or at rates that closely approximate the rate at the date of the transaction.
Measurement of foreign currency monetary items at the Balance Sheet date
Foreign currency monetary items of the Company and its net investment in non-integral foreign operations outstanding at the Balance Sheet date are restated at the year-end rates.
In the case of integral operations, assets and liabilities (other than non-monetary items), are translated at the exchange rate prevailing on the balance sheet date. Non-monetary items are carried at historical cost. Revenue and expenses are translated at the average exchange rates prevailing during the year. Exchange differences arising out of these translations are charged to the statement of profit and loss.
Treatment of exchange differences
Exchange differences arising on settlement / restatement of short-term foreign currency monetary assets and liabilities of the Company and its integral foreign operations are recognised as income or expense in the statement of profit and loss. The exchange differences on restatement / settlement of loans to non-integral foreign operations that are considered as net investment in such operations are accumulated in a “”Foreign currency translation reserve”” until disposal / recovery of the net investment.
The exchange differences arising on restatement / settlement of long-term foreign currency monetary items are capitalised as part of the depreciable fixed assets to which the monetary item relates and depreciated over the remaining useful life of such assets.
Accounting of forward contracts
Premium / discount on forward exchange contracts, which are not intended for trading or speculation purposes, are amortised over the period of the contracts if such contracts relate to monetary items as at the Balance Sheet date.
1.12 Taxes on income
Income Tax comprises the current tax provision and the net change in the deferred tax asset or liability during the year. Deferred tax assets and liabilities are recognized for the future tax consequences arising out of temporary differences between the carrying values of the assets and liabilities and their respective tax bases. Deferred tax assets and liabilities are measured using enacted tax rates applicable on the Balance Sheet date. Deferred tax assets are recognised for timing differences of items other than unabosrbed depreciation and carry forward losses only to the extent that reasonable certainty exists that sufficient future taxable income will be available against which these can be realised. However, if there are unabsorbed depreciation and carry forward of losses, deferred tax assets are recognised only if there is virtual certainty that there will be sufficient future taxable income available to realise the assets. Deferred tax assets and liabilities are offset if such items relate to taxes on income levied by the same governing tax laws and the Company has a legally enforceable right for such set off. Deferred tax assets are reviewed at each balance sheet date for their realisability.
Current tax is the amount of tax payable on the taxable income for the year as determined in accordance with the provisions of the Indian Income Tax Act, 1961.
Minimum alternative tax (‘MAT’) paid in accordance to the tax laws, which gives rise to future economic benefits in the form of adjustment of future tax liability, is considered as an asset if there is convincing evidence that the Company will pay normal income tax in future years. Accordingly, MAT is recognized as an assets in the balance sheet when it is probable that the future economic benefit associated with it will flow to the Company and asset can be measured reliably.
1.13 Leases
Lease arrangements, where the risks and rewards incident to ownership of an asset substantially vest with the lessor, are classified as operating leases and the lease rentals thereon are recognised in the statement of profit and loss on accrual basis.
1.14 Employee stock option scheme
Employee stock options are accounted in accordance with the guidelines stipulated
by SEBI and Guidance Note on Accounting for Employee Share-based Payments. The difference between the market price of the shares underlying the options granted on the date of grant of option and the option price is expensed under employee benefit expenses over the vesting period.
1.15 Earnings per share (EPS)
In determining the Earnings per share, the Company considers the net profit after tax. The number of shares used in computing Basic Earnings per share is the weighted average number of equity shares outstanding during the year. The number of shares used in computing Diluted Earnings per share comprises the weighted average number of equity shares considered for deriving Basic earnings per share and also the weighted average number of equity shares that could have been issued on the conversion of all dilutive potential equity shares. Dilutive potential equity shares are deemed converted as of the beginning of the year unless issued at a later date.
1.16 Provisions and contingencies
A provision is recognized when the Company has a present legal or constructive obligation as a result of past event and it is probable that an outflow of resources will be required to settle the obligation, in respect of which reliable estimate can be made. Provisions (excluding retirement benefits) are not discounted to its present value and are determined based on best estimate required to settle the obligation. Contingent liabilities are not recognized but are disclosed in the notes to financial statements.
1.17 Use of estimates
The preparation of the financial statements in conformity with the Accounting Standards generally accepted in India requires that the management makes estimates and assumptions that affect the reported amounts of assets and liabilities, disclosure of contingent liabilities as at the date of the financial statements and the reported amounts of revenue and expenses during the reported period. Actual results could differ from those estimates.
1.18 Segment
Segments have been identified taking into account the nature of services, the differing risks and returns, the organizational structure and the internal reporting system. The Company prepares consolidated financial statements and segment information is disclosed in Consolidated financial statements.
1.19 Insurance claims
Insurance claims are accounted for on the basis of claims admitted / expected to be admitted and to the extent that there is no uncertainty in receiving the claims.
1.20 Borrowing costs
Borrowing costs include interest, amortisation of ancillary costs incurred and exchange differences arising from foreign currency borrowings to the extent they are regarded as an adjustment to the interest cost. Costs in connection with the borrowing of funds to the extent not directly related to the acquisition of qualifying assets are charged to the Statement of Profit and Loss over the tenure of the loan. Borrowing costs, allocated to and utilised for qualifying assets, pertaining to the period from commencement of activities relating to construction / development of the qualifying asset upto the date of capitalisation of such asset is added to the cost of the assets. Capitalisation of borrowing costs is suspended and charged to the Statement of Profit and Loss during extended periods when active development activity on the qualifying assets is interrupted.
1.21 Cash flow statement
Cash flows are reported using the indirect method, whereby profit / (loss) before extraordinary items and tax is adjusted for the effects of transactions of non-cash nature and any deferrals or accruals of past or future cash receipts or payments. The cash flows from operating, investing and financing activities of the Company are segregated based on the available information.
1.22 Cash and cash equivalents (for purposes of cash flow statement)
Cash comprises cash on hand and demand deposits with banks. Cash equivalents are short-term balances (with an original maturity of three months or less from the date of acquisition), highly liquid investments that are readily convertible into known amounts of cash and which are subject to insignificant risk of changes in value.
1.23 Operating Cycle
Based on the nature of products / activities of the Company and the normal time between acquisition of assets and their realisation in cash or cash equivalents, the Company has determined its operating cycle as 12 months for the purpose of classification of its assets and liabilities as current and non-current.
Notes forming part of the financial statements (Contd.)
Financial Statements63
An
nu
al Rep
ort 2012-13
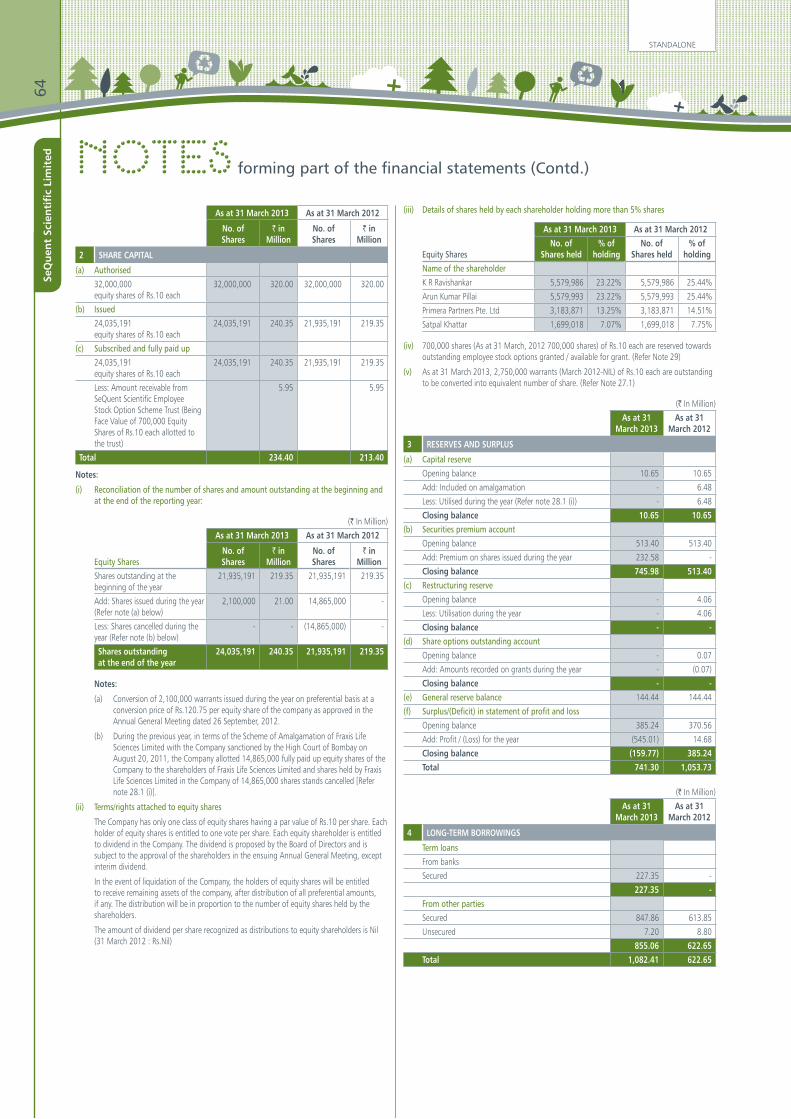
Notes forming part of the financial statements (Contd.)
As at 31 March 2013 As at 31 March 2012
No. of Shares
` in Million
No. of Shares
` in Million
2 SHARE CAPITAL
(a) Authorised32,000,000 equity shares of Rs.10 each
32,000,000 320.00 32,000,000 320.00
(b) Issued24,035,191 equity shares of Rs.10 each
24,035,191 240.35 21,935,191 219.35
(c) Subscribed and fully paid up24,035,191 equity shares of Rs.10 each
24,035,191 240.35 21,935,191 219.35
Less: Amount receivable from SeQuent Scientific Employee Stock Option Scheme Trust (Being Face Value of 700,000 Equity Shares of Rs.10 each allotted to the trust)
5.95 5.95
Total 234.40 213.40
Notes:
(i) Reconciliation of the number of shares and amount outstanding at the beginning and at the end of the reporting year:
(` In Million)
As at 31 March 2013 As at 31 March 2012
Equity SharesNo. of Shares
` in Million
No. of Shares
` in Million
Shares outstanding at the beginning of the year
21,935,191 219.35 21,935,191 219.35
Add: Shares issued during the year (Refer note (a) below)
2,100,000 21.00 14,865,000 -
Less: Shares cancelled during the year (Refer note (b) below)
- - (14,865,000) -
Shares outstanding at the end of the year
24,035,191 240.35 21,935,191 219.35
Notes:
(a) Conversion of 2,100,000 warrants issued during the year on preferential basis at a conversion price of Rs.120.75 per equity share of the company as approved in the Annual General Meeting dated 26 September, 2012.
(b) During the previous year, in terms of the Scheme of Amalgamation of Fraxis Life Sciences Limited with the Company sanctioned by the High Court of Bombay on August 20, 2011, the Company allotted 14,865,000 fully paid up equity shares of the Company to the shareholders of Fraxis Life Sciences Limited and shares held by Fraxis Life Sciences Limited in the Company of 14,865,000 shares stands cancelled [Refer note 28.1 (i)].
(ii) Terms/rights attached to equity shares
The Company has only one class of equity shares having a par value of Rs.10 per share. Each holder of equity shares is entitled to one vote per share. Each equity shareholder is entitled to dividend in the Company. The dividend is proposed by the Board of Directors and is subject to the approval of the shareholders in the ensuing Annual General Meeting, except interim dividend.
In the event of liquidation of the Company, the holders of equity shares will be entitled to receive remaining assets of the company, after distribution of all preferential amounts, if any. The distribution will be in proportion to the number of equity shares held by the shareholders.
The amount of dividend per share recognized as distributions to equity shareholders is Nil (31 March 2012 : Rs.Nil)
(iii) Details of shares held by each shareholder holding more than 5% shares
As at 31 March 2013 As at 31 March 2012
Equity SharesNo. of
Shares held% of
holdingNo. of
Shares held% of
holdingName of the shareholderK R Ravishankar 5,579,986 23.22% 5,579,986 25.44%
Arun Kumar Pillai 5,579,993 23.22% 5,579,993 25.44%
Primera Partners Pte. Ltd 3,183,871 13.25% 3,183,871 14.51%
Satpal Khattar 1,699,018 7.07% 1,699,018 7.75%
(iv) 700,000 shares (As at 31 March, 2012 700,000 shares) of Rs.10 each are reserved towards outstanding employee stock options granted / available for grant. (Refer Note 29)
(v) As at 31 March 2013, 2,750,000 warrants (March 2012-NIL) of Rs.10 each are outstanding to be converted into equivalent number of share. (Refer Note 27.1)
(` In Million)
As at 31 March 2013
As at 31 March 2012
3 RESERVES AND SURPLUS
(a) Capital reserveOpening balance 10.65 10.65
Add: Included on amalgamation - 6.48
Less: Utilised during the year (Refer note 28.1 (i)) - 6.48
Closing balance 10.65 10.65 (b) Securities premium account
Opening balance 513.40 513.40
Add: Premium on shares issued during the year 232.58 -
Closing balance 745.98 513.40 (c) Restructuring reserve
Opening balance - 4.06
Less: Utilisation during the year - 4.06
Closing balance - - (d) Share options outstanding account
Opening balance - 0.07
Add: Amounts recorded on grants during the year - (0.07)
Closing balance - - (e) General reserve balance 144.44 144.44
(f) Surplus/(Deficit) in statement of profit and lossOpening balance 385.24 370.56
Add: Profit / (Loss) for the year (545.01) 14.68
Closing balance (159.77) 385.24 Total 741.30 1,053.73
(` In Million)
As at 31 March 2013
As at 31 March 2012
4 LONG-TERM BORROWINGS
Term loans From banks
Secured 227.35 -
227.35 - From other partiesSecured 847.86 613.85
Unsecured 7.20 8.80
855.06 622.65 Total 1,082.41 622.65
STANDALONE64
SeQ
uen
t Sc
ien
tifi
c Li
mit
ed
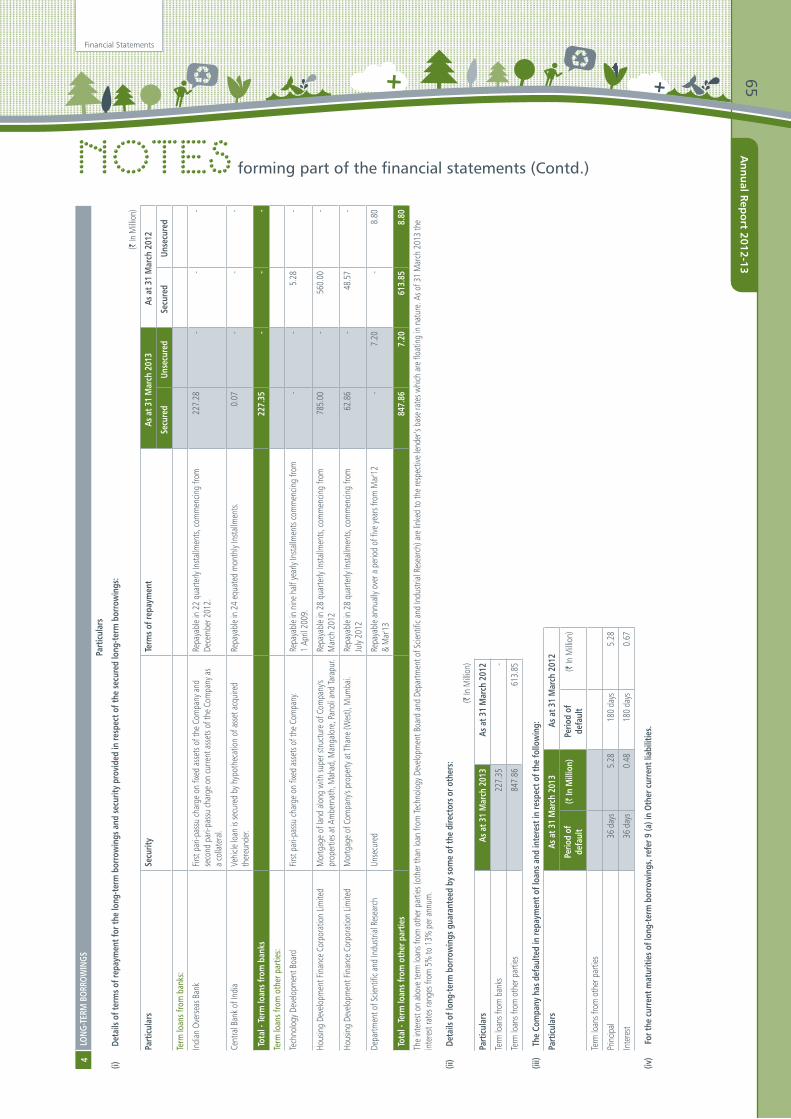
Notes forming part of the financial statements (Contd.)
4LO
NG-T
ERM
BOR
ROW
INGS
Part
icul
ars
(i)De
tails
of t
erm
s of r
epay
men
t for
the
long
-term
bor
row
ings
and
secu
rity
prov
ided
in re
spec
t of t
he se
cure
d lo
ng-te
rm b
orro
win
gs:
(` In
Milli
on)
Part
icul
ars
Secu
rity
Term
s of r
epay
men
tAs
at 3
1 M
arch
201
3As
at 3
1 M
arch
201
2
Secu
red
Unse
cure
dSe
cure
dUn
secu
red
Term
loan
s fro
m b
anks
:
Indi
an O
verse
as B
ank
First
pari-
pass
u ch
arge
on
fixed
ass
ets o
f the
Com
pany
and
se
cond
par
i-pas
su ch
arge
on
curre
nt a
sset
s of t
he C
ompa
ny a
s a
colla
tera
l.
Repa
yabl
e in
22
quar
terly
Insta
llmen
ts, co
mm
encin
g fro
m
Dece
mbe
r 201
2. 2
27.2
8 -
- -
Cent
ral B
ank o
f Ind
iaVe
hicle
loan
is se
cure
d by
hyp
othe
catio
n of
ass
et a
cqui
red
ther
eund
er.Re
paya
ble
in 2
4 eq
uate
d m
onth
ly In
stallm
ents.
0.0
7 -
- -
Tota
l - Te
rm lo
ans f
rom
ban
ks 2
27.3
5 -
- -
Term
loan
s fro
m o
ther
par
ties:
Tech
nolo
gy D
evelo
pmen
t Boa
rdFir
st pa
ri-pa
ssu
char
ge o
n fix
ed a
sset
s of t
he C
ompa
ny.
Repa
yabl
e in
nin
e ha
lf ye
arly
Insta
llmen
ts co
mm
encin
g fro
m
1 Ap
ril 2
009.
- -
5.2
8 -
Hous
ing
Deve
lopm
ent F
inan
ce C
orpo
ratio
n Lim
ited
Mor
tgag
e of
land
alo
ng w
ith su
per s
truct
ure
of C
ompa
ny's
prop
ertie
s at A
mbe
rnat
h, M
ahad
, Man
galo
re, P
anol
i and
Tara
pur.
Repa
yabl
e in
28
quar
terly
Insta
llmen
ts, co
mm
encin
g fro
m
Mar
ch 2
012
785
.00
- 5
60.0
0 -
Hous
ing
Deve
lopm
ent F
inan
ce C
orpo
ratio
n Lim
ited
Mor
tgag
e of
Com
pany
's pr
oper
ty a
t Tha
ne (W
est),
Mum
bai.
Repa
yabl
e in
28
quar
terly
Insta
llmen
ts, co
mm
encin
g fro
m
July
2012
62.
86
- 4
8.57
-
Depa
rtmen
t of S
cient
ific a
nd In
dustr
ial R
esea
rch
Unse
cure
dRe
paya
ble
annu
ally o
ver a
per
iod
of fi
ve ye
ars f
rom
Mar
'12
& M
ar'13
- 7
.20
- 8
.80
Tota
l - Te
rm lo
ans f
rom
oth
er p
artie
s 8
47.8
6 7
.20
613
.85
8.8
0
The
inte
rest
on a
bove
term
loan
s fro
m o
ther
par
ties (
othe
r tha
n lo
an fr
om Te
chno
logy
Dev
elopm
ent B
oard
and
Dep
artm
ent o
f Scie
ntifi
c and
Indu
strial
Res
earc
h) a
re lin
ked
to th
e re
spec
tive
lende
r’s b
ase
rate
s whi
ch a
re fl
oatin
g in
nat
ure.
As o
f 31
Mar
ch 2
013
the
inte
rest
rate
s ran
ges f
rom
5%
to 1
3% p
er a
nnum
.
(ii)
Deta
ils o
f lon
g-te
rm b
orro
win
gs g
uara
ntee
d by
som
e of
the
dire
ctor
s or o
ther
s:
(` In
Milli
on)
Part
icul
ars
As a
t 31
Mar
ch 2
013
As a
t 31
Mar
ch 2
012
Term
loan
s fro
m b
anks
227
.35
-
Term
loan
s fro
m o
ther
par
ties
847
.86
613
.85
(iii)
The
Com
pany
has
def
aulte
d in
repa
ymen
t of l
oans
and
inte
rest
in re
spec
t of t
he fo
llow
ing:
Part
icul
ars
As a
t 31
Mar
ch 2
013
As a
t 31
Mar
ch 2
012
Perio
d of
de
faul
t(`
In M
illio
n)Pe
riod
of
defa
ult
(` In
Milli
on)
Term
loan
s fro
m o
ther
par
ties
Prin
cipal
36
days
5
.28
180
day
s 5
.28
Inte
rest
36
days
0
.48
180
day
s 0
.67
(iv)
For
the
curr
ent m
atur
ities
of l
ong-
term
bor
row
ings
, ref
er 9
(a) i
n Ot
her c
urre
nt li
abili
ties.
Financial Statements65
An
nu
al Rep
ort 2012-13

Notes forming part of the financial statements (Contd.)
(` In Million)
As at 31 March 2013
As at 31 March 2012
5 OTHER LONG-TERM LIABILITIES
(a) Security deposits received 0.50 -
Total 0.50 -
(` In Million)
As at 31 March 2013
As at 31 March 2012
6 LONG TERM PROVISIONS
Provision for employee benefits(i) Provision for gratuity (net) 38.25 27.29
(ii) Provision for compensated absences 18.58 12.90
Total 56.83 40.19
(` In Million)
As at 31 March 2013
As at 31 March 2012
7 SHORT-TERM BORROWINGS
(a) Loans repayable on demandFrom banks
Secured (Refer note (i) below) 1,044.84 980.87
(b) Loans from related partiesUnsecured 349.81 -
Total 1,394.65 980.87 (i) Working capital loan from banks are secured by a first pari-passu charge on current
assets of the Company and a second pari-passu charge on fixed assets of the Company as a collateral.
(ii) Short-term borrowings of Rs.1,044.84 million (31 March 2012 Rs.980.87 million) are guaranteed by some of the Directors of the Company in their personal capacities.
(iii) The Company has not defaulted in repayment of loans and interest.
(` In Million)
As at 31 March 2013
As at 31 March 2012
8 TRADE PAYABLES
Trade Payable 1,459.16 1,225.74
Total 1,459.16 1,225.74
(` In Million)
As at 31 March 2013
As at 31 March 2012
9 OTHER CURRENT LIABILITIES
(a) Current maturities of long-term debt (Refer note (i) below) 174.74 617.59
(b) Interest accrued and due on borrowings 13.33 4.00
(c) Other payables
(i) Statutory remittances 47.32 24.70
(ii) Payables on purchase of fixed assets 18.06 15.72
(iii) Advances from customers 16.75 39.02
(iv) Unclaimed dividends 0.07 -
(v) Other current liabilities 7.15 14.98
Total 277.42 716.01
(` In Million)
As at 31 March 2013
As at 31 March 2012
9 OTHER CURRENT LIABILITIES (Contd.)
Note:(i) Current maturities of long-term debt
(Refer Notes (i) and (ii) in Note 4 - Long-term borrowings for details of security and guarantee):
ParticularsTerm loans
From banks
Secured 0.36 168.74
0.36 168.74 From other parties
Secured 171.98 161.98
Unsecured 2.40 286.87
174.38 448.85 Total 174.74 617.59
(` In Million)
As at 31 March 2013
As at 31 March 2012
10 SHORT-TERM PROVISIONS
(a) Provision for employee benefitsProvision for compensated absences 7.25 7.05
7.25 7.05 (b) Provision - Others
Provision for tax (net of advance tax Rs.30.99 Millionas at 31st March 2012 is Rs.37.63 Million)
28.75 22.12
28.75 22.12 Total 36.00 29.17
STANDALONE66
SeQ
uen
t Sc
ien
tifi
c Li
mit
ed
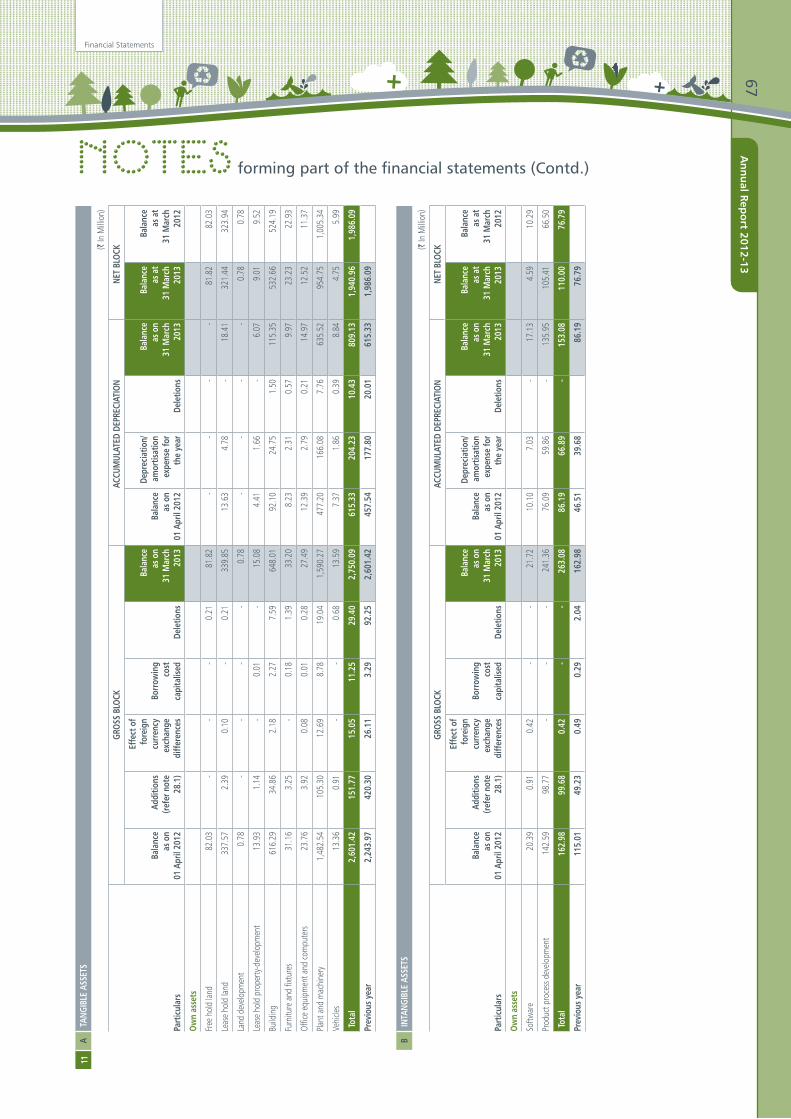
Notes forming part of the financial statements (Contd.)
11A
TANG
IBLE
ASS
ETS
(` In
Milli
on)
Part
icul
ars
GROS
S BL
OCK
ACCU
MUL
ATED
DEP
RECI
ATIO
NNE
T BL
OCK
Bala
nce
as o
n 01
Apr
il 20
12
Add
ition
s (re
fer n
ote
28.1
)
Eff
ect o
f fo
reig
n cu
rren
cy
exch
ange
di
ffer
ence
s
Bor
row
ing
cost
ca
pita
lised
D
elet
ions
Bala
nce
as o
n 31
Mar
ch
2013
Bala
nce
as o
n 01
Apr
il 20
12
De
prec
iatio
n/
amor
tisat
ion
expe
nse
for
the
year
D
elet
ions
Bala
nce
as o
n 31
Mar
ch
2013
Bala
nce
as a
t31
Mar
ch
2013
Bala
nce
as a
t31
Mar
ch
2012
Own
asse
ts
Free
hol
d lan
d 8
2.03
-
- -
0.2
1 8
1.82
-
- -
- 8
1.82
8
2.03
Leas
e ho
ld la
nd
337
.57
2.3
9 0
.10
- 0
.21
339
.85
13.
63
4.7
8 -
18.
41
321
.44
323
.94
Land
dev
elopm
ent
0.7
8 -
- -
- 0
.78
- -
- -
0.7
8 0
.78
Leas
e ho
ld p
rope
rty-d
evelo
pmen
t 1
3.93
1
.14
- 0
.01
- 1
5.08
4
.41
1.6
6 -
6.0
7 9
.01
9.5
2
Build
ing
616
.29
34.
86
2.1
8 2
.27
7.5
9 6
48.0
1 9
2.10
2
4.75
1
.50
115
.35
532
.66
524
.19
Furn
iture
and
fixt
ures
31.
16
3.2
5 -
0.1
8 1
.39
33.
20
8.2
3 2
.31
0.5
7 9
.97
23.
23
22.
93
Offic
e eq
uipm
ent a
nd co
mpu
ters
23.
76
3.9
2 0
.08
0.0
1 0
.28
27.
49
12.
39
2.7
9 0
.21
14.
97
12.
52
11.
37
Plant
and
mac
hine
ry
1,4
82.5
4 1
05.3
0 1
2.69
8
.78
19.
04
1,5
90.2
7 4
77.2
0 1
66.0
8 7
.76
635
.52
954
.75
1,0
05.3
4
Vehi
cles
13.
36
0.9
1 -
- 0
.68
13.
59
7.3
7 1
.86
0.3
9 8
.84
4.7
5 5
.99
Tota
l 2
,601
.42
151
.77
15.
05
11.
25
29.
40
2,7
50.0
9 6
15.3
3 2
04.2
3 1
0.43
8
09.1
3 1
,940
.96
1,9
86.0
9
Prev
ious
yea
r 2
,243
.97
420
.30
26.
11
3.2
9 9
2.25
2
,601
.42
457
.54
177
.80
20.
01
615
.33
1,9
86.0
9
BIN
TANG
IBLE
ASS
ETS
(` In
Milli
on)
Part
icul
ars
GROS
S BL
OCK
ACCU
MUL
ATED
DEP
RECI
ATIO
NNE
T BL
OCK
Bala
nce
as o
n 01
Apr
il 20
12
Add
ition
s (re
fer n
ote
28.1
)
Eff
ect o
f fo
reig
n cu
rren
cy
exch
ange
di
ffer
ence
s
Bor
row
ing
cost
ca
pita
lised
D
elet
ions
Bala
nce
as o
n 31
Mar
ch
2013
Bala
nce
as o
n 01
Apr
il 20
12
De
prec
iatio
n/
amor
tisat
ion
expe
nse
for
the
year
D
elet
ions
Bala
nce
as o
n 31
Mar
ch
2013
Bala
nce
as a
t31
Mar
ch
2013
Bala
nce
as a
t31
Mar
ch
2012
Own
asse
ts
Softw
are
20.
39
0.9
1 0
.42
- -
21.
72
10.
10
7.0
3 -
17.
13
4.5
9 1
0.29
Prod
uct p
roce
ss d
evelo
pmen
t 1
42.5
9 9
8.77
-
- -
241
.36
76.
09
59.
86
- 1
35.9
5 1
05.4
1 6
6.50
Tota
l 1
62.9
8 9
9.68
0
.42
- -
263
.08
86.
19
66.
89
- 1
53.0
8 1
10.0
0 7
6.79
Prev
ious
yea
r 1
15.0
1 4
9.23
0
.49
0.2
9 2
.04
162
.98
46.
51
39.
68
86.
19
76.
79
Financial Statements67
An
nu
al Rep
ort 2012-13

Notes forming part of the financial statements (Contd.)
(` In Million)
Year ended 31 March
2013
Year ended 31 March
2012
11 C DEPRECIATION AND AMORTISATION
Depreciation and amortisation for the year on tangible assets as per Note 11 A
204.23 177.80
Depreciation and amortisation for the year on intangible assets as per Note 11 B
66.89 39.68
Less: Utilised from restructuring reserve - 4.06
Less: Depreciation capitalised for intangible assets developed
3.69 3.14
Depreciation and amortisation 267.43 210.28
(` In Million)
ParticularsYear ended 31 March 2013
Year ended 31 March 2012
Year ended 31 March 2011
D DETAILS OF SUMS ADDED TO ASSETS ON REVALUATION DURING THE PRECEDING 5 YEARS
Opening balanceLeasehold land 299.65 303.46 -
Buildings 120.88 125.84 -
420.53 429.30 - Added on revaluation
Leasehold land - - 305.08
Buildings - - 128.32
433.40
Date 1 October ‘09
Balance as at 31 March (Net Block)
Leasehold land 295.84 299.65 303.46
Buildings 115.92 120.88 125.84
411.76 420.53 429.30
(` In Million)
As at 31 March 2013
As at 31 March 2012
12 NON-CURRENT INVESTMENTS
Trade investments (valued at cost unless stated otherwise)Unquoted equity instrumentsA Investment in equity instruments of subsidiariesi) SeQuent Global Holdings Limited
185,108 (31 March 2012: 150,019) Equity Shares of USD 1 each fully paid-up
9.08 7.21
Less: Provision for other than temporary diminution in value
9.08 -
- 7.21
ii) SeQuent Research Limited4,410,000 (31 March 2012: 4,410,000) Equity Shares of Rs. 10 each fully paid-up
142.09 142.09
iii) Galenica B.V. 47,935 (31 March 2012: 47,935) Equity Shares of Euro 1 each fully paid-up
4.92 4.92
Less: Provision for other than temporary diminution in value
4.92 4.92
- -
iv) SeQuent Antibiotics Private Limited10,000 (31 March 2012: 10,000) Equity Shares of Rs. 10 each fully paid-up
0.10 0.10
v) SeQuent Oncolytics Private Limited9,999 (31 March 2012: 9,999) Equity Shares of Rs. 10 each fully paid-up
0.10 0.10
vi) Elysian Life Sciences Private Limited10,000 (31 March 2012: 9,000) Equity Shares of Rs. 10 each fully paid-up
0.10 0.09
(` In Million)
As at 31 March 2013
As at 31 March 2012
12 NON-CURRENT INVESTMENTS (Contd.)
vii) Elysian Life Sciences Mauritius Limited2,000 (31 March 2012: 2,000) Equity Shares of USD 1 each fully paid-up
0.10 0.10
viii) SeQuent Penems Private Limited4,781,712 (31 March 2012: 2,725,000 ) shares of Rs. 10 each fully paid-up
238.09 135.25
ix) SeQuent Penems Private Limited (Refer note (i) below)Share application pending allotment
164.75 102.84
545.33 387.78 B Other investmentsi) Panoli Enviro Tech Ltd.
23,700 (31 March 2012: 23,700)Equity Shares of Rs. 10 each fully paid-up
0.24 0.24
ii) Ambarnath Chemcial Manufacturers1,000 (31 March 2012: 1,000) Equity Shares of Rs. 10 each fully paid-up
0.01 0.01
iii) Tarapur Industrial Manufacturers2,000 (31 March 2012: 2,000) Equity Shares of Rs. 10 each fully paid-up
0.04 0.04
Total 0.29 0.29 C Other Non current Investments
Investment in government securities i) National Saving Certificate 0.02 0.02
ii) NSC VIII Issue - Tarapur 0.06 0.05
0.08 0.07 Total (A + B + C) 545.70 388.14
Aggregate amount of unquoted investments 559.70 393.06
Aggregate provision for diminution in value of investments 14.00 4.92
Note: (i) Trade investment in equity instruments includes Rs.164.75 Million (31 March 2012
Rs.102.84 million) investment made in SeQuent Penems Private Limited, for which shares are pending for allotment.
(` In Million)
As at 31 March 2013
As at 31 March 2012
13 LONG-TERM LOANS AND ADVANCES (Unsecured, considered good unless otherwise stated)
(a) Capital advances 29.57 16.76
(b) Security deposits 119.15 36.38
(c) Security deposits to related parties (Refer note 28.3) 17.39 17.39
(d) Loans and advances to related party (Refer note 28.3)
Unsecured, considered good 77.73 -
Unsecured, considered doubtful 31.00 -
108.73 -Less: Provision for doubtful loans and advances (Refer note 28.3)
31.00
77.73 - (e) Advance income tax (net of provisions Rs. 112.95 million
(As at 31 March, 2012 Rs.112.49 million)) 15.97 14.11
(f) MAT credit entitlement 72.96 72.96
(g) Prepaid expenses 8.65 5.38
Total 341.42 162.98 Note: Long-term loans and advances include amounts due from:
Atma Projects 17.39 17.39
STANDALONE68
SeQ
uen
t Sc
ien
tifi
c Li
mit
ed

(` In Million)
As at 31 March 2013
As at 31 March 2012
14 OTHER NON-CURRENT ASSETS(Unsecured, considered good)
(a) Long term trade receivables (Refer note 28.3) 35.88 2.63
(b) Margin money deposits 4.37 17.61
(c) Debts due from related parties (Refer note 28.3) 17.00 13.00
Total 57.25 33.24 Note: Other non-current assets include debts due from:
SeQuent Penems Private Limited 52.88 15.63
(` In Million)
As on 31 March 2013
As on 31 March 2012
15 CURRENT INVESTMENTS(valued at lower of cost and estimated net realisable value)
A Quoted equity instrumentsi) Agrodutch Industries Limited
36,250 (31 March 2012: 36,250) Equity Shares of Rs. 10 each fully paid-up
0.34 0.34
ii) Transchem Limited32,500 (31 March 2012: 32,500) Equity Shares of Rs. 10 each fully paid-up
0.43 0.43
iii) N B Footware Limited100,000 (31 March 2012: 100,000) Equity Shares of Rs. 10 each fully paid-up
- -
iv) Nath Seed Limited18,270 (31 March 2012: 18,270) Equity Shares of Rs. 10 each fully paid-up
- -
B Current investments (valued at lower of cost and fair value)Unquoted equity instruments
i) Aditya Investment & Communication Limited58,800 (31 March 2012: 58,800) shares of Rs.10 each fully paid-up
- -
ii) Agrotech India Limited6,300 (31 March 2012: 6,300) Equity Shares of Rs. 10 each fully paid-up
- -
iii) Nath Bio Genes (I) Limited6,930 (31 March 2012: 6,930) Equity Shares of Rs. 10 each fully paid-up
- -
C Unquoted mutual funds100,000 (31 March 2012: 200,000) units of Rs.10 each fully paid- up of SBI Mutual Fund
1.00 2.00
Total 1.77 2.77Aggregate amount of quoted investments: Market value: Rs. 1.57 million (31 March 2012: Rs. 1.30 million)
0.77 0.77
Aggregate amount of unquoted investments 1.00 2.00
(` In Million)
As at 31 March 2013
As at 31 March 2012
16 INVENTORIES(At lower of cost and net realisable value)
(a) Raw materials and packing materials 207.10 161.67
Goods-in transit 90.04 68.92
297.14 230.59 (b) Work-in-progress and intermediates (Refer note (i) below) 232.85 185.89
(c) Finished goods 243.02 205.82
Goods-in transit 49.71 4.73
292.73 210.55 (d) Fuel 4.02 4.05
Total 826.74 631.08 Note: (i) Details of inventory of work-in-progress
and intermediates:Bulk drugs 214.27 174.63
Formulations 2.50 1.59
Speciality chemicals 16.08 9.67
Total 232.85 185.89
(` In Million)
As at 31 March 2013
As at 31 March 2012
17 TRADE RECEIVABLES
(a) Trade receivables outstanding for a period exceeding six months from the date they are due for payment
Unsecured, considered good 20.36 22.70
Unsecured, considered doubtful 18.96 0.39
39.32 23.09 Less: Provision for doubtful debts 18.96 0.39
20.36 22.70 (b) Other trade receivables
Unsecured, considered good 681.25 802.10
Unsecured, considered doubtful 0.73 -
681.98 802.10 Less: Provision for doubtful debts 0.73 -
681.25 802.10 Total 701.61 824.80
(` In Million)
As at 31 March 2013
As at 31 March 2012
18 CASH AND CASH EQUIVALENTS
(a) Cash on hand 0.88 2.17
(b) Cheques, drafts on hand 1.99 -
(c) Balances with banks
In current accounts (Refer note (i) below) 154.84 50.52
In EEFC accounts 1.73 20.19
In earmarked accounts
- Unpaid dividend accounts 0.07 -
- Margin money deposits (Refer note (ii) below) 151.19 84.79
Total 310.70 157.67 Note: (i) Balance with banks in current account includes Rs.138.31 million (31 March 2012-NIL)
which has restrictions on utilisation of funds for capital projects.
(ii) Balances in margin money deposits are held as security against borrowings, guarantees and other commitments.
Notes forming part of the financial statements (Contd.)
Financial Statements69
An
nu
al Rep
ort 2012-13

Notes forming part of the financial statements (Contd.)
(` In Million)
As at 31 March 2013
As at 31 March 2012
19 SHORT-TERM LOANS AND ADVANCES
A Unsecured, considered good(a) Loans and advances to related parties
(Refer note 28.3) 1.64 222.08
(b) Due from directors (Refer note 28.3) - 27.70
(c) Advances to suppliers 34.60 15.42
(d) Advances to suppliers - related parties(Refer note 28.3)
- 4.99
(e) Advances to employees 0.45 0.52
(f) Loans and advances to others 4.78 29.71
(g) Balances with government authorities 210.92 106.73
(h) Prepaid expenses 14.81 14.00
267.20 421.15 B Unsecured, considered doubtful
Loans and advances to others 9.61 -
Less: Provision for doubtful advances 9.61 -
Total 267.20 421.15 Note: Short-term loans and advances include amounts due from related parties:K R Ravishankar - 23.38
Dr Gautam Kumar Das - 4.32
(` In Million)
As at 31 March 2013
As at 31 March 2012
20 OTHER CURRENT ASSETS
(a) Debts due from related parties (Refer note 28.3) 37.19 60.00
(b) Interest accrued on deposits 3.26 4.60
(c) Claims receivable 41.84 37.98
(d) Receivables on sale of fixed assets - 1.20
Total 82.29 103.78
(` In Million)
Year Ended31 March
2013
Year Ended31 March
2012
21 REVENUE FROM OPERATIONS
(a) Sale of products (Refer Note (i) below) 3,283.40 3,445.32
(b) Other operating revenues (Refer Note (ii) below) 7.76 5.52
3,291.16 3,450.84 Less: Excise Duty 150.66 126.54
Total 3,140.50 3,324.30 (i) Sale of products comprises:
(a) Manufactured goodsBulk drugs 2,296.08 2,550.30
Speciality chemicals 516.29 502.97
Formulations 201.81 174.40
Total - Sale of manufactured goods 3,014.18 3,227.67 (b) Traded goods
Bulk drugs 0.09 1.68
Chemicals 58.02 89.43
Formulations 60.45 -
Total - Sale of traded goods 118.56 91.11 Add: Excise duty 150.66 126.54
Total - Sale of products 3,283.40 3,445.32 (ii) Other operating revenues comprises:
Sale of scrap 1.56 2.86
Duty drawback and other export incentives 6.20 2.66
Total - Other operating revenues 7.76 5.52
(` In Million)
Year Ended31 March
2013
Year Ended31 March
2012
22 OTHER INCOME
(a) Interest income (Refer note (i) below) 18.03 45.02
(b) Net gain on sale of investments
Current investments 0.09 0.35
(c) Profit on sale of fixed assets (net) 4.16 64.92
(d) Other non-operating income (Refer note (ii) below) 2.62 2.98
Total 24.90 113.27 (i) Interest income comprises:
Interest from banks on:deposits 4.65 4.75
Interest on loans and advancessubsidiaries 11.13 15.09
associates - 15.58
others 2.25 8.76
Interest on income tax refund - 0.23
Other interest - 0.61
Total - Interest income 18.03 45.02 (ii) Other non-operating income comprises:
Insurance claim received 0.35 0.61
Liabilities / provisions no longer required written back 0.99 0.90
Miscellaneous Income 1.28 1.47
2.62 2.98
STANDALONE70
SeQ
uen
t Sc
ien
tifi
c Li
mit
ed
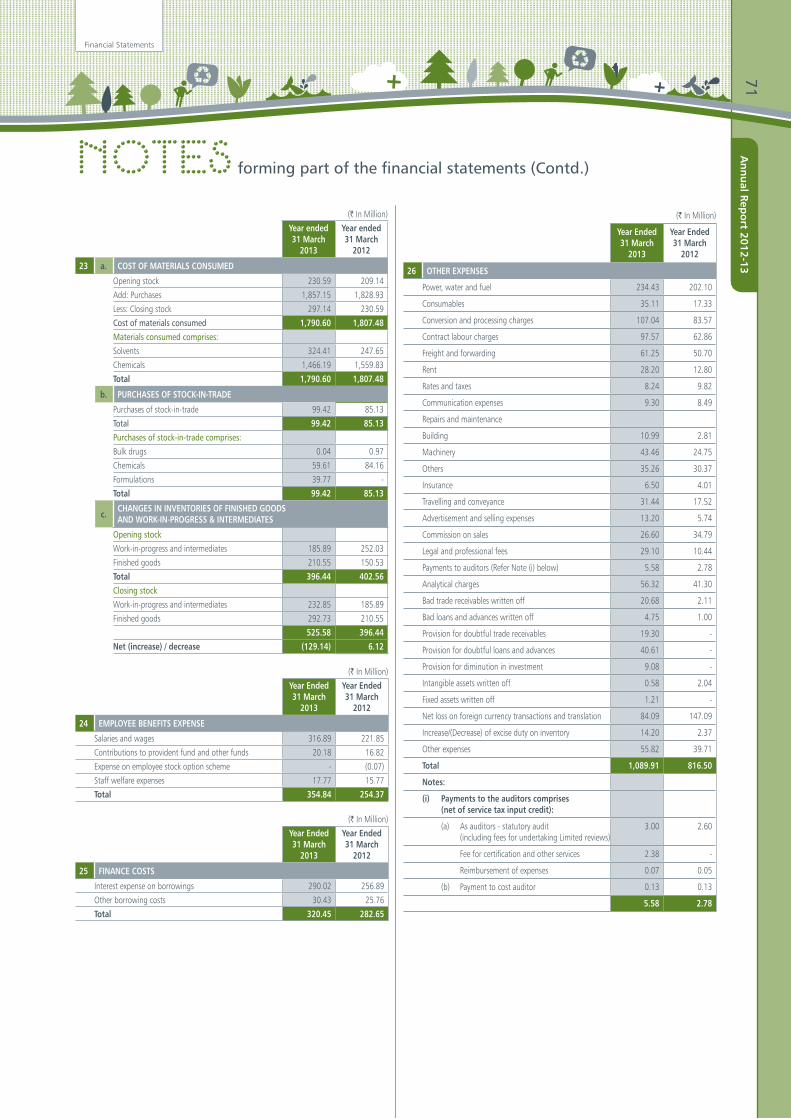
(` In Million)
Year ended 31 March
2013
Year ended 31 March
2012
23 a. COST OF MATERIALS CONSUMED
Opening stock 230.59 209.14
Add: Purchases 1,857.15 1,828.93
Less: Closing stock 297.14 230.59
Cost of materials consumed 1,790.60 1,807.48 Materials consumed comprises:Solvents 324.41 247.65
Chemicals 1,466.19 1,559.83
Total 1,790.60 1,807.48
b. PURCHASES OF STOCK-IN-TRADE
Purchases of stock-in-trade 99.42 85.13
Total 99.42 85.13 Purchases of stock-in-trade comprises:Bulk drugs 0.04 0.97
Chemicals 59.61 84.16
Formulations 39.77 -
Total 99.42 85.13
c.CHANGES IN INVENTORIES OF FINISHED GOODS AND WORK-IN-PROGRESS & INTERMEDIATES
Opening stockWork-in-progress and intermediates 185.89 252.03
Finished goods 210.55 150.53
Total 396.44 402.56 Closing stockWork-in-progress and intermediates 232.85 185.89
Finished goods 292.73 210.55
525.58 396.44 Net (increase) / decrease (129.14) 6.12
(` In Million)
Year Ended31 March
2013
Year Ended31 March
2012
24 EMPLOYEE BENEFITS EXPENSE
Salaries and wages 316.89 221.85
Contributions to provident fund and other funds 20.18 16.82
Expense on employee stock option scheme - (0.07)
Staff welfare expenses 17.77 15.77
Total 354.84 254.37
(` In Million)
Year Ended31 March
2013
Year Ended31 March
2012
25 FINANCE COSTS
Interest expense on borrowings 290.02 256.89
Other borrowing costs 30.43 25.76
Total 320.45 282.65
(` In Million)
Year Ended31 March
2013
Year Ended31 March
2012
26 OTHER EXPENSES
Power, water and fuel 234.43 202.10
Consumables 35.11 17.33
Conversion and processing charges 107.04 83.57
Contract labour charges 97.57 62.86
Freight and forwarding 61.25 50.70
Rent 28.20 12.80
Rates and taxes 8.24 9.82
Communication expenses 9.30 8.49
Repairs and maintenance
Building 10.99 2.81
Machinery 43.46 24.75
Others 35.26 30.37
Insurance 6.50 4.01
Travelling and conveyance 31.44 17.52
Advertisement and selling expenses 13.20 5.74
Commission on sales 26.60 34.79
Legal and professional fees 29.10 10.44
Payments to auditors (Refer Note (i) below) 5.58 2.78
Analytical charges 56.32 41.30
Bad trade receivables written off 20.68 2.11
Bad loans and advances written off 4.75 1.00
Provision for doubtful trade receivables 19.30 -
Provision for doubtful loans and advances 40.61 -
Provision for diminution in investment 9.08 -
Intangible assets written off 0.58 2.04
Fixed assets written off 1.21 -
Net loss on foreign currency transactions and translation 84.09 147.09
Increase/(Decrease) of excise duty on inventory 14.20 2.37
Other expenses 55.82 39.71
Total 1,089.91 816.50
Notes:
(i) Payments to the auditors comprises (net of service tax input credit):
(a) As auditors - statutory audit (including fees for undertaking Limited reviews)
3.00 2.60
Fee for certification and other services 2.38 -
Reimbursement of expenses 0.07 0.05
(b) Payment to cost auditor 0.13 0.13
5.58 2.78
Notes forming part of the financial statements (Contd.)
Financial Statements71
An
nu
al Rep
ort 2012-13
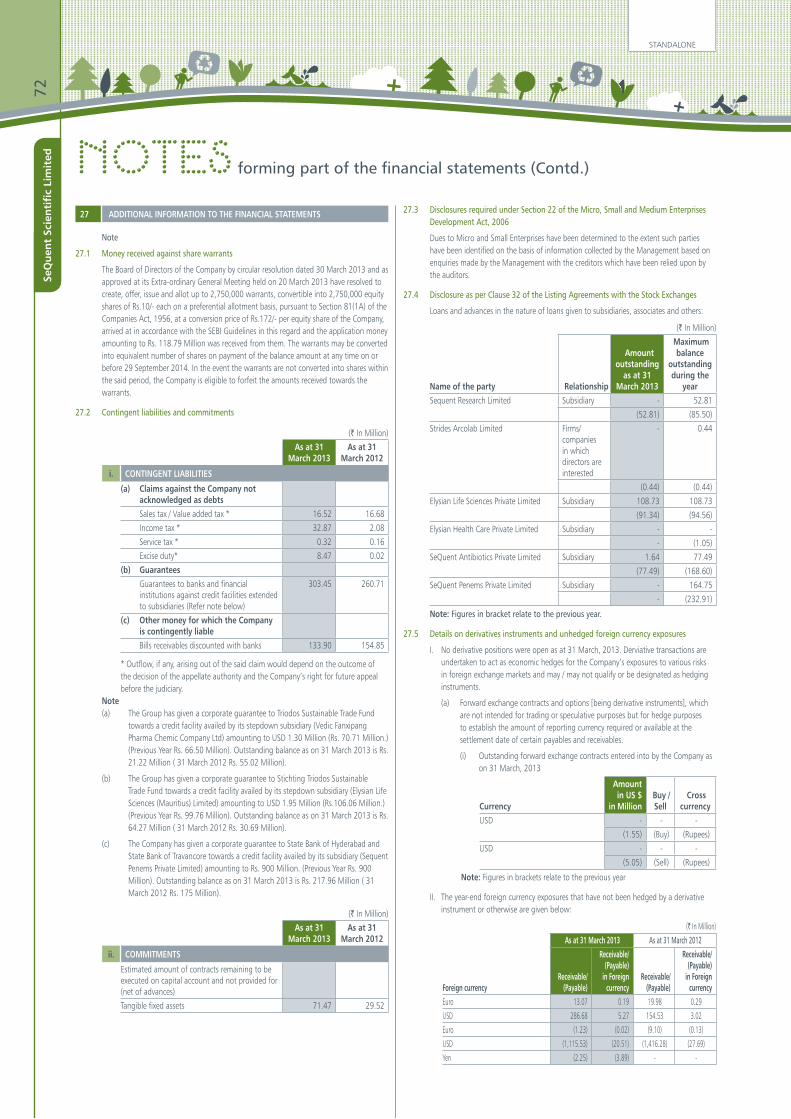
27 ADDITIONAL INFORMATION TO THE FINANCIAL STATEMENTS
Note
27.1 Money received against share warrants
The Board of Directors of the Company by circular resolution dated 30 March 2013 and as approved at its Extra-ordinary General Meeting held on 20 March 2013 have resolved to create, offer, issue and allot up to 2,750,000 warrants, convertible into 2,750,000 equity shares of Rs.10/- each on a preferential allotment basis, pursuant to Section 81(1A) of the Companies Act, 1956, at a conversion price of Rs.172/- per equity share of the Company, arrived at in accordance with the SEBI Guidelines in this regard and the application money amounting to Rs. 118.79 Million was received from them. The warrants may be converted into equivalent number of shares on payment of the balance amount at any time on or before 29 September 2014. In the event the warrants are not converted into shares within the said period, the Company is eligible to forfeit the amounts received towards the warrants.
27.2 Contingent liabilities and commitments
(` In Million)
As at 31March 2013
As at 31 March 2012
i. CONTINGENT LIABILITIES
(a) Claims against the Company not acknowledged as debtsSales tax / Value added tax * 16.52 16.68
Income tax * 32.87 2.08
Service tax * 0.32 0.16
Excise duty* 8.47 0.02
(b) GuaranteesGuarantees to banks and financial institutions against credit facilities extended to subsidiaries (Refer note below)
303.45 260.71
(c) Other money for which the Company is contingently liableBills receivables discounted with banks 133.90 154.85
* Outflow, if any, arising out of the said claim would depend on the outcome of the decision of the appellate authority and the Company’s right for future appeal before the judiciary.
Note (a) The Group has given a corporate guarantee to Triodos Sustainable Trade Fund
towards a credit facility availed by its stepdown subsidiary (Vedic Fanxipang Pharma Chemic Company Ltd) amounting to USD 1.30 Million (Rs. 70.71 Million.) (Previous Year Rs. 66.50 Million). Outstanding balance as on 31 March 2013 is Rs. 21.22 Million ( 31 March 2012 Rs. 55.02 Million).
(b) The Group has given a corporate guarantee to Stichting Triodos Sustainable Trade Fund towards a credit facility availed by its stepdown subsidiary (Elysian Life Sciences (Mauritius) Limited) amounting to USD 1.95 Million (Rs.106.06 Million.) (Previous Year Rs. 99.76 Million). Outstanding balance as on 31 March 2013 is Rs. 64.27 Million ( 31 March 2012 Rs. 30.69 Million).
(c) The Company has given a corporate guarantee to State Bank of Hyderabad and State Bank of Travancore towards a credit facility availed by its subsidiary (Sequent Penems Private Limited) amounting to Rs. 900 Million. (Previous Year Rs. 900 Million). Outstanding balance as on 31 March 2013 is Rs. 217.96 Million ( 31 March 2012 Rs. 175 Million).
(` In Million)
As at 31March 2013
As at 31 March 2012
ii. COMMITMENTS
Estimated amount of contracts remaining to be executed on capital account and not provided for (net of advances)
Tangible fixed assets 71.47 29.52
27.3 Disclosures required under Section 22 of the Micro, Small and Medium Enterprises Development Act, 2006
Dues to Micro and Small Enterprises have been determined to the extent such parties have been identified on the basis of information collected by the Management based on enquiries made by the Management with the creditors which have been relied upon by the auditors.
27.4 Disclosure as per Clause 32 of the Listing Agreements with the Stock Exchanges
Loans and advances in the nature of loans given to subsidiaries, associates and others:
(` In Million)
Name of the party Relationship
Amount outstanding
as at 31 March 2013
Maximum balance
outstanding during the
year Sequent Research Limited Subsidiary - 52.81
(52.81) (85.50)
Strides Arcolab Limited Firms/companies in which directors are interested
- 0.44
(0.44) (0.44)
Elysian Life Sciences Private Limited Subsidiary 108.73 108.73
(91.34) (94.56)
Elysian Health Care Private Limited Subsidiary - -
- (1.05)
SeQuent Antibiotics Private Limited Subsidiary 1.64 77.49
(77.49) (168.60)
SeQuent Penems Private Limited Subsidiary - 164.75
- (232.91)
Note: Figures in bracket relate to the previous year.
27.5 Details on derivatives instruments and unhedged foreign currency exposures
I. No derivative positions were open as at 31 March, 2013. Derviative transactions are undertaken to act as economic hedges for the Company’s exposures to various risks in foreign exchange markets and may / may not qualify or be designated as hedging instruments.
(a) Forward exchange contracts and options [being derivative instruments], which are not intended for trading or speculative purposes but for hedge purposes to establish the amount of reporting currency required or available at the settlement date of certain payables and receivables.
(i) Outstanding forward exchange contracts entered into by the Company as on 31 March, 2013
Currency
Amountin US $
in Million Buy / Sell
Cross currency
USD - - -
(1.55) (Buy) (Rupees)
USD - - -
(5.05) (Sell) (Rupees)
Note: Figures in brackets relate to the previous year
II. The year-end foreign currency exposures that have not been hedged by a derivative instrument or otherwise are given below:
(` In Million)
As at 31 March 2013 As at 31 March 2012
Foreign currencyReceivable/
(Payable)
Receivable/ (Payable)
in Foreign currency
Receivable/(Payable)
Receivable/ (Payable)
in Foreign currency
Euro 13.07 0.19 19.98 0.29
USD 286.68 5.27 154.53 3.02
Euro (1.23) (0.02) (9.10) (0.13)
USD (1,115.53) (20.51) (1,416.28) (27.69)
Yen (2.25) (3.89) - -
Notes forming part of the financial statements (Contd.)
STANDALONE72
SeQ
uen
t Sc
ien
tifi
c Li
mit
ed

27.6 Value of imports calculated on CIF basis
(` In Million)
Particulars
Year ended 31 March
2013
Year ended 31 March
2012Raw materials 874.53 988.29
Capital goods 13.79 6.33
27.7 Expenditure in foreign currency
(` In Million)
Particulars
Year ended 31 March
2013
Year ended 31 March
2012Consultancy charges 3.70 0.51
Foreign travel expenses 1.86 3.73
Commission 15.36 33.27
Interest on term loan 3.54 -
Research and development 3.04 2.55
Others 7.38 8.28
27.8 Details of consumption of imported and indigenous items
Year ended 31 March 2013 Year ended 31 March 2012
Particulars (` In Million) % (` In Million) % Raw materialImported 845.84 47.24 1,000.32 55.34
Indigenous 944.76 52.76 807.16 44.66
Total 1,790.60 100.00 1,807.48 100.00
27.9 Earnings in foreign exchange
(` In Million)
Particulars
Year ended 31 March
2013
Year ended 31 March
2012Export of goods calculated on FOB basis 1,344.73 1,380.96
Other non-operating income 0.28 0.69
27.10 Amounts remitted in foreign currency during the year on account of dividend
(` In Million)
Particulars
Year ended 31 March
2013
Year ended 31 March
2012Amount of dividend remitted in foreign currency - 7,324,333
Total number of non-resident shareholders (to whom the dividends were remitted in foreign currency)
- 2
Total number of shares held by them on which dividend was due
- 4,882,889
Year to which the dividend relates - 2010-11
27.11 Managerial Remuneration
Based on the approval received from the Central Government during the year and subsequent to the year-end, the Company has recognised in the Statement of Profit and Loss for the year ended 31 March 2013 Rs.27.70 Million of excess salaries and allowances paid to its directors and which was included under Short term loans and advances in the previous years.
28 DISCLOSURE UNDER ACCOUNTING STANDARD
28.1 Details of amalgamations
I. Amalgamation of Fraxis Life Sciences Limited with the Company:
During the previous year ended 31 March 2012, the Scheme of Amalgamation of Fraxis Life Sciences Limited (“Transferor Company”) with the Company (“Transferee Company”) was sanctioned by the High Court of Bombay on August 20, 2011 with the appointed date and effective date being September 14, 2011, the date on which the sanctioned Scheme is filed by the Company with the Registrar of Companies, Mumbai (“the Scheme”). In terms of the Scheme:
a) The amalgamation was accounted for under the Purchase Method of accounting as specified in Accounting Standard (AS) – 14 Accounting for Amalgamations, notified by the Central Government of India under the Companies (Accounting Standards) Rules, 2006.
b) All the assets and liabilities of the Transferor Company have been recorded by the Transferee Company at their respective carrying amounts as appearing in the books of the Transferor Company as on the appointed date.
c) The investment in the equity share capital of the Transferee Company as appearing in the books of accounts of the Transferor Company got cancelled and accordingly, the share capital of the Transferee Company was reduced to the extent of face value of shares held by the Transferor Company in the Transferee Company as on the appointed date.
d) The excess of the value of the net assets of the Transferor Company acquired by the Transferee Company over the face value of the shares issued by the Transferee Company as consideration to the shareholders of the Transferor Company and after adjusting for cancellation of equity share capital as mentioned in (c)above was treated as Capital Reserve amounting to NIL (net of merger expenses).
e) All costs, charges, taxes including duties, levies and all other expenses incurred in carrying out and implementing the Scheme and to put it into operation were adjusted against the Capital Reserve.
Details of assets and liabilities acquired on amalgamation and treatment of the difference between the net assets acquired and the face value of the shares issued by the Transferee Company as consideration to the shareholders of the Transferor Company and after adjusting for cancellation of equity share capital:
(` In Million)
ParticularsYear ended
31 March 2012Value of assets and liabilities acquired:Cash and bank balances 6.39
Deferred tax asset 0.14 6.53
-
Less: Current liabilities 0.05
Difference considered as capital reserve 6.48
Less: Merger expenses 6.48
-
(ii) During the year ended 31 March 2012, the Company purchased the research and development unit of its subsidiary Sequent Antibiotics Private Limited on a slump sale basis for a total consideration of Rs. 91.10 million. Below is the breakup of assets & liabilities taken over.
Particulars (` In Million) Tangible fixed assets 90.89
Current assets 3.62
Less: Current liabilities 3.41
Total Consideration paid 91.10
Notes forming part of the financial statements (Contd.)
27 ADDITIONAL INFORMATION TO THE FINANCIAL STATEMENTS (Contd.)
Financial Statements73
An
nu
al Rep
ort 2012-13
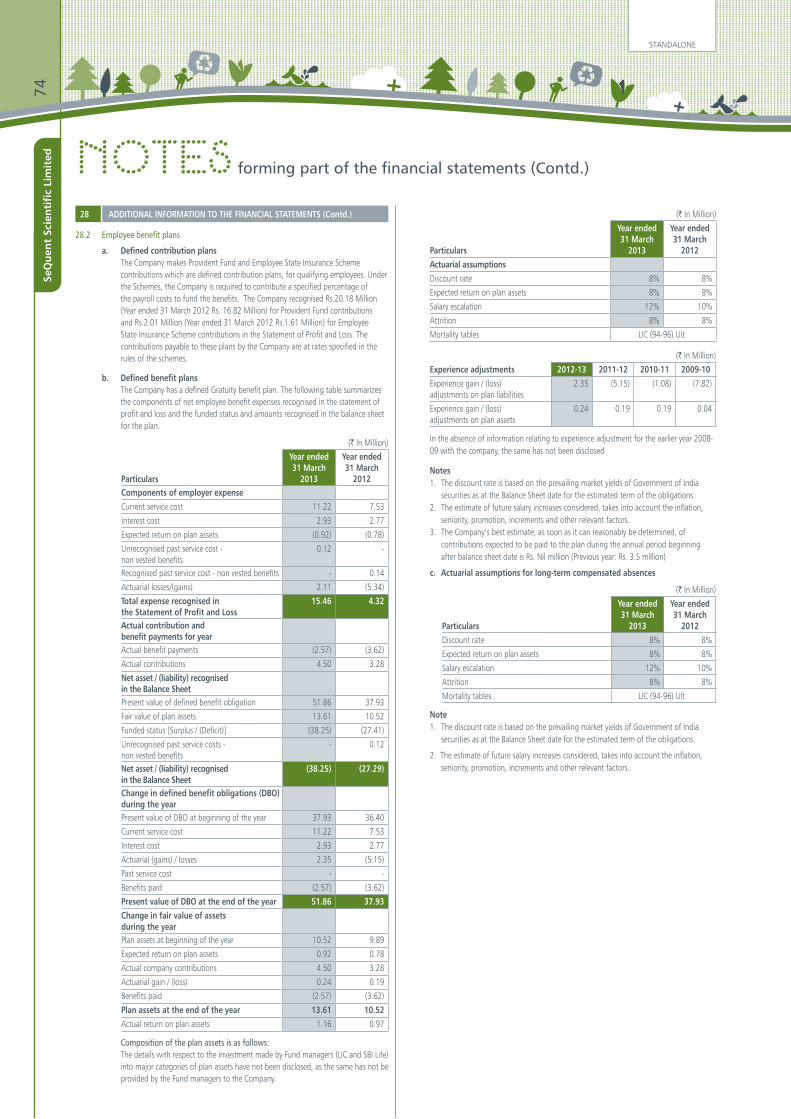
28.2 Employee benefit plans
a. Defined contribution plans The Company makes Provident Fund and Employee State Insurance Scheme
contributions which are defined contribution plans, for qualifying employees. Under the Schemes, the Company is required to contribute a specified percentage of the payroll costs to fund the benefits. The Company recognised Rs.20.18 Million (Year ended 31 March 2012 Rs. 16.82 Million) for Provident Fund contributions and Rs.2.01 Million (Year ended 31 March 2012 Rs.1.61 Million) for Employee State Insurance Scheme contributions in the Statement of Profit and Loss. The contributions payable to these plans by the Company are at rates specified in the rules of the schemes.
b. Defined benefit plans The Company has a defined Gratuity benefit plan. The following table summarizes
the components of net employee benefit expenses recognised in the statement of profit and loss and the funded status and amounts recognised in the balance sheet for the plan.
(` In Million)
Particulars
Year ended 31 March
2013
Year ended 31 March
2012Components of employer expenseCurrent service cost 11.22 7.53
Interest cost 2.93 2.77
Expected return on plan assets (0.92) (0.78)
Unrecognised past service cost - non vested benefits
0.12 -
Recognised past service cost - non vested benefits - 0.14
Actuarial losses/(gains) 2.11 (5.34)
Total expense recognised in the Statement of Profit and Loss
15.46 4.32
Actual contribution and benefit payments for year Actual benefit payments (2.57) (3.62)
Actual contributions 4.50 3.28
Net asset / (liability) recognised in the Balance Sheet Present value of defined benefit obligation 51.86 37.93
Fair value of plan assets 13.61 10.52
Funded status [Surplus / (Deficit)] (38.25) (27.41)
Unrecognised past service costs - non vested benefits
- 0.12
Net asset / (liability) recognised in the Balance Sheet
(38.25) (27.29)
Change in defined benefit obligations (DBO) during the year Present value of DBO at beginning of the year 37.93 36.40
Current service cost 11.22 7.53
Interest cost 2.93 2.77
Actuarial (gains) / losses 2.35 (5.15)
Past service cost - -
Benefits paid (2.57) (3.62)
Present value of DBO at the end of the year 51.86 37.93 Change in fair value of assets during the year Plan assets at beginning of the year 10.52 9.89
Expected return on plan assets 0.92 0.78
Actual company contributions 4.50 3.28
Actuarial gain / (loss) 0.24 0.19
Benefits paid (2.57) (3.62)
Plan assets at the end of the year 13.61 10.52 Actual return on plan assets 1.16 0.97
Composition of the plan assets is as follows: The details with respect to the investment made by Fund managers (LIC and SBI Life)
into major categories of plan assets have not been disclosed, as the same has not be provided by the Fund managers to the Company.
Notes forming part of the financial statements (Contd.)
28 ADDITIONAL INFORMATION TO THE FINANCIAL STATEMENTS (Contd.) (` In Million)
Particulars
Year ended 31 March
2013
Year ended 31 March
2012Actuarial assumptionsDiscount rate 8% 8%
Expected return on plan assets 8% 8%
Salary escalation 12% 10%
Attrition 8% 8%
Mortality tables LIC (94-96) Ult
(` In Million)
Experience adjustments 2012-13 2011-12 2010-11 2009-10Experience gain / (loss) adjustments on plan liabilities
2.35 (5.15) (1.08) (7.82)
Experience gain / (loss) adjustments on plan assets
0.24 0.19 0.19 0.04
In the absence of information relating to experience adjustment for the earlier year 2008-09 with the company, the same has not been disclosed
Notes 1. The discount rate is based on the prevailing market yields of Government of India
securities as at the Balance Sheet date for the estimated term of the obligations. 2. The estimate of future salary increases considered, takes into account the inflation,
seniority, promotion, increments and other relevant factors. 3. The Company’s best estimate, as soon as it can reasonably be determined, of
contributions expected to be paid to the plan during the annual period beginning after balance sheet date is Rs. Nil million (Previous year: Rs. 3.5 million)
c. Actuarial assumptions for long-term compensated absences
(` In Million)
Particulars
Year ended 31 March
2013
Year ended 31 March
2012Discount rate 8% 8%
Expected return on plan assets 8% 8%
Salary escalation 12% 10%
Attrition 8% 8%
Mortality tables LIC (94-96) Ult
Note 1. The discount rate is based on the prevailing market yields of Government of India
securities as at the Balance Sheet date for the estimated term of the obligations.
2. The estimate of future salary increases considered, takes into account the inflation, seniority, promotion, increments and other relevant factors.
STANDALONE74
SeQ
uen
t Sc
ien
tifi
c Li
mit
ed
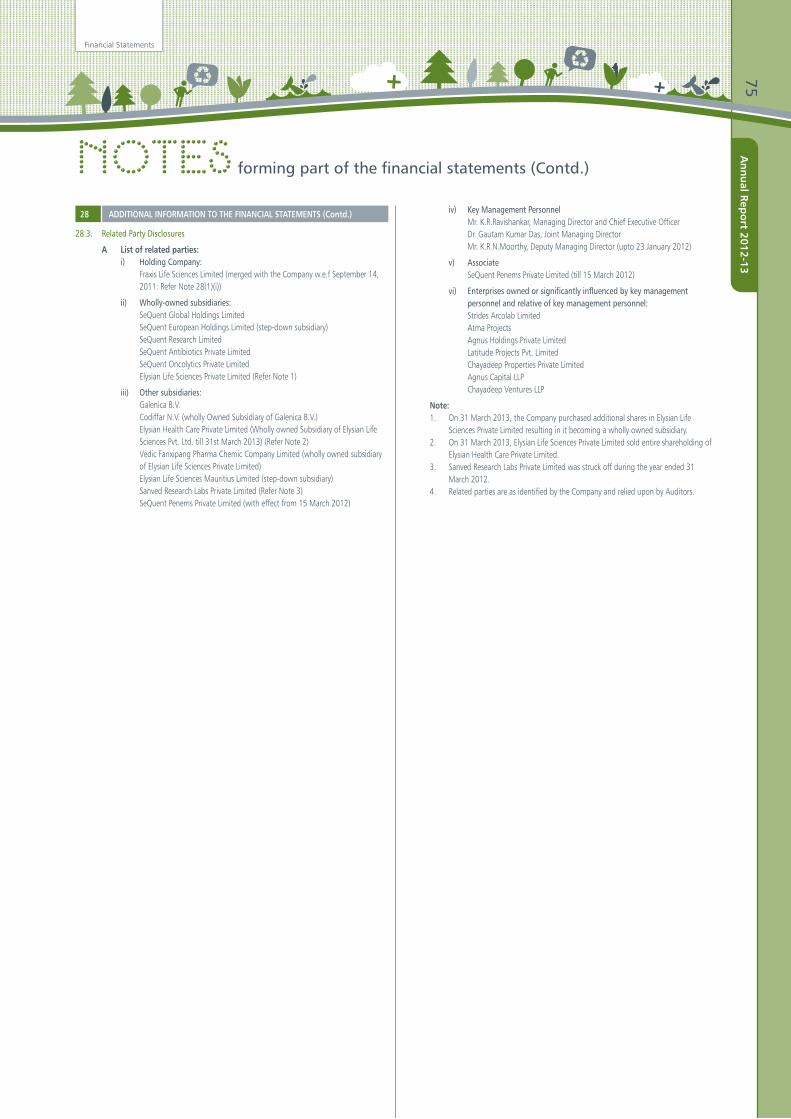
28.3. Related Party Disclosures
A List of related parties: i) Holding Company: Fraxis Life Sciences Limited (merged with the Company w.e.f September 14,
2011: Refer Note 28(1)(i))
ii) Wholly-owned subsidiaries: SeQuent Global Holdings Limited SeQuent European Holdings Limited (step-down subsidiary) SeQuent Research Limited SeQuent Antibiotics Private Limited SeQuent Oncolytics Private Limited Elysian Life Sciences Private Limited (Refer Note 1)
iii) Other subsidiaries: Galenica B.V. Codiffar N.V. (wholly Owned Subsidiary of Galenica B.V.) Elysian Health Care Private Limited (Wholly owned Subsidiary of Elysian Life
Sciences Pvt. Ltd. till 31st March 2013) (Refer Note 2) Vedic Fanxipang Pharma Chemic Company Limited (wholly owned subsidiary
of Elysian Life Sciences Private Limited) Elysian Life Sciences Mauritius Limited (step-down subsidiary) Sanved Research Labs Private Limited (Refer Note 3) SeQuent Penems Private Limited (with effect from 15 March 2012)
iv) Key Management Personnel Mr. K.R.Ravishankar, Managing Director and Chief Executive Officer Dr. Gautam Kumar Das, Joint Managing Director Mr. K.R.N.Moorthy, Deputy Managing Director (upto 23 January 2012)
v) Associate SeQuent Penems Private Limited (till 15 March 2012)
vi) Enterprises owned or significantly influenced by key management personnel and relative of key management personnel:
Strides Arcolab Limited Atma Projects Agnus Holdings Private Limited Latitude Projects Pvt. Limited Chayadeep Properties Private Limited Agnus Capital LLP Chayadeep Ventures LLP
Note: 1. On 31 March 2013, the Company purchased additional shares in Elysian Life
Sciences Private Limited resulting in it becoming a wholly owned subsidiary. 2. On 31 March 2013, Elysian Life Sciences Private Limited sold entire shareholding of
Elysian Health Care Private Limited. 3. Sanved Research Labs Private Limited was struck off during the year ended 31
March 2012. 4. Related parties are as identified by the Company and relied upon by Auditors.
Notes forming part of the financial statements (Contd.)
28 ADDITIONAL INFORMATION TO THE FINANCIAL STATEMENTS (Contd.)
Financial Statements75
An
nu
al Rep
ort 2012-13

Notes forming part of the financial statements (Contd.)
B.
Tran
sact
ion
durin
g th
e ye
ar
(i)Sa
le o
f mat
eria
l/ser
vice
s
Strid
es A
rcol
ab Li
mite
d 3
3.72
2
.92
SeQu
ent A
ntib
iotic
s Priv
ate
Limite
d -
0.4
1
SeQu
ent R
esea
rch
Limite
d -
0.0
7
(ii)
Sale
of m
achi
nery
/ass
ets
SeQu
ent A
ntib
iotic
s Priv
ate
Limite
d -
19.
67
SeQu
ent R
esea
rch
Limite
d 0
.01
-
SeQu
ent P
enem
s Priv
ate
Limite
d (S
lum
p sa
le) -
90.
00
(iii)
Inte
rest
& o
ther
inco
me
SeQu
ent A
ntib
iotic
s Priv
ate
Limite
d 0
.54
9.7
3
Elysia
n Lif
e Sc
ience
s Priv
ate
Limite
d 6
.48
4.6
5
SeQu
ent P
enem
s Priv
ate
Limite
d 4
.11
0.6
7 -
15.
58
(iv)
Inte
rest
pai
d
Chay
adee
p Pr
oper
ties P
vt. L
td.
17.
36
-
SeQu
ent R
esea
rch
Limite
d 1
.70
-
(v)
Purc
hase
of m
ater
ials
Strid
es A
rcol
ab Li
mite
d -
0.7
3 -
Vedi
c Fan
xipan
g Ph
arm
a Ch
emic
Com
pany
Lim
ited
30.
89
83.
49
Elysia
n Lif
e Sc
ience
s Mau
ritiu
s Lim
ited
18.
31
-
(vi)
Purc
hase
of m
achi
nery
/ass
ets
SeQu
ent P
enem
s Priv
ate
Limite
d -
0.2
0
(vii)
Purc
hase
of a
sset
s (Sl
ump
sale
bas
is)
SeQu
ent A
ntib
iotic
s Priv
ate
Limite
d -
91.
10
(viii
)Co
mm
issio
n pa
id o
n pu
rcha
ses
Elysia
n Lif
e Sc
ience
s Priv
ate
Limite
d -
4.4
3
(ix)
Man
ager
ial r
emun
erat
ion
(Ref
er N
ote
27.1
1)
Mr.
K.R.
Ravis
hank
ar 4
7.87
2
1.24
Dr. G
auth
am K
umar
Das
14.
95
9.9
9
Mr.
K.R.
N.M
oorth
y -
9.7
3
28B
ADD
ITIO
NAL
INFO
RMAT
ION
TO T
HE F
INAN
CIAL
STA
TEM
ENTS
(Con
td.)
(` In
Milli
on)
Natu
re o
f Tra
nsac
tions
WHO
LLY
OWNE
D SU
BSID
IARI
ES
OTH
ER S
UBSI
DIAR
IES
ASS
OCIA
TES
KEY
MAN
AGEM
ENT
PERS
ONNE
L
ENT
ERPR
ISES
OW
NED
OR
SIGN
IFIC
ANTL
Y IN
FLUE
NCED
BY
KEY
MAN
AGEM
ENT
PERS
ONNE
L OR
THE
IR
RELA
TIVE
S
Yea
r End
ed
31.0
3.20
13
Yea
r End
ed
31.0
3.20
12
Yea
r End
ed
31.0
3.20
13
Yea
r End
ed
31.0
3.20
12
Yea
r End
ed
31.0
3.20
13
Yea
r End
ed
31.0
3.20
12
Yea
r End
ed
31.0
3.20
13
Yea
r End
ed
31.0
3.20
12
Yea
r End
ed
31.0
3.20
13
Yea
r End
ed
31.0
3.20
12
STANDALONE76
SeQ
uen
t Sc
ien
tifi
c Li
mit
ed
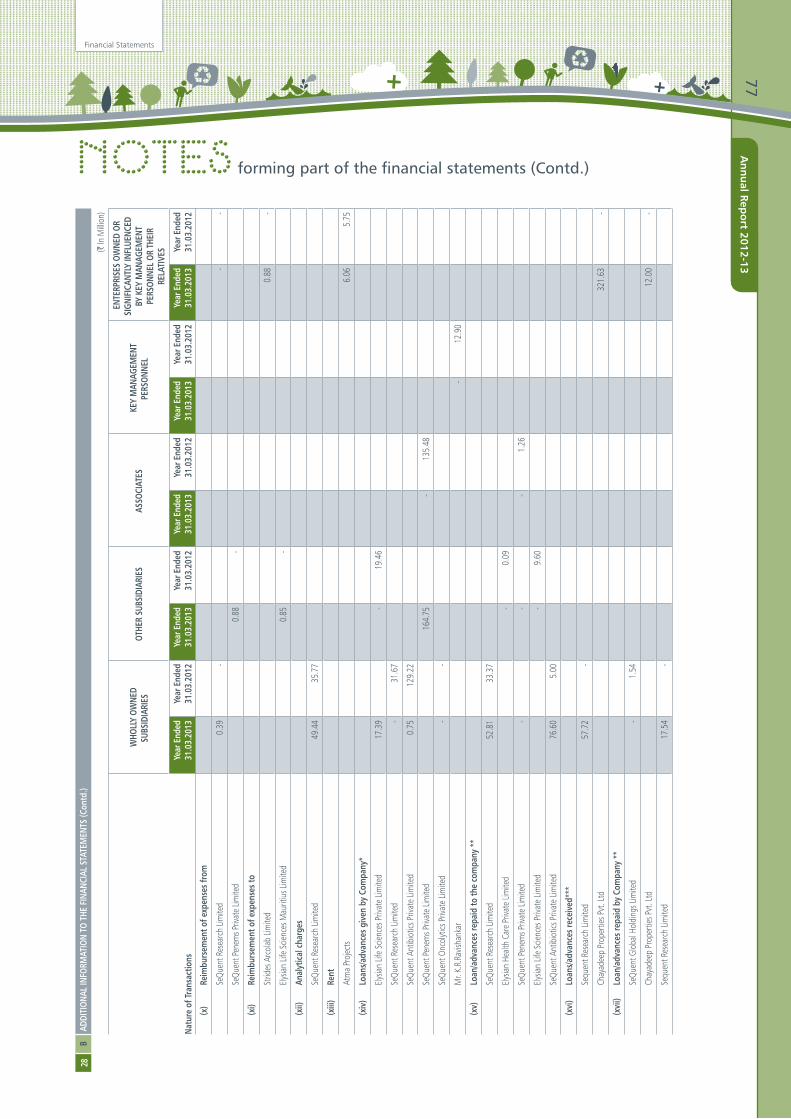
Notes forming part of the financial statements (Contd.)
28B
ADD
ITIO
NAL
INFO
RMAT
ION
TO T
HE F
INAN
CIAL
STA
TEM
ENTS
(Con
td.)
(` In
Milli
on)
Natu
re o
f Tra
nsac
tions
WHO
LLY
OWNE
D SU
BSID
IARI
ES
OTH
ER S
UBSI
DIAR
IES
ASS
OCIA
TES
KEY
MAN
AGEM
ENT
PERS
ONNE
L
ENT
ERPR
ISES
OW
NED
OR
SIGN
IFIC
ANTL
Y IN
FLUE
NCED
BY
KEY
MAN
AGEM
ENT
PERS
ONNE
L OR
THE
IR
RELA
TIVE
S
Yea
r End
ed
31.0
3.20
13
Yea
r End
ed
31.0
3.20
12
Yea
r End
ed
31.0
3.20
13
Yea
r End
ed
31.0
3.20
12
Yea
r End
ed
31.0
3.20
13
Yea
r End
ed
31.0
3.20
12
Yea
r End
ed
31.0
3.20
13
Yea
r End
ed
31.0
3.20
12
Yea
r End
ed
31.0
3.20
13
Yea
r End
ed
31.0
3.20
12
(x)
Reim
burs
emen
t of e
xpen
ses f
rom
SeQu
ent R
esea
rch
Limite
d 0
.39
- -
-
SeQu
ent P
enem
s Priv
ate
Limite
d 0
.88
-
(xi)
Reim
burs
emen
t of e
xpen
ses t
o
Strid
es A
rcol
ab Li
mite
d 0
.88
-
Elysia
n Lif
e Sc
ience
s Mau
ritiu
s Lim
ited
0.8
5 -
(xii)
Anal
ytic
al c
harg
es
SeQu
ent R
esea
rch
Limite
d 4
9.44
3
5.77
(xiii
)Re
nt
Atm
a Pr
ojec
ts 6
.06
5.7
5
(xiv
)Lo
ans/a
dvan
ces g
iven
by
Com
pany
*
Elysia
n Lif
e Sc
ience
s Priv
ate
Limite
d 1
7.39
-
19.
46
SeQu
ent R
esea
rch
Limite
d -
31.
67
SeQu
ent A
ntib
iotic
s Priv
ate
Limite
d 0
.75
129
.22
SeQu
ent P
enem
s Priv
ate
Limite
d 1
64.7
5 -
135
.48
SeQu
ent O
ncol
ytics
Priv
ate
Limite
d -
-
Mr.
K.R.
Ravis
hank
ar -
12.
90
(xv)
Loan
/adv
ance
s rep
aid
to th
e co
mpa
ny *
*
SeQu
ent R
esea
rch
Limite
d 5
2.81
3
3.37
Elysia
n He
alth
Care
Priv
ate
Limite
d -
0.0
9
SeQu
ent P
enem
s Priv
ate
Limite
d -
- -
1.2
6
Elysia
n Lif
e Sc
ience
s Priv
ate
Limite
d -
9.6
0
SeQu
ent A
ntib
iotic
s Priv
ate
Limite
d 7
6.60
5
.00
(xvi
)Lo
ans/a
dvan
ces r
ecei
ved*
**
Sequ
ent R
esea
rch
Limite
d57
.72
-
Chay
adee
p Pr
oper
ties P
vt. L
td 3
21.6
3 -
(xvi
i)Lo
an/a
dvan
ces r
epai
d by
Com
pany
**
SeQu
ent G
loba
l Hol
ding
s Lim
ited
- 1
.54
Chay
adee
p Pr
oper
ties P
vt. L
td 1
2.00
-
Sequ
ent R
esea
rch
Limite
d 1
7.54
-
Financial Statements77
An
nu
al Rep
ort 2012-13
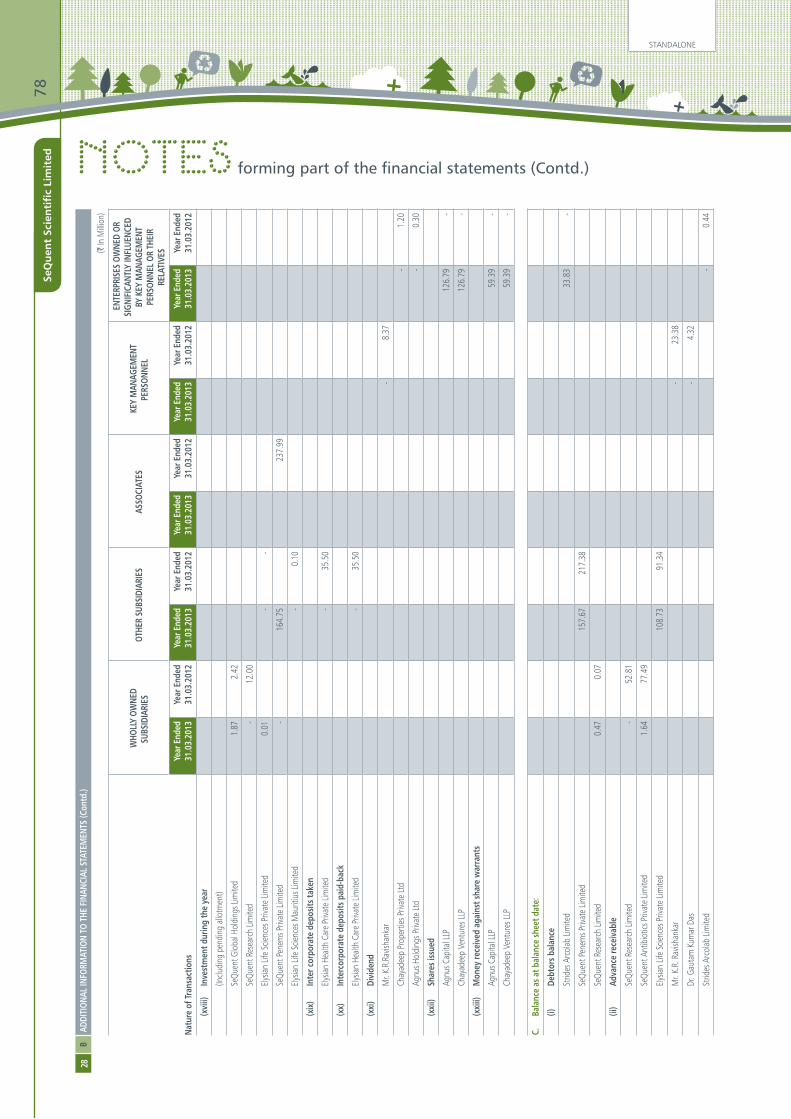
Notes forming part of the financial statements (Contd.)
28B
ADD
ITIO
NAL
INFO
RMAT
ION
TO T
HE F
INAN
CIAL
STA
TEM
ENTS
(Con
td.)
(` In
Milli
on)
Natu
re o
f Tra
nsac
tions
WHO
LLY
OWNE
D SU
BSID
IARI
ES
OTH
ER S
UBSI
DIAR
IES
ASS
OCIA
TES
KEY
MAN
AGEM
ENT
PERS
ONNE
L
ENT
ERPR
ISES
OW
NED
OR
SIGN
IFIC
ANTL
Y IN
FLUE
NCED
BY
KEY
MAN
AGEM
ENT
PERS
ONNE
L OR
THE
IR
RELA
TIVE
S
Yea
r End
ed
31.0
3.20
13
Yea
r End
ed
31.0
3.20
12
Yea
r End
ed
31.0
3.20
13
Yea
r End
ed
31.0
3.20
12
Yea
r End
ed
31.0
3.20
13
Yea
r End
ed
31.0
3.20
12
Yea
r End
ed
31.0
3.20
13
Yea
r End
ed
31.0
3.20
12
Yea
r End
ed
31.0
3.20
13
Yea
r End
ed
31.0
3.20
12
(xvi
ii)In
vest
men
t dur
ing
the
year
(Inclu
ding
pen
ding
allo
tmen
t)
SeQu
ent G
loba
l Hol
ding
s Lim
ited
1.8
7 2
.42
SeQu
ent R
esea
rch
Limite
d -
12.
00
Elysia
n Lif
e Sc
ience
s Priv
ate
Limite
d 0
.01
- -
SeQu
ent P
enem
s Priv
ate
Limite
d -
164
.75
237
.99
Elysia
n Lif
e Sc
ience
s Mau
ritiu
s Lim
ited
- 0
.10
(xix
)In
ter c
orpo
rate
dep
osits
take
n
Elysia
n He
alth
Care
Priv
ate
Limite
d -
35.
50
(xx)
Inte
rcor
pora
te d
epos
its p
aid-
back
Elysia
n He
alth
Care
Priv
ate
Limite
d -
35.
50
(xxi
)Di
vide
nd
Mr.
K.R.
Ravis
hank
ar -
8.3
7
Chay
adee
p Pr
oper
ties P
rivat
e Lt
d -
1.2
0
Agnu
s Hol
ding
s Priv
ate
Ltd
- 0
.30
(xxi
i)Sh
ares
issu
ed
Agnu
s Cap
ital L
LP 1
26.7
9 -
Chay
adee
p Ve
ntur
es LL
P 1
26.7
9 -
(xxi
ii)M
oney
rece
ived
aga
inst
shar
e w
arra
nts
Agnu
s Cap
ital L
LP 5
9.39
-
Chay
adee
p Ve
ntur
es LL
P 5
9.39
-
C.
Bala
nce
as a
t bal
ance
shee
t dat
e:
(i)De
btor
s bal
ance
Strid
es A
rcol
ab Li
mite
d 3
3.83
-
SeQu
ent P
enem
s Priv
ate
Limite
d 1
57.6
7 2
17.3
8
SeQu
ent R
esea
rch
Limite
d 0
.47
0.0
7
(ii)
Adva
nce
rece
ivab
le
SeQu
ent R
esea
rch
Limite
d -
52.
81
SeQu
ent A
ntib
iotic
s Priv
ate
Limite
d 1
.64
77.
49
Elysia
n Lif
e Sc
ience
s Priv
ate
Limite
d 1
08.7
3 9
1.34
Mr.
K.R.
Rav
ishan
kar
- 2
3.38
Dr. G
auta
m K
umar
Das
- 4
.32
Strid
es A
rcol
ab Li
mite
d -
0.4
4
STANDALONE78
SeQ
uen
t Sc
ien
tifi
c Li
mit
ed
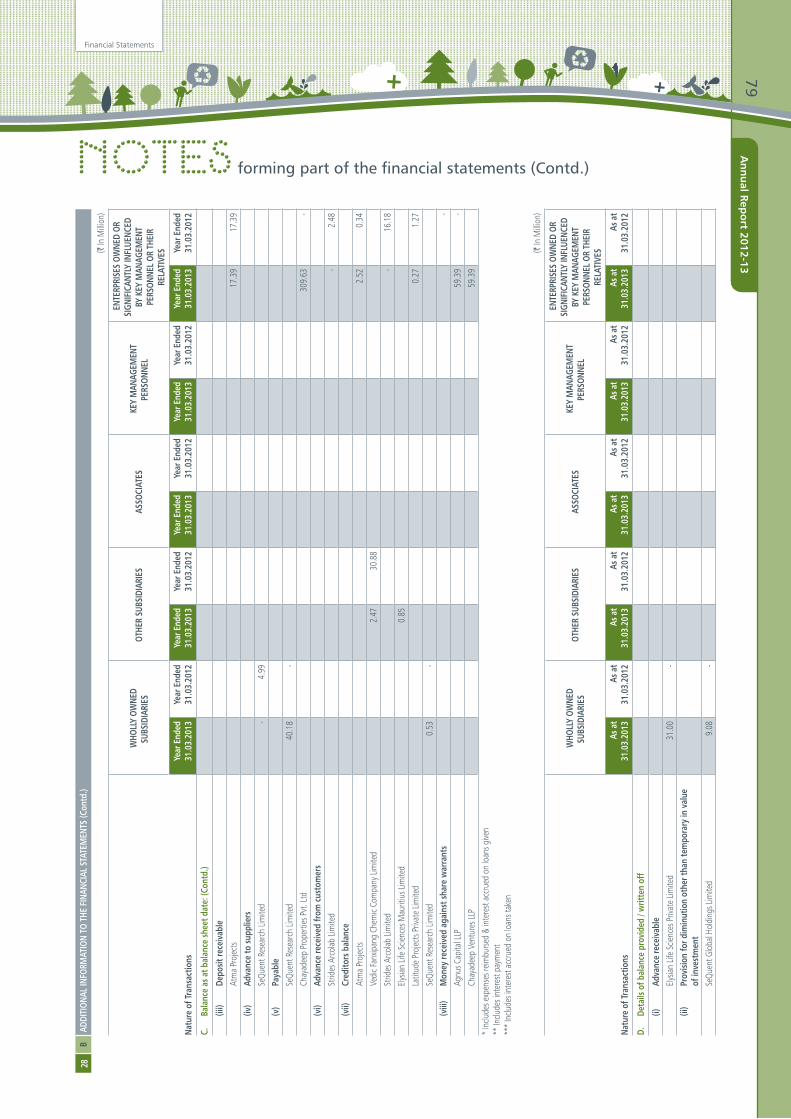
Notes forming part of the financial statements (Contd.)
28B
ADD
ITIO
NAL
INFO
RMAT
ION
TO T
HE F
INAN
CIAL
STA
TEM
ENTS
(Con
td.)
(` In
Milli
on)
Natu
re o
f Tra
nsac
tions
WHO
LLY
OWNE
D SU
BSID
IARI
ES
OTH
ER S
UBSI
DIAR
IES
ASS
OCIA
TES
KEY
MAN
AGEM
ENT
PERS
ONNE
L
ENT
ERPR
ISES
OW
NED
OR
SIGN
IFIC
ANTL
Y IN
FLUE
NCED
BY
KEY
MAN
AGEM
ENT
PERS
ONNE
L OR
THE
IR
RELA
TIVE
S
Yea
r End
ed
31.0
3.20
13
Yea
r End
ed
31.0
3.20
12
Yea
r End
ed
31.0
3.20
13
Yea
r End
ed
31.0
3.20
12
Yea
r End
ed
31.0
3.20
13
Yea
r End
ed
31.0
3.20
12
Yea
r End
ed
31.0
3.20
13
Yea
r End
ed
31.0
3.20
12
Yea
r End
ed
31.0
3.20
13
Yea
r End
ed
31.0
3.20
12
C.
Bala
nce
as a
t bal
ance
shee
t dat
e: (C
ontd
.)
(iii)
Depo
sit re
ceiv
able
Atm
a Pr
ojec
ts 1
7.39
1
7.39
(iv)
Adva
nce
to su
pplie
rsSe
Quen
t Res
earc
h Lim
ited
- 4
.99
(v)
Paya
ble
SeQu
ent R
esea
rch
Limite
d 4
0.18
-
Chay
adee
p Pr
oper
ties P
vt. L
td 3
09.6
3 -
(vi)
Adva
nce
rece
ived
from
cus
tom
ers
Strid
es A
rcol
ab Li
mite
d -
2.4
8
(vii)
Cred
itors
bal
ance
Atm
a Pr
ojec
ts 2
.52
0.3
4
Vedi
c Fan
xipan
g Ch
emic
Com
pany
Lim
ited
2.4
7 3
0.88
Strid
es A
rcol
ab Li
mite
d -
16.
18
Elysia
n Lif
e Sc
ience
s Mau
ritiu
s Lim
ited
0.8
5
Latit
ude
Proj
ects
Priva
te Li
mite
d 0
.27
1.2
7
SeQu
ent R
esea
rch
Limite
d 0
.53
-
(viii
)M
oney
rece
ived
aga
inst
shar
e w
arra
nts
-
Agnu
s Cap
ital L
LP 5
9.39
-
Chay
adee
p Ve
ntur
es LL
P 5
9.39
* In
clude
s exp
ense
s reim
burse
d &
inte
rest
accr
ued
on lo
ans g
iven
** In
clude
s int
eres
t pay
men
t **
* In
clude
s int
eres
t acc
rued
on
loan
s tak
en
(` In
Milli
on)
Natu
re o
f Tra
nsac
tions
WHO
LLY
OWNE
D SU
BSID
IARI
ES
OTH
ER S
UBSI
DIAR
IES
ASS
OCIA
TES
KEY
MAN
AGEM
ENT
PERS
ONNE
L
ENT
ERPR
ISES
OW
NED
OR
SIGN
IFIC
ANTL
Y IN
FLUE
NCED
BY
KEY
MAN
AGEM
ENT
PERS
ONNE
L OR
THE
IR
RELA
TIVE
S
As a
t 31
.03.
2013
A
s at
31.0
3.20
12
As a
t 31
.03.
2013
A
s at
31.0
3.20
12
As a
t 31
.03.
2013
A
s at
31.0
3.20
12
As a
t 31
.03.
2013
A
s at
31.0
3.20
12
As a
t 31
.03.
2013
A
s at
31.0
3.20
12
D.
Deta
ils o
f bal
ance
pro
vide
d / w
ritte
n of
f
(i)Ad
vanc
e re
ceiv
able
Elysia
n Lif
e Sc
ience
s Priv
ate
Limite
d 3
1.00
-
(ii)
Prov
ision
for d
imin
utio
n ot
her t
han
tem
pora
ry in
val
ue
of in
vest
men
tSe
Quen
t Glo
bal H
oldi
ngs L
imite
d 9
.08
-
Financial Statements79
An
nu
al Rep
ort 2012-13
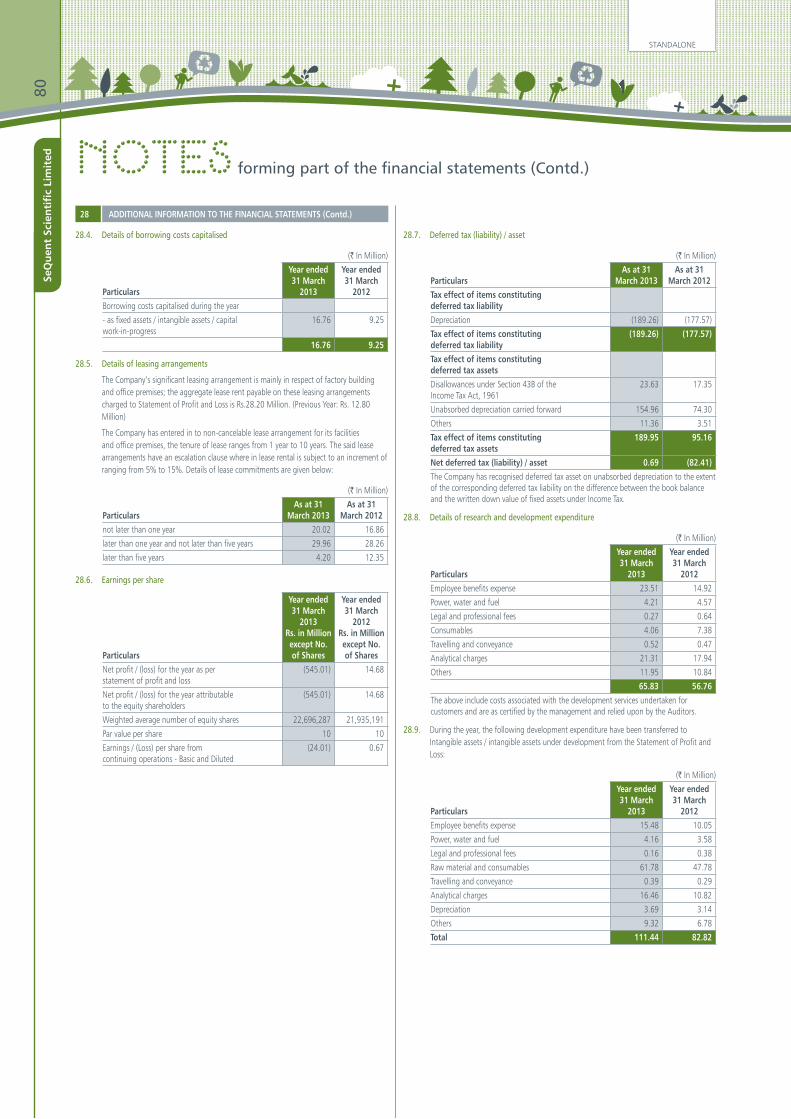
28.4. Details of borrowing costs capitalised
(` In Million)
Particulars
Year ended 31 March
2013
Year ended 31 March
2012Borrowing costs capitalised during the year
- as fixed assets / intangible assets / capital work-in-progress
16.76 9.25
16.76 9.25
28.5. Details of leasing arrangements
The Company’s significant leasing arrangement is mainly in respect of factory building and office premises; the aggregate lease rent payable on these leasing arrangements charged to Statement of Profit and Loss is Rs.28.20 Million. (Previous Year: Rs. 12.80 Million)
The Company has entered in to non-cancelable lease arrangement for its facilities and office premises, the tenure of lease ranges from 1 year to 10 years. The said lease arrangements have an escalation clause where in lease rental is subject to an increment of ranging from 5% to 15%. Details of lease commitments are given below:
(` In Million)
ParticularsAs at 31
March 2013As at 31
March 2012not later than one year 20.02 16.86
later than one year and not later than five years 29.96 28.26
later than five years 4.20 12.35
28.6. Earnings per share
Particulars
Year ended 31 March
2013 Rs. in Million except No.of Shares
Year ended 31 March
2012Rs. in Million except No. of Shares
Net profit / (loss) for the year as per statement of profit and loss
(545.01) 14.68
Net profit / (loss) for the year attributable to the equity shareholders
(545.01) 14.68
Weighted average number of equity shares 22,696,287 21,935,191
Par value per share 10 10
Earnings / (Loss) per share from continuing operations - Basic and Diluted
(24.01) 0.67
28.7. Deferred tax (liability) / asset
(` In Million)
ParticularsAs at 31
March 2013As at 31
March 2012Tax effect of items constituting deferred tax liabilityDepreciation (189.26) (177.57)
Tax effect of items constituting deferred tax liability
(189.26) (177.57)
Tax effect of items constituting deferred tax assetsDisallowances under Section 43B of theIncome Tax Act, 1961
23.63 17.35
Unabsorbed depreciation carried forward 154.96 74.30
Others 11.36 3.51
Tax effect of items constituting deferred tax assets
189.95 95.16
Net deferred tax (liability) / asset 0.69 (82.41)The Company has recognised deferred tax asset on unabsorbed depreciation to the extent of the corresponding deferred tax liability on the difference between the book balance and the written down value of fixed assets under Income Tax.
28.8. Details of research and development expenditure
(` In Million)
Particulars
Year ended 31 March
2013
Year ended 31 March
2012Employee benefits expense 23.51 14.92
Power, water and fuel 4.21 4.57
Legal and professional fees 0.27 0.64
Consumables 4.06 7.38
Travelling and conveyance 0.52 0.47
Analytical charges 21.31 17.94
Others 11.95 10.84
65.83 56.76 The above include costs associated with the development services undertaken for customers and are as certified by the management and relied upon by the Auditors.
28.9. During the year, the following development expenditure have been transferred to Intangible assets / intangible assets under development from the Statement of Profit and Loss:
(` In Million)
Particulars
Year ended 31 March
2013
Year ended 31 March
2012Employee benefits expense 15.48 10.05
Power, water and fuel 4.16 3.58
Legal and professional fees 0.16 0.38
Raw material and consumables 61.78 47.78
Travelling and conveyance 0.39 0.29
Analytical charges 16.46 10.82
Depreciation 3.69 3.14
Others 9.32 6.78
Total 111.44 82.82
Notes forming part of the financial statements (Contd.)
28 ADDITIONAL INFORMATION TO THE FINANCIAL STATEMENTS (Contd.)
STANDALONE80
SeQ
uen
t Sc
ien
tifi
c Li
mit
ed
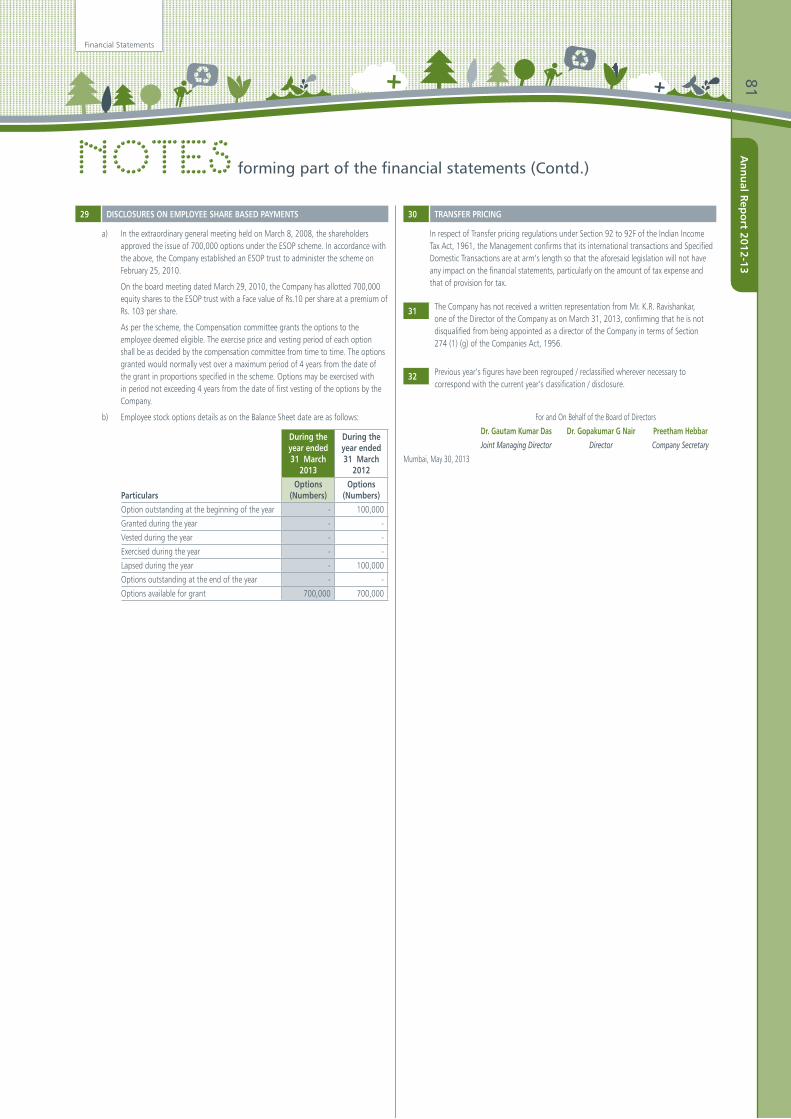
Notes forming part of the financial statements (Contd.)
29 DISCLOSURES ON EMPLOYEE SHARE BASED PAYMENTS
a) In the extraordinary general meeting held on March 8, 2008, the shareholders approved the issue of 700,000 options under the ESOP scheme. In accordance with the above, the Company established an ESOP trust to administer the scheme on February 25, 2010.
On the board meeting dated March 29, 2010, the Company has allotted 700,000 equity shares to the ESOP trust with a Face value of Rs.10 per share at a premium of Rs. 103 per share.
As per the scheme, the Compensation committee grants the options to the employee deemed eligible. The exercise price and vesting period of each option shall be as decided by the compensation committee from time to time. The options granted would normally vest over a maximum period of 4 years from the date of the grant in proportions specified in the scheme. Options may be exercised with in period not exceeding 4 years from the date of first vesting of the options by the Company.
b) Employee stock options details as on the Balance Sheet date are as follows:
Particulars
During the year ended 31 March
2013
During the year ended 31 March
2012Options
(Numbers)Options
(Numbers)Option outstanding at the beginning of the year - 100,000
Granted during the year - -
Vested during the year - -
Exercised during the year - -
Lapsed during the year - 100,000
Options outstanding at the end of the year - -
Options available for grant 700,000 700,000
30 TRANSFER PRICING
In respect of Transfer pricing regulations under Section 92 to 92F of the Indian Income Tax Act, 1961, the Management confirms that its international transactions and Specified Domestic Transactions are at arm’s length so that the aforesaid legislation will not have any impact on the financial statements, particularly on the amount of tax expense and that of provision for tax.
31 The Company has not received a written representation from Mr. K.R. Ravishankar, one of the Director of the Company as on March 31, 2013, confirming that he is not disqualified from being appointed as a director of the Company in terms of Section 274 (1) (g) of the Companies Act, 1956.
32 Previous year’s figures have been regrouped / reclassified wherever necessary to correspond with the current year’s classification / disclosure.
For and On Behalf of the Board of Directors
Dr. Gautam Kumar Das Dr. Gopakumar G Nair Preetham HebbarJoint Managing Director Director Company Secretary
Mumbai, May 30, 2013
Financial Statements81
An
nu
al Rep
ort 2012-13
ConsolidatedFinancial Statements
SeQ
uen
t Sc
ien
tifi
c Li
mit
ed
To The Board of Directors ofSEQUENT SCIENTIFIC LIMITEDReport on the Consolidated Financial StatementsWe have audited the accompanying consolidated financial statements of SEQUENT SCIENTIFIC LIMITED(the “Company”) and its subsidiaries (the Company and its subsidiaries constitute “the Group”), which comprise the Consolidated Balance Sheet as at March 31, 2013, the Consolidated Statement of Profit and Loss and the Consolidated Cash Flow Statement for the year then ended and a summary of the significant accounting policies and other explanatory information.Management’s Responsibility for the Consolidated Financial StatementsThe Company’s Management is responsible for the preparation of these consolidated financial statements that give a true and fair view of the consolidated financial position, consolidated financial performance and consolidated cash flows of the Group in accordance with the accounting principles generally accepted in India. This responsibility includes the design, implementation and maintenance of internal control relevant to the preparation and presentation of the consolidated financial statements that give a true and fair view and are free from material misstatement, whether due to fraud or error.
Auditors’ ResponsibilityOur responsibility is to express an opinion on these consolidated financial statements based on our audit. We conducted our audit in accordance with the Standards on Auditing issued by the Institute of Chartered Accountants of India. Those Standards require that we comply with ethical requirements and plan and perform the audit to obtain reasonable assurance about whether the consolidated financial statements are free from material misstatement.An audit involves performing procedures to obtain audit evidence about the amounts and the disclosures in the consolidated financial statements. The procedures selected depend on the auditor’s judgement, including the assessment of the risks of material misstatement of the consolidated financial statements, whether due to fraud or error. In making those risk assessments, the auditor considers internal control relevant to the Company’s preparation and presentation of the consolidated financial statements that give a true and fair view in order to design audit procedures that are appropriate in the circumstances, but not for the purpose of expressing an opinion on the effectiveness of the Company’s internal control. An audit also includes evaluating the appropriateness of the accounting policies used and the reasonableness of the accounting estimates made by the Management, as well as evaluating the overall presentation of the consolidated financial statements. We believe that the audit evidence we have obtained is sufficient and appropriate to provide a basis for our audit opinion.
OpinionIn our opinion and to the best of our information and according to the explanations given to us, based on the consideration of the reports of the other auditors on
the financial statements / financial information of the subsidiariesand read with the comments in respect of certain entities referred to below in the Other Matter paragraphs 1 and 2 respectively, the aforesaid consolidated financial statements give a true and fair view in conformity with the accounting principles generally accepted in India:(a) in the case of the Consolidated Balance Sheet, of the
state of affairs of the Group as at March 31, 2013;(b) in the case of the Consolidated Statement of Profit and
Loss, of the loss of the Group for the year ended on that date; and
(c) in the case of the Consolidated Cash Flow Statement, of the cash flows of the Group for the year ended on that date.
Other Matter1. We did not audit the financial statements / financial
information of eight subsidiaries, whose financial statements / financial information reflect total assets (net) of Rs.1,109.75 Million as at March 31, 2013, total revenues of Rs.139.96 Million and net cash flows amounting to Rs.(255.43)Million for the year ended on that date, as considered in the consolidated financial statements. These financial statements / financial information have been audited by other auditors whose reports have been furnished to us by the Management and our opinion, in so far as it relates to the amounts and disclosures included in respect of these subsidiaries is based solely on the reports of the other auditors.
2. The consolidated financial statements include the unaudited financial statements/financial information of two subsidiaries (Previous year ended March 31, 2012: two subsidiaries), whose financial statements/financial information reflect total assets (net) of Rs.49.07 Million as at March 31, 2013 (As at March 31, 2012: Rs.131.52Million), total revenue of Rs.0.06Million (Previous year ended March 31, 2012: Rs.5.64 Million) and net cash flows amounting to Rs.(16.11) Million (Previous year ended March 31, 2012: Rs. (16.88) Million for the year ended on that date, as considered in the consolidated financial statements. Our opinion, in so far as it relates to the amounts included in respect of these subsidiaries, is based solely on such unaudited financial statements/financial information.
Based on the explanations provided by Management, it is expected that there should be no material impact on the consolidated financial statements consequent to any possible adjustments in respect of the aforesaid entities where unaudited financial statements are available, since the size of these entities in the context of the Group is not material.Our opinion is not qualified in respect of these matters.
For DELOITTE HASKINS & SELLS Chartered Accountants (Firm Registration No. 008072S)
V. Srikumar Partner (Membership No. 84494)
Mumbai, May 30,2013
Independent AUDITORS’ REPORT
Financial Statements83
An
nu
al Rep
ort 2012-13
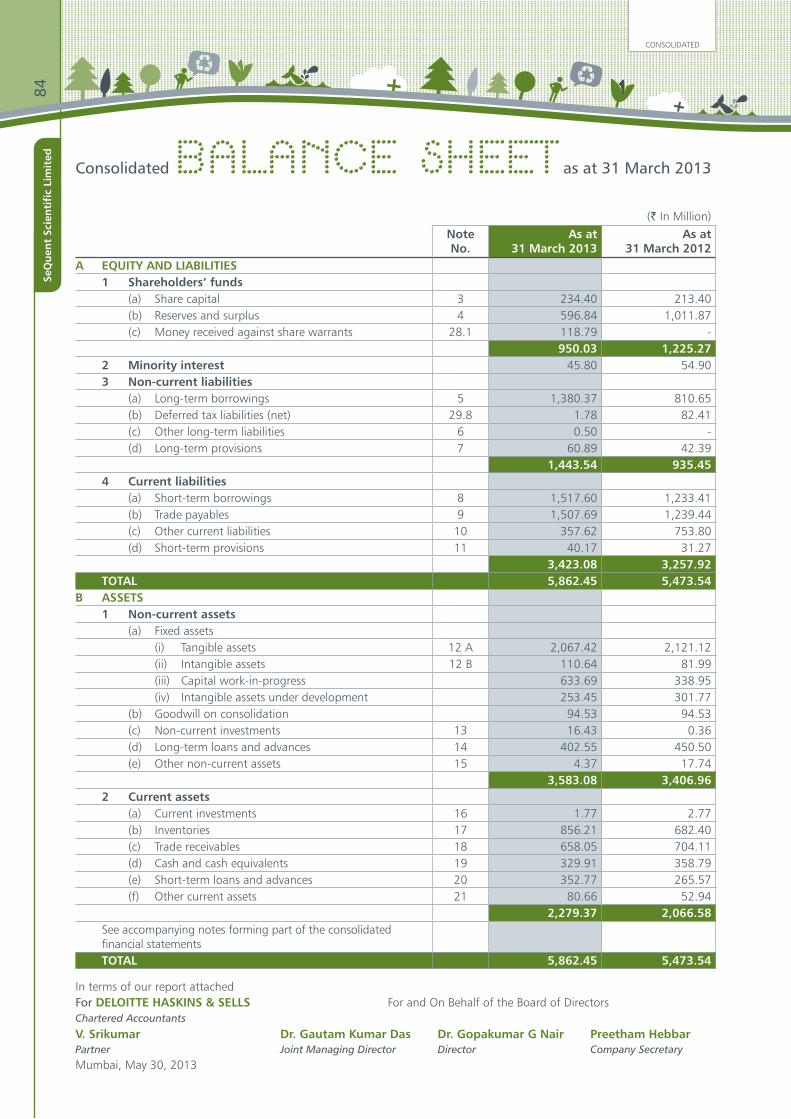
(` In Million) NoteNo.
As at31 March 2013
As at31 March 2012
A EQUITY AND LIABILITIES1 Shareholders’ funds
(a) Share capital 3 234.40 213.40 (b) Reserves and surplus 4 596.84 1,011.87 (c) Money received against share warrants 28.1 118.79 -
950.03 1,225.27 2 Minority interest 45.80 54.90 3 Non-current liabilities
(a) Long-term borrowings 5 1,380.37 810.65 (b) Deferred tax liabilities (net) 29.8 1.78 82.41 (c) Other long-term liabilities 6 0.50 - (d) Long-term provisions 7 60.89 42.39
1,443.54 935.45 4 Current liabilities
(a) Short-term borrowings 8 1,517.60 1,233.41 (b) Trade payables 9 1,507.69 1,239.44 (c) Other current liabilities 10 357.62 753.80 (d) Short-term provisions 11 40.17 31.27
3,423.08 3,257.92 TOTAL 5,862.45 5,473.54
B ASSETS1 Non-current assets
(a) Fixed assets(i) Tangible assets 12 A 2,067.42 2,121.12 (ii) Intangible assets 12 B 110.64 81.99 (iii) Capital work-in-progress 633.69 338.95 (iv) Intangible assets under development 253.45 301.77
(b) Goodwill on consolidation 94.53 94.53 (c) Non-current investments 13 16.43 0.36 (d) Long-term loans and advances 14 402.55 450.50 (e) Other non-current assets 15 4.37 17.74
3,583.08 3,406.96 2 Current assets
(a) Current investments 16 1.77 2.77 (b) Inventories 17 856.21 682.40 (c) Trade receivables 18 658.05 704.11 (d) Cash and cash equivalents 19 329.91 358.79 (e) Short-term loans and advances 20 352.77 265.57 (f) Other current assets 21 80.66 52.94
2,279.37 2,066.58 See accompanying notes forming part of the consolidated financial statementsTOTAL 5,862.45 5,473.54
In terms of our report attachedFor DELOITTE HASKINS & SELLS For and On Behalf of the Board of DirectorsChartered Accountants
V. Srikumar Dr. Gautam Kumar Das Dr. Gopakumar G Nair Preetham HebbarPartner Joint Managing Director Director Company SecretaryMumbai, May 30, 2013
Consolidated Balance Sheet as at 31 March 2013
CONSOLIDATED84
SeQ
uen
t Sc
ien
tifi
c Li
mit
ed

(` In Million) NoteNo.
Year Ended31 March 2013
Year Ended31 March 2012
1 Revenue from operations (gross) 22 3,419.28 3,584.64 Less: Excise duty 150.66 126.54 Revenue from operations (net) 3,268.62 3,458.10
2 Other income 23 25.64 104.83 3 Total revenue (1 + 2) 3,294.26 3,562.93 4 Expenses
(a) Cost of materials consumed 24.a 1,846.00 1,780.38 (b) Purchases of stock-in-trade 24.b 105.71 85.13 (c) Changes in inventories of finished goods and
work-in-progress & intermediates24.c (148.73) 54.87
(d) Employee benefits expense 25 414.68 294.02 (e) Finance costs 26 334.46 299.90 (f) Depreciation and amortization expense 12 C 286.07 229.81 (g) Other expenses 27 1,183.57 872.95 Total expenses 4,021.76 3,617.06
5 Loss before tax (3 - 4) (727.50) (54.13)6 Tax expense:
(a) Current tax expense 2.28 1.95 (b) (Less): MAT credit (2.23) (0.99)(c) Deferred tax charge / (credit) (80.63) (40.50)
(80.58) (39.54)7 Loss after tax for the year but before
minority interest (5 - 6) (646.92) (14.59)
8 Share of minority interest 0.02 (0.60)9 Loss for the year after minority interest (7 - 8) (646.94) (13.99)10 Earnings per share (of Rs.10 each)
Basic and Diluted 29.7 (28.50) (0.64)See accompanying notes forming part of the consolidated financial statements
In terms of our report attachedFor DELOITTE HASKINS & SELLS For and On Behalf of the Board of DirectorsChartered Accountants
V. Srikumar Dr. Gautam Kumar Das Dr. Gopakumar G Nair Preetham HebbarPartner Joint Managing Director Director Company SecretaryMumbai, May 30, 2013
Consolidated Statement of Profit & loss for the year ended 31 March 2013
Financial Statements85
An
nu
al Rep
ort 2012-13
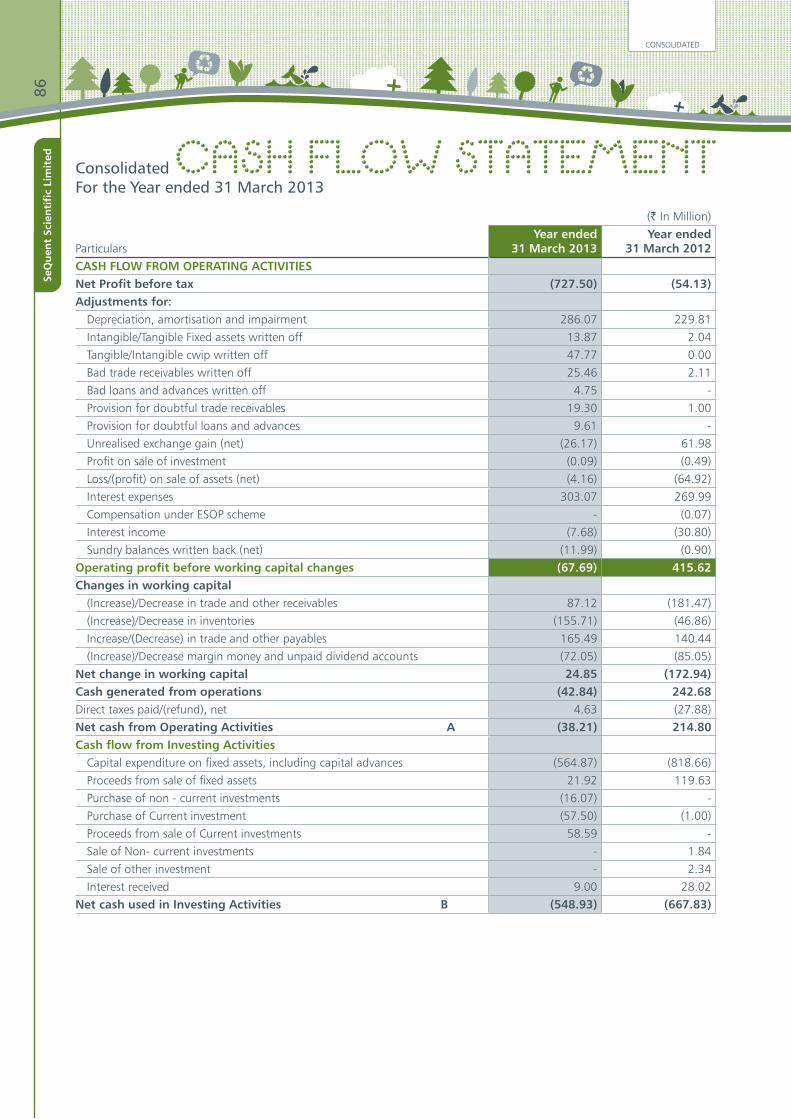
(` In Million)
ParticularsYear ended
31 March 2013 Year ended
31 March 2012 CASH FLOW FROM OPERATING ACTIVITIESNet Profit before tax (727.50) (54.13)Adjustments for:
Depreciation, amortisation and impairment 286.07 229.81 Intangible/Tangible Fixed assets written off 13.87 2.04 Tangible/Intangible cwip written off 47.77 0.00 Bad trade receivables written off 25.46 2.11 Bad loans and advances written off 4.75 - Provision for doubtful trade receivables 19.30 1.00 Provision for doubtful loans and advances 9.61 - Unrealised exchange gain (net) (26.17) 61.98 Profit on sale of investment (0.09) (0.49)Loss/(profit) on sale of assets (net) (4.16) (64.92)Interest expenses 303.07 269.99 Compensation under ESOP scheme - (0.07)Interest income (7.68) (30.80)Sundry balances written back (net) (11.99) (0.90)
Operating profit before working capital changes (67.69) 415.62 Changes in working capital
(Increase)/Decrease in trade and other receivables 87.12 (181.47)(Increase)/Decrease in inventories (155.71) (46.86)Increase/(Decrease) in trade and other payables 165.49 140.44 (Increase)/Decrease margin money and unpaid dividend accounts (72.05) (85.05)
Net change in working capital 24.85 (172.94)Cash generated from operations (42.84) 242.68 Direct taxes paid/(refund), net 4.63 (27.88)Net cash from Operating Activities A (38.21) 214.80 Cash flow from Investing Activities
Capital expenditure on fixed assets, including capital advances (564.87) (818.66)Proceeds from sale of fixed assets 21.92 119.63 Purchase of non - current investments (16.07) - Purchase of Current investment (57.50) (1.00)Proceeds from sale of Current investments 58.59 - Sale of Non- current investments - 1.84 Sale of other investment - 2.34 Interest received 9.00 28.02
Net cash used in Investing Activities B (548.93) (667.83)
Consolidated Cash Flow Statement For the Year ended 31 March 2013
CONSOLIDATED86
SeQ
uen
t Sc
ien
tifi
c Li
mit
ed

Consolidated Cash Flow Statement For the Year ended 31 March 2013 (Contd.)
(` In Million)
ParticularsYear ended
31 March 2013 Year ended
31 March 2012 Cash flow from Financing Activities
Proceeds from short term borrowings 258.47 262.21 Proceeds from / (repayment of ) of long term borrowings 18.03 630.69 Interest paid on borrowings (301.89) (281.69)Proceeds from issue of shares to minority shareholders - 45.45 Proceeds from issue of shares 253.58 1.05 Proceeds from issue of warrants 118.79 - Dividend paid - (32.90)Dividend distribution tax paid - (5.46)
Net cash generated from Financing Activities C 346.98 619.35 Net Increase/(Decrease) in cash and cash equivalents during the year A+B+C
(240.16) 166.32
Cash and cash equivalents as at 31.03.2012 273.74 91.71 Included on amalgamation - 6.39 Deleted on divestment (3.31) - Translation effect (2.88) 6.81 Remittance in Transit 7.12 2.51 Cash and cash equivalents as at 31.03.2013 34.51 273.74 Reconciliation of cash and cash equivalents with the Balance sheetReconciliation of cash and cash equivalents as per Balance Sheet (Refer Note 19)
329.91 358.79
Less: Balances not considered as cash and cash equivalents as defined in AS 3 "Cash Flow Statements"- Margin money against working capital facilities with banks 157.03 85.05 - Balance in Un-paid Dividend Accounts 0.07 - Balance held in Earmarked Accounts(Refer Note 19(i)) 138.30 Net Cash and cash equivalents at the end of the year 34.51 273.74 See accompanying notes forming part of the financial statements
In terms of our report attachedFor DELOITTE HASKINS & SELLS For and On Behalf of the Board of DirectorsChartered Accountants
V. Srikumar Dr. Gautam Kumar Das Dr. Gopakumar G Nair Preetham HebbarPartner Joint Managing Director Director Company SecretaryMumbai, May 30, 2013
Financial Statements87
An
nu
al Rep
ort 2012-13
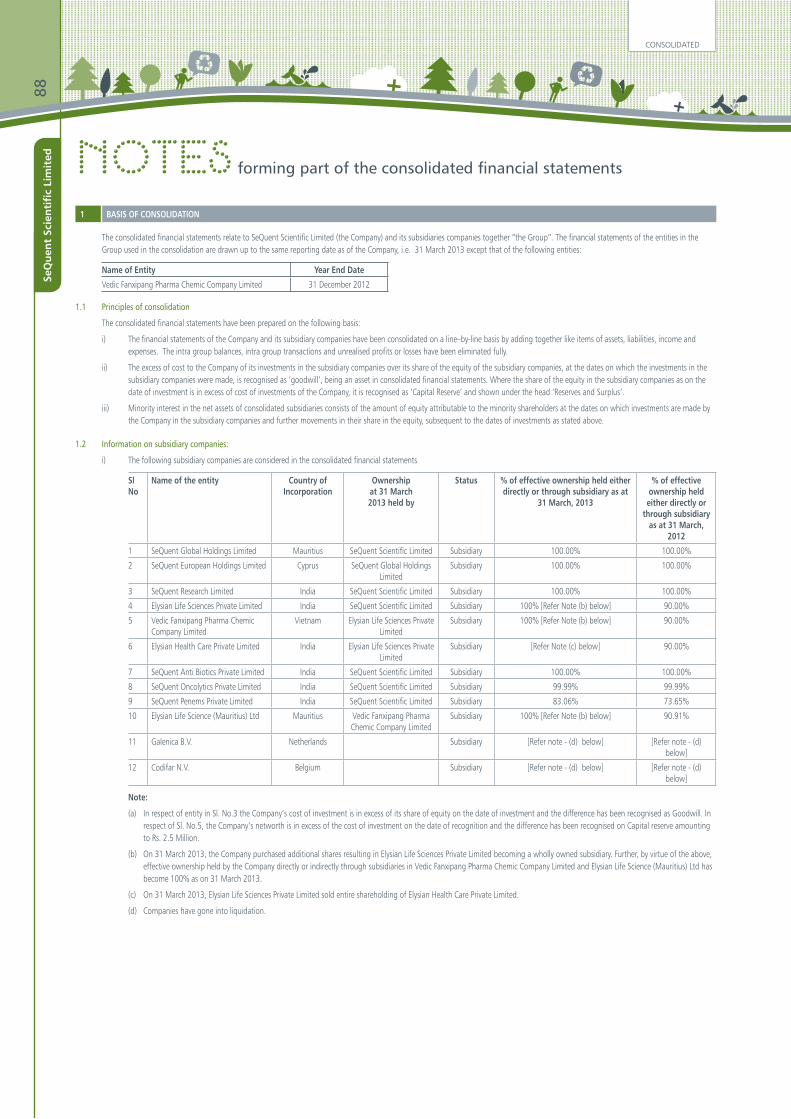
1 BASIS OF CONSOLIDATION
The consolidated financial statements relate to SeQuent Scientific Limited (the Company) and its subsidiaries companies together “the Group”. The financial statements of the entities in the Group used in the consolidation are drawn up to the same reporting date as of the Company, i.e. 31 March 2013 except that of the following entities:
Name of Entity Year End Date
Vedic Fanxipang Pharma Chemic Company Limited 31 December 2012
1.1 Principles of consolidation
The consolidated financial statements have been prepared on the following basis:
i) The financial statements of the Company and its subsidiary companies have been consolidated on a line–by-line basis by adding together like items of assets, liabilities, income and expenses. The intra group balances, intra group transactions and unrealised profits or losses have been eliminated fully.
ii) The excess of cost to the Company of its investments in the subsidiary companies over its share of the equity of the subsidiary companies, at the dates on which the investments in the subsidiary companies were made, is recognised as ‘goodwill’, being an asset in consolidated financial statements. Where the share of the equity in the subsidiary companies as on the date of investment is in excess of cost of investments of the Company, it is recognised as ‘Capital Reserve’ and shown under the head ‘Reserves and Surplus’.
iii) Minority interest in the net assets of consolidated subsidiaries consists of the amount of equity attributable to the minority shareholders at the dates on which investments are made by the Company in the subsidiary companies and further movements in their share in the equity, subsequent to the dates of investments as stated above.
1.2 Information on subsidiary companies:
i) The following subsidiary companies are considered in the consolidated financial statements
Sl No
Name of the entity Country of Incorporation
Ownership at 31 March 2013 held by
Status % of effective ownership held either directly or through subsidiary as at
31 March, 2013
% of effective ownership held either directly or
through subsidiary as at 31 March,
2012
1 SeQuent Global Holdings Limited Mauritius SeQuent Scientific Limited Subsidiary 100.00% 100.00%
2 SeQuent European Holdings Limited Cyprus SeQuent Global Holdings Limited
Subsidiary 100.00% 100.00%
3 SeQuent Research Limited India SeQuent Scientific Limited Subsidiary 100.00% 100.00%
4 Elysian Life Sciences Private Limited India SeQuent Scientific Limited Subsidiary 100% [Refer Note (b) below] 90.00%
5 Vedic Fanxipang Pharma Chemic Company Limited
Vietnam Elysian Life Sciences Private Limited
Subsidiary 100% [Refer Note (b) below] 90.00%
6 Elysian Health Care Private Limited India Elysian Life Sciences Private Limited
Subsidiary [Refer Note (c) below] 90.00%
7 SeQuent Anti Biotics Private Limited India SeQuent Scientific Limited Subsidiary 100.00% 100.00%
8 SeQuent Oncolytics Private Limited India SeQuent Scientific Limited Subsidiary 99.99% 99.99%
9 SeQuent Penems Private Limited India SeQuent Scientific Limited Subsidiary 83.06% 73.65%
10 Elysian Life Science (Mauritius) Ltd Mauritius Vedic Fanxipang Pharma Chemic Company Limited
Subsidiary 100% [Refer Note (b) below] 90.91%
11 Galenica B.V. Netherlands Subsidiary [Refer note - (d) below] [Refer note - (d) below]
12 Codifar N.V. Belgium Subsidiary [Refer note - (d) below] [Refer note - (d) below]
Note:
(a) In respect of entity in Sl. No.3 the Company’s cost of investment is in excess of its share of equity on the date of investment and the difference has been recognised as Goodwill. In respect of Sl. No.5, the Company’s networth is in excess of the cost of investment on the date of recognition and the difference has been recognised on Capital reserve amounting to Rs. 2.5 Million.
(b) On 31 March 2013, the Company purchased additional shares resulting in Elysian Life Sciences Private Limited becoming a wholly owned subsidiary. Further, by virtue of the above, effective ownership held by the Company directly or indirectly through subsidiaries in Vedic Fanxipang Pharma Chemic Company Limited and Elysian Life Science (Mauritius) Ltd has become 100% as on 31 March 2013.
(c) On 31 March 2013, Elysian Life Sciences Private Limited sold entire shareholding of Elysian Health Care Private Limited.
(d) Companies have gone into liquidation.
Notes forming part of the consolidated financial statements
CONSOLIDATED88
SeQ
uen
t Sc
ien
tifi
c Li
mit
ed

Notes forming part of the consolidated financial statements (Contd.)
1 BASIS OF CONSOLIDATION (Contd.)
ii) Disclosure on effect of disposal of subsidiaries:Elysian Health Care Private Limited
Particulars Rs. In millionDate 31 March 2013LiabilitiesTrade payables 3.17 Other current liabilities 2.87 Short-term provisions 0.04 AssetsLong-term loans and advances 0.01 Trade receivables 2.89 Cash and cash equivalents 3.31 Short-term loans and advances 0.36 Loss on disposal 0.49 Profit for the year 0.09
1.3 Figures pertaining to the subsidiary companies have been reclassified wherever necessary to bring them in line with the Company’s financial statements.
1.4 The consolidated financial statements include assets, liabilities, income and expenses aggregating to amounts indicated below which are included on the basis of unaudited financial statements in respect of the following subsidiaries:
i) Vedic Fanxipang Pharma Chemic Company Limited ii) Sequent European Holdings Limited
(` In Million)Particulars TotalNon current liabilities 21.22 Current liabilities 13.67 Non-current assets 42.00 Current assets 7.07 Revenue 0.06 Expenditure 119.39
1.5 Exchange adjustments On Consolidation
a. In case of non-integral operations, assets and liabilities are translated at the exchange rate prevailing on the balance sheet date. Revenue and expenses are translated at yearly average exchange rates prevailing during the year. Exchange differences arising out of these translations are included in ‘Translation Reserve’ under Reserves and Surplus.
b. In the case of integral operations, assets and liabilities (other than non-monetary items), are translated at the exchange rate prevailing on the balance sheet date. Non-Monetary items are carried at historical cost. Revenue and expenses are translated at yearly average exchange rates prevailing during the year. Exchange differences arising out of these translations are charged to the Statement of Profit and Loss.
2 SIGNIFICANT ACCOUNTING POLICIES
2.1 Basis of accounting and preparation of financial statements The consolidated financial statements of the Group have been prepared, in accordance
with Generally Accepted Accounting principles in India (Indian GAAP), to comply with the mandatory Accounting Standards prescribed by the Companies (Accounting Standards) Rules, 2006 except for certain assets and liabilities which are measured on fair value basis as permitted by the Scheme of Arrangement approved by the Honorable High Court of Karnataka and the relevant provisions of the Companies Act, 1956. The Financial Statements have been prepared on accrual basis under the historical cost convention except for certain categories of fixed assets that are carried at revalued amounts. The accounting policies adopted in the preparation of the financial statements are consistent with those followed in the previous year.
2.2 Tangible fixed assets Fixed assets are carried at cost less accumulated depreciation and impairment losses, if
any. The cost of fixed assets includes interest on borrowings attributable to acquisition of qualifying fixed assets up to the date the asset is ready for its intended use and other incidental expenses incurred up to that date. Exchange differences arising on restatement / settlement of long-term foreign currency borrowings relating to acquisition of depreciable fixed assets are adjusted to the cost of the respective assets and depreciated over the remaining useful life of such assets. Subsequent expenditure relating to fixed assets is capitalised only if such expenditure results in an increase in the future benefits from such asset beyond its previously assessed standard of performance.
Capital work-in-progress:Projects under which assets are not ready for their intended use and other capital work-in-progress are carried at cost, comprising direct cost, related incidental expenses and attributable interest.
2.3 Intangible assets Intangible assets are carried at cost less accumulated amortisation and impairment
losses, if any. The cost of an intangible assets comprises its purchase price, including any import duties and other taxes (other than those subsequently recoverable from the taxing authorities), and any directly attributable expenditure on making the asset ready for its intended use and net of any trade discounts and rebates. Subsequent expenditure on an intangible assets after its purchase / completion is recognised as an expense when incurred unless it is probable that such expenditure will enable the asset to generate future economic benefits in excess of its originally assessed standards of performance and such expenditure can be measured and attributed to the asset reliably, in which case such expenditure is added to the cost of the asset.
Refer Note 2.5 for accounting for research and development expenses.
2.4 Depreciation/amortisation Depreciation is provided under the straight-line method at the rates and in the manner
prescribed under Schedule XIV of the Companies Act, 1956, based on technical estimates that indicate the useful lives would be comparable with or higher than those arrived at using these rates.
With respect to assets carried at revalued amounts as permitted under the Scheme of amalgamation, depreciation is recorded under the straight line method over the balance remaining useful life of the assets which are given below:
Nature of the assets Remaining useful life in years
Buildings 10 - 28
Plant and Machinery 5 - 12
Office equipment 5 - 7
Computers 4
Furniture and fixtures 5 - 6
Motor vehicles 3 - 5
Leasehold land 85 - 96
Leasehold property development Over lease period
In the case of following intangible assets depreciation is provided/amortised under the straight line method over the useful life of assets as follows:
Product and process development 5 Years
Software licenses 3 Years
The estimated useful life of the intangible assets and its amortisation period are reviewed at the end of each financial year and the amortisation method is revised to reflect the changed pattern.
With respect to assets carried at revalued amounts as permitted under the Scheme of amalgamation, depreciation is recorded under the straight line method over the balance remaining useful life of the assets.
Individual assets costing less than Rs.5,000 are depreciated in full in the year of purchase.
2.5 Research and development costs Revenue expenditure pertaining to research is charged to the Statement of Profit and
Loss. Development costs of products are also charged to the Statement of Profit and Loss unless a product’s technological feasibility has been established, in which case such expenditure is capitalised. The amount capitalised comprises expenditure that can be directly attributed or allocated on a reasonable and consistent basis to creating, producing and making the asset ready for its intended use. Fixed assets utilised for research and development are capitalised and depreciated in accordance with the policies stated for tangible fixed assets and intangible assets.
2.6 Impairment of assets As at each Balance Sheet date, the carrying amount of fixed assets is tested for
impairment if impairment conditions exist. An impairment loss is recognized when the carrying amount of an asset exceeds its recoverable amount. Recoverable amount is determined:
(a) in the case of an individual asset, at the higher of the net selling price and value in use.
(b) in the case of cash generating units, at the higher of the unit’s net selling price and the value in use.
Value in use is determined as the present value of estimated future cash flows from the continuing use of an asset and from its disposal at the end of its useful life.
Financial Statements89
An
nu
al Rep
ort 2012-13
Notes forming part of the consolidated financial statements (Contd.)
2 SIGNIFICANT ACCOUNTING POLICIES (Contd.)
2.7 Investments Current investments are carried at lower of cost and fair market value. Provision is made
to recognize decline, if any, in the carrying value.
Long-term investments are carried individually at cost less provision for diminution, other than temporary in the value of the investment.
2.8 Inventory Inventories comprise raw materials, packing materials, consumables, work in process,
intermediates and finished goods. These are valued at the lower of cost and net realizable value. Cost is determined as follows:
(i) Raw materials, packing materials and consumables First in first out basis (ii) Work in process and Intermediates At material cost, conversion costs and appropriate share of production overheads (iii) Finished goods At material cost, conversion costs and an appropriate share of production
overheads and excise duty, wherever applicable.
2.9 Revenue recognition Revenue from export sales is recognized on the basis of the shipping bills for exports.
Revenue from domestic sales is recognized based on the passage of title to goods which generally coincides with dispatch. Sales include excise duty and are stated net of discounts, other taxes, and sales returns.
Income from sale of technical know-how is recognized, when the risk and right to use is transferred to the buyer as per terms of contract.
Dividend income is recognised when the right to receive the same is established.
Interest income is recognised on an accrual basis.
2.10 Employee benefits The Group’s contribution to provident fund is charged to revenue on accrual basis.
Leave balances standing to the credit of the employees that are expected to be availed in the short term are provided for on full cost basis. Liability for unavailed leave considered to be long term is carried based on an actuarial valuation.
Liability for gratuity is funded with LIC and SBI Life Insurance Group Limited. Gratuity expenses for the year are accounted based on actuarial valuation carried out using Projected Unit Credit Method as at the end of the fiscal year. The obligation recognised in the balance sheet represents the present value of the defined benefit obligation as adjusted for unrecognized past service cost, and as reduced by the fair value of scheme assets. Any asset resulting from this calculation is limited to past service cost, plus the present value of available refunds and reductions in future contributions to the scheme.
Short term employee benefits like medical, leave travel, etc are accrued based on the terms of employment on a time proportion basis.
2.11 Foreign currency transactions Initial recognition
Transactions in foreign currencies entered into by the Group and its integral foreign operations are accounted at the exchange rates prevailing on the date of the transaction or at rates that closely approximate the rate at the date of the transaction.
Measurement of foreign currency monetary items at the Balance Sheet date
Foreign currency monetary items of the Group and its net investment in non-integral foreign operations outstanding at the Balance Sheet date are restated at the year-end rates.
In the case of integral operations, assets and liabilities (other than non-monetary items), are translated at the exchange rate prevailing on the balance sheet date. Non-monetary items are carried at historical cost. Revenue and expenses are translated at the average exchange rates prevailing during the year. Exchange differences arising out of these translations are charged to the statement of profit and loss.
In case of non-integral operations, assets and liabilities are translated at the exchange rate prevailing on the balance sheet date. Revenue and expenses are translated at yearly average exchange rates prevailing during the year.
Treatment of exchange differences
Exchange differences arising on settlement / restatement of short-term foreign currency monetary assets and liabilities of the Group and its integral foreign operations are recognised as income or expense in the statement of profit and loss. The exchange differences on restatement / settlement of loans to non-integral foreign operations that are considered as net investment in such operations are accumulated in a ”Translation reserve” until disposal / recovery of the net investment.
The exchange differences arising on restatement / settlement of long-term foreign currency monetary items are capitalised as part of the depreciable fixed assets to which the monetary item relates and depreciated over the remaining useful life of such assets.
Accounting of forward contracts
Premium / discount on forward exchange contracts, which are not intended for trading or speculation purposes, are amortised over the period of the contracts if such contracts relate to monetary items as at the Balance Sheet date.
2.12 Taxes on income Income Tax comprises the current tax provision and the net change in the deferred tax
asset or liability during the year. Deferred tax assets and liabilities are recognized for the future tax consequences arising out of temporary differences between the carrying values of the assets and liabilities and their respective tax bases. Deferred tax assets and liabilities are measured using enacted tax rates applicable on the Balance Sheet date. Deferred tax assets are recognised for timing differences of items other than unabosrbed depreciation and carry forward losses only to the extent that reasonable certainty exists that sufficient future taxable income will be available against which these can be realised. However, if there are unabsorbed depreciation and carry forward of losses, deferred tax assets are recognised only if there is virtual certainty that there will be sufficient future taxable income available to realise the assets. Deferred tax assets and liabilities are offset if such items relate to taxes on income levied by the same governing tax laws and the Company has a legally enforceable right for such set off. Deferred tax assets are reviewed at each balance sheet date for their realisability.
Current tax is the amount of tax payable on the taxable income for the year as determined in accordance with the provisions of the Indian Income Tax Act, 1961.
Minimum alternative tax (‘MAT’) paid in accordance to the tax laws, which gives rise to future economic benefits in the form of adjustment of future tax liability, is considered as an asset if there is convincing evidence that the Company will pay normal income tax in future years. Accordingly, MAT is recognized as an assets in the balance sheet when it is probable that the future economic benefit associated with it will flow to the Company and asset can be measured reliably.
2.13 Leases Lease arrangements, where the risks and rewards incident to ownership of an asset
substantially vest with the lessor, are classified as operating leases and the lease rentals thereon are recognised in the statement of profit and loss on accrual basis.
2.14 Employee stock option scheme Employee stock options are accounted in accordance with the guidelines stipulated
by SEBI and Guidance Note on Accounting for Employee Share-based Payments. The difference between the market price of the shares underlying the options granted on the date of grant of option and the option price is expensed under employee benefit expenses over the vesting period.
2.15 Earnings per share (EPS) In determining the Earnings per share, the Group considers the net profit after tax. The
number of shares used in computing Basic Earnings per share is the weighted average number of equity shares outstanding during the year. The number of shares used in computing Diluted Earnings per share comprises the weighted average number of equity shares considered for deriving Basic earnings per share and also the weighted average number of equity shares that could have been issued on the conversion of all dilutive potential equity shares. Dilutive potential equity shares are deemed converted as of the beginning of the year unless issued at a later date.
2.16 Provisions and contingencies A provision is recognized when the Group has a present legal or constructive obligation
as a result of past event and it is probable that an outflow of resources will be required to settle the obligation, in respect of which reliable estimate can be made. Provisions (excluding retirement benefits) are not discounted to its present value and are determined based on best estimate required to settle the obligation. Contingent liabilities are not recognized but are disclosed in the notes to consolidated financial statements.
2.17 Use of estimates The preparation of the consolidated financial statements in conformity with the
Accounting Standards generally accepted in India requires that the management makes estimates and assumptions that affect the reported amounts of assets and liabilities, disclosure of contingent liabilities as at the date of the financial statements and the reported amounts of revenue and expenses during the reported period. Actual results could differ from those estimates.
2.18 Segment Segments have been identified taking into account the nature of services, the differing
risks and returns, the organizational structure and the internal reporting system.
CONSOLIDATED90
SeQ
uen
t Sc
ien
tifi
c Li
mit
ed
Notes forming part of the consolidated financial statements (Contd.)
2 SIGNIFICANT ACCOUNTING POLICIES (Contd.)
2.19 Insurance claims Insurance claims are accounted for on the basis of claims admitted / expected to be
admitted and to the extent that there is no uncertainty in receiving the claims.
2.20 Borrowing costs Borrowing costs include interest, amortisation of ancillary costs incurred and exchange
differences arising from foreign currency borrowings to the extent they are regarded as an adjustment to the interest cost. Costs in connection with the borrowing of funds to the extent not directly related to the acquisition of qualifying assets are charged to the Statement of Profit and Loss over the tenure of the loan. Borrowing costs, allocated to and utilised for qualifying assets, pertaining to the period from commencement of activities relating to construction / development of the qualifying asset upto the date of capitalisation of such asset is added to the cost of the assets. Capitalisation of borrowing costs is suspended and charged to the Statement of Profit and Loss during extended periods when active development activity on the qualifying assets is interrupted.
2.21 Cash flow statement Cash flows are reported using the indirect method, whereby profit / (loss) before
extraordinary items and tax is adjusted for the effects of transactions of non-cash nature and any deferrals or accruals of past or future cash receipts or payments. The cash flows from operating, investing and financing activities of the Group are segregated based on the available information.
2.22 Cash and cash equivalents (for purposes of cash flow statement) Cash comprises cash on hand and demand deposits with banks. Cash equivalents are
short-term balances (with an original maturity of three months or less from the date of acquisition), highly liquid investments that are readily convertible into known amounts of cash and which are subject to insignificant risk of changes in value.
2.23 Operating Cycle Based on the nature of products / activities of the Company and the normal time between
acquisition of assets and their realisation in cash or cash equivalents, the Company has determined its operating cycle as 12 months for the purpose of classification of its assets and liabilities as current and non-current.
As at 31 March 2013 As at 31 March 2012
No. of Shares
` in Million
No. of Shares
` in Million
3 SHARE CAPITAL
(a) Authorised32,000,000 equity shares of Rs.10 each
32,000,000 320.00 32,000,000 320.00
(b) Issued24,035,191 equity shares of Rs.10 each
24,035,191 240.35 21,935,191 219.35
(c) Subscribed and fully paid up24,035,191 equity shares of Rs.10 each
24,035,191 240.35 21,935,191 219.35
Less: Amount receivable from SeQuent Scientific Employee Stock Option Scheme Trust (Being Face Value of 700,000 Equity Shares of Rs. 10 each allotted to the trust)
5.95 5.95
Total 234.40 213.40
Notes:
(i) Reconciliation of the number of shares and amount outstanding at the beginning and at the end of the reporting year:
Equity SharesAs at 31 March 2013 As at 31 March 2012
No. of Shares
` in Million
No. of Shares
` in Million
Shares outstanding at the beginning of the year
21,935,191 219.35 21,935,191 219.35
Add: Shares issued during the year (Refer note (a) below)
2,100,000 21.00 14,865,000 -
Less: Shares cancelled during the year (Refer note (b) below)
- - (14,865,000) -
Shares outstanding at the end of the year
24,035,191 240.35 21,935,191 219.35
Notes:
(a) Conversion of 2,100,000 warrants issued during the year on preferential basis at a conversion price of Rs.120.75 per equity share of the company as approved in the Annual General Meeting dated 26 September 2012.
(b) During the previous year, in terms of the Scheme of Amalgamation of Fraxis Life Sciences Limited with the Company sanctioned by the High Court of Bombay on August 20, 2011, the Company allotted 14,865,000 fully paid up equity shares of the Company to the shareholders of Fraxis Life Sciences Limited and shares held by Fraxis Life Sciences Limited in the Company of 14,865,000 shares stands cancelled [Refer note 29.1].
(ii) Terms/rights attached to equity shares
The Company has only one class of equity shares having a par value of Rs.10 per share. Each holder of equity shares is entitled to one vote per share. Each equity shareholder is entitled to dividend in the Company. The dividend is proposed by the Board of Directors and is subject to the approval of the shareholders in the ensuing Annual General Meeting, except interim dividend.
In the event of liquidation of the Company, the holders of equity shares will be entitled to receive remaining assets of the company, after distribution of all preferential amounts, if any. The distribution will be in proportion to the number of equity shares held by the shareholders.
The amount of dividend per share recognized as distributions to equity shareholders is Nil (31 March 2012 : Rs.Nil)
(iii) Details of shares held by each shareholder holding more than 5% shares
As at 31 March 2013 As at 31 March 2012
Equity SharesNo. of
Shares held% of
holdingNo. of
Shares held% of
holdingName of the shareholderK R Ravishankar 5,579,986 23.22% 5,579,986 25.44%
Arun Kumar Pillai 5,579,993 23.22% 5,579,993 25.44%
Primera Partners Pte. Ltd 3,183,871 13.25% 3,183,871 14.51%
Satpal Khattar 1,699,018 7.07% 1,699,018 7.75%
(iv) 700,000 shares (As at 31 March, 2012 700,000 shares) of Rs.10 each are reserved towards outstanding employee stock options granted / available for grant. (Refer Note 31)
(v) As at 31 March 2013 2,750,000 warrants (March 2012-NIL) of Rs.10 each are outstanding to be converted into equivalent number of share. (Refer Note 28.1)
Financial Statements91
An
nu
al Rep
ort 2012-13
Notes forming part of the consolidated financial statements (Contd.)
(` In Million)
As at 31 March 2013
As at 31 March 2012
4 RESERVES AND SURPLUS
(a) Capital reserve
Opening balance 13.15 13.15
Add: Included on amalgamation - 6.48
Less: Utilised during the year (Refer note 29.1) - 6.48
Closing balance 13.15 13.15
(b) Securities premium account
Opening balance 513.40 513.40
Add: Premium on shares issued during the year 232.58 -
Closing balance 745.98 513.40
(c) Restructuring reserve
Opening balance - 4.06
Less: Utilisation during the year 4.06
Closing balance - -
(d) Share options outstanding account
Opening balance - 0.07
Add: Amounts recorded on grants during the year (0.07)
Closing balance - -
(e) General reserve 144.44 144.44
(f) Surplus/(Deficit) in statement of profit and loss
Opening balance 372.82 386.14
Add: Profit / (Loss) for the year (646.94) (13.99)
Closing balance (17.50) 0.67
Total (291.62) 372.82
(g) Translation reserve
Opening balance (31.94) (43.03)
Add / (Less): Translations during the year 16.83 11.09
Closing balance (15.11) (31.94)
Total 596.84 1,011.87
(` In Million)
As at 31 March 2013
As at 31 March 2012
5 LONG-TERM BORROWINGS
Term loans
From banks
Secured 415.31 188.00
415.31 188.00
From other parties
Secured 957.86 613.85
Unsecured 7.20 8.80
965.06 622.65
Total 1,380.37 810.65
CONSOLIDATED92
SeQ
uen
t Sc
ien
tifi
c Li
mit
ed

Notes forming part of the consolidated financial statements (Contd.)
5LO
NG-T
ERM
BOR
ROW
INGS
(Con
td.)
Part
icul
ars
(i)De
tails
of t
erm
s of r
epay
men
t for
the
long
-term
bor
row
ings
and
secu
rity
prov
ided
in re
spec
t of t
he se
cure
d lo
ng-te
rm b
orro
win
gs:
(` In
Milli
on)
Part
icul
ars
Secu
rity
Term
s of r
epay
men
tAs
at 3
1 M
arch
201
3As
at 3
1 M
arch
201
2Se
cure
dUn
secu
red
Secu
red
Unse
cure
dTe
rm lo
ans f
rom
ban
ks:
Indi
an O
verse
as B
ank
First
pari-
pass
u ch
arge
on
fixed
ass
ets o
f the
Com
pany
and
se
cond
par
i-pas
su ch
arge
on
curre
nt a
sset
s of t
he C
ompa
ny a
s a
colla
tera
l.
Repa
yabl
e in
22
quar
terly
Insta
llmen
ts, co
mm
encin
g fro
m
Dece
mbe
r 201
2. 2
27.2
8 -
- -
Cent
ral B
ank o
f Ind
iaVe
hicle
loan
is se
cure
d by
hyp
othe
catio
n of
ass
et a
cqui
red
ther
eund
er.Re
paya
ble
in 2
4 eq
uate
d m
onth
ly In
stallm
ents.
0.0
7 -
- -
Corp
orat
ion
Bank
First
pari-
pass
u ch
arge
on
fixed
ass
ets o
f one
of t
he S
ubsid
iaries
of
the
Com
pany
.Re
paya
ble
in 2
0 qu
arte
rly In
stallm
ents.
- 1
3.00
Stat
e Ba
nk o
f Hyd
erab
adFir
st pa
ri-pa
ssu
char
ge o
n fix
ed a
sset
s of o
ne o
f the
Sub
sidair
y of
the
Com
pany
and
seco
nd p
ari-p
assu
char
ge o
n cu
rrent
ass
ets o
f on
e of
the
Subs
idiar
y of t
he C
ompa
ny a
s a co
llate
ral.
Repa
yabl
e in
28
struc
ture
d qu
arte
rly In
stallm
ents,
co
mm
encin
g fro
m D
ecem
ber 2
013.
122
.97
149
.99
Stat
e Ba
nk o
f Tra
vanc
ore
First
pari-
pass
u ch
arge
on
fixed
ass
ets o
f one
of t
he S
ubsid
airy o
f th
e Co
mpa
ny a
nd se
cond
par
i-pas
su ch
arge
on
curre
nt a
sset
s of
one
of th
e Su
bsid
iary o
f the
Com
pany
as a
colla
tera
l.
Repa
yabl
e in
28
struc
ture
d qu
arte
rly In
stallm
ents,
co
mm
encin
g fro
m D
ecem
ber 2
013.
64.
99
25.
01
Tota
l - Te
rm lo
ans f
rom
ban
ks 4
15.3
1 -
188
.00
- Te
rm lo
ans f
rom
oth
er p
artie
s:Te
chno
logy
Dev
elopm
ent B
oard
First
pari-
pass
u ch
arge
on
fixed
ass
ets o
f the
Com
pany
.Re
paya
ble
in n
ine
half
year
ly In
stallm
ents
com
men
cing
from
1
April
200
9. -
- 5
.28
-
Hous
ing
Deve
lopm
ent F
inan
ce C
orpo
ratio
n Lim
ited
Mor
tgag
e of
land
alo
ng w
ith su
per s
truct
ure
of C
ompa
ny's
prop
ertie
s at A
mbe
rnat
h, M
ahad
, Man
galo
re, P
anol
i and
Tara
pur.
Repa
yabl
e in
28
quar
terly
Insta
llmen
ts, co
mm
encin
g fro
m
Mar
ch 2
012
785
.00
- 5
60.0
0 -
Hous
ing
Deve
lopm
ent F
inan
ce C
orpo
ratio
n Lim
ited
Mor
tgag
e of
Com
pany
's pr
oper
ty a
t Tha
ne (W
est),
Mum
bai.
Repa
yabl
e in
28
quar
terly
Insta
llmen
ts, co
mm
encin
g fro
m
July
2012
62.
86
- 4
8.57
-
Depa
rtmen
t of S
cient
ific a
nd In
dustr
ial R
esea
rch
Unse
cure
dRe
paya
ble
annu
ally o
ver a
per
iod
of fi
ve ye
ars f
rom
Mar
'12
& M
ar'13
- 7
.20
- 8
.80
Hous
ing
Deve
lopm
ent F
inan
ce C
orpo
ratio
n Lim
ited
Mor
tgag
e of
land
alo
ng w
ith su
per s
truct
ure
of p
rope
rty a
t M
anga
lore
of o
ne o
f the
Sub
sidiar
ies o
f the
Com
pany
.Re
paya
ble
in 3
4 qu
arte
rly In
stallm
ents,
co
mm
encin
g fro
m M
arch
201
3. 1
10.0
0 -
- -
Tota
l - Te
rm lo
ans f
rom
oth
er p
artie
s 9
57.8
6 7
.20
613
.85
8.8
0 Th
e in
tere
st on
abo
ve te
rm lo
ans f
rom
oth
er p
artie
s (ot
her t
han
loan
from
Tech
nolo
gy D
evelo
pmen
t Boa
rd a
nd D
epar
tmen
t of S
cient
ific a
nd In
dustr
ial R
esea
rch)
are
linke
d to
the
resp
ectiv
e len
der’s
bas
e ra
tes w
hich
are
floa
ting
in n
atur
e. A
s of 3
1 M
arch
201
3 th
e in
tere
st ra
tes r
ange
s fro
m 5
% to
13%
per
ann
um.
(ii)
Deta
ils o
f lon
g-te
rm b
orro
win
gs g
uara
ntee
d by
som
e of
the
dire
ctor
s or o
ther
s:
(` In
Milli
on)
Part
icul
ars
As a
t 31
Mar
ch 2
013
As a
t 31
Mar
ch 2
012
Term
loan
s fro
m b
anks
415
.31
188
.00
Term
loan
s fro
m o
ther
par
ties
957
.86
613
.85
(iii)
The
Com
pany
has
def
aulte
d in
repa
ymen
t of l
oans
and
inte
rest
in re
spec
t of t
he fo
llow
ing:
Part
icul
ars
As a
t 31
Mar
ch 2
013
As a
t 31
Mar
ch 2
012
Perio
d of
de
faul
t(`
In M
illio
n)Pe
riod
of
defa
ult
(` In
Milli
on)
Term
loan
s fro
m o
ther
par
ties
Prin
cipal
36
days
5
.28
180
day
s 5
.28
Inte
rest
36
days
0
.48
180
day
s 0
.67
(iv)
For
the
curr
ent m
atur
ities
of l
ong-
term
bor
row
ings
, ref
er 1
0(a)
in O
ther
cur
rent
liab
ilitie
s.
Financial Statements93
An
nu
al Rep
ort 2012-13
Notes forming part of the consolidated financial statements (Contd.)
(` In Million)
As at 31 March 2013
As at 31 March 2012
6 OTHER LONG-TERM LIABILITIES
Security deposits received 0.50 -
Total 0.50 -
(` In Million)
As at 31 March 2013
As at 31 March 2012
7 LONG TERM PROVISIONS
Provision for employee benefits(i) Provision for gratuity (net) 40.74 28.88
(ii) Provision for compensated absences 20.15 13.51
Total 60.89 42.39
(` In Million)
As at 31 March 2013
As at 31 March 2012
8 SHORT-TERM BORROWINGS
(a) Loans repayable on demandFrom banks
Secured (Refer note (i) and (ii) below) 1,044.84 980.87
(b) Loans from related parties (Refer Note 29.4)Unsecured 345.93 -
(c) Loans from other partiesSecured (Refer note (iii) below) 85.49 85.68
Unsecured 41.34 166.86
126.83 252.54 Total 1,517.60 1,233.41 (i) Working capital loan from banks are secured by a first pari-passu charge on current
assets of the Company and a second pari-passu charge on fixed assets of the Company as a collateral.
(ii) Short-term borrowings of Rs.1,044.84 million (31 March 2012 Rs.980.87 million) are guaranteed by some of the Directors of the Company in their personal capacities.
(iii) Short-term borrowings from other parties of Rs.85.49 Million (31 March 2012 Rs.85.68 million) are secured by trade receivables and inventories of two of the subsidiaries of the Company.
(` In Million)
As at 31 March 2013
As at 31 March 2012
9 TRADE PAYABLES
Trade Payables 1,507.69 1,239.44
Total 1,507.69 1,239.44
(` In Million)
As at 31 March 2013
As at 31 March 2012
10 OTHER CURRENT LIABILITIES
(a) Current maturities of long-term debt (Refer note (i) below) 214.74 643.59
(b) Interest accrued but not due on borrowings 4.26 0.81
(c) Interest accrued and due on borrowings 25.81 8.14
(d) Other payables
(i) Statutory remittances 51.34 16.41
(ii) Payables on purchase of fixed assets 33.50 15.83
(iii) Advances from customers 18.92 41.32
(iv) Unclaimed dividends 0.07 -
(v) Other current liabilities 8.98 27.70
Total 357.62 753.80 Note:(i) Current maturities of long-term debt (Refer Notes (i)
and (ii) in Note 5 - Long-term borrowings for details of security and guarantee):
ParticularsTerm loans
From banks
Secured 30.36 194.74
30.36 194.74 From other parties
Secured 181.98 161.98
Unsecured 2.40 286.87
184.38 448.85 Total 214.74 643.59
(` In Million)
As at 31 March 2013
As at 31 March 2012
11 SHORT-TERM PROVISIONS
(a) Provision for employee benefits(i) Provision for gratuity (net) 0.19 0.12
(ii) Provision for compensated absences 7.94 7.94
Total 8.13 8.06 (b) Others
Provision for tax (net of advance tax Rs. 30.99 MilllionAs at 31st March 2012 Rs. 37.63 Million)
32.04 23.21
32.04 23.21 Total 40.17 31.27
CONSOLIDATED94
SeQ
uen
t Sc
ien
tifi
c Li
mit
ed
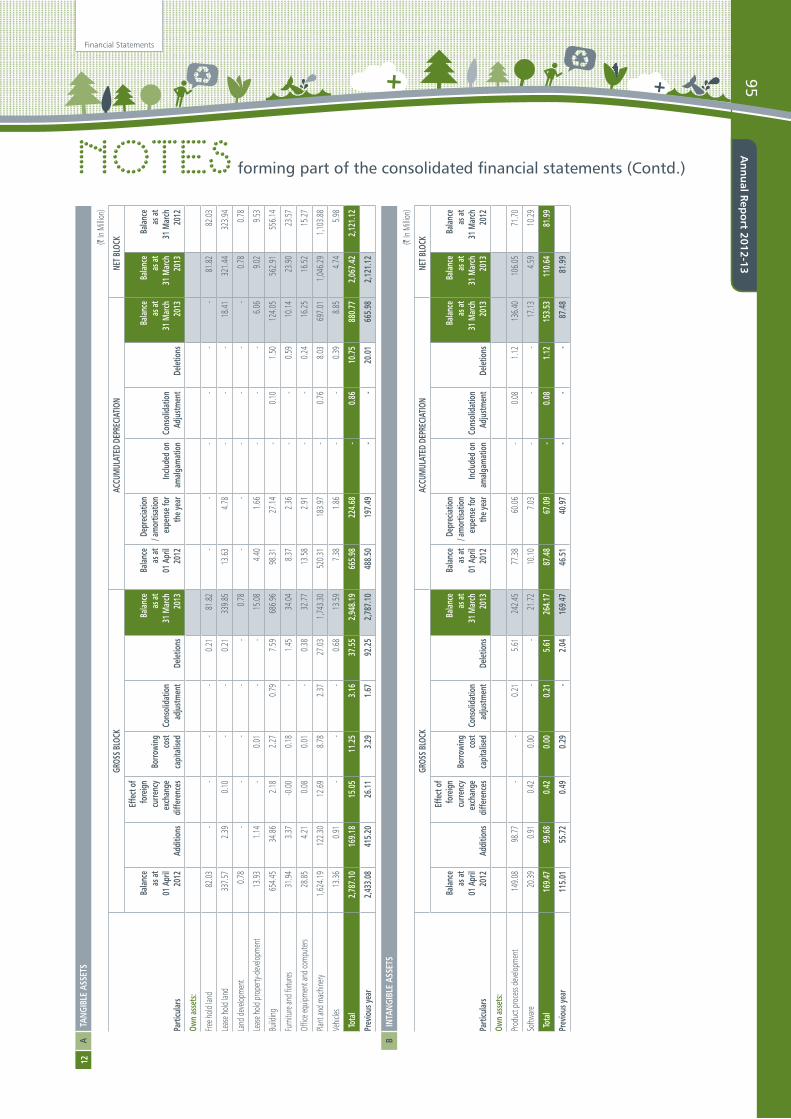
Notes forming part of the consolidated financial statements (Contd.)
12A
TANG
IBLE
ASS
ETS
(` In
Milli
on)
Parti
cular
s
GROS
S BLO
CKAC
CUM
ULAT
ED D
EPRE
CIAT
ION
NET B
LOCK
Bala
nce
as at
01
Apr
il 20
12
Add
ition
s
Effe
ct o
f fo
reig
n cu
rrenc
y ex
chan
ge
diffe
renc
es
Bor
rowi
ng
cost
capi
talis
ed
Co
nsol
idat
ion
adju
stmen
t D
eletio
ns
Bala
nce
as at
31
Mar
ch
2013
Bala
nce
as at
01
Apr
il 20
12
Dep
recia
tion
/ am
ortis
atio
n ex
pens
e for
th
e yea
r In
clude
d on
am
algam
atio
n
Co
nsol
idat
ion
Adju
stmen
t D
eletio
ns
Bala
nce
as at
31
Mar
ch
2013
Bala
nce
as at
31
Mar
ch
2013
Bala
nce
as at
31
Mar
ch
2012
Own
asse
ts:
Free h
old la
nd
82.03
-
- -
- 0.
21
81.82
-
- -
- -
- 81
.82
82.03
Leas
e hold
land
33
7.57
2.39
0.
10
- -
0.21
33
9.85
13.63
4.
78
- -
- 18
.41
321.4
4 32
3.94
Land
deve
lopme
nt
0.78
-
- -
- -
0.78
-
- -
- -
- 0.
78
0.78
Leas
e hold
prop
erty-d
evelo
pmen
t 13
.93
1.14
-
0.01
-
- 15
.08
4.40
1.
66
- -
- 6.
06
9.02
9.
53
Build
ing 65
4.45
34.86
2.
18
2.27
0.
79
7.59
68
6.96
98.31
27
.14
- 0.
10
1.50
12
4.05
562.9
1 55
6.14
Furn
iture
and f
ixtur
es 31
.94
3.37
-0
.00
0.18
-
1.45
34
.04
8.37
2.
36
- -
0.59
10
.14
23.90
23
.57
Offic
e equ
ipmen
t and
comp
uters
28.85
4.
21
0.08
0.
01
- 0.
38
32.77
13
.58
2.91
-
- 0.
24
16.25
16
.52
15.27
Plant
and m
achin
ery
1,62
4.19
122.3
0 12
.69
8.78
2.
37
27.03
1,
743.3
0 52
0.31
183.9
7 -
0.76
8.
03
697.0
1 1,
046.2
9 1,
103.8
8
Vehic
les
13.36
0.
91
- -
- 0.
68
13.59
7.
38
1.86
-
- 0.
39
8.85
4.
74
5.98
Tota
l 2
,787
.10
169
.18
15.
05
11.
25
3.1
6 3
7.55
2
,948
.19
665
.98
224
.68
- 0
.86
10.
75
880
.77
2,0
67.4
2 2
,121
.12
Prev
ious
year
2,4
33.0
8 4
15.2
0 2
6.11
3
.29
1.6
7 9
2.25
2
,787
.10
488
.50
197
.49
- -
20.
01
665
.98
2,1
21.1
2
BIN
TANG
IBLE
ASS
ETS
(` In
Milli
on)
Parti
cular
s
GROS
S BLO
CKAC
CUM
ULAT
ED D
EPRE
CIAT
ION
NET B
LOCK
Bala
nce
as at
01
Apr
il 20
12
Add
ition
s
Effe
ct o
f fo
reig
n cu
rrenc
y ex
chan
ge
diffe
renc
es
Bor
rowi
ng
cost
capi
talis
ed
Co
nsol
idat
ion
adju
stmen
t D
eletio
ns
Bala
nce
as at
31
Mar
ch
2013
Bala
nce
as at
01
Apr
il 20
12
Dep
recia
tion
/ am
ortis
atio
n ex
pens
e for
th
e yea
r In
clude
d on
am
algam
atio
n
Co
nsol
idat
ion
Adju
stmen
t D
eletio
ns
Bala
nce
as at
31
Mar
ch
2013
Bala
nce
as at
31
Mar
ch
2013
Bala
nce
as at
31
Mar
ch
2012
Own
asse
ts:
Produ
ct pr
oces
s dev
elopm
ent
149.0
8 98
.77
- -
0.21
5.
61
242.4
5 77
.38
60.06
-
0.08
1.
12
136.4
0 10
6.05
71.70
Softw
are
20.39
0.
91
0.42
0.
00
- -
21.72
10
.10
7.03
-
- -
17.13
4.
59
10.29
Tota
l 1
69.4
7 9
9.68
0
.42
0.0
0 0
.21
5.6
1 2
64.1
7 8
7.48
6
7.09
-
0.0
8 1
.12
153
.53
110
.64
81.
99
Prev
ious
year
115
.01
55.
72
0.4
9 0
.29
- 2
.04
169
.47
46.
51
40.
97
- -
- 8
7.48
8
1.99
Financial Statements95
An
nu
al Rep
ort 2012-13
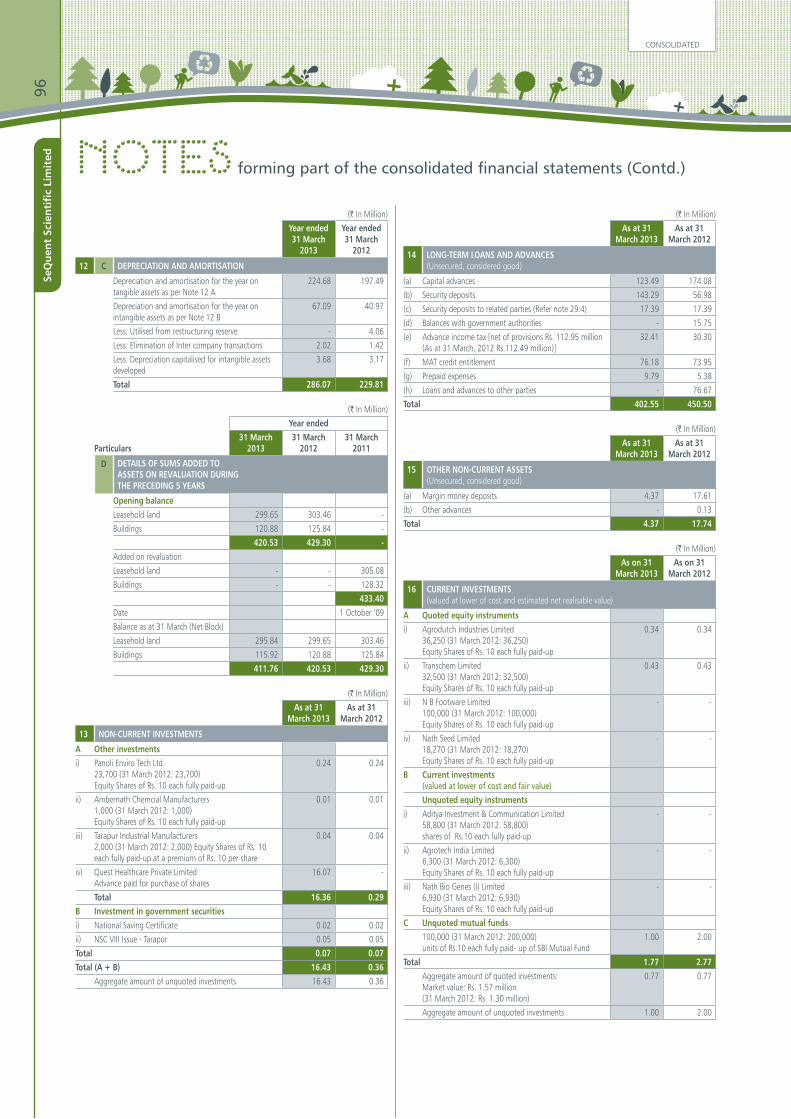
Notes forming part of the consolidated financial statements (Contd.)
(` In Million)
Year ended 31 March
2013
Year ended 31 March
2012
12 C DEPRECIATION AND AMORTISATION
Depreciation and amortisation for the year on tangible assets as per Note 12 A
224.68 197.49
Depreciation and amortisation for the year on intangible assets as per Note 12 B
67.09 40.97
Less: Utilised from restructuring reserve - 4.06
Less: Elimination of Inter company transactions 2.02 1.42
Less: Depreciation capitalised for intangible assets developed
3.68 3.17
Total 286.07 229.81
(` In Million)
Year ended
Particulars31 March
201331 March
201231 March
2011
D DETAILS OF SUMS ADDED TO ASSETS ON REVALUATION DURINGTHE PRECEDING 5 YEARS
Opening balanceLeasehold land 299.65 303.46 -
Buildings 120.88 125.84 -
420.53 429.30 - Added on revaluation
Leasehold land - - 305.08
Buildings - - 128.32
433.40 Date 1 October ‘09
Balance as at 31 March (Net Block)
Leasehold land 295.84 299.65 303.46
Buildings 115.92 120.88 125.84
411.76 420.53 429.30
(` In Million)
As at 31 March 2013
As at 31 March 2012
13 NON-CURRENT INVESTMENTS
A Other investmentsi) Panoli Enviro Tech Ltd.
23,700 (31 March 2012: 23,700) Equity Shares of Rs. 10 each fully paid-up
0.24 0.24
ii) Ambernath Chemcial Manufacturers1,000 (31 March 2012: 1,000) Equity Shares of Rs. 10 each fully paid-up
0.01 0.01
iii) Tarapur Industrial Manufacturers2,000 (31 March 2012: 2,000) Equity Shares of Rs. 10 each fully paid-up at a premium of Rs. 10 per share
0.04 0.04
iv) Quest Healthcare Private Limited Advance paid for purchase of shares
16.07 -
Total 16.36 0.29 B Investment in government securities i) National Saving Certificate 0.02 0.02
ii) NSC VIII Issue - Tarapur 0.05 0.05
Total 0.07 0.07 Total (A + B) 16.43 0.36
Aggregate amount of unquoted investments 16.43 0.36
(` In Million)
As at 31 March 2013
As at 31 March 2012
14 LONG-TERM LOANS AND ADVANCES(Unsecured, considered good)
(a) Capital advances 123.49 174.08
(b) Security deposits 143.29 56.98
(c) Security deposits to related parties (Refer note 29.4) 17.39 17.39
(d) Balances with government authorities - 15.75
(e) Advance income tax [net of provisions Rs. 112.95 million(As at 31 March, 2012 Rs.112.49 million)]
32.41 30.30
(f) MAT credit entitlement 76.18 73.95
(g) Prepaid expenses 9.79 5.38
(h) Loans and advances to other parties - 76.67
Total 402.55 450.50
(` In Million)
As at 31 March 2013
As at 31 March 2012
15 OTHER NON-CURRENT ASSETS(Unsecured, considered good)
(a) Margin money deposits 4.37 17.61
(b) Other advances - 0.13
Total 4.37 17.74
(` In Million)
As on 31 March 2013
As on 31 March 2012
16 CURRENT INVESTMENTS(valued at lower of cost and estimated net realisable value)
A Quoted equity instrumentsi) Agrodutch Industries Limited
36,250 (31 March 2012: 36,250) Equity Shares of Rs. 10 each fully paid-up
0.34 0.34
ii) Transchem Limited32,500 (31 March 2012: 32,500) Equity Shares of Rs. 10 each fully paid-up
0.43 0.43
iii) N B Footware Limited100,000 (31 March 2012: 100,000) Equity Shares of Rs. 10 each fully paid-up
- -
iv) Nath Seed Limited18,270 (31 March 2012: 18,270) Equity Shares of Rs. 10 each fully paid-up
- -
B Current investments (valued at lower of cost and fair value)Unquoted equity instruments
i) Aditya Investment & Communication Limited58,800 (31 March 2012: 58,800) shares of Rs.10 each fully paid-up
- -
ii) Agrotech India Limited6,300 (31 March 2012: 6,300) Equity Shares of Rs. 10 each fully paid-up
- -
iii) Nath Bio Genes (I) Limited6,930 (31 March 2012: 6,930)Equity Shares of Rs. 10 each fully paid-up
- -
C Unquoted mutual funds100,000 (31 March 2012: 200,000) units of Rs.10 each fully paid- up of SBI Mutual Fund
1.00 2.00
Total 1.77 2.77Aggregate amount of quoted investments: Market value: Rs. 1.57 million(31 March 2012: Rs. 1.30 million)
0.77 0.77
Aggregate amount of unquoted investments 1.00 2.00
CONSOLIDATED96
SeQ
uen
t Sc
ien
tifi
c Li
mit
ed
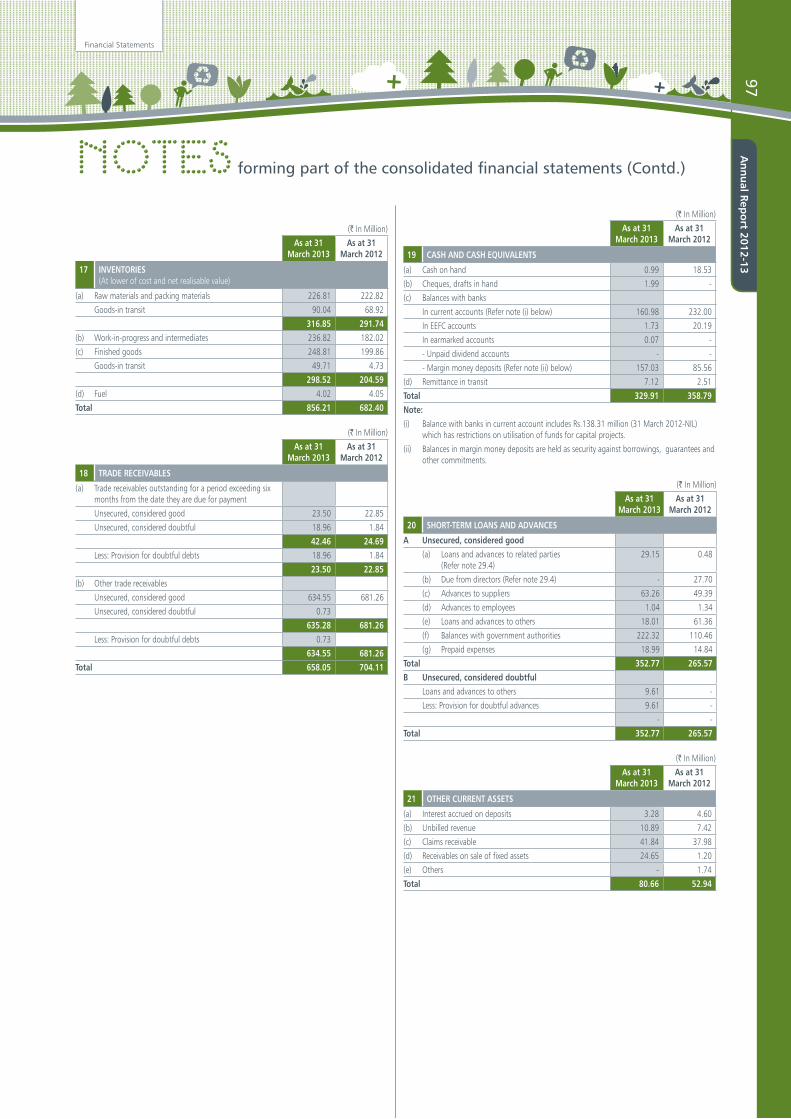
(` In Million)
As at 31 March 2013
As at 31 March 2012
17 INVENTORIES(At lower of cost and net realisable value)
(a) Raw materials and packing materials 226.81 222.82
Goods-in transit 90.04 68.92
316.85 291.74 (b) Work-in-progress and intermediates 236.82 182.02
(c) Finished goods 248.81 199.86
Goods-in transit 49.71 4.73
298.52 204.59 (d) Fuel 4.02 4.05
Total 856.21 682.40
(` In Million)
As at 31 March 2013
As at 31 March 2012
18 TRADE RECEIVABLES
(a) Trade receivables outstanding for a period exceeding six months from the date they are due for payment
Unsecured, considered good 23.50 22.85
Unsecured, considered doubtful 18.96 1.84
42.46 24.69 Less: Provision for doubtful debts 18.96 1.84
23.50 22.85 (b) Other trade receivables
Unsecured, considered good 634.55 681.26
Unsecured, considered doubtful 0.73
635.28 681.26 Less: Provision for doubtful debts 0.73
634.55 681.26 Total 658.05 704.11
(` In Million)
As at 31 March 2013
As at 31 March 2012
19 CASH AND CASH EQUIVALENTS
(a) Cash on hand 0.99 18.53
(b) Cheques, drafts in hand 1.99 -
(c) Balances with banks
In current accounts (Refer note (i) below) 160.98 232.00
In EEFC accounts 1.73 20.19
In earmarked accounts 0.07 -
- Unpaid dividend accounts - -
- Margin money deposits (Refer note (ii) below) 157.03 85.56
(d) Remittance in transit 7.12 2.51
Total 329.91 358.79 Note: (i) Balance with banks in current account includes Rs.138.31 million (31 March 2012-NIL)
which has restrictions on utilisation of funds for capital projects.
(ii) Balances in margin money deposits are held as security against borrowings, guarantees and other commitments.
(` In Million)
As at 31 March 2013
As at 31 March 2012
20 SHORT-TERM LOANS AND ADVANCES
A Unsecured, considered good(a) Loans and advances to related parties
(Refer note 29.4) 29.15 0.48
(b) Due from directors (Refer note 29.4) - 27.70
(c) Advances to suppliers 63.26 49.39
(d) Advances to employees 1.04 1.34
(e) Loans and advances to others 18.01 61.36
(f) Balances with government authorities 222.32 110.46
(g) Prepaid expenses 18.99 14.84
Total 352.77 265.57 B Unsecured, considered doubtful
Loans and advances to others 9.61 -
Less: Provision for doubtful advances 9.61 -
- -
Total 352.77 265.57
(` In Million)
As at 31 March 2013
As at 31 March 2012
21 OTHER CURRENT ASSETS
(a) Interest accrued on deposits 3.28 4.60
(b) Unbilled revenue 10.89 7.42
(c) Claims receivable 41.84 37.98
(d) Receivables on sale of fixed assets 24.65 1.20
(e) Others - 1.74
Total 80.66 52.94
Notes forming part of the consolidated financial statements (Contd.)
Financial Statements97
An
nu
al Rep
ort 2012-13
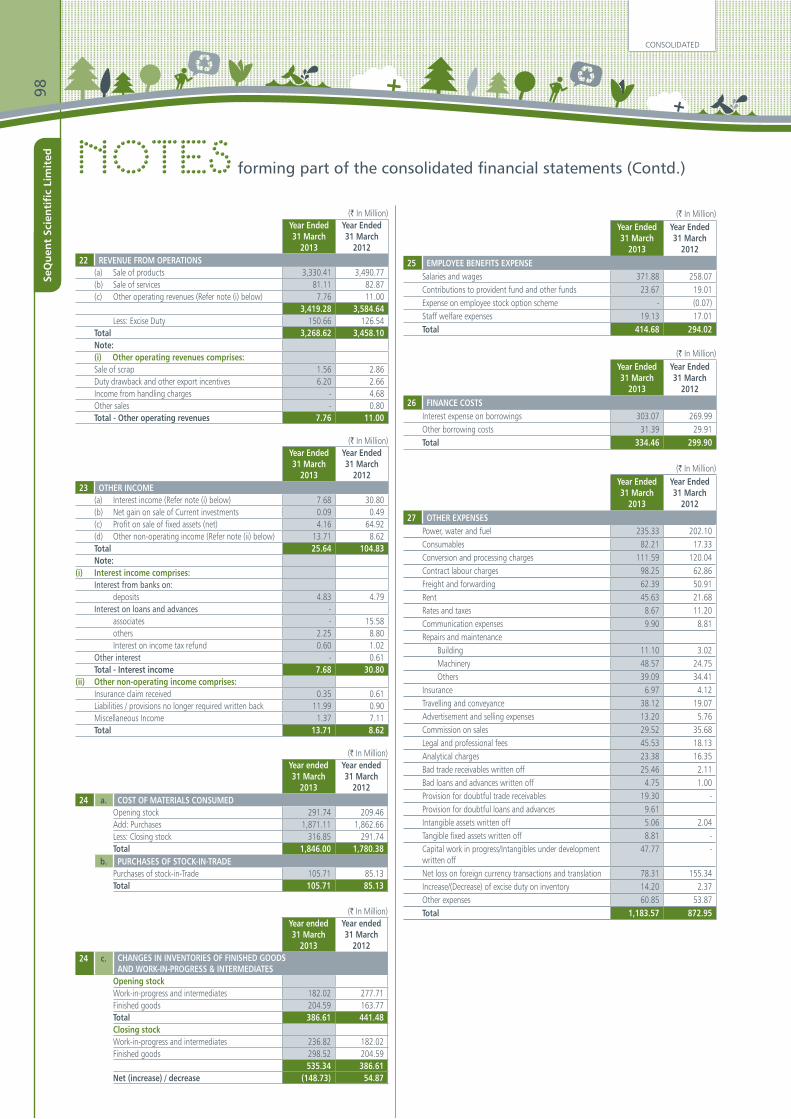
Notes forming part of the consolidated financial statements (Contd.)
(` In Million)Year Ended31 March
2013
Year Ended31 March
201222 REVENUE FROM OPERATIONS
(a) Sale of products 3,330.41 3,490.77 (b) Sale of services 81.11 82.87 (c) Other operating revenues (Refer note (i) below) 7.76 11.00
3,419.28 3,584.64 Less: Excise Duty 150.66 126.54
Total 3,268.62 3,458.10 Note:(i) Other operating revenues comprises:Sale of scrap 1.56 2.86 Duty drawback and other export incentives 6.20 2.66 Income from handling charges - 4.68 Other sales - 0.80 Total - Other operating revenues 7.76 11.00
(` In Million)Year Ended31 March
2013
Year Ended31 March
201223 OTHER INCOME
(a) Interest income (Refer note (i) below) 7.68 30.80 (b) Net gain on sale of Current investments 0.09 0.49 (c) Profit on sale of fixed assets (net) 4.16 64.92 (d) Other non-operating income (Refer note (ii) below) 13.71 8.62 Total 25.64 104.83 Note:
(i) Interest income comprises:Interest from banks on:
deposits 4.83 4.79 Interest on loans and advances -
associates - 15.58 others 2.25 8.80 Interest on income tax refund 0.60 1.02
Other interest - 0.61 Total - Interest income 7.68 30.80
(ii) Other non-operating income comprises:Insurance claim received 0.35 0.61 Liabilities / provisions no longer required written back 11.99 0.90 Miscellaneous Income 1.37 7.11 Total 13.71 8.62
(` In Million)Year ended 31 March
2013
Year ended 31 March
201224 a. COST OF MATERIALS CONSUMED
Opening stock 291.74 209.46 Add: Purchases 1,871.11 1,862.66 Less: Closing stock 316.85 291.74 Total 1,846.00 1,780.38
b. PURCHASES OF STOCK-IN-TRADEPurchases of stock-in-Trade 105.71 85.13 Total 105.71 85.13
(` In Million)Year ended 31 March
2013
Year ended 31 March
201224 c. CHANGES IN INVENTORIES OF FINISHED GOODS
AND WORK-IN-PROGRESS & INTERMEDIATESOpening stockWork-in-progress and intermediates 182.02 277.71 Finished goods 204.59 163.77 Total 386.61 441.48 Closing stockWork-in-progress and intermediates 236.82 182.02 Finished goods 298.52 204.59
535.34 386.61 Net (increase) / decrease (148.73) 54.87
(` In Million)Year Ended31 March
2013
Year Ended31 March
201225 EMPLOYEE BENEFITS EXPENSE
Salaries and wages 371.88 258.07 Contributions to provident fund and other funds 23.67 19.01 Expense on employee stock option scheme - (0.07)Staff welfare expenses 19.13 17.01 Total 414.68 294.02
(` In Million)Year Ended31 March
2013
Year Ended31 March
201226 FINANCE COSTS
Interest expense on borrowings 303.07 269.99 Other borrowing costs 31.39 29.91 Total 334.46 299.90
(` In Million)Year Ended31 March
2013
Year Ended31 March
201227 OTHER EXPENSES
Power, water and fuel 235.33 202.10 Consumables 82.21 17.33 Conversion and processing charges 111.59 120.04 Contract labour charges 98.25 62.86 Freight and forwarding 62.39 50.91 Rent 45.63 21.68 Rates and taxes 8.67 11.20 Communication expenses 9.90 8.81 Repairs and maintenance
Building 11.10 3.02 Machinery 48.57 24.75 Others 39.09 34.41
Insurance 6.97 4.12 Travelling and conveyance 38.12 19.07 Advertisement and selling expenses 13.20 5.76 Commission on sales 29.52 35.68 Legal and professional fees 45.53 18.13 Analytical charges 23.38 16.35 Bad trade receivables written off 25.46 2.11 Bad loans and advances written off 4.75 1.00 Provision for doubtful trade receivables 19.30 - Provision for doubtful loans and advances 9.61 Intangible assets written off 5.06 2.04 Tangible fixed assets written off 8.81 - Capital work in progress/Intangibles under development written off
47.77 -
Net loss on foreign currency transactions and translation 78.31 155.34 Increase/(Decrease) of excise duty on inventory 14.20 2.37 Other expenses 60.85 53.87 Total 1,183.57 872.95
CONSOLIDATED98
SeQ
uen
t Sc
ien
tifi
c Li
mit
ed
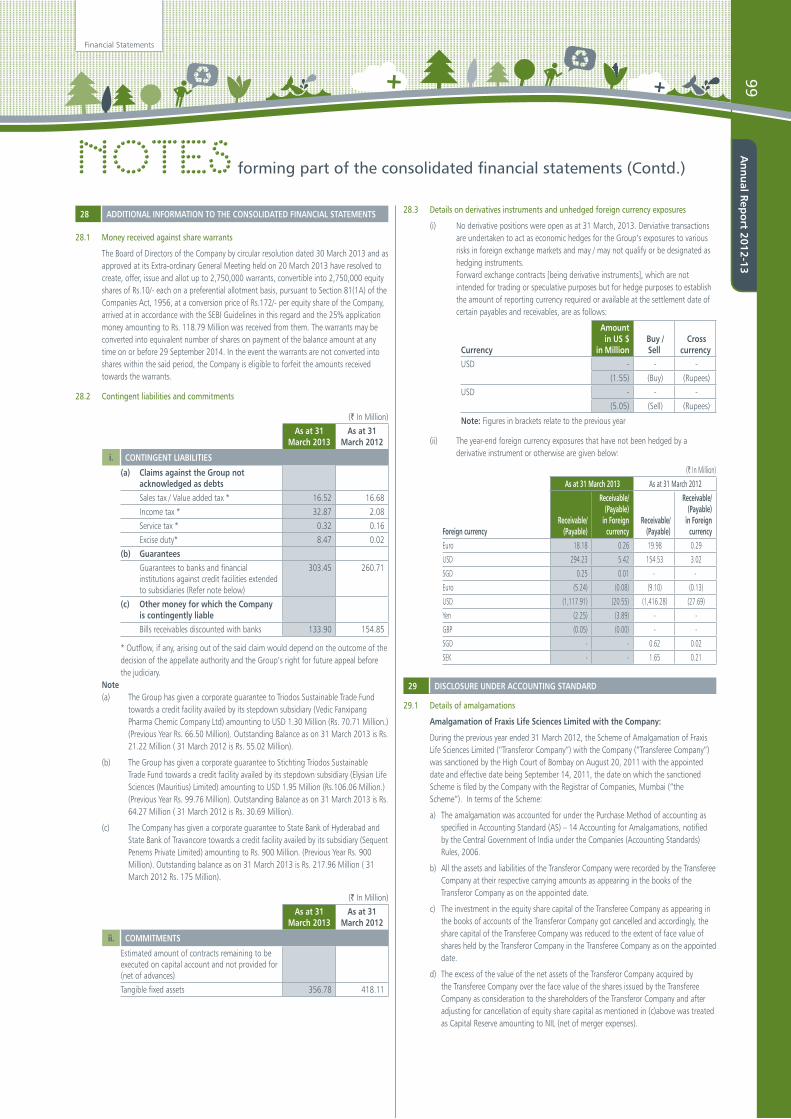
28 ADDITIONAL INFORMATION TO THE CONSOLIDATED FINANCIAL STATEMENTS
28.1 Money received against share warrants
The Board of Directors of the Company by circular resolution dated 30 March 2013 and as approved at its Extra-ordinary General Meeting held on 20 March 2013 have resolved to create, offer, issue and allot up to 2,750,000 warrants, convertible into 2,750,000 equity shares of Rs.10/- each on a preferential allotment basis, pursuant to Section 81(1A) of the Companies Act, 1956, at a conversion price of Rs.172/- per equity share of the Company, arrived at in accordance with the SEBI Guidelines in this regard and the 25% application money amounting to Rs. 118.79 Million was received from them. The warrants may be converted into equivalent number of shares on payment of the balance amount at any time on or before 29 September 2014. In the event the warrants are not converted into shares within the said period, the Company is eligible to forfeit the amounts received towards the warrants.
28.2 Contingent liabilities and commitments
(` In Million)
As at 31March 2013
As at 31 March 2012
i. CONTINGENT LIABILITIES
(a) Claims against the Group not acknowledged as debtsSales tax / Value added tax * 16.52 16.68
Income tax * 32.87 2.08
Service tax * 0.32 0.16
Excise duty* 8.47 0.02
(b) GuaranteesGuarantees to banks and financial institutions against credit facilities extended to subsidiaries (Refer note below)
303.45 260.71
(c) Other money for which the Company is contingently liableBills receivables discounted with banks 133.90 154.85
* Outflow, if any, arising out of the said claim would depend on the outcome of the decision of the appellate authority and the Group’s right for future appeal before the judiciary.
Note (a) The Group has given a corporate guarantee to Triodos Sustainable Trade Fund
towards a credit facility availed by its stepdown subsidiary (Vedic Fanxipang Pharma Chemic Company Ltd) amounting to USD 1.30 Million (Rs. 70.71 Million.) (Previous Year Rs. 66.50 Million). Outstanding Balance as on 31 March 2013 is Rs. 21.22 Million ( 31 March 2012 is Rs. 55.02 Million).
(b) The Group has given a corporate guarantee to Stichting Triodos Sustainable Trade Fund towards a credit facility availed by its stepdown subsidiary (Elysian Life Sciences (Mauritius) Limited) amounting to USD 1.95 Million (Rs.106.06 Million.) (Previous Year Rs. 99.76 Million). Outstanding Balance as on 31 March 2013 is Rs. 64.27 Million ( 31 March 2012 is Rs. 30.69 Million).
(c) The Company has given a corporate guarantee to State Bank of Hyderabad and State Bank of Travancore towards a credit facility availed by its subsidiary (Sequent Penems Private Limited) amounting to Rs. 900 Million. (Previous Year Rs. 900 Million). Outstanding balance as on 31 March 2013 is Rs. 217.96 Million ( 31 March 2012 Rs. 175 Million).
(` In Million)
As at 31March 2013
As at 31 March 2012
ii. COMMITMENTS
Estimated amount of contracts remaining to be executed on capital account and not provided for (net of advances)
Tangible fixed assets 356.78 418.11
28.3 Details on derivatives instruments and unhedged foreign currency exposures
(i) No derivative positions were open as at 31 March, 2013. Derviative transactions are undertaken to act as economic hedges for the Group’s exposures to various risks in foreign exchange markets and may / may not qualify or be designated as hedging instruments.
Forward exchange contracts [being derivative instruments], which are not intended for trading or speculative purposes but for hedge purposes to establish the amount of reporting currency required or available at the settlement date of certain payables and receivables, are as follows:
Currency
Amountin US $
in Million Buy / Sell
Cross currency
USD - - -
(1.55) (Buy) (Rupees)
USD - - -
(5.05) (Sell) (Rupees)
Note: Figures in brackets relate to the previous year
(ii) The year-end foreign currency exposures that have not been hedged by a derivative instrument or otherwise are given below:
(` In Million)
As at 31 March 2013 As at 31 March 2012
Foreign currencyReceivable/
(Payable)
Receivable/ (Payable)
in Foreign currency
Receivable/(Payable)
Receivable/ (Payable)
in Foreign currency
Euro 18.18 0.26 19.98 0.29
USD 294.23 5.42 154.53 3.02
SGD 0.25 0.01 - -
Euro (5.24) (0.08) (9.10) (0.13)
USD (1,117.91) (20.55) (1,416.28) (27.69)
Yen (2.25) (3.89) - -
GBP (0.05) (0.00) - -
SGD - - 0.62 0.02
SEK - - 1.65 0.21
29 DISCLOSURE UNDER ACCOUNTING STANDARD
29.1 Details of amalgamations
Amalgamation of Fraxis Life Sciences Limited with the Company:
During the previous year ended 31 March 2012, the Scheme of Amalgamation of Fraxis Life Sciences Limited (“Transferor Company”) with the Company (“Transferee Company”) was sanctioned by the High Court of Bombay on August 20, 2011 with the appointed date and effective date being September 14, 2011, the date on which the sanctioned Scheme is filed by the Company with the Registrar of Companies, Mumbai (“the Scheme”). In terms of the Scheme:
a) The amalgamation was accounted for under the Purchase Method of accounting as specified in Accounting Standard (AS) – 14 Accounting for Amalgamations, notified by the Central Government of India under the Companies (Accounting Standards) Rules, 2006.
b) All the assets and liabilities of the Transferor Company were recorded by the Transferee Company at their respective carrying amounts as appearing in the books of the Transferor Company as on the appointed date.
c) The investment in the equity share capital of the Transferee Company as appearing in the books of accounts of the Transferor Company got cancelled and accordingly, the share capital of the Transferee Company was reduced to the extent of face value of shares held by the Transferor Company in the Transferee Company as on the appointed date.
d) The excess of the value of the net assets of the Transferor Company acquired by the Transferee Company over the face value of the shares issued by the Transferee Company as consideration to the shareholders of the Transferor Company and after adjusting for cancellation of equity share capital as mentioned in (c)above was treated as Capital Reserve amounting to NIL (net of merger expenses).
Notes forming part of the consolidated financial statements (Contd.)
Financial Statements99
An
nu
al Rep
ort 2012-13
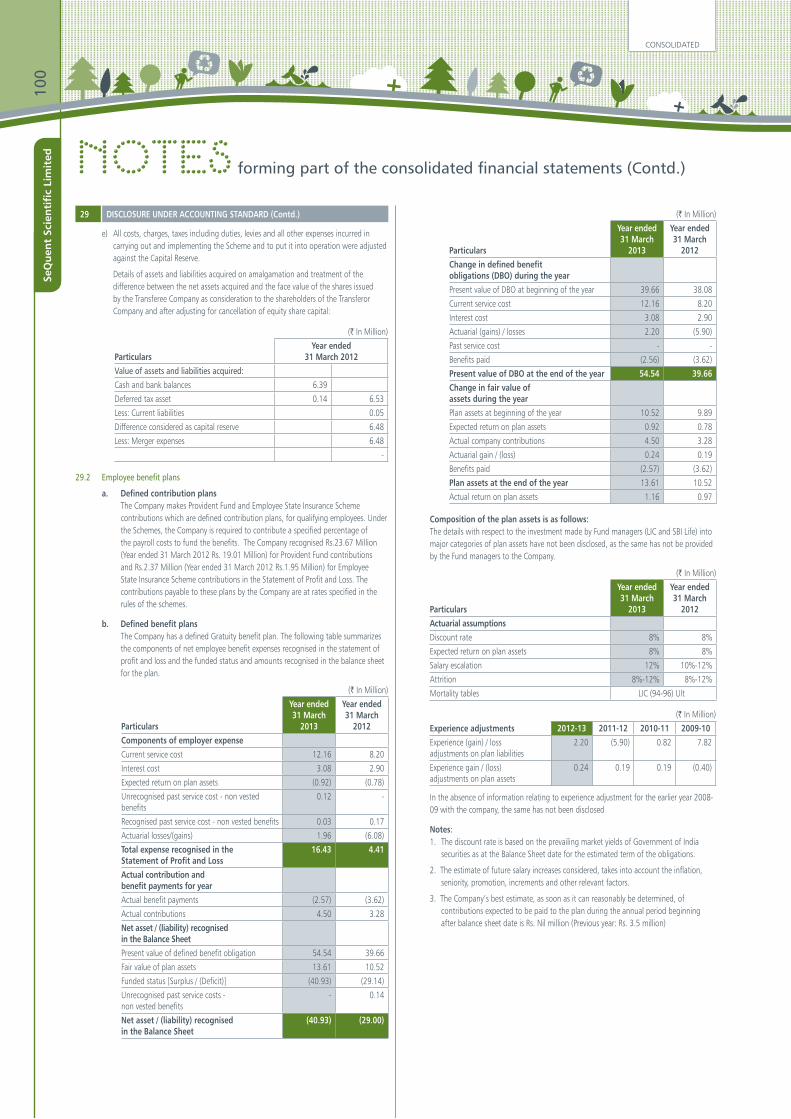
e) All costs, charges, taxes including duties, levies and all other expenses incurred in carrying out and implementing the Scheme and to put it into operation were adjusted against the Capital Reserve.
Details of assets and liabilities acquired on amalgamation and treatment of the difference between the net assets acquired and the face value of the shares issued by the Transferee Company as consideration to the shareholders of the Transferor Company and after adjusting for cancellation of equity share capital:
(` In Million)
ParticularsYear ended
31 March 2012Value of assets and liabilities acquired:Cash and bank balances 6.39
Deferred tax asset 0.14 6.53
Less: Current liabilities 0.05
Difference considered as capital reserve 6.48
Less: Merger expenses 6.48
-
29.2 Employee benefit plans
a. Defined contribution plans The Company makes Provident Fund and Employee State Insurance Scheme
contributions which are defined contribution plans, for qualifying employees. Under the Schemes, the Company is required to contribute a specified percentage of the payroll costs to fund the benefits. The Company recognised Rs.23.67 Million (Year ended 31 March 2012 Rs. 19.01 Million) for Provident Fund contributions and Rs.2.37 Million (Year ended 31 March 2012 Rs.1.95 Million) for Employee State Insurance Scheme contributions in the Statement of Profit and Loss. The contributions payable to these plans by the Company are at rates specified in the rules of the schemes.
b. Defined benefit plans The Company has a defined Gratuity benefit plan. The following table summarizes
the components of net employee benefit expenses recognised in the statement of profit and loss and the funded status and amounts recognised in the balance sheet for the plan.
(` In Million)
Particulars
Year ended 31 March
2013
Year ended 31 March
2012Components of employer expenseCurrent service cost 12.16 8.20
Interest cost 3.08 2.90
Expected return on plan assets (0.92) (0.78)
Unrecognised past service cost - non vested benefits
0.12 -
Recognised past service cost - non vested benefits 0.03 0.17
Actuarial losses/(gains) 1.96 (6.08)
Total expense recognised in the Statement of Profit and Loss
16.43 4.41
Actual contribution and benefit payments for year Actual benefit payments (2.57) (3.62)
Actual contributions 4.50 3.28
Net asset / (liability) recognised in the Balance Sheet Present value of defined benefit obligation 54.54 39.66
Fair value of plan assets 13.61 10.52
Funded status [Surplus / (Deficit)] (40.93) (29.14)
Unrecognised past service costs - non vested benefits
- 0.14
Net asset / (liability) recognised in the Balance Sheet
(40.93) (29.00)
(` In Million)
Particulars
Year ended 31 March
2013
Year ended 31 March
2012Change in defined benefit obligations (DBO) during the year Present value of DBO at beginning of the year 39.66 38.08
Current service cost 12.16 8.20
Interest cost 3.08 2.90
Actuarial (gains) / losses 2.20 (5.90)
Past service cost - -
Benefits paid (2.56) (3.62)
Present value of DBO at the end of the year 54.54 39.66Change in fair value of assets during the year Plan assets at beginning of the year 10.52 9.89
Expected return on plan assets 0.92 0.78
Actual company contributions 4.50 3.28
Actuarial gain / (loss) 0.24 0.19
Benefits paid (2.57) (3.62)
Plan assets at the end of the year 13.61 10.52
Actual return on plan assets 1.16 0.97
Composition of the plan assets is as follows: The details with respect to the investment made by Fund managers (LIC and SBI Life) into
major categories of plan assets have not been disclosed, as the same has not be provided by the Fund managers to the Company.
(` In Million)
Particulars
Year ended 31 March
2013
Year ended 31 March
2012Actuarial assumptionsDiscount rate 8% 8%
Expected return on plan assets 8% 8%
Salary escalation 12% 10%-12%
Attrition 8%-12% 8%-12%
Mortality tables LIC (94-96) Ult
(` In Million)
Experience adjustments 2012-13 2011-12 2010-11 2009-10Experience (gain) / loss adjustments on plan liabilities
2.20 (5.90) 0.82 7.82
Experience gain / (loss) adjustments on plan assets
0.24 0.19 0.19 (0.40)
In the absence of information relating to experience adjustment for the earlier year 2008-09 with the company, the same has not been disclosed
Notes: 1. The discount rate is based on the prevailing market yields of Government of India
securities as at the Balance Sheet date for the estimated term of the obligations.
2. The estimate of future salary increases considered, takes into account the inflation, seniority, promotion, increments and other relevant factors.
3. The Company’s best estimate, as soon as it can reasonably be determined, of contributions expected to be paid to the plan during the annual period beginning after balance sheet date is Rs. Nil million (Previous year: Rs. 3.5 million)
Notes forming part of the consolidated financial statements (Contd.)
29 DISCLOSURE UNDER ACCOUNTING STANDARD (Contd.)
CONSOLIDATED10
0Se
Qu
ent
Scie
nti
fic
Lim
ited
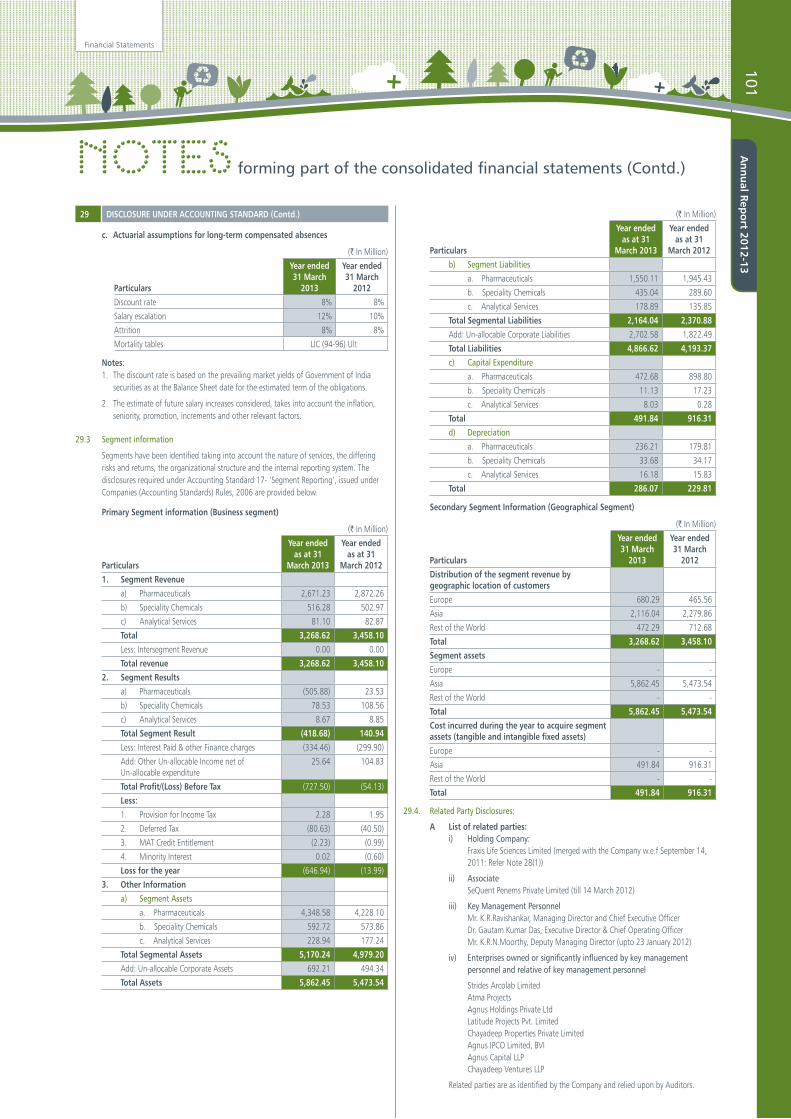
c. Actuarial assumptions for long-term compensated absences
(` In Million)
Particulars
Year ended 31 March
2013
Year ended 31 March
2012Discount rate 8% 8%
Salary escalation 12% 10%
Attrition 8% 8%
Mortality tables LIC (94-96) Ult
Notes: 1. The discount rate is based on the prevailing market yields of Government of India
securities as at the Balance Sheet date for the estimated term of the obligations.
2. The estimate of future salary increases considered, takes into account the inflation, seniority, promotion, increments and other relevant factors.
29.3 Segment information
Segments have been identified taking into account the nature of services, the differing risks and returns, the organizational structure and the internal reporting system. The disclosures required under Accounting Standard 17- ‘Segment Reporting’, issued under Companies (Accounting Standards) Rules, 2006 are provided below.
Primary Segment information (Business segment)
(` In Million)
Particulars
Year ended as at 31
March 2013
Year ended as at 31
March 20121. Segment Revenue
a) Pharmaceuticals 2,671.23 2,872.26
b) Speciality Chemicals 516.28 502.97
c) Analytical Services 81.10 82.87
Total 3,268.62 3,458.10 Less: Intersegment Revenue 0.00 0.00
Total revenue 3,268.62 3,458.10 2. Segment Results
a) Pharmaceuticals (505.88) 23.53
b) Speciality Chemicals 78.53 108.56
c) Analytical Services 8.67 8.85
Total Segment Result (418.68) 140.94Less: Interest Paid & other Finance charges (334.46) (299.90)
Add: Other Un-allocable Income net of Un-allocable expenditure
25.64 104.83
Total Profit/(Loss) Before Tax (727.50) (54.13)
Less: 1. Provision for Income Tax 2.28 1.95
2. Deferred Tax (80.63) (40.50)
3. MAT Credit Entitlement (2.23) (0.99)
4. Minority Interest 0.02 (0.60)
Loss for the year (646.94) (13.99)
3. Other Informationa) Segment Assets
a. Pharmaceuticals 4,348.58 4,228.10
b. Speciality Chemicals 592.72 573.86
c. Analytical Services 228.94 177.24
Total Segmental Assets 5,170.24 4,979.20 Add: Un-allocable Corporate Assets 692.21 494.34
Total Assets 5,862.45 5,473.54
Notes forming part of the consolidated financial statements (Contd.)
29 DISCLOSURE UNDER ACCOUNTING STANDARD (Contd.) (` In Million)
Particulars
Year ended as at 31
March 2013
Year ended as at 31
March 2012b) Segment Liabilities
a. Pharmaceuticals 1,550.11 1,945.43
b. Speciality Chemicals 435.04 289.60
c. Analytical Services 178.89 135.85
Total Segmental Liabilities 2,164.04 2,370.88 Add: Un-allocable Corporate Liabilities 2,702.58 1,822.49
Total Liabilities 4,866.62 4,193.37 c) Capital Expenditure
a. Pharmaceuticals 472.68 898.80
b. Speciality Chemicals 11.13 17.23
c. Analytical Services 8.03 0.28
Total 491.84 916.31 d) Depreciation
a. Pharmaceuticals 236.21 179.81
b. Speciality Chemicals 33.68 34.17
c. Analytical Services 16.18 15.83
Total 286.07 229.81
Secondary Segment Information (Geographical Segment)
(` In Million)
Particulars
Year ended 31 March
2013
Year ended 31 March
2012Distribution of the segment revenue by geographic location of customersEurope 680.29 465.56
Asia 2,116.04 2,279.86
Rest of the World 472.29 712.68
Total 3,268.62 3,458.10Segment assetsEurope - -
Asia 5,862.45 5,473.54
Rest of the World - -
Total 5,862.45 5,473.54 Cost incurred during the year to acquire segment assets (tangible and intangible fixed assets)Europe - -
Asia 491.84 916.31
Rest of the World - -
Total 491.84 916.31
29.4. Related Party Disclosures:
A List of related parties: i) Holding Company: Fraxis Life Sciences Limited (merged with the Company w.e.f September 14,
2011: Refer Note 28(1))
ii) Associate SeQuent Penems Private Limited (till 14 March 2012)
iii) Key Management Personnel Mr. K.R.Ravishankar, Managing Director and Chief Executive Officer Dr. Gautam Kumar Das, Executive Director & Chief Operating Officer Mr. K.R.N.Moorthy, Deputy Managing Director (upto 23 January 2012)
iv) Enterprises owned or significantly influenced by key management personnel and relative of key management personnel
Strides Arcolab LimitedAtma ProjectsAgnus Holdings Private LtdLatitude Projects Pvt. LimitedChayadeep Properties Private LimitedAgnus IPCO Limited, BVIAgnus Capital LLPChayadeep Ventures LLP
Related parties are as identified by the Company and relied upon by Auditors.
Financial Statements101
An
nu
al Rep
ort 2012-13

Notes forming part of the consolidated financial statements (Contd.)B.
Tr
ansa
ctio
n du
ring
the
year
(i)Sa
le o
f mat
eria
l/ser
vice
s
Strid
es A
rcol
ab Li
mite
d 6
5.28
2
8.12
(ii)
Sale
of m
achi
nery
/ass
ets
SeQu
ent P
enem
s Priv
ate
Limite
d (S
lum
p sa
le) -
90.
00
(iii)
Inte
rest
& o
ther
inco
me
Strid
es A
rcol
ab Li
mite
d
SeQu
ent P
enem
s Priv
ate
Limite
d -
15.
58
(iv)
Inte
rest
pai
d
Chay
adee
p Pr
oper
ties P
rivat
e Lim
ited
17.
36
(v)
Purc
hase
of m
ater
ials
Strid
es A
rcol
ab Li
mite
d 0
.73
-
(vi)
Purc
hase
of t
echi
cal k
now
-how
Agnu
s IPC
O Lim
ited
- 2
9.04
(vii)
Man
ager
ial r
emun
erat
ion
Mr.
K.R.
Ravis
hank
ar 4
7.87
2
1.24
Dr. G
auth
am K
umar
Das
14.
95
9.9
9
Mr.
K.R.
N. M
oorth
y -
9.7
3
(viii
)Re
imbu
rsem
ent o
f exp
ense
s to
Strid
es A
rcol
ab Li
mite
d 0
.88
-
(ix)
Rent
Atm
a Pr
ojec
ts 6
.06
5.7
5
(x)
Loan
s/adv
ance
s giv
en b
y Co
mpa
ny
SeQu
ent P
enem
s Priv
ate
Limite
d -
135
.48
Mr.
K.R.
Ravis
hank
ar -
12.
90
(xi)
Loan
/adv
ance
s rep
aid
to th
e co
mpa
ny
Para
dim
e In
frastr
uctu
re D
evelo
pmen
t Com
pany
2.5
0 -
SeQu
ent P
enem
s Priv
ate
Limite
d -
1.2
6
Agnu
s Hol
ding
s Priv
ate
Limite
d -
5.0
0
(xii)
Loan
s/adv
ance
s rec
eive
d*
Chay
adee
p Pr
oper
ties P
rivat
e Lim
ited
362
.93
-
(xiii
) Lo
an/a
dvan
ces r
epai
d by
the
Com
pany
**
Chay
adee
p Pr
oper
ties P
rivat
e Lim
ited
17.
00
-
29DI
SCLO
SURE
UND
ER A
CCOU
NTIN
G ST
ANDA
RD (C
ontd
.)
(` In
Milli
on)
Natu
re o
f Tra
nsac
tions
ASS
OCIA
TES
KEY
MAN
AGEM
ENT
PERS
ONNE
L E
NTER
PRIS
ES O
WNE
D OR
SIG
NIFI
CANT
LY
INFL
UENC
ED B
Y KE
Y M
ANAG
EMEN
T PE
RSON
NEL
OR T
HEIR
REL
ATIV
ES
Yea
r End
ed
31.0
3.20
13
Yea
r End
ed
31.0
3.20
12
Yea
r End
ed
31.0
3.20
13
Yea
r End
ed
31.0
3.20
12
Yea
r End
ed
31.0
3.20
13
Yea
r End
ed
31.0
3.20
12
CONSOLIDATED10
2Se
Qu
ent
Scie
nti
fic
Lim
ited
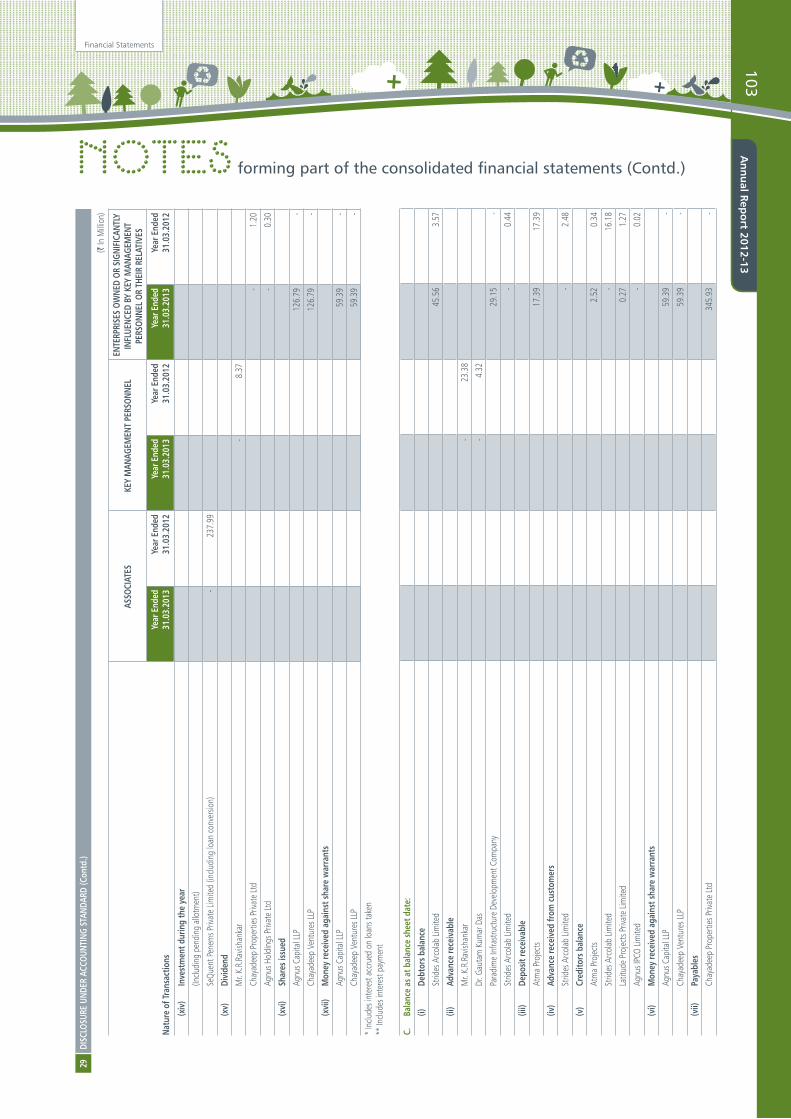
Notes forming part of the consolidated financial statements (Contd.)(x
iv)
Inve
stm
ent d
urin
g th
e ye
ar
(Inclu
ding
pen
ding
allo
tmen
t)
SeQu
ent P
enem
s Priv
ate
Limite
d (in
cludi
ng lo
an co
nver
sion)
- 2
37.9
9
(xv)
Divi
dend
Mr.
K.R.
Ravis
hank
ar -
8.3
7
Chay
adee
p Pr
oper
ties P
rivat
e Lt
d -
1.2
0
Agnu
s Hol
ding
s Priv
ate
Ltd
- 0
.30
(xvi
)Sh
ares
issu
ed
Agnu
s Cap
ital L
LP 1
26.7
9 -
Chay
adee
p Ve
ntur
es LL
P 1
26.7
9 -
(xvi
i)M
oney
rece
ived
aga
inst
shar
e w
arra
nts
Agnu
s Cap
ital L
LP 5
9.39
-
Chay
adee
p Ve
ntur
es LL
P 5
9.39
-
* In
clude
s int
eres
t acc
rued
on
loan
s tak
en**
Inclu
des i
nter
est p
aym
ent
C.
Bala
nce
as a
t bal
ance
shee
t dat
e:
(i)De
btor
s bal
ance
Strid
es A
rcol
ab Li
mite
d 4
5.56
3
.57
(ii)
Adva
nce
rece
ivab
le
Mr.
K.R.
Ravis
hank
ar -
23.
38
Dr. G
auta
m K
umar
Das
- 4
.32
Para
dim
e In
frastr
uctu
re D
evelo
pmen
t Com
pany
29.
15
-
Strid
es A
rcol
ab Li
mite
d -
0.4
4
(iii)
Depo
sit re
ceiv
able
Atm
a Pr
ojec
ts 1
7.39
1
7.39
(iv)
Adva
nce
rece
ived
from
cus
tom
ers
Strid
es A
rcol
ab Li
mite
d -
2.4
8
(v)
Cred
itors
bal
ance
Atm
a Pr
ojec
ts 2
.52
0.3
4
Strid
es A
rcol
ab Li
mite
d -
16.
18
Latit
ude
Proj
ects
Priva
te Li
mite
d 0
.27
1.2
7
Agnu
s IPC
O Lim
ited
- 0
.02
(vi)
Mon
ey re
ceiv
ed a
gain
st sh
are
war
rant
s
Agnu
s Cap
ital L
LP 5
9.39
-
Chay
adee
p Ve
ntur
es LL
P 5
9.39
-
(vii)
Paya
bles
Chay
adee
p Pr
oper
ties P
rivat
e Lt
d 3
45.9
3 -
29DI
SCLO
SURE
UND
ER A
CCOU
NTIN
G ST
ANDA
RD (C
ontd
.)
(` In
Milli
on)
Natu
re o
f Tra
nsac
tions
ASS
OCIA
TES
KEY
MAN
AGEM
ENT
PERS
ONNE
L E
NTER
PRIS
ES O
WNE
D OR
SIG
NIFI
CANT
LY
INFL
UENC
ED B
Y KE
Y M
ANAG
EMEN
T PE
RSON
NEL
OR T
HEIR
REL
ATIV
ES
Yea
r End
ed
31.0
3.20
13
Yea
r End
ed
31.0
3.20
12
Yea
r End
ed
31.0
3.20
13
Yea
r End
ed
31.0
3.20
12
Yea
r End
ed
31.0
3.20
13
Yea
r End
ed
31.0
3.20
12
Financial Statements103
An
nu
al Rep
ort 2012-13
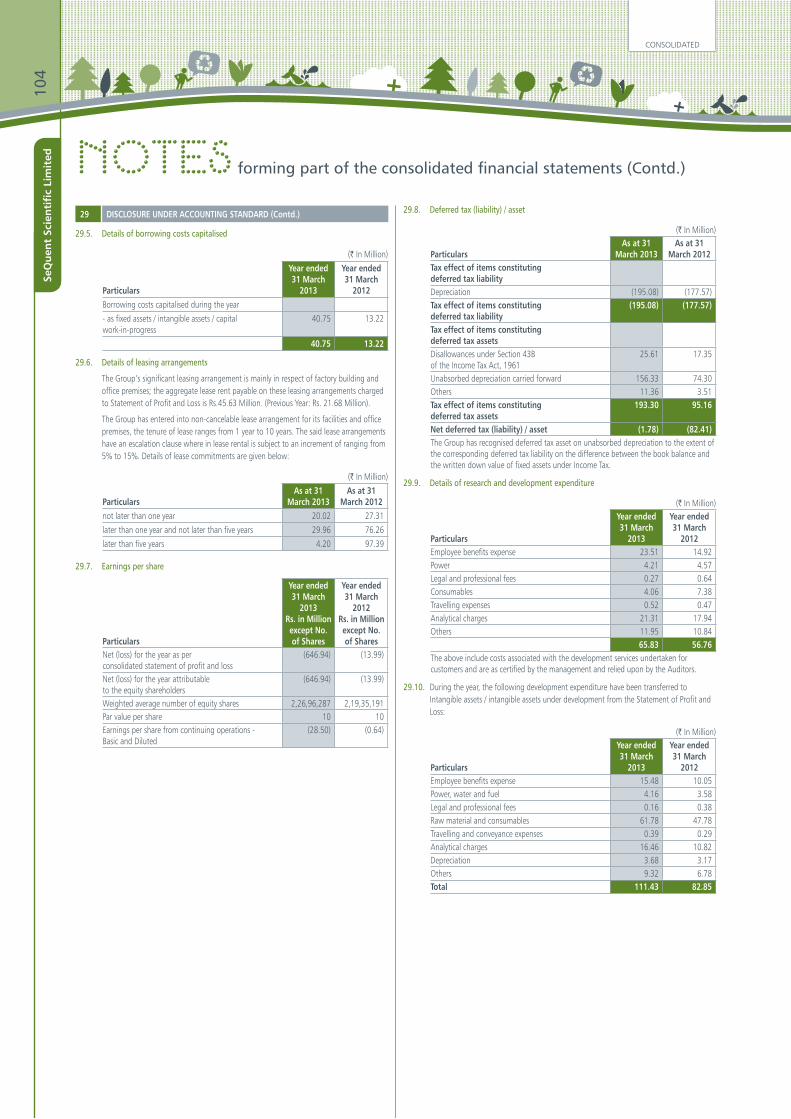
29.5. Details of borrowing costs capitalised
(` In Million)
Particulars
Year ended 31 March
2013
Year ended 31 March
2012Borrowing costs capitalised during the year
- as fixed assets / intangible assets / capital work-in-progress
40.75 13.22
40.75 13.22
29.6. Details of leasing arrangements
The Group’s significant leasing arrangement is mainly in respect of factory building and office premises; the aggregate lease rent payable on these leasing arrangements charged to Statement of Profit and Loss is Rs.45.63 Million. (Previous Year: Rs. 21.68 Million).
The Group has entered into non-cancelable lease arrangement for its facilities and office premises, the tenure of lease ranges from 1 year to 10 years. The said lease arrangements have an escalation clause where in lease rental is subject to an increment of ranging from 5% to 15%. Details of lease commitments are given below:
(` In Million)
ParticularsAs at 31
March 2013As at 31
March 2012not later than one year 20.02 27.31
later than one year and not later than five years 29.96 76.26
later than five years 4.20 97.39
29.7. Earnings per share
Particulars
Year ended 31 March
2013 Rs. in Millionexcept No. of Shares
Year ended 31 March
2012Rs. in Millionexcept No. of Shares
Net (loss) for the year as per consolidated statement of profit and loss
(646.94) (13.99)
Net (loss) for the year attributable to the equity shareholders
(646.94) (13.99)
Weighted average number of equity shares 2,26,96,287 2,19,35,191 Par value per share 10 10Earnings per share from continuing operations - Basic and Diluted
(28.50) (0.64)
29.8. Deferred tax (liability) / asset
(` In Million)
ParticularsAs at 31
March 2013As at 31
March 2012Tax effect of items constituting deferred tax liabilityDepreciation (195.08) (177.57)Tax effect of items constituting deferred tax liability
(195.08) (177.57)
Tax effect of items constituting deferred tax assetsDisallowances under Section 43B of the Income Tax Act, 1961
25.61 17.35
Unabsorbed depreciation carried forward 156.33 74.30 Others 11.36 3.51 Tax effect of items constituting deferred tax assets
193.30 95.16
Net deferred tax (liability) / asset (1.78) (82.41)The Group has recognised deferred tax asset on unabsorbed depreciation to the extent of the corresponding deferred tax liability on the difference between the book balance and the written down value of fixed assets under Income Tax.
29.9. Details of research and development expenditure
(` In Million)
Particulars
Year ended 31 March
2013
Year ended 31 March
2012Employee benefits expense 23.51 14.92 Power 4.21 4.57 Legal and professional fees 0.27 0.64 Consumables 4.06 7.38 Travelling expenses 0.52 0.47 Analytical charges 21.31 17.94 Others 11.95 10.84
65.83 56.76 The above include costs associated with the development services undertaken for customers and are as certified by the management and relied upon by the Auditors.
29.10. During the year, the following development expenditure have been transferred to Intangible assets / intangible assets under development from the Statement of Profit and Loss:
(` In Million)
Particulars
Year ended 31 March
2013
Year ended 31 March
2012Employee benefits expense 15.48 10.05 Power, water and fuel 4.16 3.58 Legal and professional fees 0.16 0.38 Raw material and consumables 61.78 47.78 Travelling and conveyance expenses 0.39 0.29 Analytical charges 16.46 10.82 Depreciation 3.68 3.17 Others 9.32 6.78 Total 111.43 82.85
Notes forming part of the consolidated financial statements (Contd.)
29 DISCLOSURE UNDER ACCOUNTING STANDARD (Contd.)
CONSOLIDATED10
4Se
Qu
ent
Scie
nti
fic
Lim
ited
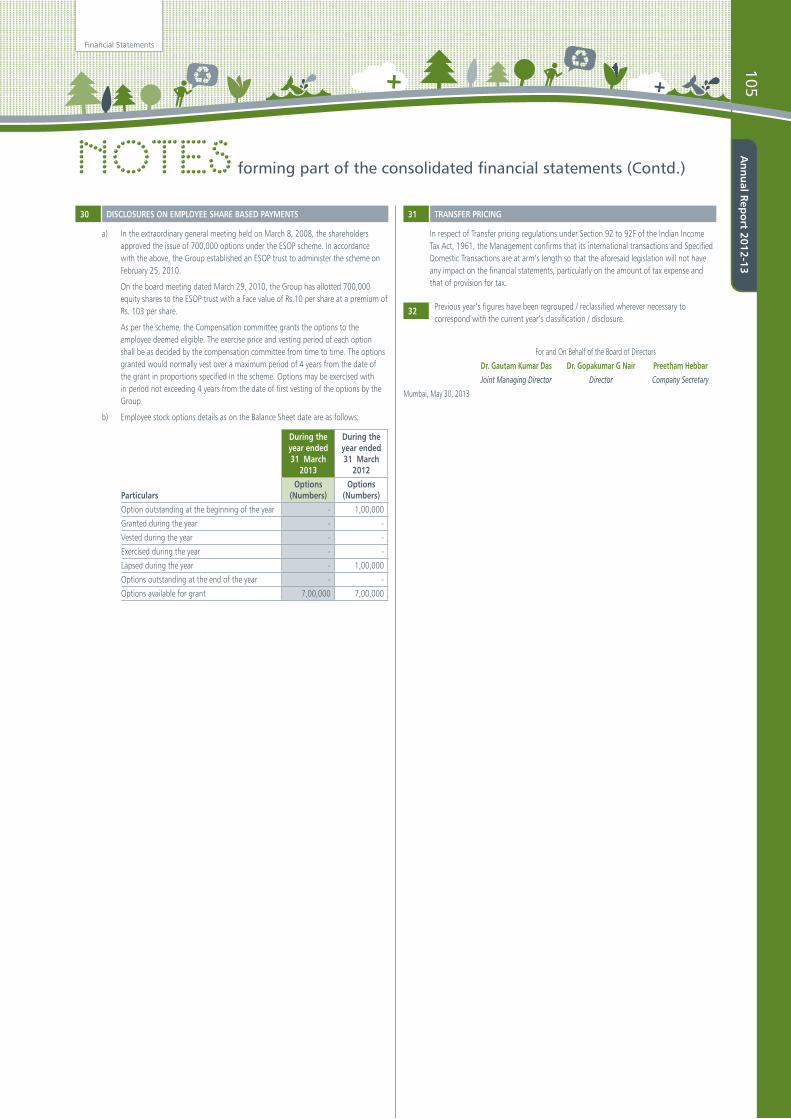
Notes forming part of the consolidated financial statements (Contd.)
30 DISCLOSURES ON EMPLOYEE SHARE BASED PAYMENTS
a) In the extraordinary general meeting held on March 8, 2008, the shareholders approved the issue of 700,000 options under the ESOP scheme. In accordance with the above, the Group established an ESOP trust to administer the scheme on February 25, 2010.
On the board meeting dated March 29, 2010, the Group has allotted 700,000 equity shares to the ESOP trust with a Face value of Rs.10 per share at a premium of Rs. 103 per share.
As per the scheme, the Compensation committee grants the options to the employee deemed eligible. The exercise price and vesting period of each option shall be as decided by the compensation committee from time to time. The options granted would normally vest over a maximum period of 4 years from the date of the grant in proportions specified in the scheme. Options may be exercised with in period not exceeding 4 years from the date of first vesting of the options by the Group.
b) Employee stock options details as on the Balance Sheet date are as follows:
Particulars
During the year ended 31 March
2013
During the year ended 31 March
2012Options
(Numbers)Options
(Numbers)Option outstanding at the beginning of the year - 1,00,000
Granted during the year - -
Vested during the year - -
Exercised during the year - -
Lapsed during the year - 1,00,000
Options outstanding at the end of the year - -
Options available for grant 7,00,000 7,00,000
31 TRANSFER PRICING
In respect of Transfer pricing regulations under Section 92 to 92F of the Indian Income Tax Act, 1961, the Management confirms that its international transactions and Specified Domestic Transactions are at arm’s length so that the aforesaid legislation will not have any impact on the financial statements, particularly on the amount of tax expense and that of provision for tax.
32 Previous year’s figures have been regrouped / reclassified wherever necessary to correspond with the current year’s classification / disclosure.
For and On Behalf of the Board of Directors
Dr. Gautam Kumar Das Dr. Gopakumar G Nair Preetham HebbarJoint Managing Director Director Company Secretary
Mumbai, May 30, 2013
Financial Statements105
An
nu
al Rep
ort 2012-13

(` In Million)
S No. Particulars 2012-13 2011-12 2010-11 2009-10 2008-09 2007-08 2006-07 2005-06
A. FINANCIAL RESULTS SUMMARY
1 Revenue from operations 3,141 3,324 2,780 2,463 1,061 748 447 323
2 Other Income 25 113 114 73 18 4 39 6
3 EBIDTA (40) 468 584 674 139 86 128 60
4 PAT (545) 15 159 208 35 25 88 38
5 Paid up Equity Share Capital
240 219 219 212 111 111 79 65
6 Shareholders' Networth 1,094 1,267 1,256 1,159 596 574 349 198
B. KEY RATIOS & PARAMETERS
1 EBIDTA Margin % (1.3%) 14.1% 21.0% 27.4% 13.1% 11.5% 28.6% 18.6%
2 PAT Margin % (17.2%) 0.4% 5.5% 8.2% 3.2% 3.3% 18.1% 11.6%
3 EPS - Rs. / Share (24.01) 0.67 7.26 9.79 3.16 2.26 11.17 5.85
Note: Standalone figures have been considered
KEYFinancial Parameters & RATIOSat a Glance
KEY FINANCIALPARAMETERS
& RATIOS10
6Se
Qu
ent
Scie
nti
fic
Lim
ited
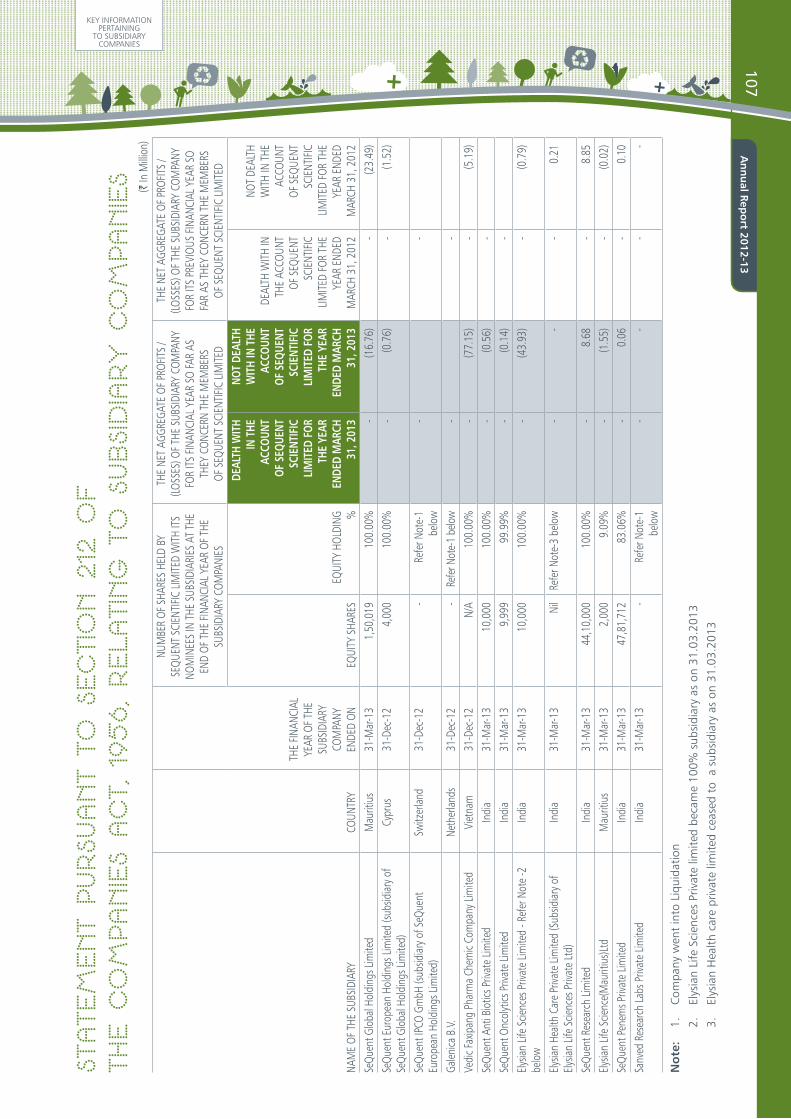
State
ment
Pursu
ant
To S
ection 2
12 O
f Th
e C
ompa
nies
Act, 195
6, R
ela
ting T
o S
ubsidiary C
ompa
nies (` In
Milli
on)
NAM
E OF
THE
SUB
SIDIA
RYCO
UNTR
Y
THE
FINAN
CIAL
YE
AR O
F THE
SU
BSID
IARY
CO
MPA
NY
ENDE
D ON
NUM
BER
OF S
HARE
S HE
LD B
Y SE
QUEN
T SC
IENT
IFIC
LIMITE
D W
ITH IT
S NO
MIN
EES
IN T
HE S
UBSID
IARI
ES A
T TH
E EN
D OF
THE
FINA
NCIA
L YEA
R OF
THE
SU
BSID
IARY
COM
PANI
ES
THE
NET
AGGR
EGAT
E OF
PRO
FITS
/ (LO
SSES
) OF T
HE S
UBSID
IARY
COM
PANY
FO
R ITS
FINA
NCIA
L YEA
R SO
FAR
AS
THEY
CON
CERN
THE
MEM
BERS
OF
SEQ
UENT
SCI
ENTIF
IC LI
MITE
D
THE
NET
AGGR
EGAT
E OF
PRO
FITS
/ (LO
SSES
) OF T
HE S
UBSID
IARY
COM
PANY
FO
R ITS
PRE
VIOU
S FIN
ANCI
AL Y
EAR
SO
FAR
AS T
HEY
CONC
ERN
THE
MEM
BERS
OF
SEQ
UENT
SCI
ENTIF
IC LI
MITE
D
EQUI
TY S
HARE
SEQ
UITY
HOL
DING
%
DEAL
TH W
ITH
IN T
HE
ACCO
UNT
OF S
EQUE
NT
SCIE
NTIF
IC
LIM
ITED
FOR
TH
E YE
AR
ENDE
D M
ARCH
31
, 201
3
NOT
DEAL
TH
WIT
H IN
THE
AC
COUN
T OF
SEQ
UENT
SC
IENT
IFIC
LI
MIT
ED F
OR
THE
YEAR
EN
DED
MAR
CH
31, 2
013
DEAL
TH W
ITH IN
TH
E AC
COUN
T OF
SEQ
UENT
SC
IENT
IFIC
LIMITE
D FO
R TH
E YE
AR E
NDED
M
ARCH
31,
201
2
NOT
DEAL
TH
WITH
IN T
HE
ACCO
UNT
OF S
EQUE
NT
SCIE
NTIFI
C LIM
ITED
FOR
THE
YEAR
END
ED
MAR
CH 3
1, 2
012
SeQu
ent G
loba
l Hol
ding
s Lim
ited
Mau
ritiu
s31
-Mar
-13
1,5
0,01
9 10
0.00
%-
(16.
76)
- (2
3.49
)Se
Quen
t Eur
opea
n Ho
ldin
gs Li
mite
d (su
bsid
iary o
f Se
Quen
t Glo
bal H
oldi
ngs L
imite
d)Cy
prus
31-D
ec-1
2 4
,000
10
0.00
%-
(0.7
6)-
(1.5
2)
SeQu
ent I
PCO
GmbH
(sub
sidiar
y of S
eQue
nt
Euro
pean
Hol
ding
s Lim
ited)
Switz
erlan
d31
-Dec
-12
- R
efer
Not
e-1
belo
w
--
Galen
ica B
.V.
Neth
erlan
ds31
-Dec
-12
- R
efer
Not
e-1
below
-
-Ve
dic F
axip
ang
Phar
ma
Chem
ic Co
mpa
ny Li
mite
dVi
etna
m31
-Dec
-12
N/A
10
0.00
%-
(77.
15)
- (5
.19)
SeQu
ent A
nti B
iotic
s Priv
ate
Limite
dIn
dia
31-M
ar-1
3 1
0,00
0 10
0.00
%-
(0.5
6)-
SeQu
ent O
ncol
ytics
Priv
ate
Limite
dIn
dia
31-M
ar-1
3 9
,999
99
.99%
- (0
.14)
-Ely
sian
Life
Scien
ces P
rivat
e Lim
ited
- Ref
er N
ote
-2
belo
wIn
dia
31-M
ar-1
3 1
0,00
0 10
0.00
%-
(43.
93)
- (0
.79)
Elysia
n He
alth
Care
Priv
ate
Limite
d (S
ubsid
iary o
f Ely
sian
Life
Scien
ces P
rivat
e Lt
d)In
dia
31-M
ar-1
3 N
il Re
fer N
ote-
3 be
low
- -
-
0.2
1
SeQu
ent R
esea
rch
Limite
dIn
dia
31-M
ar-1
3 4
4,10
,000
10
0.00
%-
8.6
8 -
8.8
5 Ely
sian
Life
Scien
ce(M
aurit
ius)L
tdM
aurit
ius
31-M
ar-1
3 2
,000
9.
09%
- (1
.55)
- (0
.02)
SeQu
ent P
enem
s Priv
ate
Limite
dIn
dia
31-M
ar-1
3 4
7,81
,712
83
.06%
- 0
.06
- 0
.10
Sanv
ed R
esea
rch
Labs
Priv
ate
Limite
dIn
dia
31-M
ar-1
3 -
R
efer
Not
e-1
belo
w
- -
-
-
No
te:
1.
Com
pany
wen
t in
to L
iqui
datio
n
2.
El
ysia
n Li
fe S
cien
ces
Priv
ate
limite
d be
cam
e 10
0% s
ubsi
diar
y as
on
31.0
3.20
13
3.
El
ysia
n H
ealth
car
e pr
ivat
e lim
ited
ceas
ed t
o a
sub
sidi
ary
as o
n 31
.03.
2013
107A
nn
ual R
epo
rt 2012-13
KEY INFORMATION PERTAINING
TO SUBSIDIARY COMPANIES

Key Info
rmation p
erta
ining t
o S
ubsidiary C
ompa
nies
Financial
State
ments
as
at
the r
esp
ective f
inancial
year
(` In
Milli
on)
NAM
E OF
THE
SUB
SIDIA
RYCO
UNTR
Y
THE
FINAN
CIAL
YE
AR O
F THE
SU
BSID
IARY
CO
MPA
NY
ENDE
D ON
CAPIT
ALRE
SERV
ESTO
TAL
ASSE
TSTO
TAL
LIABI
LITIE
SIN
VEST
MEN
TTU
RNOV
ERPR
OFIT
BEFO
RE TA
XTA
X PR
OVIS
ION
PROF
IT
AFTE
R TA
XPR
OPOS
ED
DIVI
DEND
SeQu
ent G
loba
l Hol
ding
s Lim
ited
Mau
ritiu
s31
-Mar
-13
9.7
8 (5
0.20
) 1
.11
41.
53
-
-
(16.
76)
-
(16.
76)
-
SeQu
ent E
urop
ean
Hold
ings
Lim
ited
(subs
idiar
y of S
eQue
nt G
loba
l Ho
ldin
gs Li
mite
d)
Cypr
us31
-Dec
-12
0.2
8 (1
.21)
0.1
1 1
.04
-
-
(0.7
6) -
(0
.76)
-
Vedi
c Fax
ipan
g Ph
arm
a Ch
emic
Com
pany
Lim
ited
Viet
nam
31-D
ec-1
2 1
24.5
5 (1
07.8
6) 5
1.99
3
5.30
1
.11
43.
98
(77.
15)
-
(77.
15)
-
SeQu
ent A
nti B
iotic
s Priv
ate
Limite
dIn
dia
31-M
ar-1
3 0
.10
(0.5
6) 1
.20
1.6
7 -
-
(0
.56)
-
(0.5
6) -
Se
Quen
t Onc
olyt
ics P
rivat
e Lim
ited
Indi
a31
-Mar
-13
0.1
0 (0
.14)
0.0
6 0
.10
-
-
(0.1
4) -
(0
.14)
-
Elysia
n Lif
e Sc
ience
s Priv
ate
Limite
d -
Refe
r not
e 1
belo
wIn
dia
31-M
ar-1
3 0
.10
(44.
88)
66.
89
111
.67
55.
81
-
(43.
93)
-
(43.
93)
-
Elysia
n He
alth
Care
Priv
ate
Limite
d -
Refe
r not
e 2
belo
wIn
dia
31-M
ar-1
3 0
.10
0.3
9 6
.67
6.1
8 -
4
7.01
0
.12
0.0
4 0
.08
-
SeQu
ent R
esea
rch
Limite
dIn
dia
31-M
ar-1
3 4
4.10
5
.96
228
.94
178
.88
-
130
.64
11.
15
2.4
7 8
.68
-
Elysia
n Lif
e Sc
ience
(Mau
ritiu
s)Ltd
Mau
ritiu
s31
-Mar
-13
1.2
0 (1
7.22
) 5
7.10
7
3.12
-
2
2.98
(1
7.07
) -
(1
7.07
) -
Se
Quen
t Pen
ems P
rivat
e Lim
ited
Indi
a31
-Mar
-13
57.
57
391
.22
878
.97
430
.18
-
-
0.0
9 0
.01
0.0
7 -
No
te:
1.
Elys
ian
Life
Sci
ence
s Pr
ivat
e lim
ited
beca
me
100%
sub
sidi
ary
as o
n 31
.03.
2013
2.
El
ysia
n H
ealth
car
e pr
ivat
e lim
ited
ceas
ed t
o a
subs
idia
ry a
s on
31.
03.2
013
108
SeQ
uen
t Sc
ien
tifi
c Li
mit
ed
KEY INFORMATION PERTAINING
TO SUBSIDIARY COMPANIES

Corporate Information
BOARD OF DIRECTORS
Mr. K R Ravishankar
Chairman & Managing Director
Dr. Gautam Kumar Das
Joint Managing Director
Dr. Gopakumar G Nair
Independent Director
Mr. Kannan Ramanujam
Independent Director
COMPANY SECRETARY
Preetham Hebbar
REGISTERED OFFICE
301, 3rd Floor, Dosti Pinnacle,
Plot No. E7, Road No.22
Wagle Industrial Estate
Thane (W), Mumbai - 400 604
CORPORATE OFFICE
Star II, OPP IIM-B, Bilekahalli
Bannerghatta Road,
Bangalore - 560076
STATUTORY AUDITORS
M/s. Deloitte Haskins and Sells
No. 101/2, Richmond Road
Bangalore - 560025
INTERNAL AUDITORS
M/s. Grant Thornton India LLP
Wings, 1st Floor, 16/1, Cambridge Road
Ulsoor, Bangalore - 560 008
BANKERS
1. Housing Development Finance Corporation Limited
2. Corporation Bank
3. Central Bank of India
4. State Bank of Hyderabad
5. State Bank of Mysore
6. State Bank of India
7. Andhra Bank
8. Indian Overseas Bank
9. Technology Development Board, New Delhi
REGISTRAR AND SHARE TRANSFER AGENT
Adroit Corporate Services Private Limited
17-20, Jaferbhoy Industrial Estate, 1st Floor
Makhwana Road, Marol Naka, Andheri (E)
Mumbai – 400 059
PLANTS
• Plot No. 7& 8, MIDC Engineering Zone
KalyanBadlapur Road, Ambernath, Maharashtra
• Plot No. W-152,150,151,136,137,138,139,
140 & 141 - MIDC, Tarapur, Boisar, Dist Thane
Maharashtra.
• B-32, G-2, G-3, MIDC, Mahad
Dist. Raigad, Maharashtra.
• A-68 and 69, Additional Ambernath
MIDC Indl. Area, Ambernath (East),
Dist. Thane, Maharashtra
• 120 A &B, Plot No. 36, Industrial Area
Baikampady, New Mangalore, Karnataka
• Plot No. 26, 26B, GIDC Industrial Estate, Panoli
Dist. Bharuch, Gujarat.
• A-14, MIDC, Phase I, Dombivali (E)
Dist. Thane, Maharashtra
Corporate Information109
An
nu
al Rep
ort 2012-13

Notes
CONSOLIDATED11
0Se
Qu
ent
Scie
nti
fic
Lim
ited

Notes
Financial Statements111
An
nu
al Rep
ort 2012-13

Notes
CONSOLIDATED11
2Se
Qu
ent
Scie
nti
fic
Lim
ited

Fortuna Public Relations Pvt. Ltd. (www.fortunapr.in)CONCEPT, DESIGNED AND PRODUCED AT

www.sequent.in