from activity to action:
TRANSCRIPT

FR OM ACTIVITY TO ACTION:How to Deliver Analytic Ins ights in an E ffective Manner
Sara R ober ts , PhD12th Annual S IOP LE COctober 22nd, 2016

C AT E G OR Y ON E CONSULTING
OVE R VIE WI will cover the following topics dur ing today’s presentation
B r ief Introductions 3
Talent Analytics Over view 7
Deliver y Mechanisms 12
Stor ytelling & Data Visualization 19
Questions & Contact Infor mation 24
2
01 A Little About Me
02 A L ittle About C1C
03 A Few Questions For You
B R IE FINTR ODUCTIONS

C AT E G OR Y ON E CONSULTING
A L ITTLE AB OUT ME
4
PhD in Industr ial- Organizational Psychology from the Univers ity of Nebraska at Omaha.
Ten years of internal and external consulting experience in corporate, non- profit, and education sectors .
Currently serving as Co- Founder & Pr incipal Consultant at Category One Consulting.
SAR A R OB E R TS

C AT E G OR Y ON E CONSULTING 5
A L ITTLE AB OUT C1CWe help organizations make the r ight decis ions and investments regarding…
Their PeopleWe optimize the most important asset across the entire employee lifecycle.
• Talent analytics• J ob analys is and job descr iptions• Candidate experience• Selection protocols• New hire onboarding• Performance measurement• Training and development• HiPo identification and promotion• Leadership development• E mployee surveys (culture, exit)• Change management • E mployee value proposition• R etention programs
Their ProgramsWe maximize investments by designing and evaluating programs.
• Needs assessment and gap analys is• KPI identification• R esearch and best practice review• Focus group• Observations and interviews• Customer satis faction surveys• Net promoter score• Data analys is / advanced analytics• R eports and scorecards• Data stor ies with data visualization• E valuation / Validation / R OI studies• Meeting facilitation• Strategic plan development

C AT E G OR Y ON E CONSULTING
A FE W QUE STIONS FOR YOUPlease answer each question using “ fist to five”
6
1How important do you think it is to use storytelling and data visualization when communicating analytic ins ights?Fist = not at all important; Five = extremely important
2How often do you or your team use storytell ing and data visualization when communicating analytic insights?Fist = never; Five = always
3How difficult is it to use storytell ing and data visualization when communicating analytic insights? Fist = extremely difficult; Five = not at all difficult (super easy actually)

01 Analytics Hits HR
02 C1C’s Talent Analytics Model
03 Implementing Analytics
TALE NT ANALYTICS OVE R VIE W
04 Analytics Across the L ifecycle

C AT E G OR Y ON E CONSULTING
ANALYTICS HITS HROver the past few year s , a large focus on talent analytics has emerged…finally!
8

C AT E G OR Y ON E CONSULTING
FUTUREPAST
SUR
FAC
E
C1C’S TALE NT ANALYTICS MODE LThere are four main types of analytics
9
PAST FUTURE
SUR
FAC
ED
EEP
DESCRIPTIVE
What happened?
PREDICTIVE
What will happen?
DIAGNOSTIC
Why did it happen?
PRESCRIPTIVE
What should I do?
TALENT ANALYTICS refers to the extensive use of data, statistical analys is , and evidence- based management intended to drive talent decis ions to improve practices in order to achieve bus iness results

C AT E G OR Y ON E CONSULTING
IMPLE ME NTING ANALYTICSA step by step guide for implementing talent analytics in your organization
Identify a business relevant question or problem – don’t start with data, metr ics , processes , or technologies .1
Determine which type of analytics is most optimal for the question you are asking – no type is superior in all s ituations. 2
Create a list of the data elements you will need to answer your question, then acquire them from archival databases or new sources .3
Conduct your analyses , interpret your findings, and develop deliverables to share ins ights and recommended actions with stakeholders .4
Do something with your findings, and evaluate or track the impact –compute R OI if possible.5
10

C AT E G OR Y ON E CONSULTING
ANALYTICS ACR OSS THE L IFE CYCLEAlways star t with a question, problem, or decis ion – never a process
11
PE R FOR M
DE VE LOP
E NGAGE
ATTR ACT SE LE CT SE PAR ATEONB OAR D
How many qualified
applicants applied for job XYZ?
Which applicant is most l ikely to be a high per for mer if
selected?
Which onboarding technique should
we implement?
Why are some employees
disengaged?
Which PMP should we implement to
maximize per for mance?
What percentage of employees are
high potential?
Why do employees
voluntar ily leave?

DE LIVE R Y ME CHANISMS
C AT E G OR Y ON E CONSULTING
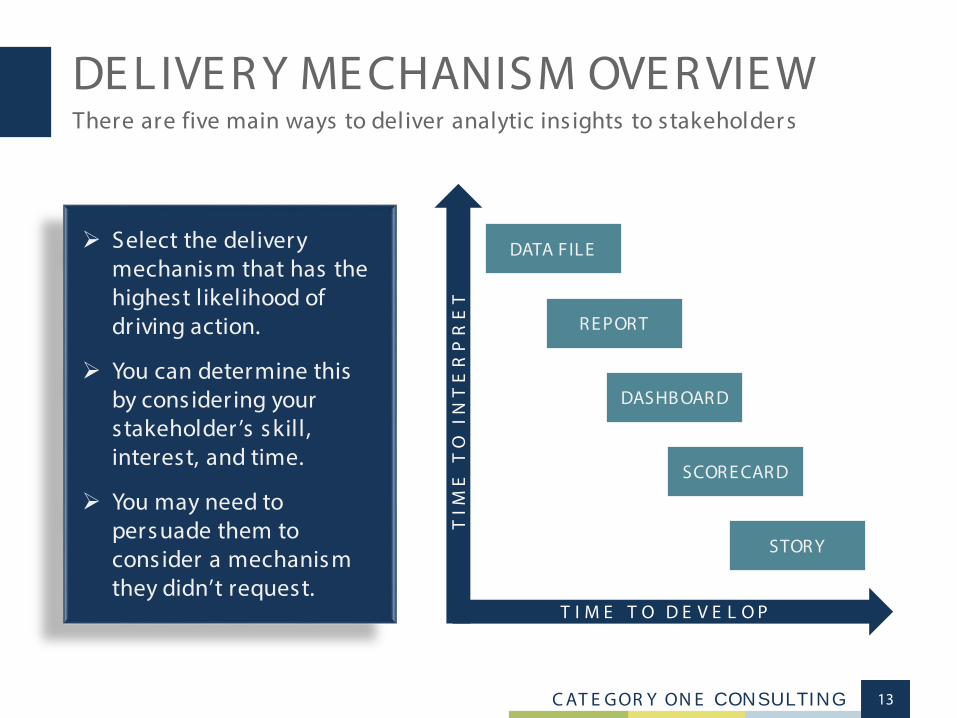
DE LIVE R Y ME CHANISM OVE R VIE WThere are five main ways to deliver analytic ins ights to stakeholder s
13
T I M E T O D E V E L O P
TIM
E T
O I
NT
ER
PR
ET
DATA FILE Select the delivery mechanism that has the highest likelihood of dr iving action.
You can determine this by cons idering your stakeholder ’s skill, interest, and time.
You may need to persuade them to cons ider a mechanism they didn’t request.
R E POR T
STOR Y
SCOR E CAR D
DASHB OAR D

C AT E G OR Y ON E CONSULTING
DATA FILE
14
E lectronic file containing raw (i.e., not process ed for meaningful us e) data.
Typically developed or s hared via E xcel, Access , SQL, or other databas e s ystem.
B est us ed when your stakeholder has data analys is capabilities and interest.
E xample – The actuary from benefits requests a file containing employees’ 401k elections and job character istics .

C AT E G OR Y ON E CONSULTING
R E POR T
15
Document containing data that has been organized into informational s ummaries .
Can be s ystem- generated or created manually; often developed on a recurr ing bas is and distr ibuted via Word, PDF, etc.
B est us ed when your stakeholders need lis ts or des cr iptive stats on a recurr ing bas is – s houldn’t require further analys is .
E xample – Labor R elations requests a monthly update on s afety incidents including who, what, when, and where.

C AT E G OR Y ON E CONSULTING
DASHB OAR D
16
Tool that dis plays metr ics in a graphical and tabular format, typically on a s ingle web page and connected to a s ystem.
Features often include s elf- s ervice access , real- time data, and interactivity (i.e., s lice, dice, s ort, filter , dr ill- down).
B est us ed when your stakeholder is able to determine a question, understand metr ics , navigate a das hboard, interpret res ults , and take action without additional s upport.
E xample – An analytic- s avvy HR PB wants to understand what is going on with the talent in his /her bus iness .

C AT E G OR Y ON E CONSULTING
SCOR E CAR D
17
Document us ed to track progress toward goals ; typically includes a limited number of KPIs and s pecific targets .
Often generated on a pre- s pecified referr ing bas is (e.g., quarter ly) within a s ystem or manually.
B est us ed when your stakeholder has a strategic plan, KPIs , and targets that they want to track progress towards .
E xample – The Finance Department created a strategic talent plan and wants to track progress related to 4 core KPIs (headcount cost, s pans /layers , quality of hire, turnover).

C AT E G OR Y ON E CONSULTING
STOR Y
18
Document providing a holistic overview of an analytic initiative (culture audit, engagement s urvey, retention study, etc.).
Typically includes an executive s ummary, purpos e/question, res earch methods , res ults , and recommended actions .
B est us ed when your stakeholder has a question or problem, but would need additional s upport in understanding the findings and taking action.
E xample – You need to deliver s urvey res ults (res pons e rate, s cores , action areas ) to every bus iness group in the company.

01 A Few Definitions
02 Storytelling Stages
03 Storytelling Checklist
STOR YTE LLING & DATA VISUALIZATION
04 Data Viz E xamples

C AT E G OR Y ON E CONSULTING
A FE W DE FINITIONSDefining ter ms is also cr itical when telling your stor y with data
20
Trans lating res earch and numbers into words or
images in order to pres ent and communicate
infor mation in a cohes ive and compelling manner.
Any effor t to help people understand the
s ignificance of data by placing it in a vis ual
context (i.e., pictor ial or graphical for mat).
STOR YTE LLING DATA VISUALIZATION

C AT E G OR Y ON E CONSULTING
STOR YTE LLING STAGE SA step by step guide for developing your stor y with data
21
1 6Identify your audience. Who are they, why are they interested in the info, what will they do with it, what is their skil l level, etc.
Storyboard your findings. Use sticky notes or a white board to sketch your story. Doing this in pairs is helpful.
2 7Select your delivery mechanism. Think about your answers to #1 and determine the best way to deliver info to them.
Visualize. Determine the optimal data visualizations for each of your findings. Google and Pinterest can help here.
3 8Create an analysis plan. Outline your research questions, data elements, and analyses. This helps you stay focused.
Transfer . Transfer your story to a publishing tool (Word, PPT, Prezi, etc.). Breaks and headers help with flow.
4 9Analyze and document. Run analyses and document your output. Excel is great for this; use one tab per question.
Complete the checklist. Once you have a first draft, verify that you have covered everything in C1C’s checklist.
5 10Conduct the “ think, feel, do” exercise. Identify what you want your audience to think, feel, and do with the results.
Conduct a test run. Deliver your story to people similar to your audience; implement a peer review process.

C AT E G OR Y ON E CONSULTING 22
STOR YTE LLING CHE CK LISTA few s imple checkpoints to ensure your deliver ables dr ive action
22
You can download C1C’s Stor ytelling Checklist at
www.categor y1consulting.com.
Use the checklist before conducting your test r un, or
have your test audience measure you against it dur ing
the test r un.

C AT E G OR Y ON E CONSULTING
Drivers analys es to determine which actions will lead to the greatest impact
Theming and wordles to draw important ins ights from qualitative data
Group or location difference analys es to determine on whom you need to focus
Differences across categories and over time s o you know where to focus
23
DATA VIZ E XAMPLE SUtilize visualization to move from data ins ight action

ONE LAST QUE STION…
How difficult is it to use storytelling and data visualization when communicating
analytic ins ights?
Fist = extremely difficult; Five = not at all difficult (super easy actually)
