from bismarck to beveridge: the other pension reform in spain...from bismarck to beveridge: the...
TRANSCRIPT
FROM BISMARCK TO BEVERIDGE: THE OTHER PENSION REFORM IN SPAIN
J. Ignacio Conde-Ruiz and Clara I. González
Documentos de Trabajo N.º 1417
2014

FROM BISMARCK TO BEVERIDGE: THE OTHER PENSION REFORM IN SPAIN
(*) The research on which this article is based was given Second Prize in the FIPROS 2011 awards (TIN/731/2011). The authors thank Vincenzo Galasso, Juan Francisco Jimeno, José Manuel Marqués, an anonymous referee and participants during the seminar at the Banco de España for helpful comments and discussions. They also appreciate the support provided by the Ministry of Science and Technology throughout the project with Ref. ECO 2011-30323-c03-01. The results and views expressed in this document are the sole responsibility of the authors and do not necessarily reflect those of their institutions of affiliation, the Banco the España and the Eurosystem.(**) J. Ignacio Conde-Ruiz. Universidad Complutense de Madrid and Fundación de Estudios de Economía Aplicada (FEDEA), c/ Jorge Juan, 46, 28001 Madrid (España), e-mail: [email protected].(***) Clara Isabel González. Banco de España and FEDEA. e-mail: [email protected].
Documentos de Trabajo. N.º 1417
2014
J. Ignacio Conde-Ruiz (**)
UNIVERSIDAD COMPLUTENSE DE MADRID AND FEDEA
Clara I. González (***)
BANCO DE ESPAÑA AND FEDEA
FROM BISMARCK TO BEVERIDGE: THE OTHER PENSION
REFORM IN SPAIN (*)

The Working Paper Series seeks to disseminate original research in economics and fi nance. All papers have been anonymously refereed. By publishing these papers, the Banco de España aims to contribute to economic analysis and, in particular, to knowledge of the Spanish economy and its international environment.
The opinions and analyses in the Working Paper Series are the responsibility of the authors and, therefore, do not necessarily coincide with those of the Banco de España or the Eurosystem.
The Banco de España disseminates its main reports and most of its publications via the Internet at the following website: http://www.bde.es.
Reproduction for educational and non-commercial purposes is permitted provided that the source is acknowledged.
© BANCO DE ESPAÑA, Madrid, 2014
ISSN: 1579-8666 (on line)
Abstract
Aging is an unstoppable process and it remains a major challenge for the sustainability of
the PAYG pension system in most developed countries, including in Spain. Many countries
need to introduce reforms of their pension systems in order to control their expenditure,
and in some cases this has already begun. However, there are other sorts of changes to
certain parameters that are perceived as secondary, e.g. the different path of minimum and
maximum pensions, and the upper and lower caps on contributions. This has signifi cant
implications for the distributive structure of the social security system that cannot be readily
perceived by the population. That is why some economists in Spain refer to it as the “Silent
Reform”. The aim of this paper is to analyse the consequences this type of reform would
have in Spain; indeed, it is the fi rst paper to actually quantify and evaluate the potential
impact it would have on the country. We have used an accounting model with heterogeneous
agents and overlapping generations in order to project pension expenditures up until 2070.
The results show that this kind of reform could potentially contain future expenditure and
could also change the nature of the pension system from a contributory or Bismarckian-type
system into an assistential or Beveridgean-type one. This change could have signifi cant
consequences as both systems have different objectives. The paper also shows that the
institutional characteristics that make this kind of reform in Spain feasible are also present in
most developed countries with Bismarckian pension systems. Therefore, we believe that the
lessons learned in this paper on this kind of reform could well prove useful to other countries.
Keywords: aging population, pension reform, Beveridgean type, Bismarckian type, accounting
projection model, overlapping generations.
JEL classifi cation: H55, J11, J26.
Resumen
El envejecimiento de la población es un proceso imparable que continúa suponiendo un
reto para la sostenibilidad del sistema de reparto de pensiones en la mayoría de los países
desarrollados, incluida España. Gran parte de estos países necesitan llevar a cabo reformas
en sus sistemas de pensiones para controlar su gasto y, en algunos casos, ya han empezado.
Sin embargo, existen otros mecanismos que suponen cambios en parámetros del sistema,
que al ser percibidos como secundarios por los ciudadanos no son apreciados como tal
reforma. Este es el caso de modifi caciones en los topes de las pensiones y de las bases de
cotización y que en España se ha denominado, por parte de los expertos en pensiones, como
la «Reforma silenciosa». El objetivo de este documento es analizar las implicaciones que este
tipo de reforma tendría en el caso de España, siendo el primer trabajo que cuantifi ca y evalúa
su potencial impacto en dicho país. Con este fi n se ha empleado un modelo de proyección
contable, con generaciones solapadas y agentes heterogéneos, de gastos del sistema
de pensiones español hasta el año 2070. Los resultados obtenidos muestran que este
tipo de reforma no solo tendría potencial para contener el gasto futuro, sino que también
podría suponer un cambio en la naturaleza del sistema al ser capaz de convertir un sistema
contributivo (o Bismarckiano) en otro de tipo asistencial (o Beveridge). Esto último podría
tener importantes consecuencias, pues ambos sistemas persiguen objetivos distintos. En
el documento también se pone de relieve que las características institucionales que hacen
posible este tipo de reforma en España existen al mismo tiempo en la mayoría de los países
desarrollados con sistemas de pensiones tipo Bismarckiano. Y por lo tanto, creemos que
las lecciones aprendidas en este documento para el caso español podrían ser de utilidad
para otros países.
Palabras clave: envejecimiento, reforma de pensiones, sistema tipo Beveridge, sistema
Bismarkiano, modelo de proyección contable, generaciones solapadas.
Códigos JEL: H55, J11, J26.
BANCO DE ESPAÑA 7 DOCUMENTO DE TRABAJO N.º 1417
1 Introduction
There is no doubt that an aging population threatens the sustainability of Pay-As-You-Go pension
systems, in Spain and in many other countries. In the last decades many countries have undertaken
major reforms and others are now undergoing similar processes. Spain finds itself in this latter case,
and several studies have shown that, in absence of reforms, the pension expenditure will increase in
the next four decades, accelerating from 2035 onwards (Comisión Europea, 2009; MTIN, 2008; Jimeno
et al., 2008; Díaz-Saavedra, 2005; de la Fuente and Doménech, 2009; Rojas, 2005; Sánchez-Martín
and Sánchez-Marcos, 2010; Alonso and Herce, 2003; Herce and Fernández (Dir.), 2009). The reform
approved in Spain in 2011 and the design of the Sustainability Factor in 2013 were the most significant
reforms passed in decades. However, the changes approved in 2011 only solves about one-third of
the existing problem, as highlighted in several studies (see MEH, 2011; Banco de España, 2011;
de la Fuente and Doménech, 2013; Conde-Ruiz and González, 2013). The sustainability factor
will transform the Spanish pension system from a defined-benefit to a define-contribution system.
According with the Ministry of Economy and Competitiveness this reform could imply savings of
more than 4 percentage points of GDP in 2060 (MINECO, 2014). Díaz-Gimenez and Díaz-Saavedra
(2014) obtain that the system will be sustainable until 2037 but through the reduction of the real value
of the average pension of the system, a 20% smaller in 2037. Sánchez-Martín (2014) coincides that
this reform induces a large reduction in pension expenditure but with heavy welfare costs imposed
on some cohorts (eg. young workers at the beginning of the reform).
Throughout this process of change, and due to the fact that it comes at a political cost, there is
the possibility to make changes to the system that cannot be noticed easily by the population. In the
case of Spain, this would be feasible by modifying parameters of the pension system - in particular
the maximum and minimum pensions and the upper and lower limits of contributions bases. This
would result in major changes regarding the redistribution and the overall generosity of the system
which would hardly be perceived by population in the short term. For this very reason some experts
in have named it the “Silent Reform” of the pension system. More specifically, the key measures of
this kind of reform are: (i) increasing pensions in line with inflation instead of wage growth, and (ii)
setting an upper cap for the pension an individual may receive (maximum pension) and indexing it
to inflation. In a period of economic growth, these measures would imply an increase in the number
of retired individuals whose pensions would be limited by the maximum pension cap. For this reason,
any of the two measures could reduce the future pension expenditure because they would decrease
the link between the evolution of pensions with the growth in wages. If the mechanism behind the
“Silent Reform” would be applied during a period of time sufficiently long, workers would notice the
reduction in their pensions, but with a smaller margin of time to adapt their working and saving
decisions.
The aim of this article is to quantify the potential consequences of the called “Silent Reform”, which
has been so widely discussed in theoretical terms in Spain. Up until now there has been no study
that quantifies its implications, and this paper is the first to analyse its hypothetical impact on the
BANCO DE ESPAÑA 8 DOCUMENTO DE TRABAJO N.º 1417
Spanish pension system. We present the effects of the changes to the aforementioned parameters on
the sustainability of the Spanish pension system before the reform approved in 2011. This assumption
will allow us to study the potential of this kind of reform by comparing the results with those
obtained under the reform in 2011. We shall quantify the potential implications of the reform as a
mechanism for controlling future expenditure, as well as its possible distributional effects between
different individuals. If this kind of reform would be implemented in its extreme form, it would
change the basis of the Spanish pension system from a contributory system (or Bismarckian) to an
assistential pension system (or Beveridgean) and would also have implications on the generosity of the
system. In actual fact, this mechanism is already being applied to some degree; in 2013 a contribution
cap growth of 5% and a maximum pension increase of 1% was introduced and for 2014 a contribution
cap growth of 5% with an increase of 0.25% for all pensions including maximum pensions have been
approved.
The risk of this kind of reform is that the population would not be in a position to make
well-informed decisions regarding their savings for retirement because changes to the system would
not be immediately noticeable. As shown in this paper, this kind of reform could have important
consequences for pensioners because the objectives of a Bismarckian pension system are not the same
as in a Beveridgean system. Bismarckian systems are designed to provide a sufficient pension for all
workers: from the low skilled to the highly skilled. In contrast, the Beveridgean pension system aims
to ensure a minimum pension but therefore also requires lower contributions, leaving room for the
middle classes to add to their pension with private savings. Indeed, countries with a Beveridgean
system have an average pension expenditure of 6% of GDP, while countries with a Bismarckian
pension system have an average expenditure of more than 10%. In contrast, the reverse is true
regarding private pensions.
It is interesting to examine the case of Spain because it is a country with a Bismarckian pension
system and it is where maximum contribution base and maximum pension increase at a different
pace. Moreover, the two institutional elements that are key in this sort of reform, i.e. the upper and
lower pension and contribution base caps, are found in most industrialised countries with Bismarckian
pension systems. This means that the implications and lessons learned regarding the “Silent Reform”
in Spain could well be useful to other countries that have maximum caps.
This paper is set up as follows: section 2 presents the role of limits (the upper and lower) in
contribution bases and pensions, the institutional aspects of the case of the Spanish pension system,
and their existence in other countries. The methodology used in conducting our simulations is
presented in section 3.1. Next, the results related to individual pensions are collected in section 3.2,
regarding the percentage of new pensions that are affected by both the upper cap and the amount
to which the pension is limited. The implications regarding the sustainability of the pension system
are shown in section 3.3. In section 3.4 the consequences for the nature of the system are examined.
Finally, we draw our conclusions, and in the appendix we present some of the results and the rules
for calculating the retirement pension in Spain in more detail.

BANCO DE ESPAÑA 9 DOCUMENTO DE TRABAJO N.º 1417
2 From Bismarck to Beveridge
2.1 The mechanism of the named “Silent Reform”
The Spanish social security system is a PAYG system, and is defined as one in which a retired worker
receives a pension that is dependent on his work history (wages, years of contribution to the system
and retirement age). However, the Sustainability Factor approved by law1 in 2013 introduced two
new elements: i) a sustainability factor that will take into account the increase in life expectancy at
67 years old in the calculation of the initial retirement pension (it will come into force in 2019), and
ii) a new index pension revaluation which replaces updating pensions according to the CPI. Pensions,
including minimum pensions, will be increased annually by this percentage (with a floor of 0.25% and
a cap of CPI growth plus 0.5%) that will be set by the Budget Law each year (it entered into force in
January 2014). On the other hand, maximum and minimum limits have been set historically by law
for contributions and pensions, both of which play an important role in the current Spanish pension
system.
The pension system in Spain seemed not to have undergone any major reforms since the late
1980s until the reform that was approved in 2011 in which, amongst other changes the retirement age
was delayed to 67, and the introduction of the Sustainability Factor designed in year 2013. However,
in actual fact there had been changes made to key parts of the framework of the Spanish system.
Despite the outward appearance of no significant reforms up until 2011, the slight modification of
some parameters of the system has led some economists to propose the idea that a pension reform was
taking place in Spain but its causes were not immediately noticeable. These economists are, amongst
others, Boldrin et al. (2000); Jimeno (2002); Alonso and Herce (2003); Conde-Ruiz and Alonso (2004);
Conde-Ruiz and Jimeno (2004). According to these authors, the Spanish social security system
is undergoing changes caused by the evolution of some of the system’s key parameters, including
maximum and minimum limits on pensions and contributions. The effect of these criteria has not
had much attention in the media or in political arenas because they have been regarded as secondary
factors to the financial sustainability of the pension system. However, changes to these parameters
generate significant modifications in the distributive structure of the social security system. To change
the redistribution and the generosity of the system will inevitably have an important impact on both
the financial sustainability and the policy of pensions. For this reason it has been called a “Silent
Reform”, because it substantially affects the nature of the social security system without reforming
any of the criteria that are considered to be most important ones, such as the contribution rate,
retirement age, contribution bases, pension formula, etc.
The pension policy over the last fifteen years, as discussed in more detail in section 2.2, shows two
clear trends: i) Minimum pensions have increased in real terms, while the maximum pensions have
1Law 23/2013 of 23 December, Reguladora del Factor de Sostenibilidad y del Índice de Revalorización del Sistemade Pensiones de la Seguridad Social.
BANCO DE ESPAÑA 10 DOCUMENTO DE TRABAJO N.º 1417
been adjusted with inflation - maintaining their value in real terms but reducing their purchasing
power in relation to the average wage and ii) Minimum contribution bases have been reduced in real
terms, while the upper limit of contributions has remained about constant in real terms.
Despite the fact that the general population would not notice the impact of this kind of reform,
the consequences would be quite evident. Let us take a scenario where there is a positive growth rate
in productivity and where all the pensions (including the maximum pension) are adjusted in line with
inflation. If wages (and all contribution bases) grow continuously at the rate of productivity but the
maximum pension threshold is not adjusted in line with wages, it is clear that the replacement rate
(ratio pension / average wage) will decrease for individuals entitled to the maximum pension - and
so shall the ratio (average pension / average productivity) of the system as a whole. In other words,
in an environment of wage growth, individual benefit increases (gradually if it is indexed to inflation)
while the maximum statutory pension remains constant. Therefore, after a certain amount of time
the pensions of a large number of individuals will reach the upper cap and will therefore stop rising at
the same rate as wages. This means that the number of people receiving the maximum pension will
increase over time. And as the upper limit is not adjusted in line with wages there will be a decrease
in the ratio between the average pension and average productivity. If this mechanism were taken to its
extreme, in an environment where wages (hence contributions) and pensions are steadily increasing
for everyone, all workers would have access to the same maximum pension allowance. Nowadays the
number of individuals who retire with a maximum pension is around 3%. However, if we assume
that real wages (and therefore contributions) grow at the same rate that productivity increases, the
distribution of wages would shift to the right so that the number of individuals entitled to receive the
maximum pension would also increase, although the amount of the pension would remain constant
in real terms.
This is a very interesting result because it implies that this sort of reform would transform the
system from a contributory or Bismarckian system (such as the current Spanish system where pensions
depend on past contributions), into an assistential system or Beveridgean system, where all individuals
receive the same pension regardless of their contributions. This would mean that the very nature of
the pension system would change unnoticed. This critical aspect will be discussed in detail in section
3.4. The increasing gap between limits will also affect sustainability, although more individuals
would receive the maximum pension the generosity of the system would decrease in time because the
maximum pension would remain constant in real terms. This means that not only would the nature
of the system change, but it would also have important effects on containing pension expenditure, as
we will see in the next section.
BANCO DE ESPAÑA 11 DOCUMENTO DE TRABAJO N.º 1417
2.2 Institutional elements
In the current Spanish pension system contributions and pensions have established maximum and
minimum amounts, which play an important role. These variables are set each year by the
Government as part of the State Budget. The impact of changes in these variables has gone unnoticed
over the years, but does generate significant shifts in the distributive structure of social security
system.
Employers and employees contribute a percentage of worker’s pay to the social security system2.
Contributions are limited by both a floor bmin and a ceiling bmax that are set each year by the
Government. The contribution base represents the fraction of labor earnings subject to social security
contributions and it is linked to wage ω:
bt =
⎧⎪⎨⎪⎩
bmin for ωt < bmin
ωt for bmin ≤ ωt ≤ bmax
bmax for ω > bmax
(1)
At the same time, the Spanish social security system is characterised by a minimum (i.e. pmin)
and a maximum pension (i.e. pmax) that limit the contributory retirement pensions. The minimum
pension is intended for those individuals who are eligible to receive a contributory pension but whose
contributions are below a certain threshold. The maximum pension limits the amount that individuals
with higher pensions would receive. The contributory pension that an individual receives can be
expressed as:
P =
⎧⎪⎨⎪⎩
pmin for p < pmin
p for pmin ≤ p ≤ pmax
pmax for p ≥ pmax
(2)
These two elements have evolved differently over time. The amount of the minimum pension
has historically increased in real terms (with significant increases in the years before the start of the
crisis). The maximum pension has remained fairly constant in real terms in the past two decades
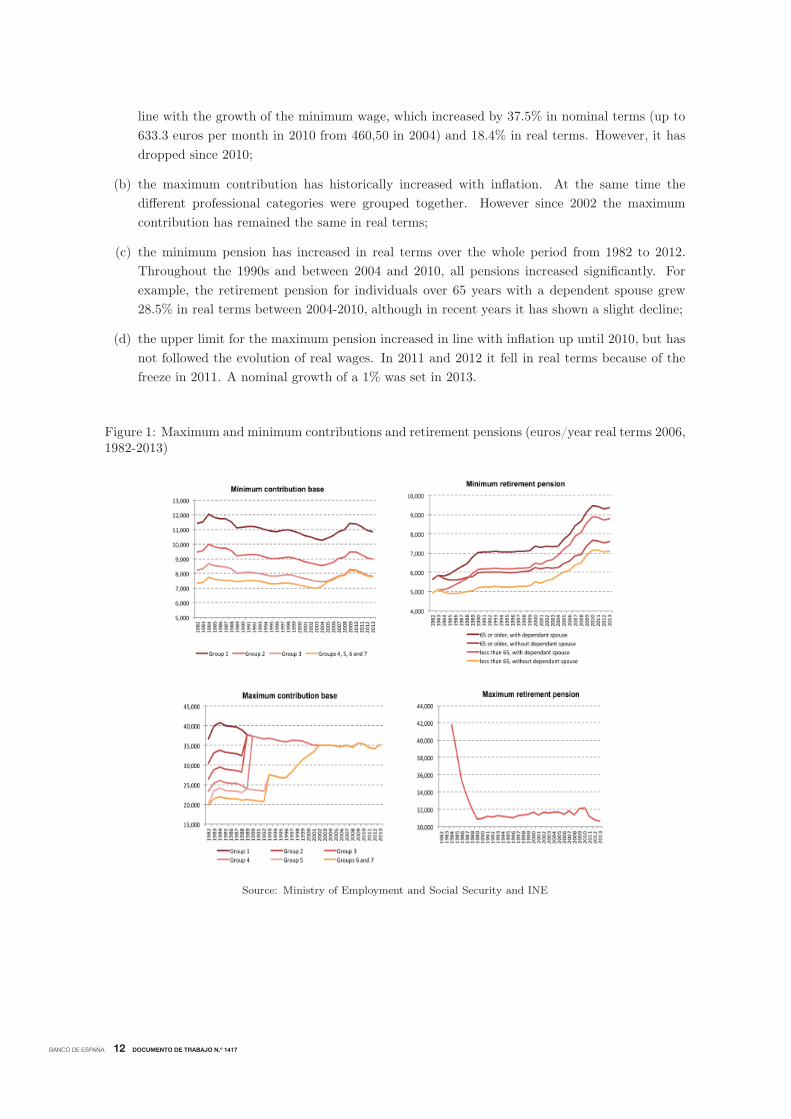
due to its rising in line with inflation. Figure 1 shows the evolution of the upper and lower limits for
both pensions and contributions since 1982, and the following points are relevant for the simulations
carried out in this article:
(a) the minimum contribution declined slightly during the 1990’s, and since 2004 it increased by
more than inflation (12.8% between 2004 and 2010). This is because its increase had been in
2The statutory contribution rate for common contingencies is 28.3%, of which a 4.7% is paid by the worker and a23.6% by the company.
BANCO DE ESPAÑA 12 DOCUMENTO DE TRABAJO N.º 1417
line with the growth of the minimum wage, which increased by 37.5% in nominal terms (up to
633.3 euros per month in 2010 from 460,50 in 2004) and 18.4% in real terms. However, it has
dropped since 2010;
(b) the maximum contribution has historically increased with inflation. At the same time the
different professional categories were grouped together. However since 2002 the maximum
contribution has remained the same in real terms;
(c) the minimum pension has increased in real terms over the whole period from 1982 to 2012.
Throughout the 1990s and between 2004 and 2010, all pensions increased significantly. For
example, the retirement pension for individuals over 65 years with a dependent spouse grew
28.5% in real terms between 2004-2010, although in recent years it has shown a slight decline;
(d) the upper limit for the maximum pension increased in line with inflation up until 2010, but has
not followed the evolution of real wages. In 2011 and 2012 it fell in real terms because of the
freeze in 2011. A nominal growth of a 1% was set in 2013.
Figure 1: Maximum and minimum contributions and retirement pensions (euros/year real terms 2006,1982-2013)
Source: Ministry of Employment and Social Security and INE
BANCO DE ESPAÑA 13 DOCUMENTO DE TRABAJO N.º 1417
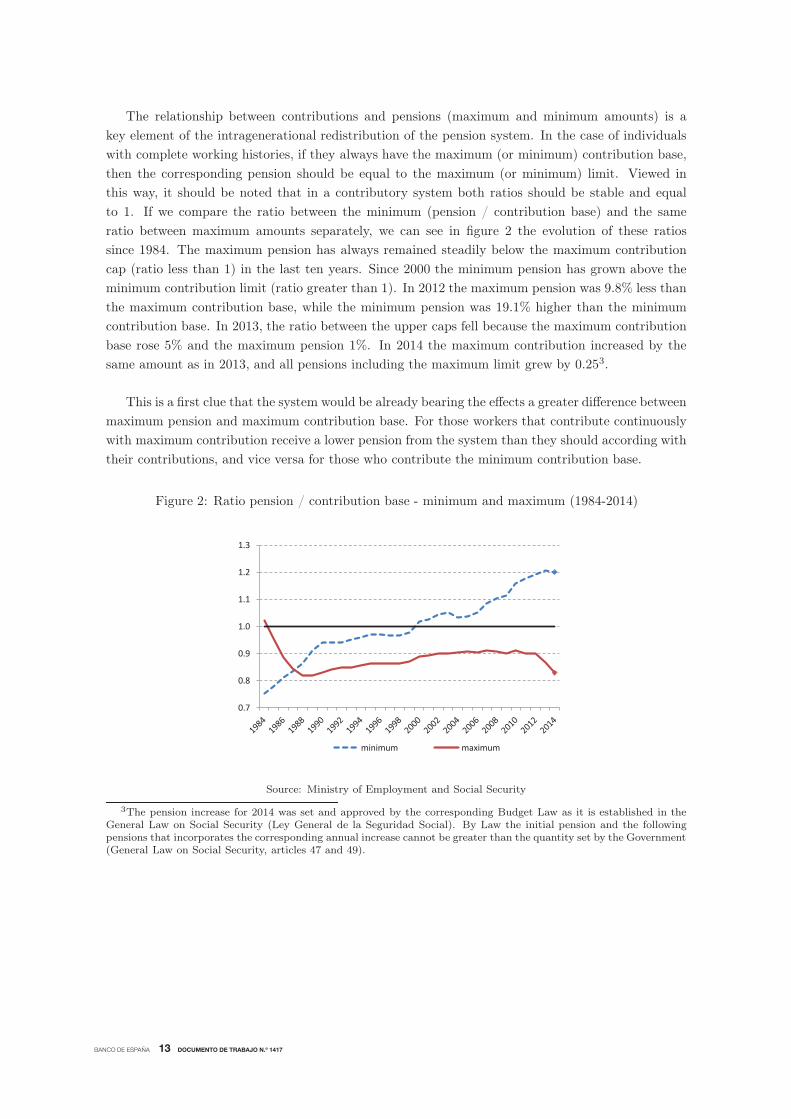
The relationship between contributions and pensions (maximum and minimum amounts) is a
key element of the intragenerational redistribution of the pension system. In the case of individuals
with complete working histories, if they always have the maximum (or minimum) contribution base,
then the corresponding pension should be equal to the maximum (or minimum) limit. Viewed in
this way, it should be noted that in a contributory system both ratios should be stable and equal
to 1. If we compare the ratio between the minimum (pension / contribution base) and the same
ratio between maximum amounts separately, we can see in figure 2 the evolution of these ratios
since 1984. The maximum pension has always remained steadily below the maximum contribution
cap (ratio less than 1) in the last ten years. Since 2000 the minimum pension has grown above the
minimum contribution limit (ratio greater than 1). In 2012 the maximum pension was 9.8% less than
the maximum contribution base, while the minimum pension was 19.1% higher than the minimum
contribution base. In 2013, the ratio between the upper caps fell because the maximum contribution
base rose 5% and the maximum pension 1%. In 2014 the maximum contribution increased by the
same amount as in 2013, and all pensions including the maximum limit grew by 0.253.
This is a first clue that the system would be already bearing the effects a greater difference between
maximum pension and maximum contribution base. For those workers that contribute continuously
with maximum contribution receive a lower pension from the system than they should according with
their contributions, and vice versa for those who contribute the minimum contribution base.
Figure 2: Ratio pension / contribution base - minimum and maximum (1984-2014)
Source: Ministry of Employment and Social Security
3The pension increase for 2014 was set and approved by the corresponding Budget Law as it is established in theGeneral Law on Social Security (Ley General de la Seguridad Social). By Law the initial pension and the followingpensions that incorporates the corresponding annual increase cannot be greater than the quantity set by the Government(General Law on Social Security, articles 47 and 49).
0.7
0.8
0.9
1.0
1.1
1.2
1.3
minimum maximum
BANCO DE ESPAÑA 14 DOCUMENTO DE TRABAJO N.º 1417
As we have explained above, the relationship between the lower and upper limit of both pensions
and contribution bases is one of the key factors in determining the future evolution of the Spanish
pension system.
2.3 Beveridge, Bismarck and caps in an International context
When worldwide PAYG pension systems are examined, we can see that different degrees of
intragenerational redistribution exist. So, in addition to its characteristic intergenerational
redistribution there is the redistribution from qualified to less qualified workers. No completely pure
Bismarckian systems actually exist. For example, the Spanish pension system is a contributory or
Bismarckian system and has a certain degree of intragenerational redistribution through its minimum
pensions. However, there are a number of papers, such as Disney (2004) or Conde-Ruiz and Profeta
(2007) that have classified different pension systems in the world in any of these types, Bismarckian
or Beveridgean. In the previous section we saw that through the application of different growth rates
to the both maximum contribution base and pension it is possible to change the nature of a system
from contributory, or Bismarckian type, to an assistential, or Beveridgean type. In this section we
are going to assess whether the two key elements that would enable such reform in Spain are also
present in other pension systems, i.e. the existence of a maximum yearly pension and the existence
of maximum yearly earnings. The analysis is purely descriptive and does not aim to show that
the mechanism described above is being applied in other countries with similar characteristics. The
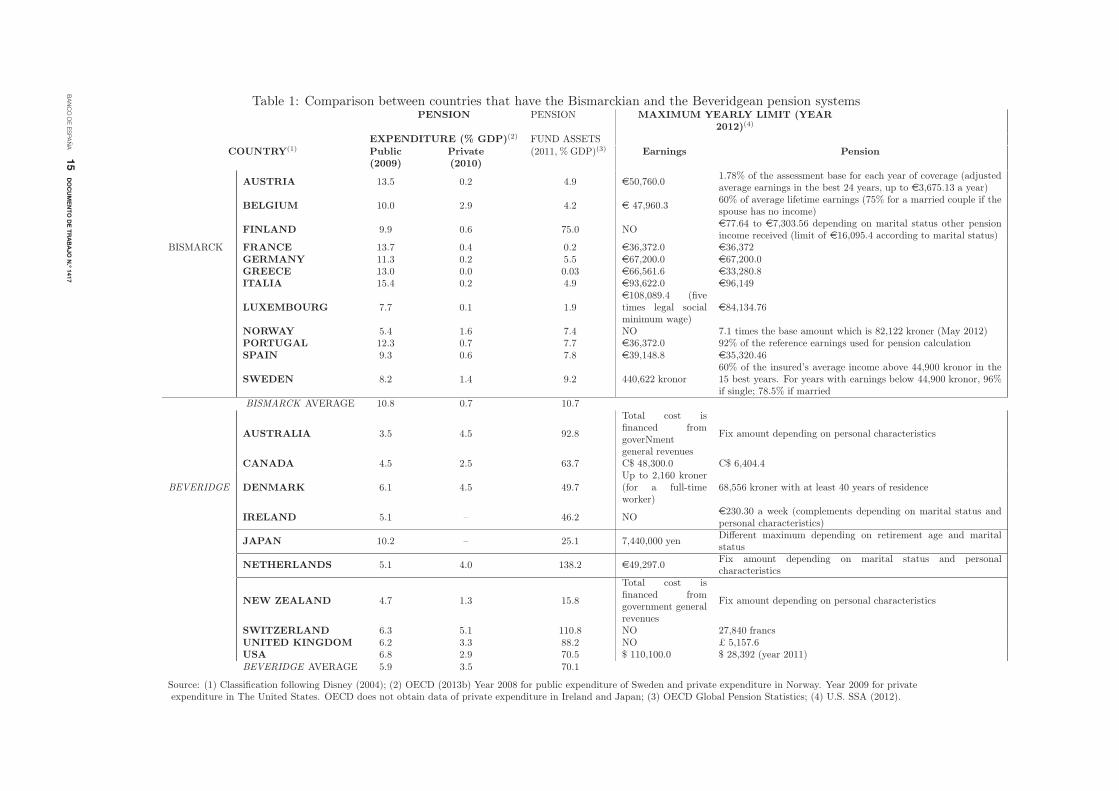
following table 1 contains the main institutional characteristics of most developed countries.
All countries showed in table 1 that have the Bismarckian system (BI), with the exception of
Finland and Norway, have a maximum cap in contributions to social security. Interestingly, most
countries that have the Beveridgean system (BE) do not have a maximum limit for contributions
or else are funded through general taxation. Furthermore, all countries have an upper limit for the
maximum pension.
The focus of this analysis is not which system is the best for the welfare of retirees. However,
we do want to highlight that both systems fulfil different goals. As shown by Disney (2004) and
Conde-Ruiz and Profeta (2007), each system has specific and differing characteristics. In particular,
the Beveridgean system is associated with lower pension expenditures in terms of GDP compared to
the Bismarckian systems. On the other hand, countries with the Beveridgean system tend to have
more developed private pension systems and more widespread the use of private pension plans. These
differences, as highlighted in Conde-Ruiz and Profeta (2007), were present at the very origin of both
systems.
BA
NC
O D
E E
SP
AÑ
A15
DO
CU
ME
NT
O D
E T
RA
BA
JO
N.º 1
417
Table 1: Comparison between countries that have the Bismarckian and the Beveridgean pension systemsPENSION PENSION MAXIMUM YEARLY LIMIT (YEAR
2012)(4)
EXPENDITURE (% GDP)(2) FUND ASSETS
COUNTRY(1) Public Private (2011, % GDP)(3) Earnings Pension(2009) (2010)
BISMARCK
AUSTRIA 13.5 0.2 4.9 e50,760.01.78% of the assessment base for each year of coverage (adjustedaverage earnings in the best 24 years, up to e3,675.13 a year)
BELGIUM 10.0 2.9 4.2 e 47,960.360% of average lifetime earnings (75% for a married couple if thespouse has no income)
FINLAND 9.9 0.6 75.0 NOe77.64 to e7,303.56 depending on marital status other pensionincome received (limit of e16,095.4 according to marital status)
FRANCE 13.7 0.4 0.2 e36,372.0 e36,372GERMANY 11.3 0.2 5.5 e67,200.0 e67,200.0GREECE 13.0 0.0 0.03 e66,561.6 e33,280.8ITALIA 15.4 0.2 4.9 e93,622.0 e96,149
LUXEMBOURG 7.7 0.1 1.9e108,089.4 (fivetimes legal socialminimum wage)
e84,134.76
NORWAY 5.4 1.6 7.4 NO 7.1 times the base amount which is 82,122 kroner (May 2012)PORTUGAL 12.3 0.7 7.7 e36,372.0 92% of the reference earnings used for pension calculationSPAIN 9.3 0.6 7.8 e39,148.8 e35,320.46
SWEDEN 8.2 1.4 9.2 440,622 kronor60% of the insured’s average income above 44,900 kronor in the15 best years. For years with earnings below 44,900 kronor, 96%if single; 78.5% if married
BISMARCK AVERAGE 10.8 0.7 10.7
BEVERIDGE
AUSTRALIA 3.5 4.5 92.8
Total cost isfinanced fromgoverNmentgeneral revenues
Fix amount depending on personal characteristics
CANADA 4.5 2.5 63.7 C$ 48,300.0 C$ 6,404.4
DENMARK 6.1 4.5 49.7Up to 2,160 kroner(for a full-timeworker)
68,556 kroner with at least 40 years of residence
IRELAND 5.1 – 46.2 NOe230.30 a week (complements depending on marital status andpersonal characteristics)
JAPAN 10.2 – 25.1 7,440,000 yenDifferent maximum depending on retirement age and maritalstatus
NETHERLANDS 5.1 4.0 138.2 e49,297.0Fix amount depending on marital status and personalcharacteristics
NEW ZEALAND 4.7 1.3 15.8
Total cost isfinanced fromgovernment generalrevenues
Fix amount depending on personal characteristics
SWITZERLAND 6.3 5.1 110.8 NO 27,840 francsUNITED KINGDOM 6.2 3.3 88.2 NO £ 5,157.6USA 6.8 2.9 70.5 $ 110,100.0 $ 28,392 (year 2011)
BEVERIDGE AVERAGE 5.9 3.5 70.1
Source: (1) Classification following Disney (2004); (2) OECD (2013b) Year 2008 for public expenditure of Sweden and private expenditure in Norway. Year 2009 for privateexpenditure in The United States. OECD does not obtain data of private expenditure in Ireland and Japan; (3) OECD Global Pension Statistics; (4) U.S. SSA (2012).
BANCO DE ESPAÑA 16 DOCUMENTO DE TRABAJO N.º 1417
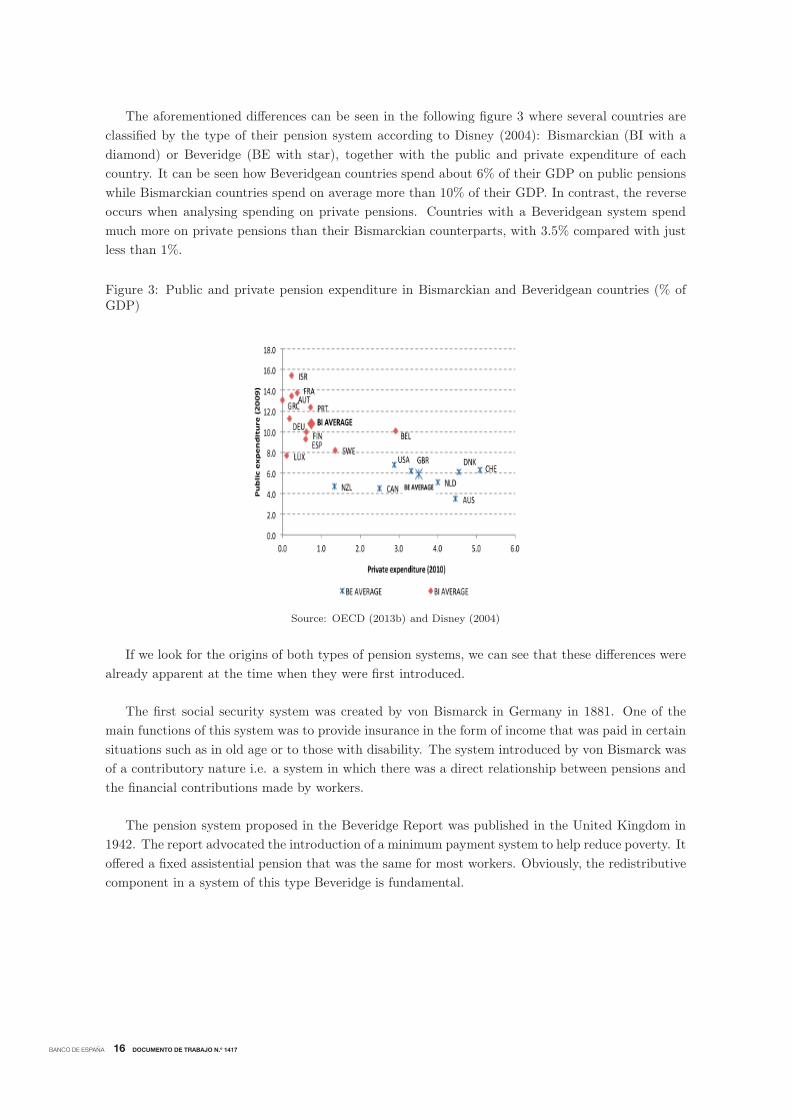
The aforementioned differences can be seen in the following figure 3 where several countries are
classified by the type of their pension system according to Disney (2004): Bismarckian (BI with a
diamond) or Beveridge (BE with star), together with the public and private expenditure of each
country. It can be seen how Beveridgean countries spend about 6% of their GDP on public pensions
while Bismarckian countries spend on average more than 10% of their GDP. In contrast, the reverse
occurs when analysing spending on private pensions. Countries with a Beveridgean system spend
much more on private pensions than their Bismarckian counterparts, with 3.5% compared with just
less than 1%.
Figure 3: Public and private pension expenditure in Bismarckian and Beveridgean countries (% ofGDP)
Source: OECD (2013b) and Disney (2004)
If we look for the origins of both types of pension systems, we can see that these differences were
already apparent at the time when they were first introduced.
The first social security system was created by von Bismarck in Germany in 1881. One of the
main functions of this system was to provide insurance in the form of income that was paid in certain
situations such as in old age or to those with disability. The system introduced by von Bismarck was
of a contributory nature i.e. a system in which there was a direct relationship between pensions and
the financial contributions made by workers.
The pension system proposed in the Beveridge Report was published in the United Kingdom in
1942. The report advocated the introduction of a minimum payment system to help reduce poverty. It
offered a fixed assistential pension that was the same for most workers. Obviously, the redistributive
component in a system of this type Beveridge is fundamental.
BANCO DE ESPAÑA 17 DOCUMENTO DE TRABAJO N.º 1417
As Conde-Ruiz and Profeta (2007) highlighted, the adoption of one of these systems depended
on several factors, including important political factors. Surprisingly the Bismarckian system was
introduced due to the pressure of what we would today call the middle class, together with the
influence of the industrial trade unions. The strength of the middle class contributed decisively to
the movement that culminated in the unification of Germany. The introduction of this contributory
pension system represented a way to combat dissent and to cement the alliance of these social groups
within the Reich, and to effectively oppose to the socialist movement. In 1871 Bismarck wrote “The
only means of stopping the Socialist movement in its present state of confusion is to put into effect
those Socialist demands which seem justified and which can be realised within the framework of the
present order of state and society” (Köhler et al., 1982). As a result, the Reich’s government played
a very important role in the organisation and implementation of all insurance schemes for the middle
classes (retirement, health, accident and disability).
During the same period, the United Kingdom was characterised by a liberal and democratic
tradition. There were no collectivist political movements nor any notions of the state’s responsibility,
and systems of private and voluntary insurance were developed. However, in 1942 the British
economist William Henry Beveridge drawn up the “Beveridge Report” that defined what would
become the British Welfare State after the Second World War. It was introduced by the Labour
Government elected in 1945. This report introduced an alternative model of PAYG social security
that guaranteed a minimum pension equal for all workers in Britain. The Beveridge plan had a clear
purpose: to reduce poverty and raise the income of the poorest to ensure a certain level of subsistence.
It was defined as a “weapon against the poverty of the masses”. At the same time that the minimum
pension was set, the report also highlighted the individualistic part of the plan: state action would
be limited to the redistribution of money in favour of the poor, while wealthier individuals should
privately be able to satisfy their own additional necessities. William Beveridge was convinced that
the contributory or Bismarckian pension system “is damaged to personal saving, while he wanted the
maximum scope for private provision above his minimum” (Hills et al., 1994).
One of the aims of this paper is to show that with the mechanism explained in section 2.1
the nature of a Bismarckian system could change to a Beveridgean system. We do not intend to
show that countries where there are upper caps are necessarily going to implement the referred
“Silent Reform” because for this to occur it would be necessary the adoption of political decisions
in order to strategically establish the evolution of both elements. The key elements to implement
this kind of reform, (such as the upper caps of pensions and contributions) already exist in most
countries with a Bismarckian system. In this section we have not evaluated the advantages and
disadvantages of each system. Instead we have emphasised that a possible change in system type -
from a Bismarckian to a Beveridgean system, without notification to the population in question could
have negative implications on the welfare of workers. This is because, as we have seen, the objectives
and implications of both systems are very different and they were, at time of their creation, designed
to meet different needs.
BANCO DE ESPAÑA 18 DOCUMENTO DE TRABAJO N.º 1417
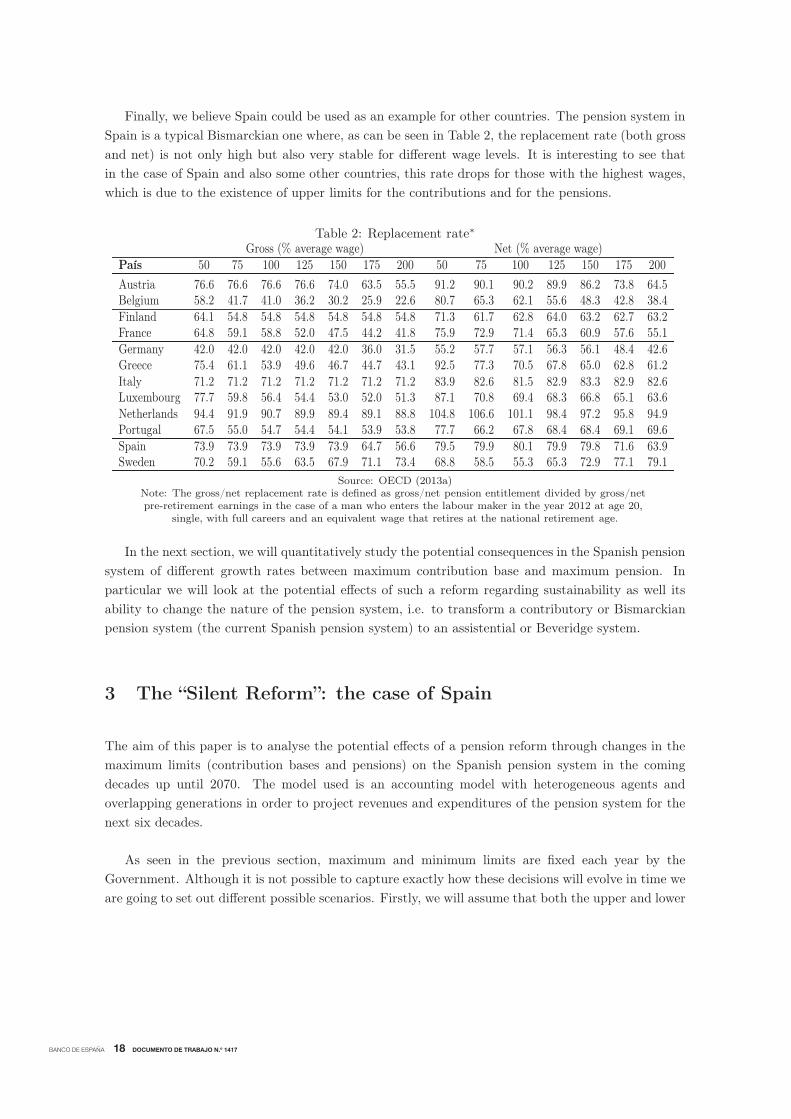
Finally, we believe Spain could be used as an example for other countries. The pension system in
Spain is a typical Bismarckian one where, as can be seen in Table 2, the replacement rate (both gross
and net) is not only high but also very stable for different wage levels. It is interesting to see that
in the case of Spain and also some other countries, this rate drops for those with the highest wages,
which is due to the existence of upper limits for the contributions and for the pensions.
Table 2: Replacement rate∗
Gross (% average wage) Net (% average wage)País 50 75 100 125 150 175 200 50 75 100 125 150 175 200
Austria 76.6 76.6 76.6 76.6 74.0 63.5 55.5 91.2 90.1 90.2 89.9 86.2 73.8 64.5Belgium 58.2 41.7 41.0 36.2 30.2 25.9 22.6 80.7 65.3 62.1 55.6 48.3 42.8 38.4Finland 64.1 54.8 54.8 54.8 54.8 54.8 54.8 71.3 61.7 62.8 64.0 63.2 62.7 63.2France 64.8 59.1 58.8 52.0 47.5 44.2 41.8 75.9 72.9 71.4 65.3 60.9 57.6 55.1Germany 42.0 42.0 42.0 42.0 42.0 36.0 31.5 55.2 57.7 57.1 56.3 56.1 48.4 42.6Greece 75.4 61.1 53.9 49.6 46.7 44.7 43.1 92.5 77.3 70.5 67.8 65.0 62.8 61.2Italy 71.2 71.2 71.2 71.2 71.2 71.2 71.2 83.9 82.6 81.5 82.9 83.3 82.9 82.6Luxembourg 77.7 59.8 56.4 54.4 53.0 52.0 51.3 87.1 70.8 69.4 68.3 66.8 65.1 63.6Netherlands 94.4 91.9 90.7 89.9 89.4 89.1 88.8 104.8 106.6 101.1 98.4 97.2 95.8 94.9Portugal 67.5 55.0 54.7 54.4 54.1 53.9 53.8 77.7 66.2 67.8 68.4 68.4 69.1 69.6Spain 73.9 73.9 73.9 73.9 73.9 64.7 56.6 79.5 79.9 80.1 79.9 79.8 71.6 63.9Sweden 70.2 59.1 55.6 63.5 67.9 71.1 73.4 68.8 58.5 55.3 65.3 72.9 77.1 79.1
Source: OECD (2013a)Note: The gross/net replacement rate is defined as gross/net pension entitlement divided by gross/netpre-retirement earnings in the case of a man who enters the labour maker in the year 2012 at age 20,
single, with full careers and an equivalent wage that retires at the national retirement age.
In the next section, we will quantitatively study the potential consequences in the Spanish pension
system of different growth rates between maximum contribution base and maximum pension. In
particular we will look at the potential effects of such a reform regarding sustainability as well its
ability to change the nature of the pension system, i.e. to transform a contributory or Bismarckian
pension system (the current Spanish pension system) to an assistential or Beveridge system.
3 The “Silent Reform”: the case of Spain
The aim of this paper is to analyse the potential effects of a pension reform through changes in the
maximum limits (contribution bases and pensions) on the Spanish pension system in the coming
decades up until 2070. The model used is an accounting model with heterogeneous agents and
overlapping generations in order to project revenues and expenditures of the pension system for the
next six decades.
As seen in the previous section, maximum and minimum limits are fixed each year by the
Government. Although it is not possible to capture exactly how these decisions will evolve in time we
are going to set out different possible scenarios. Firstly, we will assume that both the upper and lower
BANCO DE ESPAÑA 19 DOCUMENTO DE TRABAJO N.º 1417
caps for contributions and pensions will grow at the same rate as productivity. This scenario will be
called “neutral”, i.e. where the mechanism explained in section 2.1 does not apply. We examine three
alternative scenarios where the growth rate of the maximum pension will be less than productivity
rate. Specifically:
• two “middle scenarios”: the maximum contribution base grows at the same pace as productivity
growth, as in the neutral scenario, but the maximum pension will increase a 0.3 and 0.5 of the
productivity growth respectively.
• an “extreme scenario”: the maximum contribution grows at the same pace as productivity, as
in the neutral scenario, but the maximum pension is not indexed with productivity and it will
remain constant in real terms.
In the next section the methodology used for the projection is described and in section 3.2 we
present the results of the impact on: i) the number of new pensions that are capped and ii) the
quantity in which the new pensions are limited. For the analysis of the impact on individual pensions
we will focus on pensions obtained by employees (or under the General Regime) who retire at legal
age, because it is the most affected group by this sort of reform. We will also discuss their possible
effects on the sustainability of the pension system (section 3.3) prior to the 2011 reform (in this
case we consider also the workers that retire early). This will allow us to analyse the potential of
the “Silent Reform” by comparing the results of 2011 obtained in Conde-Ruiz and González (2013)
with the same model, the same methodology and the same demographic scenario4. Finally, we will
highlight the implications of the system through the analysis of the generosity and the replacement
rate (section 3.4).
3.1 Projection methodology
Our model is an accounting model used for the projection of revenues and expenditures of the Spanish
social security system with overlapping generations and heterogeneous agents. It includes a high
degree of individual distinction (by age, sex, nationality and level of education)5. The simulation
period starts in 2006 and runs over six decades up to 2071.
The simulation strategy is developed in three main phases. Firstly, the population projection based
on the Cohort Component Population Projection Method with the aforementioned heterogeneous
agents are used. Secondly, the reconstruction and projection of employment history is carried
4It is important to point out that it is not appropriated to compare our results with the impact of the Reformapproved in 2013 obtained by other authors (MINECO, 2014; Díaz-Gimenez and Díaz-Saavedra, 2014; Sánchez-Martín,2014) because they use a methodology and demographic scenario different than ours.
5Model developed in González (2013) and used in Gonzalez, Conde- Ruiz and Boldrin (2009) to analyse the impactof the migration phenomena in the Spanish pension system and in Conde-Ruiz and González (2013) to evaluate thepension reform approved in 2011.
BANCO DE ESPAÑA 20 DOCUMENTO DE TRABAJO N.º 1417
out using the data from the Continuous Sample of Working Histories of Social Security (Muestra
Continua de Vidas Laborales, MCVL)6 and micro data from the Labour Force Survey (LFS) and the
corresponding data from the National Statistical Institute of Spain (Instituto Nacional de Estadística
de España, INE) to obtain the transition probabilities for five different working situations (employed,
self-employed, unemployed, disability and another situation of inactivity) according to the different
heterogeneous agents considered. During their working lives, individuals contribute to the system.
Once they retire they perceive their retirement pension to correspond with the terms of their
employment history. We also take into account that they may generate a widow’s pension when
they die. The calculation of the pension expenditure is the third stage of the process of projection.
The model includes a great deal of detail regarding the Spanish pension system which allows us to
differentiate employees contributing to the general system (Régimen General de la Seguridad Social)
and self-employed workers contributing to the special scheme for the self-employed (Régimen Especial
de Trabajadores Autónomos) separately. The total years of contributions, the contribution bases and
the retirement age are elements that determine the calculation of the pension and are all taken into
account.
The developed model is an accounting projection model, with heterogeneous agents and
overlapping generations, in which individuals live for 17 periods. Every period corresponds to five
calendar years. Individuals enter the economy at the age of 15 and live, at most, until the age of 100.
The maximum potential working life of an individual is therefore of 10 periods (from 15 to 64 years),
as 65 is the legal retirement age. The maximum period of potential life in retirement (for individuals
retiring at 65) is 7 periods.
Individuals differ by age and also by gender (male and female), educational attainment (primary
school, secondary school and tertiary education), and by country of origin (natives and immigrants).
We have 12 different groups of individuals, each one of which is subdivided in 17 groups according to
their age.
The projection model contains individual heterogeneity and institutional detail that is a
noteworthy characteristic of this model in comparison with other models used in the projection
of pension expenditure in Spain. Firstly, it can distinguish age, sex, educational level and nationality
(versus other articles as Jimeno, 2003; Díaz-Saavedra, 2005; Sánchez-Martín and Sánchez-Marcos,
2010; Jimeno et al., 2008; Díaz-Giménez and Díaz-Saavedra, 2006; Díaz-Gimenez and Díaz-Saavedra,
2009; Sánchez-Martín, 2001, 2010). Secondly, our model is the first that we know of that considers five
different working situations for any given individual (employed, self-employed, unemployed, disabled
and inactive) versus papers of Jimeno, 2003; Alonso and Herce, 2003; Sánchez-Martín, 2001, 2010;
6The Continuous Sample of Working Histories is a database created by the Spanish Ministry of Labour and SocialAffairs made available for researchers. The database contains records of the working and pension histories of more thanone million individuals representing 4% random sample from the reference population which is all the people who atany time in the corresponding wave had a registered record with the social security system, either because they weremaking contributions or because they were receiving a pension. For more details about this database see SeguridadSocial (2006) and Argimón and González (2006).
BANCO DE ESPAÑA 21 DOCUMENTO DE TRABAJO N.º 1417
Díaz-Saavedra, 2005; Díaz-Giménez and Díaz-Saavedra, 2006; Díaz-Gimenez and Díaz-Saavedra, 2009;
Rojas, 2005; Sánchez-Martín and Sánchez-Marcos, 2010. Moreover, this is one of the models that
uses data from the administrative database called Continuous Sample of Working Histories, together
with Gil et al. (2008); Moral-Arce et al. (2008) and Herce and Fernández (Dir.) (2009), to accurately
predict contributions in accordance with the individual heterogeneity. It also includes institutional
detail that allows us obtain precise data regarding pension amounts, also incorporating widows´
pensions. The model also takes into account another important element in the system such as the
upper and lower cap of the contributions and pensions, key elements that are being examined in
this paper. Other articles that have to some extent taken this into account include Jimeno (2003);
Sánchez-Martín and Sánchez-Marcos (2010); Díaz-Saavedra (2005); Díaz-Giménez and Díaz-Saavedra
(2006); Díaz-Gimenez and Díaz-Saavedra (2009); Moral-Arce et al. (2008).
STAGE 1: Demographic Projection. The first phase of the model consists in the projection of
the population up to 2071. We take the demographic situation of year 2006 as our starting point7.
We adopt the overall demographic hypotheses regarding life expectancy (and corresponding survival
probability) and fertility rates released by the Spanish National Institute of Statistics (INE) in its
long-term projection scenario (see INE, 2005). For the migratory hypothesis we combine its short
term forecasts for the period 2010-2020 and long term forecasts for the period 2021-2051 released in
the year 2010 (see INE, 2010). For the period 2051-2071 we assume a stable evolution of the three
variables from 2051 onwards. The total figures projected by the INE for total number of births and
net migration flows are categorised by gender, age and nationality.
The methodology used for the population projection is the Cohort Component Population
Projection Method, a technique that takes each age group in the population and makes projections
using estimates of mortality, fertility, and migration8. We have taken into account in the model the
level of education of future generations as it constitutes an important factor regarding employability.
We assume that all the new generations will reach the same level of education as the most educated
individuals so far, (i.e. those born in 1975 and with 32 years old in year 2007). The implications of
this assumption mean that the percentage of the labour force with an elementary level of education
would decrease and that the percentage of university graduates would increase ten points by 2060
(see González, 2013).
STAGE 2: Projection of Work History. With the developed model we project both revenue
and expenditure of the social security system. Therefore, we have incorporated the assumptions
about labour force participation, employment and productivity until the year 2051 in line with the
macroeconomic scenario used by Spain’s Ministry of Economy and Finance in its joint exercise with
the European Commission for long term pension expenditure projection (European Commission,
2011). From the year 2051 it is assumed that the forecasts will remain constant until 2071. Our
7We establish the year 2006 as the starting point of our exercise to be consistent with the data of the wave of theMCVL of the same year.
8For further detail regarding the assumptions about survival, fertility and migration in the demographic projectionsee González (2013).
BANCO DE ESPAÑA 22 DOCUMENTO DE TRABAJO N.º 1417
underlying assumption is that the relevant legislation will not change; therefore the contributions will
grow parallel to wages, which in turn will grow at the same rate as labour productivity.
Individuals can be in five possible situations during their working life. Specifically, between 15
and 64 years old, an individual may be working as an employee, be self-employed9. unemployed,
receiving a disability benefit or be in another situation of inactivity10 such as studying. Between 66
and 99 years old, it is assumed that individuals are retired, with or without the right to receive a
pension, according to the rules determined by law.
We have 120 different groups of individuals (12 groups divided by gender, education and
nationality, and 10 by age between 15 and 64 years old) whose contributions to the system and their
pensions upon retirement we simulate. To reconstruct complete working histories first we use real
work histories from when they started working up to year 2006 from MCVL data. Then we simulate a
virtual work history for the following years in order to obtain the complete labour histories spanning
the whole projection period. We take into account individual heterogeneity and different the rules
applicable to the employed and self-employed.
From the micro data from the Labour Force Survey we obtained transition probabilities for the
five possible situations between ages of 15 and 64 years in each time period of the life cycle according
to age, gender, skill and nationality. Then, through a Monte Carlo simulation we estimated the
probability of each of the five work situations conditional on the situation in the previous period.
The estimation process follows a finite Markov chain that is, for the set of individual characteristics,
homogeneous across workers and the corresponding conditional transition probability matrix11.
The transition probabilities obtained are consistent with the situation in the base year and the
expected evolution of the average employment rate over the projection period. Thus, the virtual
future history is obtained by incorporating the macroeconomic assumptions and probability of being
in one of the five labour situations differentiating by age, gender, nationality and educational level in
order to calibrate the corresponding rates of activity, employment and unemployment for each of the
different group of individuals.
Finally, retirement patterns of individuals categorised by gender, educational level and age are
observed through MCVL data. Individuals can retire early (between 61 and 64 years) or at the
ordinary age of 65, differentiating them by gender and level of education. It is important to point
out that we do not model the endogenous behavioral reactions of individuals to the evolution of the
9In Spain there are several contribution schemes organised by sector but it is considered that there will be a fullintegration of regimes in the future in two main groups: one for employed in General Regime (Régimen General,RG) and other for self-employed in Special Scheme for Self-Employed (Régimen Especial de Trabajadores Autónomos,RETA), as recommended by the Toledo Pact Commission and it initiated yet. This distinction enables us to apply thecharacteristics of each scheme regarding retirement, for example in RETA early retirement is no allowed.
10Including the situation of inactivity is relevant because there are differences by gender, educational level andnationality as shown in González (2013). Due to the heterogeneity of the model these features can be incorporated inthe projection.
11See González (2013) for further details.
BANCO DE ESPAÑA 23 DOCUMENTO DE TRABAJO N.º 1417
economic and legal environment, however we gain in the microeconomic precision and data reliability
of our simulations carrying out the computational exercise at the highest disaggregated level.
STAGE 3: Revenues and Expenditures Projection. The model projects the work histories of
the individuals and the average growth rate of contribution bases period by period, divided by age,
gender, skill and nationality. It follows the assumed growth rate of the wages (which corresponds to
the growth rate of productivity from the macroeconomic scenario). Next we obtain the contributions
to the system during each period in the projection. The total revenues are equal to the sum of
contributions of employed, self-employed and unemployed12 (for further details see González, 2013).
Once the work histories of each of the 12 different groups is obtained, we have the key elements
for the calculation for the retirement pension: i) number of years of contribution, ii) wages (i.e. the
contribution base) and iii) retirement age. With these records and by applying the legislation13, the
average pension for each group is calculated. Pension expenditure takes into account pensions at 65
years and early retirement between 61 and 64 years. The total expenditure of the system is the sum
of expenditure on retirement, widow’s pension and disability14.
3.2 Results: Impact on individual pensions
The first noticeable effects of different increases in upper pension and contribution limits would be an
increase in the number of individuals whose pensions would have been capped. That is, in the future
it is expected that new pensions would be higher, not only because wages would be higher due to
their growth in line with productivity, but also because individuals will have better work histories due
to advances in levels of education. This is especially true for women whose increased participation
in the labour market together with the improvement in qualifications leads to higher pensions in the
future. However, the fact that the maximum pension would grow at a lower rate of productivity
would mean that a greater number of pensions would be capped as time passes.
In this section we analyse the consequences of the increase of the gap between the maximum
pension and the maximum contribution base for different groups of individuals. Bearing in mind that
the level of heterogeneity of the model is very high, distinguished by age, sex, educational level and
nationality. The analysis in this section will focus on employed people (General Regime) who retire
at 65.
12Given the configuration of the Spanish system, meanwhile the unemployment benefit is received it generates rightsfor retirement through the contribution.
13See Annex B for more details about the rules of retirement in Spain14See González (2013) for more detail about widow’s and disability pensions.
BANCO DE ESPAÑA 24 DOCUMENTO DE TRABAJO N.º 1417
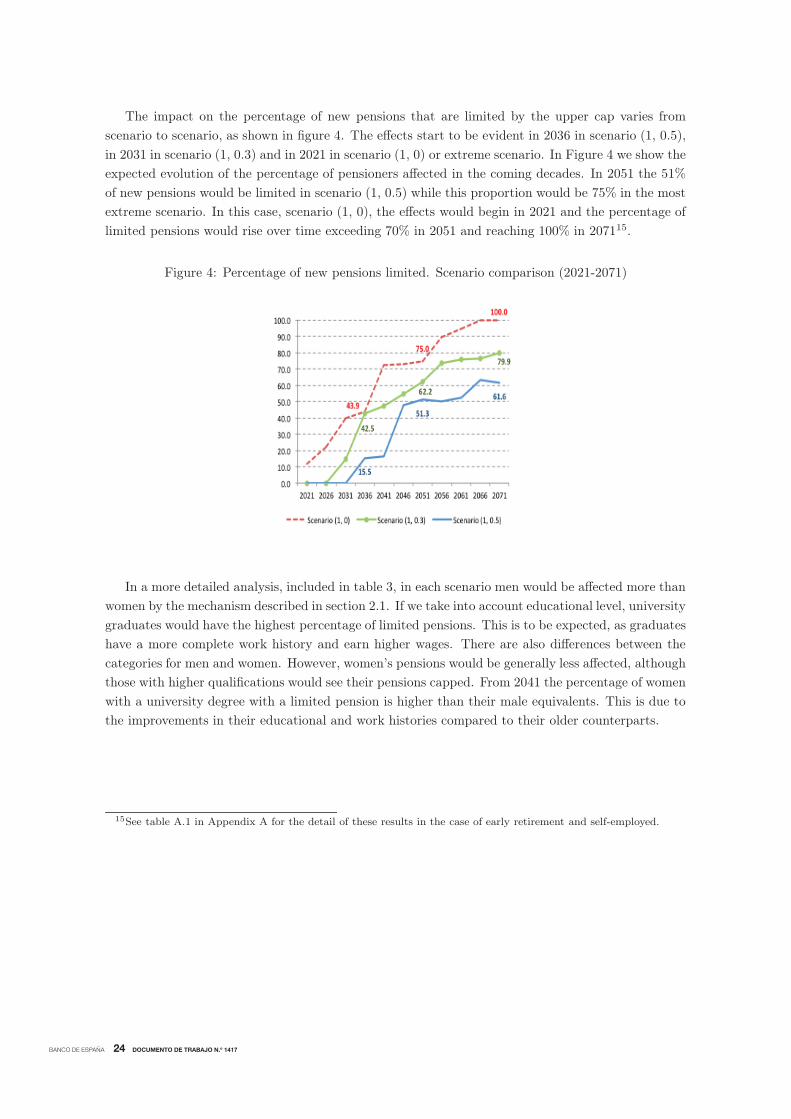
The impact on the percentage of new pensions that are limited by the upper cap varies from
scenario to scenario, as shown in figure 4. The effects start to be evident in 2036 in scenario (1, 0.5),
in 2031 in scenario (1, 0.3) and in 2021 in scenario (1, 0) or extreme scenario. In Figure 4 we show the
expected evolution of the percentage of pensioners affected in the coming decades. In 2051 the 51%
of new pensions would be limited in scenario (1, 0.5) while this proportion would be 75% in the most
extreme scenario. In this case, scenario (1, 0), the effects would begin in 2021 and the percentage of
limited pensions would rise over time exceeding 70% in 2051 and reaching 100% in 207115.
Figure 4: Percentage of new pensions limited. Scenario comparison (2021-2071)
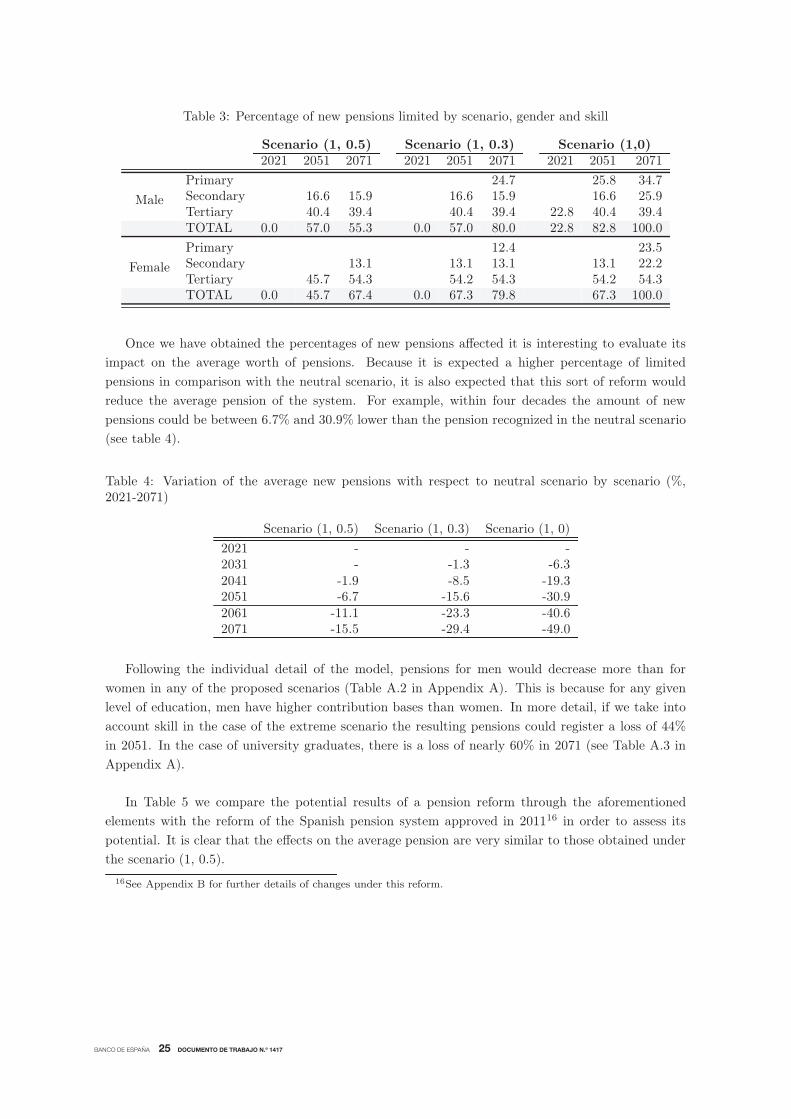
In a more detailed analysis, included in table 3, in each scenario men would be affected more than
women by the mechanism described in section 2.1. If we take into account educational level, university
graduates would have the highest percentage of limited pensions. This is to be expected, as graduates
have a more complete work history and earn higher wages. There are also differences between the
categories for men and women. However, women’s pensions would be generally less affected, although
those with higher qualifications would see their pensions capped. From 2041 the percentage of women
with a university degree with a limited pension is higher than their male equivalents. This is due to
the improvements in their educational and work histories compared to their older counterparts.
15See table A.1 in Appendix A for the detail of these results in the case of early retirement and self-employed.
BANCO DE ESPAÑA 25 DOCUMENTO DE TRABAJO N.º 1417
Table 3: Percentage of new pensions limited by scenario, gender and skill
Scenario (1, 0.5) Scenario (1, 0.3) Scenario (1,0)2021 2051 2071 2021 2051 2071 2021 2051 2071
Male
Primary 24.7 25.8 34.7Secondary 16.6 15.9 16.6 15.9 16.6 25.9Tertiary 40.4 39.4 40.4 39.4 22.8 40.4 39.4TOTAL 0.0 57.0 55.3 0.0 57.0 80.0 22.8 82.8 100.0
Female
Primary 12.4 23.5Secondary 13.1 13.1 13.1 13.1 22.2Tertiary 45.7 54.3 54.2 54.3 54.2 54.3TOTAL 0.0 45.7 67.4 0.0 67.3 79.8 67.3 100.0
Once we have obtained the percentages of new pensions affected it is interesting to evaluate its
impact on the average worth of pensions. Because it is expected a higher percentage of limited
pensions in comparison with the neutral scenario, it is also expected that this sort of reform would
reduce the average pension of the system. For example, within four decades the amount of new
pensions could be between 6.7% and 30.9% lower than the pension recognized in the neutral scenario
(see table 4).
Table 4: Variation of the average new pensions with respect to neutral scenario by scenario (%,2021-2071)
Scenario (1, 0.5) Scenario (1, 0.3) Scenario (1, 0)
2021 - - -2031 - -1.3 -6.32041 -1.9 -8.5 -19.32051 -6.7 -15.6 -30.92061 -11.1 -23.3 -40.62071 -15.5 -29.4 -49.0
Following the individual detail of the model, pensions for men would decrease more than for
women in any of the proposed scenarios (Table A.2 in Appendix A). This is because for any given
level of education, men have higher contribution bases than women. In more detail, if we take into
account skill in the case of the extreme scenario the resulting pensions could register a loss of 44%
in 2051. In the case of university graduates, there is a loss of nearly 60% in 2071 (see Table A.3 in
Appendix A).
In Table 5 we compare the potential results of a pension reform through the aforementioned
elements with the reform of the Spanish pension system approved in 201116 in order to assess its
potential. It is clear that the effects on the average pension are very similar to those obtained under
the scenario (1, 0.5).
16See Appendix B for further details of changes under this reform.
BANCO DE ESPAÑA 26 DOCUMENTO DE TRABAJO N.º 1417
Table 5: Variation of the average new pensions. Comparison with Reform 2011 (year 2051)
Scenario Scenario Scenario Reform 2011(1, 0.5) (1, 0.3) (1, 0) Conde-Ruiz y González (2013)
TOTAL -6.7 -15.6 -30.9 -9.1
GenderMale -8.8 -17.8 -33.4 -8.1Female -4.3 -13.2 -28.0 -10.1
SkillPrimary -11.7 -11.5Secondary -3.5 -10.1 -24.3 -11.1Tertiary -10.3 -23.4 -40.4 -7.4
3.3 Results: Impact on sustainability
In this section we analyse the potential implications that changes in the pension system through the
evolution of the limits, as it is described in this paper, would have on the evolution of total pension
expenditure based on the different scenarios presented. As we have indicated we will obtain the results
based on the Spanish pension system prior to the Reform of 2011 in order to have a benchmark with
which we can compare the potential of the kind of reform called “Silent Reform”.
As expected, the total pension expenditure will increase in the coming decades, not only due to
the increase in life expectancy but also due to the fact that pensions will be higher because of the
improvement of work histories. However, if the maximum contribution cap grows at the same pace
as productivity and the upper cap of pensions remains constant in real terms (our extreme scenario)
new pensions would be limited in quantity, as shown in previous section, and consequently would
have implications in terms of total pension expenditure. The difference between the neutral and
the extreme scenario would be perceptible from 2031 onwards because the number of retirees at 65
entitled to a maximum pension would begin to be significant. In fact, population dynamics plays
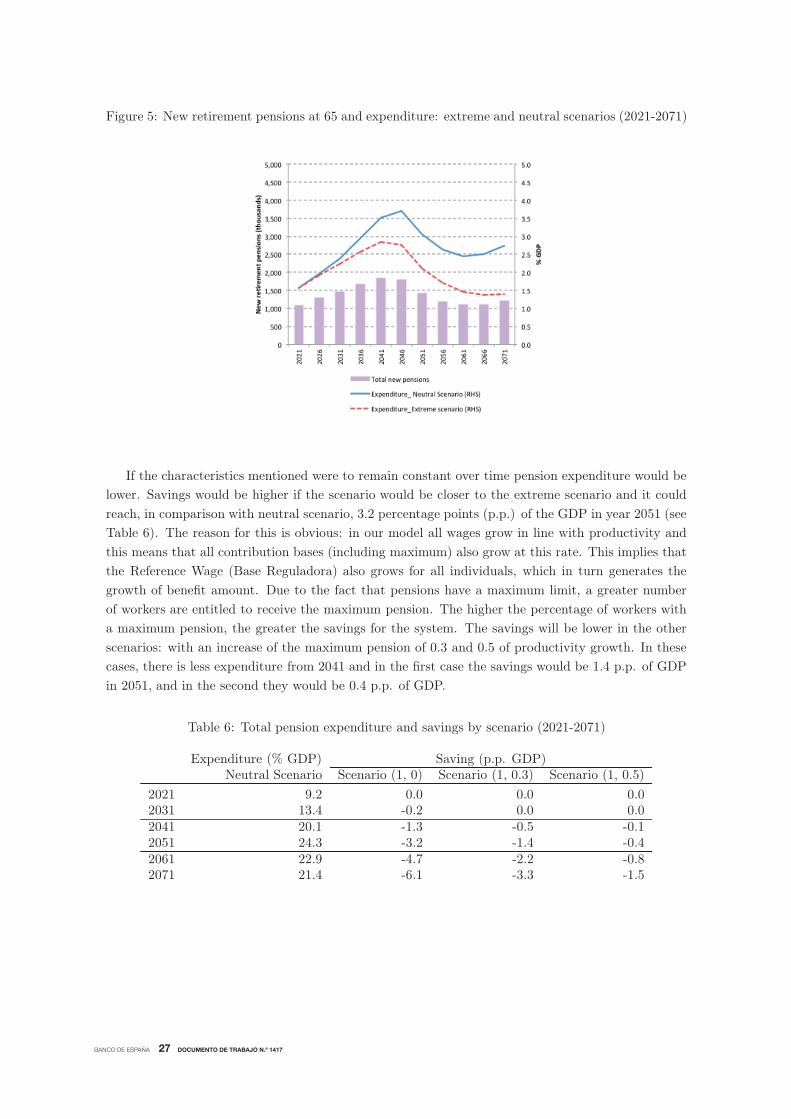
an important role since, as seen in graph 5, the maximum number of new pensions is reached in
2040, where larger numbers of people (those from the baby boom) would retire and the evolution
of pension expenditure would adopt an inverted “U” shape. At the same time, under the extreme
scenario the pension expenditure from new pensions would increase until 2046. From that point in
time there would be a two-fold effect: the number of new retirement pensions at 65 would be less due
to population dynamics, and the called “Silent Reform” would have its greatest impact in 2046.
BANCO DE ESPAÑA 27 DOCUMENTO DE TRABAJO N.º 1417
Figure 5: New retirement pensions at 65 and expenditure: extreme and neutral scenarios (2021-2071)
If the characteristics mentioned were to remain constant over time pension expenditure would be
lower. Savings would be higher if the scenario would be closer to the extreme scenario and it could
reach, in comparison with neutral scenario, 3.2 percentage points (p.p.) of the GDP in year 2051 (see
Table 6). The reason for this is obvious: in our model all wages grow in line with productivity and
this means that all contribution bases (including maximum) also grow at this rate. This implies that
the Reference Wage (Base Reguladora) also grows for all individuals, which in turn generates the
growth of benefit amount. Due to the fact that pensions have a maximum limit, a greater number
of workers are entitled to receive the maximum pension. The higher the percentage of workers with
a maximum pension, the greater the savings for the system. The savings will be lower in the other
scenarios: with an increase of the maximum pension of 0.3 and 0.5 of productivity growth. In these
cases, there is less expenditure from 2041 and in the first case the savings would be 1.4 p.p. of GDP
in 2051, and in the second they would be 0.4 p.p. of GDP.
Table 6: Total pension expenditure and savings by scenario (2021-2071)
Expenditure (% GDP) Saving (p.p. GDP)Neutral Scenario Scenario (1, 0) Scenario (1, 0.3) Scenario (1, 0.5)
2021 9.2 0.0 0.0 0.02031 13.4 -0.2 0.0 0.02041 20.1 -1.3 -0.5 -0.12051 24.3 -3.2 -1.4 -0.42061 22.9 -4.7 -2.2 -0.82071 21.4 -6.1 -3.3 -1.5
BANCO DE ESPAÑA 28 DOCUMENTO DE TRABAJO N.º 1417
Therefore, if the called “Silent Reform” were to take place, it would have a significant effect
containing pension expenditure. As seen in this paper, it could lead to savings equivalent to 3.2 p.p.
of the GDP in 2051 in an extreme scenario compared with a saving of 3.7 p.p. of the GDP under
the 2011 reform, based on the same methodology and the same demographic scenario in Conde-Ruiz
and González (2013). As shown in the table 6 the savings would be even greater in 2071.
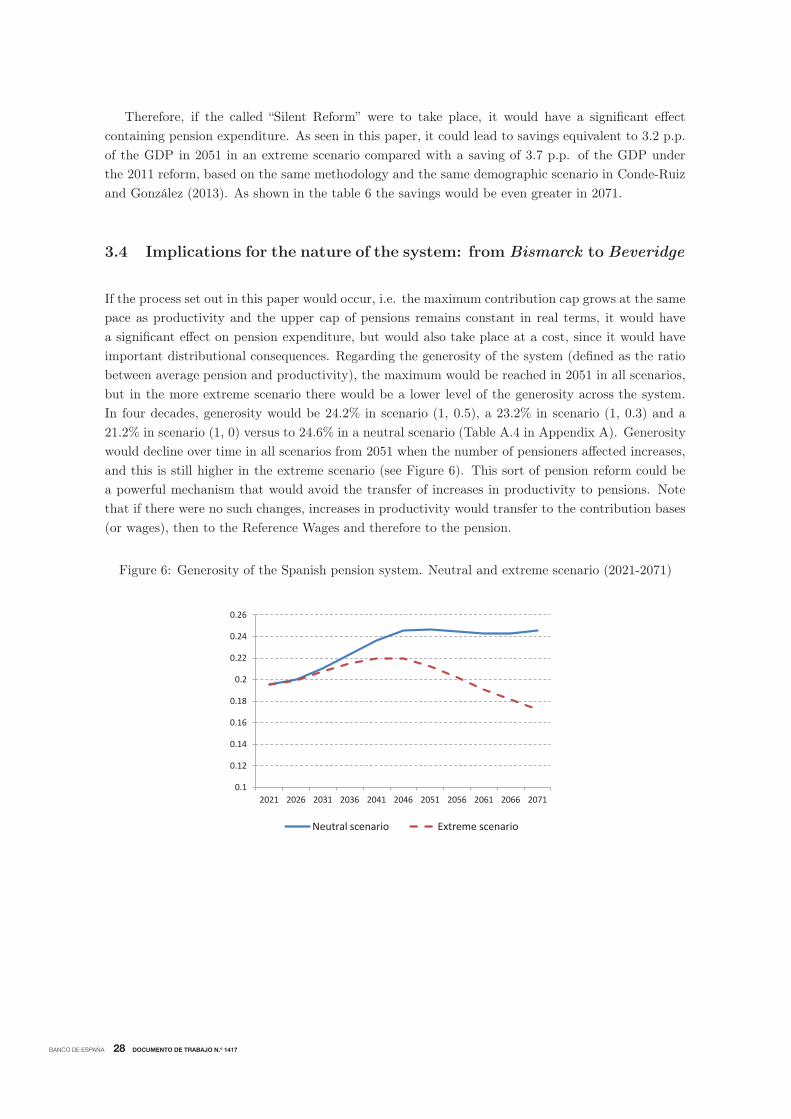
3.4 Implications for the nature of the system: from Bismarck to Beveridge
If the process set out in this paper would occur, i.e. the maximum contribution cap grows at the same
pace as productivity and the upper cap of pensions remains constant in real terms, it would have
a significant effect on pension expenditure, but would also take place at a cost, since it would have
important distributional consequences. Regarding the generosity of the system (defined as the ratio
between average pension and productivity), the maximum would be reached in 2051 in all scenarios,
but in the more extreme scenario there would be a lower level of the generosity across the system.
In four decades, generosity would be 24.2% in scenario (1, 0.5), a 23.2% in scenario (1, 0.3) and a
21.2% in scenario (1, 0) versus to 24.6% in a neutral scenario (Table A.4 in Appendix A). Generosity
would decline over time in all scenarios from 2051 when the number of pensioners affected increases,
and this is still higher in the extreme scenario (see Figure 6). This sort of pension reform could be
a powerful mechanism that would avoid the transfer of increases in productivity to pensions. Note
that if there were no such changes, increases in productivity would transfer to the contribution bases
(or wages), then to the Reference Wages and therefore to the pension.
Figure 6: Generosity of the Spanish pension system. Neutral and extreme scenario (2021-2071)
0.1
0.12
0.14
0.16
0.18
0.2
0.22
0.24
0.26
2021 2026 2031 2036 2041 2046 2051 2056 2061 2066 2071
Neutral scenario Extreme scenario
BANCO DE ESPAÑA 29 DOCUMENTO DE TRABAJO N.º 1417
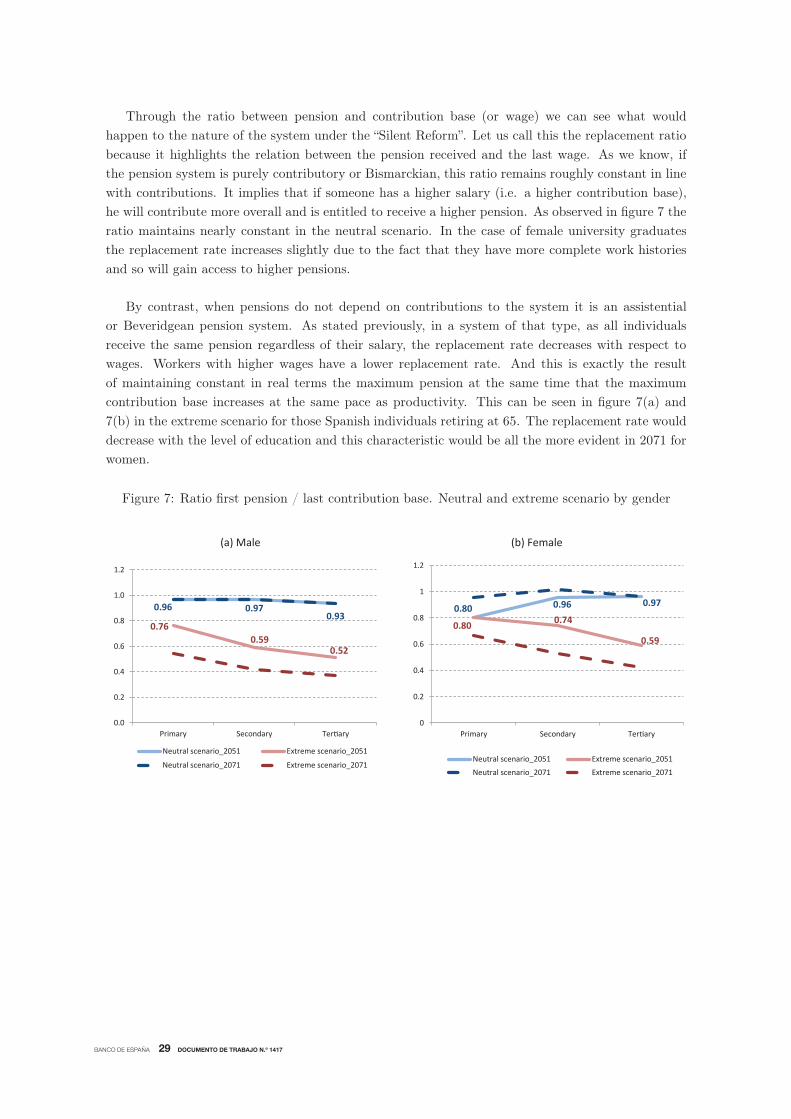
Through the ratio between pension and contribution base (or wage) we can see what would
happen to the nature of the system under the “Silent Reform”. Let us call this the replacement ratio
because it highlights the relation between the pension received and the last wage. As we know, if
the pension system is purely contributory or Bismarckian, this ratio remains roughly constant in line
with contributions. It implies that if someone has a higher salary (i.e. a higher contribution base),
he will contribute more overall and is entitled to receive a higher pension. As observed in figure 7 the
ratio maintains nearly constant in the neutral scenario. In the case of female university graduates
the replacement rate increases slightly due to the fact that they have more complete work histories
and so will gain access to higher pensions.
By contrast, when pensions do not depend on contributions to the system it is an assistential
or Beveridgean pension system. As stated previously, in a system of that type, as all individuals
receive the same pension regardless of their salary, the replacement rate decreases with respect to
wages. Workers with higher wages have a lower replacement rate. And this is exactly the result
of maintaining constant in real terms the maximum pension at the same time that the maximum
contribution base increases at the same pace as productivity. This can be seen in figure 7(a) and
7(b) in the extreme scenario for those Spanish individuals retiring at 65. The replacement rate would
decrease with the level of education and this characteristic would be all the more evident in 2071 for
women.
Figure 7: Ratio first pension / last contribution base. Neutral and extreme scenario by gender
(a) Male (b) Female
0.96 0.97 0.93
0.76 0.59
0.52
0.0
0.2
0.4
0.6
0.8
1.0
1.2
Primary Secondary Ter ary
Neutral scenario_2051 Extreme scenario_2051
Neutral scenario_2071 Extreme scenario_2071
0.80 0.96 0.97
0.80 0.74
0.59
0
0.2
0.4
0.6
0.8
1
1.2
Primary Secondary Ter ary
Neutral scenario_2051 Extreme scenario_2051 Neutral scenario_2071 Extreme scenario_2071
BANCO DE ESPAÑA 30 DOCUMENTO DE TRABAJO N.º 1417
This result warns us that under the “Silent Reform” there could be a change in the nature of
the system, from a contributive or Bismarckian type to a system where the pensions are moving
away from the contributive model. The kind of reform analysed in this paper would increase the
intragenerational redistribution element in the pension system. It means that apparent small changes
in some factors could lead to a significant structural reform that would completely change the nature
of the system, transforming the Spanish pension system into an assistential system with a strong
element of intragenerational redistribution.
4 Conclusions and discussion
The Spanish social security system has a special feature that, according to many experts, might be
decisive in containing future pension expenditure: namely the existence of an upper cap for both
contribution bases and pensions which are fixed by law each year. Several authors have stressed
that the policy followed by governments so far, where the maximum pension is not adjusted to
growth in wages, has relevant effects regarding the generosity of the pension system by decreasing
the ratio between the average pension and the average productivity: it leads to a reform that is not
perceptible by population, and is therefore called the “Silent Reform”. This kind of reform is based on
the establishment of the evolution of maximum contribution bases and maximum pensions in favour
of a system, that is increases of the maximum pension less than the maximum contribution cap. In
this paper we have analysed the potential effects this sort of reform would have on the sustainability
of the Spanish pension system and its distributional effects on different groups of individuals.
In this paper we have shown that this sort of reform could have significant effects on the
expenditure of the system. In the most extreme case it could save up to 3.2 percentage points
of the GDP by 2051 and 6.1 p.p. of the GDP in 2071. This impact is of great importance when
compared to the effects of the pension reform of 2011. Conde-Ruiz and González (2013) show, using
the same methodology and the same demographic scenario than this article, that the reform of the
year 2011 (where the calculation period was extended, delayed the retirement age to 67 years and
modified replacement rate applicable to the reference wage) can imply savings of 3.7 p.p. of GDP
in 205117. As a future research, it would be very interesting to compare the results obtained in this
paper with the effects of the pension reform approved in 2013 and analysed by MINECO (2014);
Díaz-Gimenez and Díaz-Saavedra (2014) and Sánchez-Martín (2014).
17These savings could reach 8.6 p.p. of GDP if it would taken into account the whole contributory history, theretirement age would be postponed until 70 and the replacement rate would be extended (Conde-Ruiz and González,2013).
BANCO DE ESPAÑA 31 DOCUMENTO DE TRABAJO N.º 1417
The implications of decide different growth rates between maximum pension and maximum
contribution base is a potential powerful reform mechanism that also has relevant distributional
effects. Indexing the maximum pension with inflation may seem harmless and may seem not to imply
any institutional change to the pension system. However, it is not the case in a context of wage
growth as we have shown in this paper. In particular, the application of this kind of reform could
imply, in an extreme scenario, an average pension reduction of 50% in the long term in the case
of workers with tertiary education levels. This means that it would reduce the average generosity
of the system and would contribute to the financial sustainability of the pension system. However,
given this decrease in the average generosity of the system would be achieved through the highest
pensions, it would increase the degree of intragenerational redistribution. We have shown that this
could completely change the nature of the system becoming a contributory or Bismarckian system
into an assistential or Beveridgean system.
We show that the hypothetical “silent” pension reform analysed in these paper would have a
relevant impact on the pension expenditure. It could also help the sustainability problem, although
its implications would go beyond that. Due to the fact that there would be imperceptible changes
in generosity and in the degree of intragenerational redistribution, it is very likely that individuals
who are affected by these measures would not be able to make effective long-term decisions, adapting
the new situation. The unexpected change in the nature of the system could well be detrimental
to pensioners since the contributory Bismarckian system was originally a response to the middle
class and had the aim of offering pensions that provided a sufficient level of income in old age.
Assistential or Beveridgean systems were created with the aim of providing a minimum pension, but
leaving enough space for individuals to complete the pension with private savings. The danger of this
change, is not the change itself, but rather the imperceptible nature of the change, meaning that the
population would not knowingly be able to adapt to it.
Finally, the institutional features that allow the called “Silent Reform” to be introduced (maximum
pension and maximum contributions) are not exclusive to Spanish pension system. In fact they are
present in most industrialised countries who have a Bismarckian pension system. So we believe that
the lessons learned from the case of Spain could be useful for other countries.
BANCO DE ESPAÑA 32 DOCUMENTO DE TRABAJO N.º 1417
References
Alonso, J. and J. A. Herce (2003). Balance del sistema de pensiones y boom migratorio en España
Proyecciones del modelo MODPENS de FEDEA. Documento de Trabajo 2003-02, FEDEA.
Argimón, I. and C. I. González (2006). La Muestra Continua de Vidas Laborales de la Seguridad
Social. Boletín Económico. Banco de España, (5):39–53.
Banco de España (2011). Informe Anual 2010. BdE, Madrid.
Boldrin, M., S. Jimenez and F. Peracchi (2000). Sistema de pensiones y mercado de trabajo en España.
Fundación BBVA, Madrid.
Boldrin, M., S. Jimenez and F. Peracchi (2004). Social Security Programs and Retirement
Around the World: microestimation, University of Chicago Press for the NBER: Chicago, chap.
Micro-modelling of retirement behavior in Spain.
Comisión Europea (2009). The Ageing Report 2009: Economic and budgetary projections for the
EU-27 Member States (2008-2060). European economy 2|2009, Comisión Europea (DG ECFIN) y
Comité de Política Económica (AWG).
Conde-Ruiz, J. I. and J. Alonso (2004). El Futuro de las Pensiones en España: Perspectivas y
Lecciones. Información Comercial Española ICE, 815:155–174.
Conde-Ruiz, J. I. and C. I. González (2013). Reforma de pensiones 2011 en España. Hacienda Pública
Española-, 204 - (1/2013):9–44.
Conde-Ruiz, J. I. and J. F. Jimeno (2004). ¿Suben las Pensiones? Fedea Brief.
Conde-Ruiz, J. I. and P. Profeta (2007). The redistributive design of social security systems. Economic
Journal, 117(520):686–712.
de la Fuente, A. and R. Doménech (2009). Spain and the Euro: the first ten years, Banco de España,
chap. Ageing and real convergence: challenges and proposals, pp. 191–273.
de la Fuente, A. and R. Doménech (2013). The financial impact of Spanish pension reform: A quick
estimate. Journal of Pension Economics and Finance, 2:111–137.
Diaz-Gimenez, J. and J. Diaz-Saavedra (2006). The demographic and educational transitions and the
sustainability of the Spanish Pension System. Moneda y Crédito, (222):223–270.
Diaz-Gimenez, J. and J. Diaz-Saavedra (2009). Delaying Retirement in Spain. Review of Economic
Dynamics, 12(1):147–167.
Diaz-Gimenez, J. and J. Diaz-Saavedra (2014). The Future of Spanish Pensions. Working Paper
14/03, Universidad de Granada.
Diaz-Saavedra, J. (2005). A parametric reform of the Spanish public pension system. Department of
Business Administration, Universidad Carlos III de Madrid, Mimeo.
BANCO DE ESPAÑA 33 DOCUMENTO DE TRABAJO N.º 1417
Disney, R. (2004). Are contributions to public pension programmes a tax on employment? Economic
Policy, 19(39):267–311.
European Commission (2011). The Ageing Report 2009: Underlying Assumptions and Projection
Methodologies. European economy 4|2011, European Commission (DG ECFIN) and Economic
Policy Committee (AWG).
Gil, Joan, M. López García, J. Onrubia, C. Patxot and G. Souto (2008). SIPES, Un modelo de
simulación del sistema de pensiones contributivas en España: proyecciones de gasto a largo plazo.
Estudios de Hacienda Pública. Ministerio de Economía y Hacienda. Instituto de Estudios Fiscales.
González, C. I. (2013). Sostenibilidad del sistema de pensiones de reparto en España y modelización
de los rendimientos financieros, vol. 65 of Estudios de la Fundación. Serie Tesis. FUNCAS.
Herce, J.A. and J.L. Fernández (Dir.) (2009). Los retos socio-económicos del envejecimiento en
España. Informe realizado para UNESPA (www.unespa.es/adjuntos/fichero_3009_20100125.pdf),
AFI.
Hills, J., J. Ditch and H. Glennerster (eds.) (1994). Beveridge and Social Security: An International
Retrospective. Oxford University Press.
INE (2005). Proyección de la Población de España a Largo Plazo, período 2002-2060.
http://www.ine.es/metodologia/t20/t2030251h.htm.
INE (2010). Proyección de la Población de España a Largo Plazo, período 2009-2049.
http://www.ine.es.
Jimenez-Martin, S. and A. Sanchez-Martin (2007). An evaluation on the life cycle effects of minimum
pensions on retirement behavior. Journal of Applied Econometrics, 22:923–950.
Jimenez-Martin, S. and A.R. Sanchez-Martin (2000). Incentivos y reglas de jubilación en España.
Cuadernos económicos de ICE, (65):45–88.
Jimeno, J. F. (2002). Incentivos y desigualdad en el sistema español de pensiones contributivas de
jubilación. Documento de Trabajo 2002-13, FEDEA.
Jimeno, J. F. (2003). La equidad intrageneracional de los sistemas de pensiones. Revista de economía
aplicada, (33):5–48.
Jimeno, J. F., J. A. Rojas and S. Puente (2008). Modelling the impact of aging on social security
expenditures. Economic Modelling, 25(2):201–224.
Köhler, P., H. Zacher and M. Partington (eds.) (1982). The Evolution of Social Insurance, 1881-1981:
Studies of Germany, France, Great Britain, Austria, and Switzerland. London: F. Pinter; New
York: St. Martin’s Press.
MEH (2011). Programa de Estabilidad España 2011-2014. Ministerio de Economía y Hacienda -
http://www.meh.es.
BANCO DE ESPAÑA 34 DOCUMENTO DE TRABAJO N.º 1417
MINECO (2014). Actualización del Programa de Estabilidad España 2014-2017. Ministerio de
Economía y Competitividad - http://www.mineco.gob.es.
Moral-Arce, I., C. Patxot and G. Souto (2008). La sostenibilidad del sistema de pensiones. Una
aproximación a partir de la MCVL. Revista de Economía Aplicada, 16(E-1):29–66.
MTIN (octubre 2008). Estrategia Nacional de Pensiones. Ministerio de Trabajo e
Inmigración-http://www.mtin.es.
OECD (2013a). Pensions at a Glance 2013: Retirement-Income Systems in OECD and G20
Countries. OECD Publishing.
OECD (2013b). Public and private expenditure on pensions, in OECD Factbook 2013. OECD
Publishing.
Rojas, J. A. (2005). Life-cycle earnings, cohort size effects and social security: a quantitative
exploration. Journal of Public Economics, 89(2-3):465–485.
Sanchez-Martin, A. (2001). Endogenous retirement and public pension system reform in Spain.
Economics Series 03 - Working Paper 01-35, Universidad Carlos III, Departamento de Economía.
Sanchez-Martin, A. (2010). Endogenous retirement and public pension system reform in Spain.
Economic Modelling, 27(1):336–349.
Sanchez-Martin, A. (2014). The automatic adjustment of pension expenditures in Spain: an evaluation
of the 2013’s pension reform. Forthcoming Working Paper, Banco de España.
Sanchez-Martin, A. R. and V. Sanchez-Marcos (2010). Demographic Change and Pension Reform in
Spain: An Assessment in a Two-Earner, OLG Model. Fiscal Studies, 31(3):pp. 405–452.
Seguridad Social (2006). La Muestra Continua de Vidas Laborales, vol. Colección informes y estudios.
Serie Seguridad Social, num 24. Ministerio de Trabajo y Asuntos Sociales.
U.S. SSA (2012). Social Security Programs Throughout the World. U.S. Social Security
Administration.
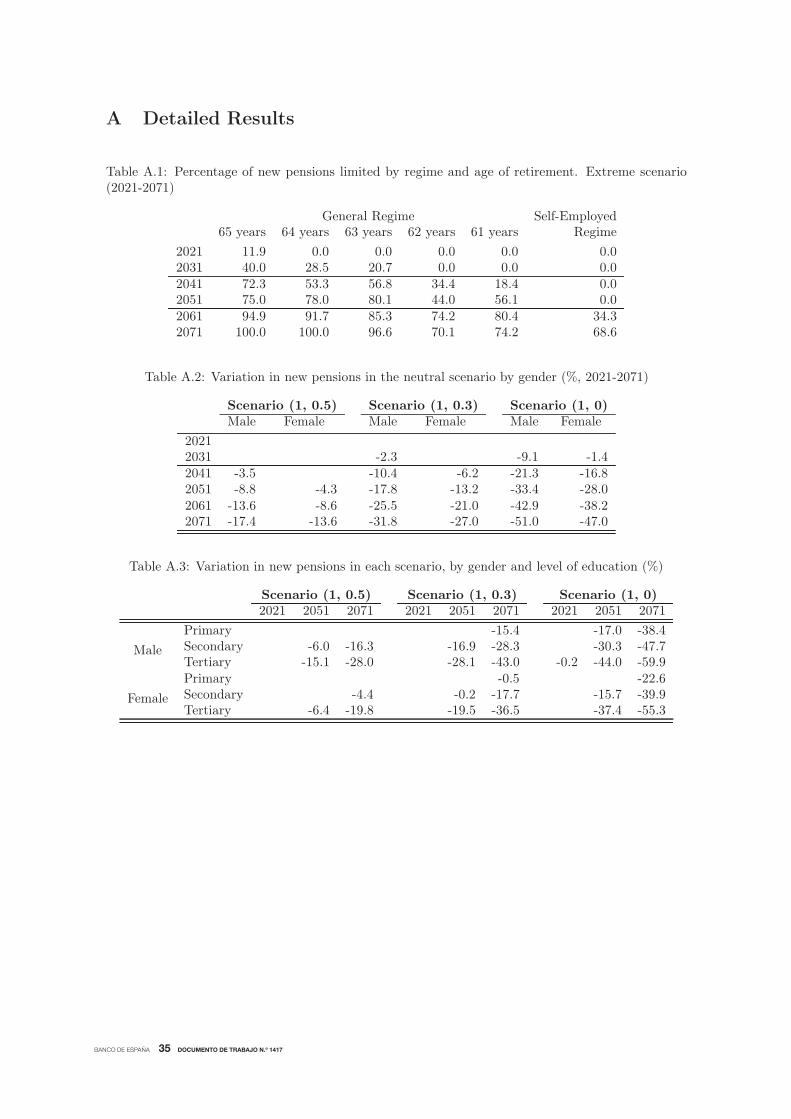
BANCO DE ESPAÑA 35 DOCUMENTO DE TRABAJO N.º 1417
A Detailed Results
Table A.1: Percentage of new pensions limited by regime and age of retirement. Extreme scenario(2021-2071)
General Regime Self-Employed65 years 64 years 63 years 62 years 61 years Regime
2021 11.9 0.0 0.0 0.0 0.0 0.02031 40.0 28.5 20.7 0.0 0.0 0.02041 72.3 53.3 56.8 34.4 18.4 0.02051 75.0 78.0 80.1 44.0 56.1 0.02061 94.9 91.7 85.3 74.2 80.4 34.32071 100.0 100.0 96.6 70.1 74.2 68.6
Table A.2: Variation in new pensions in the neutral scenario by gender (%, 2021-2071)
Scenario (1, 0.5) Scenario (1, 0.3) Scenario (1, 0)Male Female Male Female Male Female
20212031 -2.3 -9.1 -1.42041 -3.5 -10.4 -6.2 -21.3 -16.82051 -8.8 -4.3 -17.8 -13.2 -33.4 -28.02061 -13.6 -8.6 -25.5 -21.0 -42.9 -38.22071 -17.4 -13.6 -31.8 -27.0 -51.0 -47.0
Table A.3: Variation in new pensions in each scenario, by gender and level of education (%)
Scenario (1, 0.5) Scenario (1, 0.3) Scenario (1, 0)2021 2051 2071 2021 2051 2071 2021 2051 2071
Male
Primary -15.4 -17.0 -38.4Secondary -6.0 -16.3 -16.9 -28.3 -30.3 -47.7Tertiary -15.1 -28.0 -28.1 -43.0 -0.2 -44.0 -59.9
Female
Primary -0.5 -22.6Secondary -4.4 -0.2 -17.7 -15.7 -39.9Tertiary -6.4 -19.8 -19.5 -36.5 -37.4 -55.3
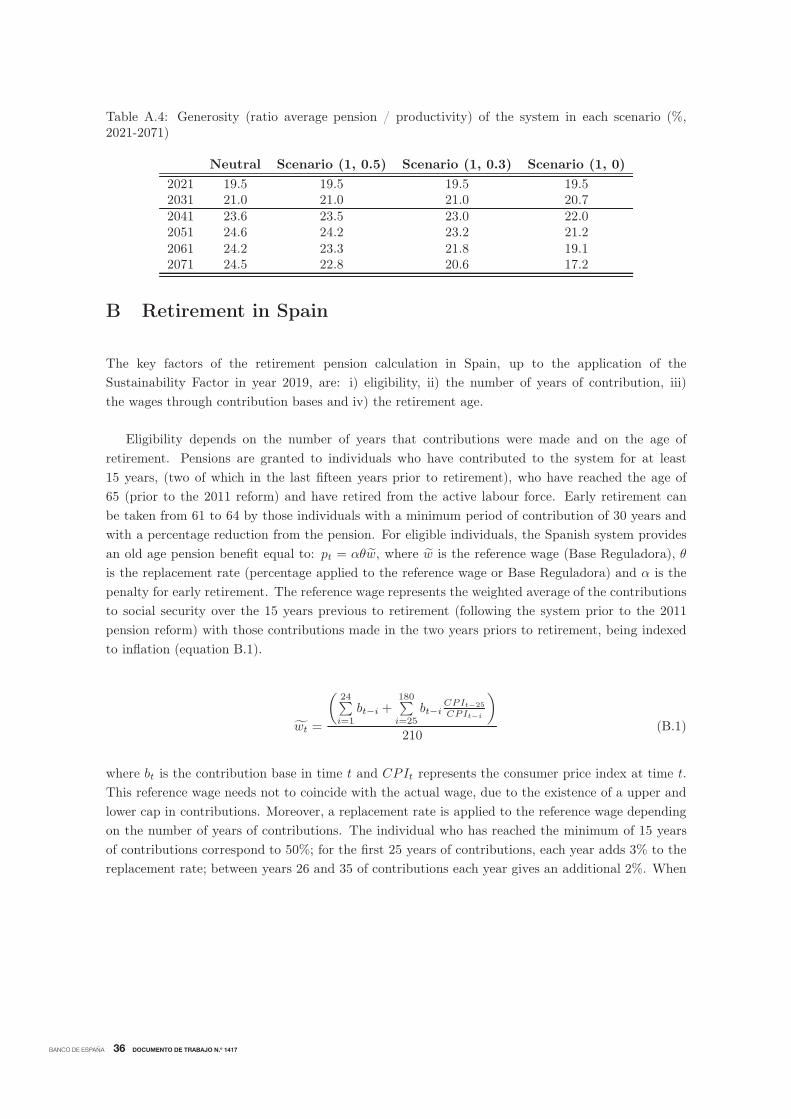
BANCO DE ESPAÑA 36 DOCUMENTO DE TRABAJO N.º 1417
Table A.4: Generosity (ratio average pension / productivity) of the system in each scenario (%,2021-2071)
Neutral Scenario (1, 0.5) Scenario (1, 0.3) Scenario (1, 0)
2021 19.5 19.5 19.5 19.52031 21.0 21.0 21.0 20.72041 23.6 23.5 23.0 22.02051 24.6 24.2 23.2 21.22061 24.2 23.3 21.8 19.12071 24.5 22.8 20.6 17.2
B Retirement in Spain
The key factors of the retirement pension calculation in Spain, up to the application of the
Sustainability Factor in year 2019, are: i) eligibility, ii) the number of years of contribution, iii)
the wages through contribution bases and iv) the retirement age.
Eligibility depends on the number of years that contributions were made and on the age of
retirement. Pensions are granted to individuals who have contributed to the system for at least
15 years, (two of which in the last fifteen years prior to retirement), who have reached the age of
65 (prior to the 2011 reform) and have retired from the active labour force. Early retirement can
be taken from 61 to 64 by those individuals with a minimum period of contribution of 30 years and
with a percentage reduction from the pension. For eligible individuals, the Spanish system provides
an old age pension benefit equal to: pt = αθw̃, where w̃ is the reference wage (Base Reguladora), θ
is the replacement rate (percentage applied to the reference wage or Base Reguladora) and α is the
penalty for early retirement. The reference wage represents the weighted average of the contributions
to social security over the 15 years previous to retirement (following the system prior to the 2011
pension reform) with those contributions made in the two years priors to retirement, being indexed
to inflation (equation B.1).
w̃t =
(24∑i=1
bt−i +180∑i=25
bt−i
CPIt−25
CPIt−i
)210
(B.1)
where bt is the contribution base in time t and CPIt represents the consumer price index at time t.
This reference wage needs not to coincide with the actual wage, due to the existence of a upper and
lower cap in contributions. Moreover, a replacement rate is applied to the reference wage depending
on the number of years of contributions. The individual who has reached the minimum of 15 years
of contributions correspond to 50%; for the first 25 years of contributions, each year adds 3% to the
replacement rate; between years 26 and 35 of contributions each year gives an additional 2%. When
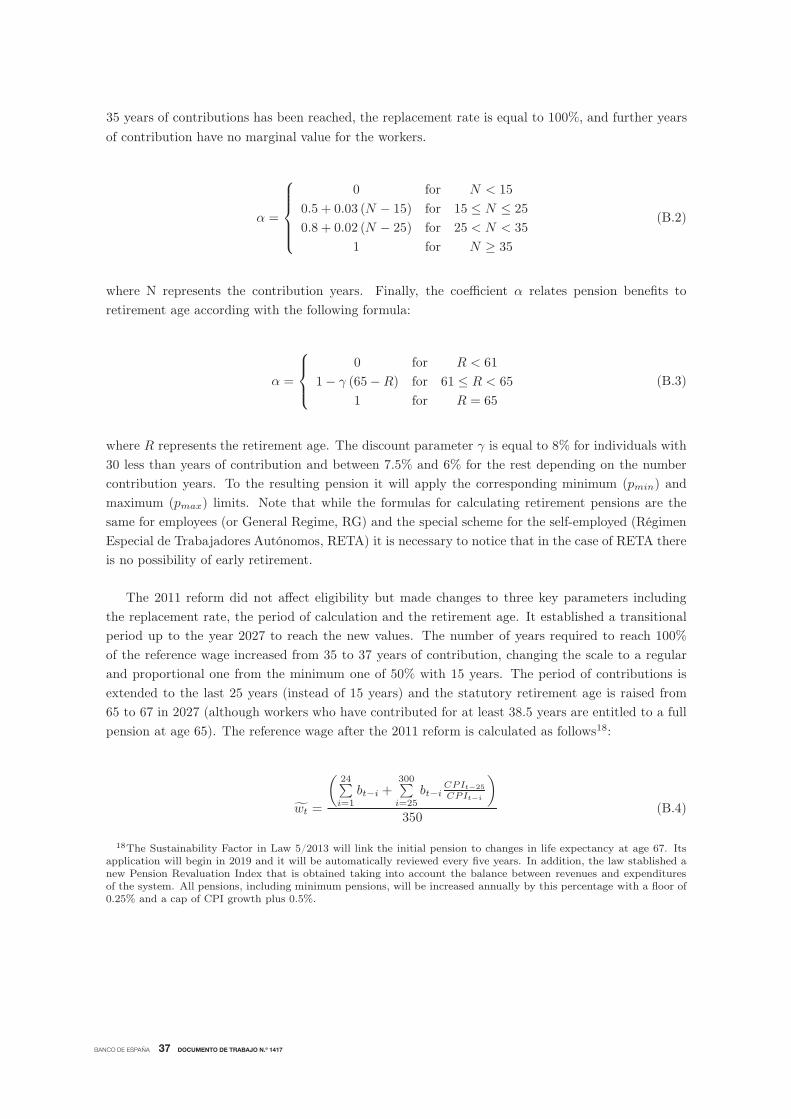
BANCO DE ESPAÑA 37 DOCUMENTO DE TRABAJO N.º 1417
of contribution have no marginal value for the workers.
α =
⎧⎪⎪⎪⎨⎪⎪⎪⎩
0 for N < 15
0.5 + 0.03 (N − 15) for 15 ≤ N ≤ 25
0.8 + 0.02 (N − 25) for 25 < N < 35
1 for N ≥ 35
(B.2)
where N represents the contribution years. Finally, the coefficient α relates pension benefits to
retirement age according with the following formula:
α =
⎧⎪⎨⎪⎩
0 for R < 61
1− γ (65−R) for 61 ≤ R < 65
1 for R = 65
(B.3)
where R represents the retirement age. The discount parameter γ is equal to 8% for individuals with
30 less than years of contribution and between 7.5% and 6% for the rest depending on the number
contribution years. To the resulting pension it will apply the corresponding minimum (pmin) and
maximum (pmax) limits. Note that while the formulas for calculating retirement pensions are the
same for employees (or General Regime, RG) and the special scheme for the self-employed (Régimen
Especial de Trabajadores Autónomos, RETA) it is necessary to notice that in the case of RETA there
is no possibility of early retirement.
The 2011 reform did not affect eligibility but made changes to three key parameters including
the replacement rate, the period of calculation and the retirement age. It established a transitional
period up to the year 2027 to reach the new values. The number of years required to reach 100%
of the reference wage increased from 35 to 37 years of contribution, changing the scale to a regular
and proportional one from the minimum one of 50% with 15 years. The period of contributions is
extended to the last 25 years (instead of 15 years) and the statutory retirement age is raised from
65 to 67 in 2027 (although workers who have contributed for at least 38.5 years are entitled to a full
pension at age 65). The reference wage after the 2011 reform is calculated as follows18:
w̃t =
(24∑i=1
bt−i +300∑i=25
bt−i
CPIt−25
CPIt−i
)350
(B.4)
18The Sustainability Factor in Law 5/2013 will link the initial pension to changes in life expectancy at age 67. Itsapplication will begin in 2019 and it will be automatically reviewed every five years. In addition, the law stablished anew Pension Revaluation Index that is obtained taking into account the balance between revenues and expendituresof the system. All pensions, including minimum pensions, will be increased annually by this percentage with a floor of0.25% and a cap of CPI growth plus 0.5%.
35 years of contributions has been reached, the replacement rate is equal to 100%, and further years
BANCO DE ESPAÑA 38 DOCUMENTO DE TRABAJO N.º 1417
Retirement age. There is a well known pattern: workers retire either at the first legally permitted
age19 or at 65, evidence for which is collected in papers such as Jiménez-Martín and Sánchez-Martín
(2000); Boldrin et al. (2004); Jimenez-Martín and Sanchez-Martín (2007). The model takes into
account that individuals can retire early (between 61 and 64 years) or at the ordinary age of 65 if
before the 2011 reform (or at the correspondent age under the reform), and be categorised by gender
and levels of education20.
Years of contributions. The complete work histories show that workers who retire within four
decades have, on average, longer work histories. A general increase in both men and women in this
category is observed, regardless of nationality21.
Total pension expenditure. Pensions are calculated for each group at each point in time according
to the corresponding law taking into account the number of years of contributions and the retirement
age. To the resulting pension we apply the corresponding floor (pmin) and ceiling (pmax). The
formulae for calculating pensions are equal to employees (RG) and self-employed (RETA), although
in the latter the possibility of early retirement is not allowed. Total expenditure on retirement
pensions is the sum of pensions that take place at 65 and between 61 and 64.
19The early retirement age was 60 years in Spain only possible for those who contributed before 1967 (these cohortsare currently reducing). In 2001 the minimum retirement age was set at 61 years old.
20See González (2013) for more details on retirement patterns in Spain.21Native men would exceed 40 years of contributions regardless of educational level. Women with secondary education
qualifications (high school and college graduate) would experience the largest increase, reflecting women’s increasedparticipation in the labour market. However, only in the case of a university degree would the gap between bothgenders be reduced (see González (2013)).
BANCO DE ESPAÑA PUBLICATIONS
WORKING PAPERS
1301 JAMES COSTAIN and ANTON NAKOV: Logit price dynamics.
1302 MIGUEL GARCÍA-POSADA: Insolvency institutions and effi ciency: the Spanish case.
1303 MIGUEL GARCÍA-POSADA and JUAN S. MORA-SANGUINETTI: Firm size and judicial effi cacy: evidence for the new
civil procedures in Spain.
1304 MAXIMO CAMACHO and GABRIEL PEREZ-QUIROS: Commodity prices and the business cycle in Latin America: living
and dying by commodities?
1305 CARLOS PÉREZ MONTES: Estimation of regulatory credit risk models.
1306 FERNANDO LÓPEZ VICENTE: The effect of foreclosure regulation: evidence for the US mortgage market at state level.
1307 ENRIQUE MORAL-BENITO and LUIS SERVEN: Testing weak exogeneity in cointegrated panels.
1308 EMMA BERENGUER, RICARDO GIMENO and JUAN M. NAVE: Term structure estimation, liquidity-induced
heteroskedasticity and the price of liquidity risk.
1309 PABLO HERNÁNDEZ DE COS and ENRIQUE MORAL-BENITO: Fiscal multipliers in turbulent times: the case of Spain.
1310 SAMUEL HURTADO: DSGE models and the Lucas critique.
1311 HENRIQUE S. BASSO and JAMES COSTAIN: Fiscal delegation in a monetary union with decentralized public spending.
1312 MAITE BLÁZQUEZ CUESTA and SANTIAGO BUDRÍA: Does income deprivation affect people’s mental well-being?
1313 ENRIQUE ALBEROLA, ÁNGEL ESTRADA and DANIEL SANTABÁRBARA: Growth beyond imbalances. Sustainable
growth rates and output gap reassessment.
1314 CARMEN BROTO and GABRIEL PEREZ-QUIROS: Disentangling contagion among sovereign CDS spreads during the
European debt crisis.
1315 MIGUEL GARCÍA-POSADA and JUAN S. MORA-SANGUINETTI: Are there alternatives to bankruptcy? A study of small
business distress in Spain.
1316 ROBERTO RAMOS and ENRIQUE MORAL-BENITO: Agglomeration matters for trade.
1317 LAURA HOSPIDO and GEMA ZAMARRO: Retirement patterns of couples in Europe.
1318 MAXIMO CAMACHO, GABRIEL PEREZ-QUIROS and PILAR PONCELA: Short-term forecasting for empirical
economists. A survey of the recently proposed algorithms.
1319 CARLOS PÉREZ MONTES: The impact of interbank and public debt markets on the competition for bank deposits.
1320 OLYMPIA BOVER, JOSE MARIA CASADO, SONIA COSTA, PHILIP DU CAJU, YVONNE MCCARTHY,
EVA SIERMINSKA, PANAGIOTA TZAMOURANI, ERNESTO VILLANUEVA and TIBOR ZAVADIL: The distribution
of debt across euro area countries: the role of Individual characteristics, institutions and credit conditions.
1321 BRINDUSA ANGHEL, SARA DE LA RICA and AITOR LACUESTA: Employment polarisation in Spain over the course of
the 1997-2012 cycle.
1322 RODOLFO G. CAMPOS and ILIANA REGGIO: Measurement error in imputation procedures.
1323 PABLO BURRIEL and MARÍA ISABEL GARCÍA-BELMONTE: Meeting our D€STINY. A Disaggregated €uro area Short
Term Indicator model to forecast GDP (Y) growth.
1401 TERESA SASTRE and FRANCESCA VIANI: Countries’ safety and competitiveness, and the estimation of current
account misalignments.
1402 FERNANDO BRONER, ALBERTO MARTIN, AITOR ERCE and JAUME VENTURA: Sovereign debt markets in turbulent
times: creditor discrimination and crowding-out effects.
1403 JAVIER J. PÉREZ and ROCÍO PRIETO: The structure of sub-national public debt: liquidity vs credit risks.
1404 BING XU, ADRIAN VAN RIXTEL and MICHIEL VAN LEUVENSTEIJN: Measuring bank competition in China:
a comparison of new versus conventional approaches applied to loan markets.
1405 MIGUEL GARCÍA-POSADA and JUAN S. MORA-SANGUINETTI: Entrepreneurship and enforcement institutions:
disaggregated evidence for Spain.
1406 MARIYA HAKE, FERNANDO LÓPEZ-VICENTE and LUIS MOLINA: Do the drivers of loan dollarisation differ between
CESEE and Latin America? A meta-analysis.
1407 JOSÉ MANUEL MONTERO and ALBERTO URTASUN: Price-cost mark-ups in the Spanish economy: a microeconomic
perspective.
1408 FRANCISCO DE CASTRO, FRANCISCO MARTÍ, ANTONIO MONTESINOS, JAVIER J. PÉREZ and A. JESÚS
SÁNCHEZ-FUENTES: Fiscal policies in Spain: main stylised facts revisited.

1409 MARÍA J. NIETO: Third-country relations in the Directive establishing a framework for the recovery and resolution
of credit institutions.
1410 ÓSCAR ARCE and SERGIO MAYORDOMO: Short-sale constraints and fi nancial stability: evidence from
the Spanish market.
1411 RODOLFO G. CAMPOS and ILIANA REGGIO: Consumption in the shadow of unemployment.
1412 PAUL EHLING and DAVID HAUSHALTER: When does cash matter? Evidence for private fi rms.
1413 PAUL EHLING and CHRISTIAN HEYERDAHL-LARSEN: Correlations.
1414 IRINA BALTEANU and AITOR ERCE: Banking crises and sovereign defaults in emerging markets: exploring the links.
1415 ÁNGEL ESTRADA, DANIEL GARROTE, EVA VALDEOLIVAS and JAVIER VALLÉS: Household debt and uncertainty:
private consumption after the Great Recession.
1416 DIEGO J. PEDREGAL, JAVIER J. PÉREZ and A. JESÚS SÁNCHEZ-FUENTES: A toolkit to strengthen government
budget surveillance.
1417 J. IGNACIO CONDE-RUIZ, and CLARA I. GONZÁLEZ: From Bismarck to Beveridge: the other pension reform in Spain.
Unidad de Servicios AuxiliaresAlcalá, 48 - 28014 Madrid
E-mail: [email protected]