from climex to pesky, a generic expert system for pest risk assessment
TRANSCRIPT
Bulletin OEPP/EPPO Bulletin 21, 595-608 (1991)
From CLIMEX t o PESKY, a generic expert system for pest risk assessment'
by R. W. SUTHERST, G. F. MAYWALD and W. BOTTOMLEY CSIRO Division of Entomology, Long Pockct Laboratories, PMB 3 Indooroopilly,
Queensland (Australia 4068)
CLIMEX, a climate-matching model, is described in relation to pest risk assessment. The rationale for the development Of CLIMEX is given and its various functions are illustrated with examples, using the Colorado beetle Leptinotarsa decemlineata. The beetle's climatic requirements are first inferred from its native distribution in North America. They are then used to project the relative favourableness of Europe and Asia for population growth and persistence. The role is illustrated O f CLIMEX, in association with PESKY, a prototype version of a generic expert system for pest risk assessment, in the assessment of the risk ofthe beetle being transferred from France to China. Finally, CLIMEX is used to search for places in North America with climates best matching that of Beijing (CN). in order to target collection of possible biocontrol agents for use against the beetle in that area, should it become established there.
Introduction
Pest risk assessment involves analyses of many processes involved in the transfer of a pest from one place to another and its subsequent success. Assessments are strengthened by comparing the suitability of climates in the new environment with those in places where the pest is already a problem. In this paper we examine some of the opportunities that are available to exploit knowledge of the response of pest species to climate, in order to improve the effectiveness of pest risk assessment in plant protection. The examples illustrate various functions of the CLIMEX
model (Sutherst & Maywald, 1985; Maywald & Sutherst, 1989, 1991) and its useas the basis for a prototype version of a generic expert system, PESKY, for pest risk assessment.
CLIMEX: history and concepts
CLIMEX was conceived to gain a macro-view of the climatic requirements of pest species without a major research and data collection effort, such as that needed to develop a population model. This need arose partly from the need to meet demands for advice on the risk from introductions of cattle ticks into tick-free parts of Australia. In the context of quarantine breakdowns, information was needed immediately, and in a form that was readily interpretable by non- specialist policy makers. These requirements are common to pest risk assessment for plant protection.
We recognized that the laborious procedures involved in matching climates could be automated using computers. We assumed that the macro-climate was usually the most important factor limiting the geographical distribution of arthropod species in their continents of origin. Further, we assumed that climate was the dominant force determining the seasonal phenology and relative abundance of a species in any given location. Every species was likely to
' Paper presented at the Joint WMO/EPPO/NAPPO Symposium on Practical Applications of Agrometeor- ology in Plant Protection, Firenze (IT), 1990-12-04/07.
595
596 R. W. Sutherst et al.
have its own profile of climatic requirements, so the value of regional classification methods was considered to be limited.
Most places outside a few wet tropical areas have one season suitable for population growth and another which is unsuitable to varying degrees (Southwood, 1977; Sutherst & Maywald, 1985). These conditions need to be reflected in some overall index which describes the potential of a given location for population growth and permanent persistence. It is also helpful to be able to identify the limiting factors that determine the boundaries of the geographical distributions.
We recognized that the climatic conditions favouring population growth could be inferred from the climate a t times when the species was increasing in abundance. These times can be identified from population census data in different places, and the conditions described by a weekly ‘population growth index’ (GI) based on temperature, moisture and daylength and scaled between 0 and 1. Annual mean growth indices are scaled between 0 and 100. Favourable conditions can also be inferred from the relative abundance of the species in different parts of its geographical range. Similarly, the factors limiting the geographical distribution of a species can be inferred from gradients in climatic elements towards the boundaries of the distribution in different directions. These factors were deliberately described in colloquial terms by ‘stress indices’ (scaled between 0 and 100) reflecting prolonged periods of adverse conditions caused by extreme temperatures or moisture availability, or unsuitable daylengths. The annual potential of a given location or year for population growth is combined with the severity of stresses which depress the size of that population in the unfavourable season, to give an overall measure [the Ecoclimatic Index (EI) on a scale of 0-1001 of the favourableness of the location or year for the species.
Using the opposite procedure to process-based simulation modelling approaches, the CLIMEX
parameters are usually inferred from the distribution and abundance data. Alternatively, if process data are available-and they rarely are (Baker & Bailey, 1979)-they can be used to support the estimation of parameter values along traditional lines. However, even when decades of work have been done on the biology of a species, it is still necessary to make some arbitrary decisions in the process-based approach to predicting distributions (Meats, 1981). We therefore find process data most useful as a means of increasing confidence in values inferred from field data. One reason for this is that every biological process has to be defined to be confident that a process-based model will work in all situations. The inference-based approach makes use of the exquisite ability of biological organisms to integrate all the environmental influences impacting on them in any given place. This integration results in all the environmental influences and varying sensitivity of different instars being automatically reflected in the distribution, phcnology and relative abundance of the species. CLIMEX is therefore applicable to any species of pest, regardless of the amount of information available on it. Indeed, CLIMEX has bcen applied just as successfully to species for which only the geographical distribution is known as to others for which sophisticated population models exist. In every case CLIMEX has added considerable new insights about the species’ performance in different environments. As more data become available, the parameter values can be fine-tuned and confidence in the model projections increased accordingly.
CLIMEX Version 4.2
CLIMEX is under continuous development and we have ambitious plans to enhance the program. We and our collaborators are already linking CLIMEX to expert systems (Bottomley & Sutherst, 1989; Sutherst & Bottomley, 1989) and Geographical Information Systems (CIS) supported by high resolution meteorological data (Lessard et ul., 1990). The latest version of CLIMEX at the time of writing is 4.2 (Maywald & Sutherst, 1991). It contains many new features including a function to explore the impact of climate change. These are some of the proposed extcnsions: estimation of numbers of generations/instars per year; provision for generation multipliers
Pest risk model 597
which take account of density dependence for multi-voltine species; monthly maps of growth indices to track geographical changes in climatic conditions; flexible diapause functions and an irrigation facility. Additions are frequently user-driven.
Pest risk assessment-a worked example
Baker & Bailey (1979) and Hopper &Campbell (1989) described the various steps in the process of pest risk assessment. In this paper the role of CLIMEX in this process is illustrated and then a prototype version of an expert system for pest risk assessment, PESKY, is outlined. An idealized example is given in which a consignment of farm produce is shipped from Cherbourg (FR) (the 'source') in June to Beijing (CN) (the 'destination'), arriving in early August. The problem is firstly to define the likelihood of the Colorado beetle Leptznotarsa decemlineata being available to infest the shipment and secondly to define its ability to colonize China if it was introduced there.
Climatic preferences of L eptinotarsa decemlineata
The first step is to estimate the beetle's climatic requirements using CLIMEX and its geographical distribution in its continent of origin. The CLIMEX parameter values estimated by Worner (1988) were fine-tuned (Table 1) using the indigenous North American distribution of L. decemlineata (CIE, 1962).
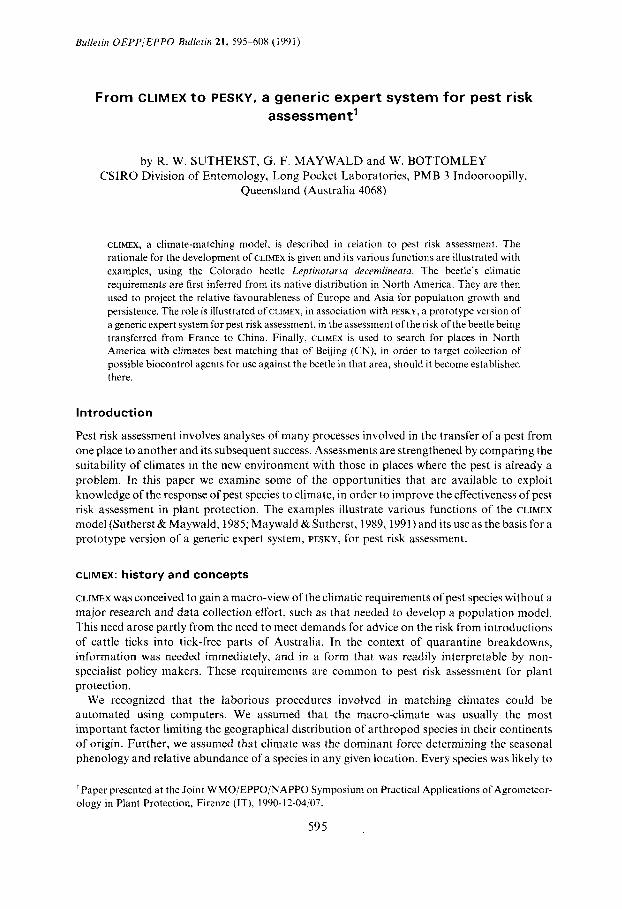
Table 1. Provisional CLIMEX parameter values for the Colorado beetle, Leptinotursu decem/ineura Valeurs provisoires des parametres CLIMEX pour le doryphore, L. decemlineatu
Moisture parameters
SMO SMI SM2 SM3
Lower soil moisture threshold for population growth Lower optimal soil moisture for population growth Upper optimal soil moisture for population growth Upper soil moisture threshold for population growth
Temperature parameters DVO DVI DV2 DV3 PDD Minimum day-degrees
Lower temperature threshold for population growth Lower optimal temperature for population growth Upper optimal temperature for population growth Upper threshold temperature for population growth
Stress indices SMDS Soil moisture dry stress HDS SMWS Soil moisture wet stress HWS TTCS Threshold of cold stress THCS TTHS Threshold of heat stress THHS DLDO Daylength triggering diapause DLTO
Rate of accumulation of dry stress
Rate of accumulation of wet stress
Rate of accumulation of cold stress
Rate of accumulation of heat stress
Mean temperature for daylength response
0.15 0.35 0.80 I .so
1 2 . 0 c 18.0"C 28.0 ;C 35.0"C 400
0.1 0.02 1.5 0.0002 1 .O"C 0.00013
35.0-'C 0.02
15.00 h 12.0"C
See Sutherst & Maywald (1985) and Maywald & Sutherst (1991) for further explanation.
598 R . W. Sutherst et al.
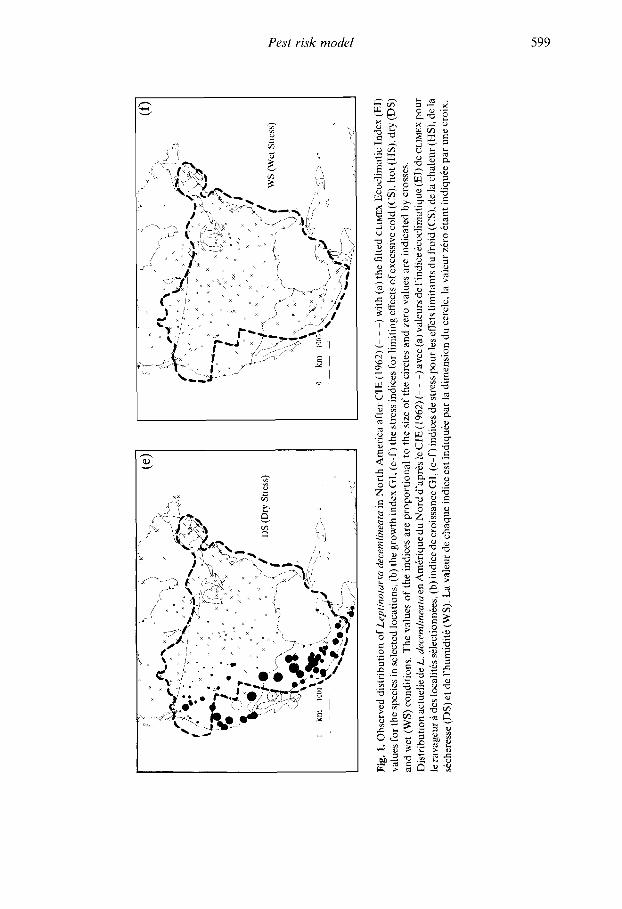
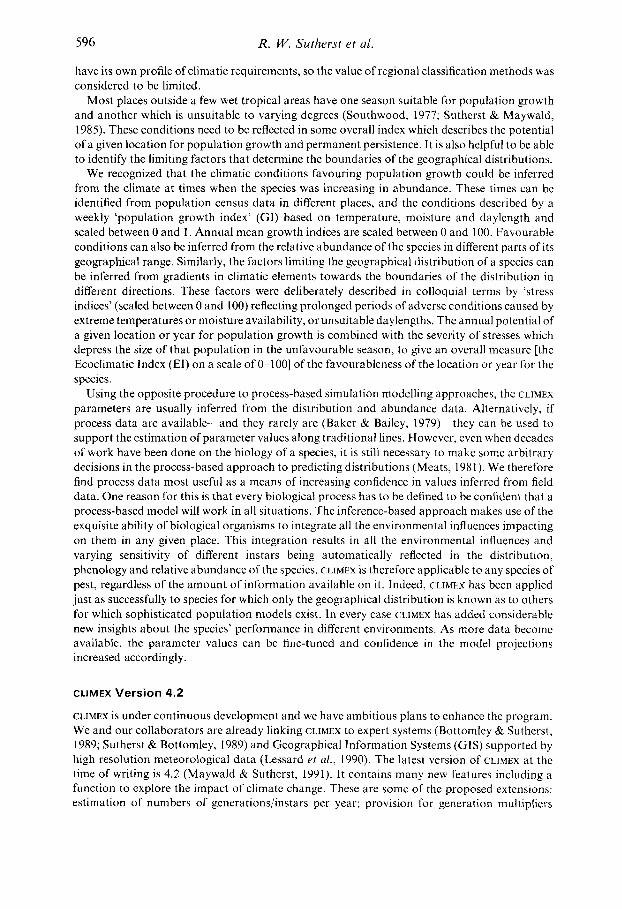
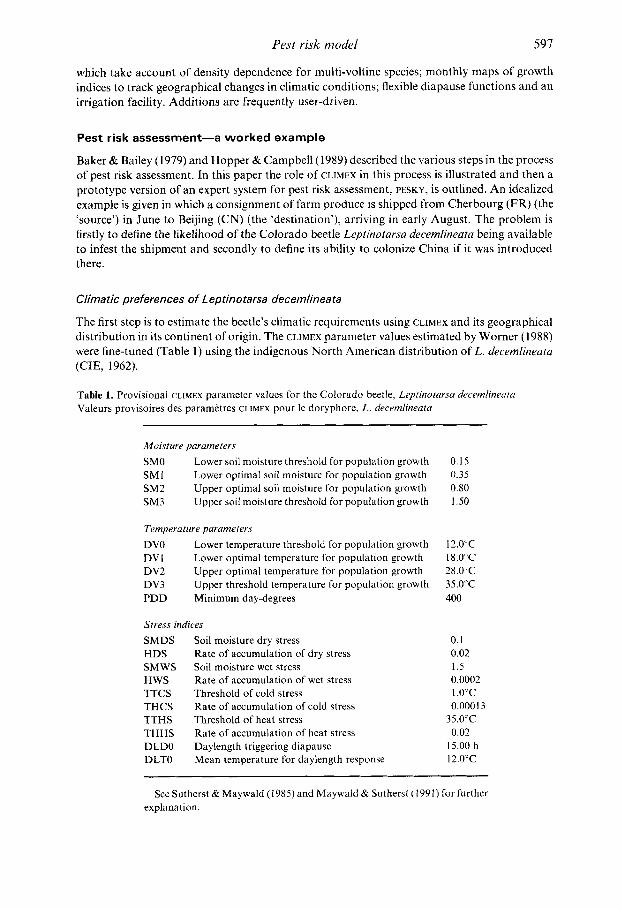
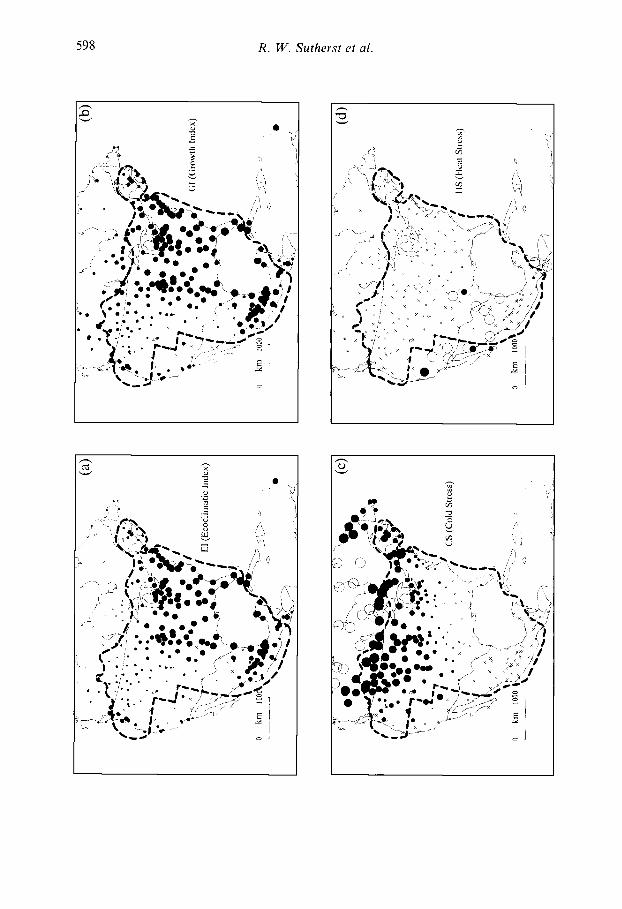
Fig.
1. O
bser
ved
dist
ribu
tion
of L
eptin
otur
sa d
ecem
linea
tu in
Nor
th A
mer
ica
afte
r C
IE (1
962)
(- -
-) w
ith (a
) the
fitte
d C
LIM
EX
Eco
clim
atic
Inde
x (E
l)
valu
es fo
r the
spec
ies i
n se
lect
ed lo
cati
ons,
(b) t
he g
row
th in
dex
GI,
(c -f
) the
stre
ss in
dice
s for
lim
iting
eff
ects
of e
xces
sive
col
d (C
S), h
ot (H
S), d
ry (D
S)
and
wet
(WS)
con
ditio
ns. T
he v
alue
s o
f th
e in
dice
s ar
e pr
opor
tion
al t
o th
e si
ze o
f th
e ci
rcle
s and
zer
o va
lues
are
indi
cate
d by
cro
sses
. D
istr
ibut
iona
ctue
lled
e L. d
ecem
/ineu
ruen
Am
eriq
uedu
Nor
dd'a
pres
leC
IE(1
962)
(- - -)avec(a)valeursdel'indicei.cocl
imat
ique
(EI)
de~~
~~~X
pour
le
rava
geur
a d
es lo
calit
es se
lect
ionn
ees,
(b) i
ndic
e de c
rois
sanc
e G
I, (c
-f)
indi
ces d
e st
ress
pou
r les
effe
ts li
mit
ants
du fr
oid
(CS)
, de
la c
hale
ur (H
S), d
e la
sk
cher
esse
(D
S) et
de
l'hum
idite
(W
S). L
a va
leur
de
chaq
ue in
dice
est
indi
quee
par
la d
imen
sion
du
cerc
le, l
a va
leur
zer
o &
ant i
ndiq
uee
par
une
croi
x.
EI :
1
1 e
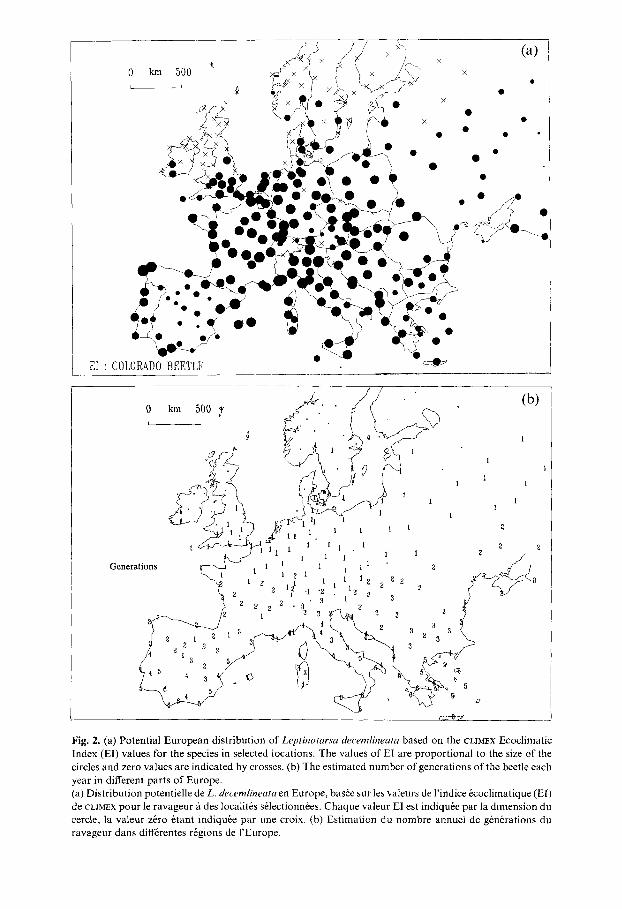
Fig. 2. (a) Potential European distribution of Leptinotarsa decemlineata based on the CLIMEX Ecoclima Index (EI) values for the species in selected locations. The values of EI are proportional to the size of the circles and zero values are indicated by crosses. (b) The estimated number of generations of the beetle each year in different parts of Europe. (a) Distribution potentielk de L. decemlineata en Europe, bake sur les valeurs de I’indice ecoclimatique (EI) de CLIMEX pour le ravageur a des localitks silectionnkes. Chaque valeur EI est indiquee par la dimension du cercle, la valeur zero ttant indiquee par une croix. (b) Estimation du nombre annuel de generations du ravageur dans diffkrentes regions de ]’Europe.
Pest risk model 60 1
Estimated areas of North America with permanent persistence and greater abundance (EI > 0) are shown by the larger circles in Fig. la . Areas which are unsuitable for permanent occupation (EI =0) are shown with crosses. The relative potential for population growth (GI) in different locations, given that the beetle invades or successfully overwinters each year, is shown in Fig. 1 b. The action of climatic limiting factors, estimated during the parameter fitting procedure, is shown in Fig. lc-f.
The beetle was introduced into mainland Europe in 1921 (Bartlett, 1980) and its distribution as recorded in CIE (1962) was restricted in comparison to the potential distribution projected by CLIMEX (Fig. 2a). The estimated number of generations each year in different parts of Europe is shown in Fig. 2b. Validation of the CLIMEX projections was provided by later reports (Hurst, 1975; Aitkenhead, 1981; Piekarczyk & Lipa, 1985) in which the beetle was recorded as having spread into most of the area projected by CLIMEX to be suitable. Exceptions were Sweden and the UK where outbreaks have been eradicated (Gransbo, 1980; Bartlett, 1980; Aitkenhead, 1981). Further confirmation of the CLIMEX projections was provided by the coincidence of the increase and decline of the weekly growth index, GI, for Cherbourg (Fig. 3) and the emergence and cessation of egg laying of the beetle reported by Baker & Cohen (1985).
Having defined and validated the climatic requirements of L. decemlineata, we can now proceed to carry out a pest risk assessment along the lines described by Hopper & Campbell (1989).
Contamination
The likelihood of a given product or vehicle being contaminated by a pest depends on the pest's presence in the region, the season and the treatment received before the shipment left the source country. The presence of the pest and the quarantine efficiency of the countries concerned could be obtained from a Geographic Information System (GIs), while the seasonal suitability of the source can be estimated using CLIMEX. At our given source location, Cherbourg, the seasonal risk
Cherboure -40 2 -30
-20 g :
- 0 k -10
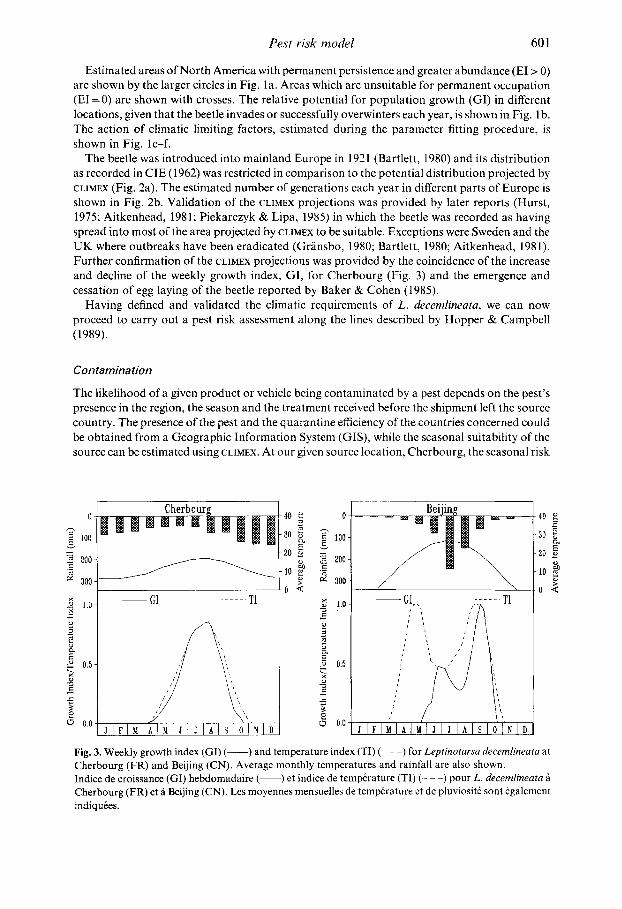
Fig. 3. Weekly growth index (GI) (-) and temperature index (TI) (- - -) for Leptinotarsa decemlineata at Cherbourg (FR) and Beijing (CN). Average monthly temperatures and rainfall are also shown. Indice de croissance (GI) hebdomadaire (-) et indice de temptrature (TI) ( - - -) pour L. decemlineata a Cherbourg (FR) et a Beijing (CN). Les moyennes mensuelles de temperature et de pluviositt sont egalement indiqutes.
602 R. W. Sutherst et al.
of active beetles contaminating agricultural produce in June is shown in Fig. 3 to be very high. With multi-voltine species, the population is likely to build up during the season, hence our intention to build a facility into CLIMEX to allow the multiplication of generations with different values to take account of density-dependent mortality or fecundity.
Transfer
The means of transfer of a pest from the source of infestation to the destination will often be independent of the natural environment, reflecting air travel etc. Several questions arise such as: Is the distance between the source and the destination greater than the natural dispersal range? Are there natural barriers such as oceans or mountain ranges? How long will the journey take in comparison with the survival time of the pest? Is the pest’s host plant or produce being moved? Some such questions could be answered by accessing a Geographic Information System (CIS) but others will need the user to supply the answer in response to questions from an expert system. The relative frequency and direction of natural immigration of airborne species could be predicted with information on wind direction and strength. Long-term trends could readily be stored in the CLIMEX meteorological database.
Introduction and establishment
There are two considerations concerning a species establishing in a new environment. The first is whether it will be able to gain a foothold on introduction and produce a generation of offspring. This will depend on the efficiency of quarantine barriers, the original population size, the availability of suitable host plants and the climate a t and after the time of introduction. The ability of the species to disperse naturally or by human-assisted means will also be important. Of these factors, the species and geographic information can be accessed as above and the seasonal climate can be obtained from CLIMEX.
The weekly G I values for our destination Beijing are shown in Fig. 3. The graph shows that the weekly G I in August in Beijing is 0.4 and increasing rapidly, so the arriving population should be able to multiply before the winter if there are enough day-degrees to complete the life cycle. The Colorado beetle needs 400 day-degrees (Hurst, 1975). CLIMEX computed 500 day-degrees available for the beetle in Beijing between early August and the onset of winter, so the beetle could complete a generation before winter in an average year. However, the beetle will only pose a threat to the Far East if susceptible crops are grown there. As Hare (1990) lists aubergine (Solunum melongena) as a suitable host, the threat posed by the beetle in Asia may be real, depending on the climate in the region which will now be investigated.
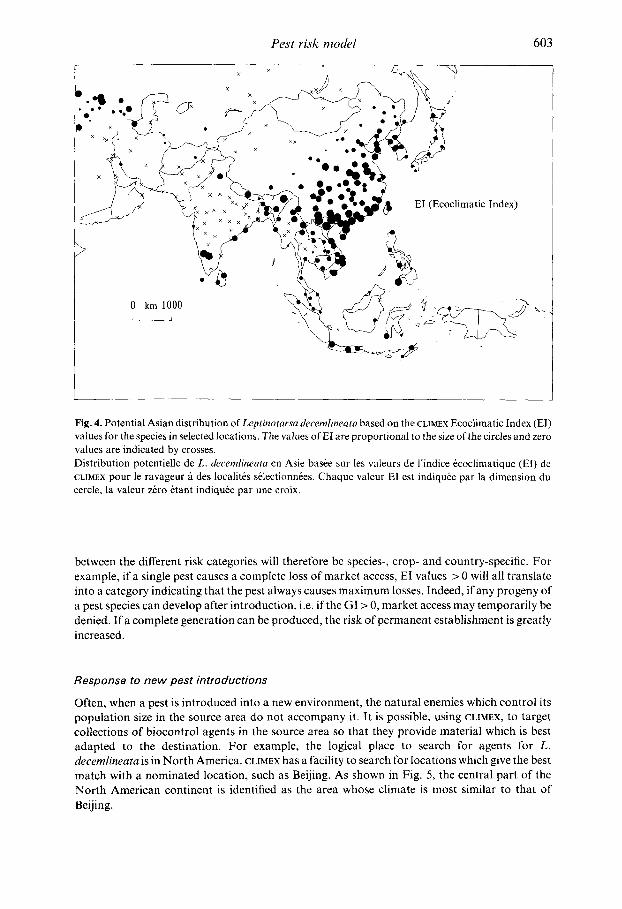
In the event of the pest becoming established at its destination, interest moves to the likelihood of it persisting there and to the extent of the economic damage which the species can be expected to cause to crops in the region. Indicators of these risks are readily accessible from CLIMEX, using the Ecoclimatic Index (EI), which gives a measure of the overall suitability of the destination for the species to propagate and persist over the unfavourable season. As Beijing has an EI > 0, the beetle will most likely be able to persist permanently there, putting the rest of Asia at risk as shown in Fig. 4. The risk could be reassessed under different climate change scenarios using the Greenhouse option in CLIMEX if needed.
Subdivision of a geographical region into risk categories requires information, not only on climatic suitability, but also on the pest status of the species in terins of potential to produce economic damage to a given crop. The EIs can be categorized to reflect Hopper & Campbell’s (1989) classification, i.e. if EI=O, pest cannot survive; if EI= 1-5, pest never causes losses; if EI=6-20, pest sometimes causes losses; if EI>20, pest always causes losses. The actual categories will depend on the different injury and economic thresholds for different species, depending on the type and value of the damage per pest individual. The demarcation points
Pest risk model 603
Fig. 4. Potential Asian distribution of Leptinotarsa decemlineata based on the CLIMEX Ecoclimatic Index (El) values for the species in selected locations. The values of EI are proportional to the size of the circles and zero values are indicated by crosses. Distribution potentielk de L. decemlineata en Asie baske sur les valeurs de I’indice ecoclimatique (EI) de CLIMEX pour le ravageur a des localites selectionnees. Chaque valeur EI est indiqute par la dimension du cercle, la valeur zero ktant indiquie par une croix.
between the different risk categories will therefore be species-, crop- and country-specific. For example, if a single pest causes a complete loss of market access, EI values > 0 will all translate into a category indicating that the pest always causes maximum losses. Indeed, if any progeny of a pest species can develop after introduction, i.e. if the GI > 0, market access may temporarily be denied. If a complete generation can be produced, the risk of permanent establishment is greatly increased.
Response to new pest introductions
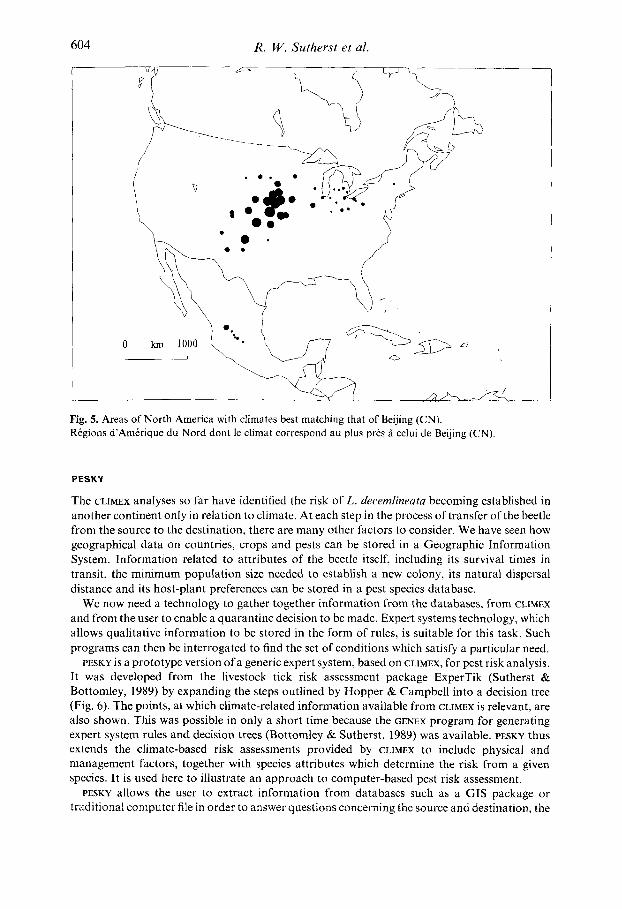
Often, when a pest is introduced into a new environment, the natural enemies which control its population size in the source area do not accompany it. It is possible, using CLIMEX, to target collections of biocontrol agents in the source area so that they provide material which is best adapted to the destination. For example, the logical place to search for agents for L. decemlineata is in North America. CLIMEX has a facility to search for locations which give the best match with a nominated location, such as Beijing. As shown in Fig. 5, the central part of the North American continent is identified as the area whose climate is most similar to that of Beijing.
604 R. W. Sutherst et al.
Fig. 5. Areas of North America with climates best matching that of Beijing (CN). RCgions d’Arnerique du Nord dont le climat correspond au plus pres a celui de Beijing (CN)
PESKY
The CLIMEX analyses so far have identified the risk of L. decemlineata becoming established in another continent only in relation to climate. At each step in the process of transfer of the beetle from the source to the destination, there are many other factors to consider. We have seen how geographical data on countries, crops and pests can be stored in a Geographic Information System. Information related to attributes of the beetle itself, including its survival times in transit, the minimum population size needed to establish a new colony, its natural dispersal distance and its host-plant preferences can be stored in a pest species database.
We now need a technology to gather together information from the databases, from CLIMEX
and from the user to enable a quarantine decision to be made. Expert systems technology, which allows qualitative information to be stored in the form of rules, is suitable for this task. Such programs can then be interrogated to find the set of conditions which satisfy a particular need.
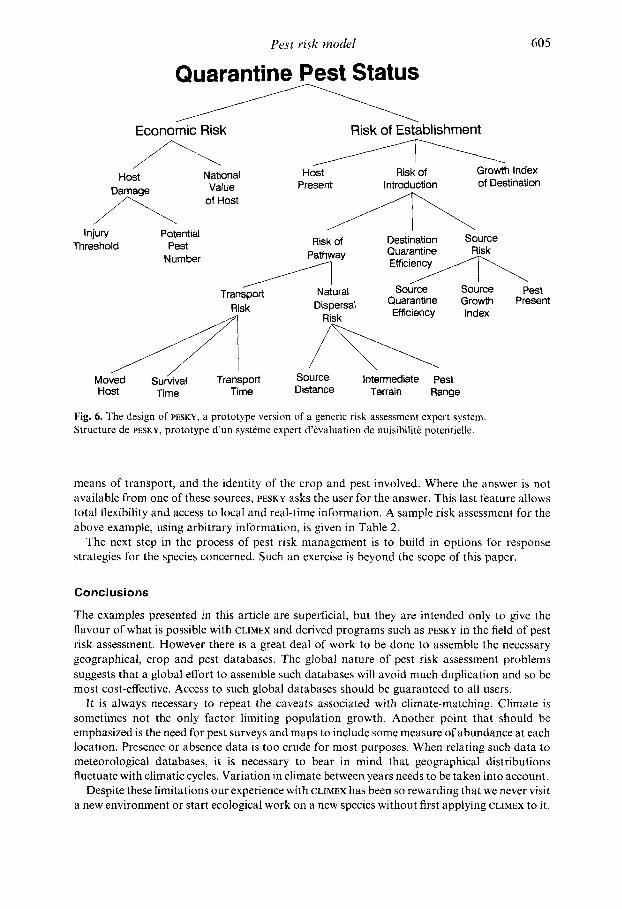
PESKY is a prototype version o f a generic expert system, based on CLIMEX, for pest risk analysis. It was developed from the livestock tick risk assessment package ExperTik (Sutherst & Bottomley, 1989) by expanding the steps outlined by Hopper & Campbell into a decision tree (Fig. 6). The points, a t which climate-related information available from CLIMEX is relevant, are also shown. This was possible in only a short time because the GENEX program for generating expert system rules and decision trees (Bottomley & Sutherst, 1989) was available. PESKY thus extends the climate-based risk assessments provided by CLIMEX to include physical and management factors, together with species attributes which determine the risk from a given species. It is used here to illustrate an approach to computer-based pest risk assessment.
PESKY allows the user to extract information from databases such as a CIS package or traditional computer file in order to answer questions concerning the source and destination, the
Pest risk model
Quarantine Pest Status
Economic Risk 1 Risk of Establishment
605
Growth Index Present Introduction of Destination
National Host Risk of Value
of Host
Host Damage
A Destination Source
Efficiency
Potential
Number
Risk of Threshold Pest Quarantine Pathway
A Injury
A Transport A Natural Source Source pest
Dispersal Quarantine Growth Present Efficiency Index
Moved A k Survival Transport Source Intermediate Pest
Host Time Time Distance Terrain Range
Fig. 6. The design of PESKY, a prototype version of a generic risk assessment expert system Structure de PESKY, prototype d’un systeme expert d’tvaluation de nuisibilitt potentielle.
means of transport, and the identity of the crop and pest involved. Where the answer is not available from one of these sources, PESKY asks the user for the answer. This last feature allows total flexibility and access to local and real-time information. A sample risk assessment for the above example, using arbitrary information, is given in Table 2.
The next step in the process of pest risk management is to build in options for response strategies for the species concerned. Such an exercise is beyond the scope of this paper.
Conclusions
The examples presented in this article are superficial, but they are intended only to give the flavour of what is possible with CLIMEX and derived programs such as PESKY in the field of pest risk assessment. However there is a great deal of work to be done to assemble the necessary geographical, crop and pest databases. The global nature of pest risk assessment problems suggests that a global effort to assemble such databases will avoid much duplication and so be most cost-effective. Access to such global databases should be guaranteed to all users.
It is always necessary to repeat the caveats associated with climate-matching. Climate is sometimes not the only factor limiting population growth. Another point that should be emphasized is the need for pest surveys and maps to include some measure of abundance at each location. Presence or absence data is too crude for most purposes. When relating such data to meteorological databases, it is necessary to bear in mind that geographical distributions fluctuate with climatic cycles. Variation in climate between years needs to be taken into account.
Despite these limitations our experience with CLIMEX has been so rewarding that we never visit a new environment or start ecological work on a new species without first applying CLIMEX to it.
606 R. W . Sutherst et al.
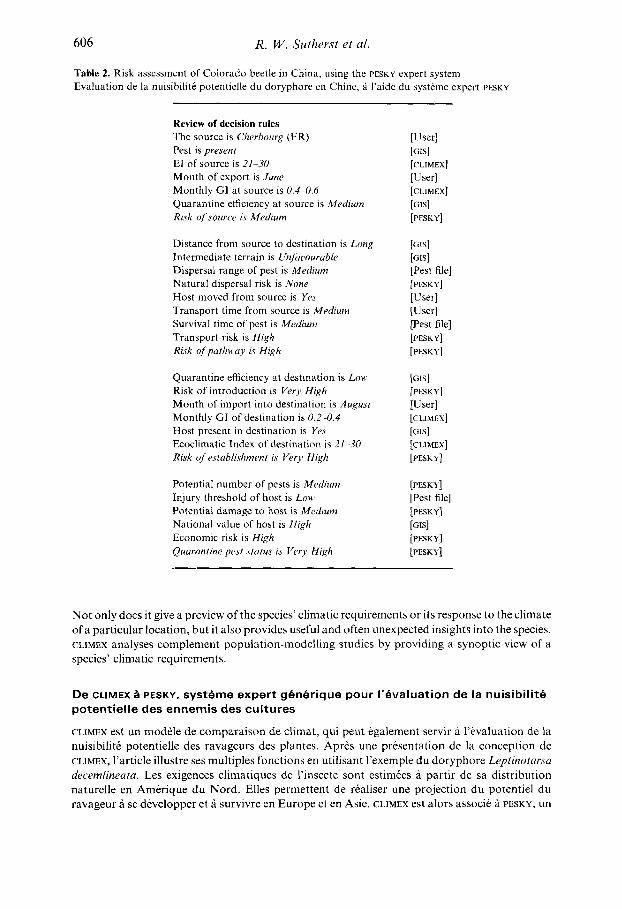
Table 2. Risk assessment of Colorado beetle In China, using the PESKY expert system Evaluation de la nuisibilite potentielle du doryphore en Chine, d I’aide du systeme expert PESKY
Review of decision rules The source is Cherbourg (FR) Pest is present EI of source is 21-30 Month of export is June Monthly GI at source is 0.4-0.6 Quarantine efficiency at source is Medium Risk of source is Medium
Distance from source to destination is Long Intermediate terrain is Unfazlouruble Dispersal range of pest is Medium Natural dispersal risk is None Host moved from source is Yes Transport time from source is Medium Survival time of pest is Medium Transport risk is High Risk of pathway is High
Quarantine efficiency at destination is Low Risk of introduction is Very High Month of import into destination is August Monthly GI of destination is 0.2--0.4 Host present in destination is Yes Ecoclimatic Index of destination is 21-30 Risk of establishment is Very High
Potential number of pests is Medium Injury threshold of host is LON’ Potential damage to host is Medium National value of host is High Economic risk is High Quarantine pest .statu~ is Ver,y High
[User] [as] [CLIMEX] [User]
[GIs1
[CLIMEX]
[PFSKY]
[GIs]
[ a s ] [Pest file]
[User] [User] [Pest file]
[PESKY]
[PESKY] [PESKY]
[GIS]
[PESKY]
[User] [CLIMEX] [GIs] [CLIMEX] [PESKY]
[PESKY] [Pest file]
[GIs1 [PESKY]
[PESKY] [PESKY]
Not only does it give a preview of the species’ climatic requirements or its response to the climate of a particular location, but it also provides useful and often unexpected insights into the species. CLIMEX analyses complement population-modelling studies by providing a synoptic view o f a species’ climatic requirements.
De CLIMEX a PESKY, systeme expert generique pour I’evaluation de la nuisibilite potentielle des ennemis des cultures
CLIMEX est un mod6le de comparaison de climat, qui peut egalement servir a l’evaluation de la nuisibilite potentielle des ravageurs des plantes. Aprhs une presentation de la conception de CLIMEX, I’article illustre ses multiples fonctions en utilisant I’exemple du doryphore Leptinotarsa decemlineata. Les exigences climatiques de l’insecte sont estimees a partir de sa distribution naturelle en Amerique du Nord. Elles permettent de realiser une projection du potentiel du ravageur a se developper et a survivre en Europe et en Asie. CLIMEX est alors associe a PESKY, un
Pest risk model 607
prototype de systeme expert generique d’evaluation de nuisibilite, pour analyser le risque d’introduction du doryphore de France en Chine. Enfin, CLIMEX permet de rechercher en Amerique du Nord les zones dont le c h a t resemble le plus i celui de Beijing (CN), afin d’identifier des agents de lutte biologique contre le doryphore qui conviendraient apres I’eventuelle introduction de l’insecte en Chine.
3 ~ c n e p ~ n a ~ c ~ c ~ e ~ a o 6 ~ e r o x a p a ~ ~ e p a ~ n ~ o ~ e n ~ n c ~ e n e n ~ p ~ c ~ a cenbcKoxo3RilcTBeHnblxBpe~HTeneil
CLIMEX - MOAenb, p a 6 0 ~ a m q a s B COOTBeTCTBHM C KnPiMaTHqeCKHMH OCO6eHHOCTRMH, IIpeDcTa- BJIeHa C TOYKH 3peHMR IIpHMeHeHHR RnR OUeHKH YTP03bI BPeAHTWIea CenbCKOX03RfiCTBeHHbIX KYJIbTYP. PaCCMaTpHBaeTCR IIpkiHqHn OPTaHH3aUHk1 MOAenM, a ee B03MOXHOCTH HJIJI€OCTp€4pJWTCR
JIbHbIe RnR HaCeKOMOrO KnUMaTWIeCKkie (PaKTOPbI yCTaHOBneHb1 HCXOAR 113 er0 eCTeCTBeHHbIX
B03MOXHOCTb pa3BPiTMR €4 YBeJIHYeHHR nnOTHOCTM IIOIIynRqMfi BPeAIlTenR B EBpone H ASEM. DnR
CTaBneHa B COYeTaHIlR C PESKY, npOTOTMIIOM 3KCIIepTHOfi CHCTeMbl o6qero XapaKTepa RnR O q e H K H CTeIIeHH PHCKa BpeAHTenek ki, HaKOHeq, MOAenb CLIMEX n03BOnReT nOKanH30BaTb B CeBepHOfi AMepMKe PafiOHbI, CXOaHbIe no KnHMaT€49eCKBM yCJIOBk1RM C neKHHOM, A n R TOFO YT06bI YCTaHOBHTb CpeRCTBa 6 ~ o n o r a q e c ~ o B 60pb6bI C KOJIOpaACKHM XYKOM, C TeM YTO6bI MCnOJIb30BaTb
npnMepaMn, B vacmocm, ~ 3 1 1 ~ cnyqaii KonopancKoro XyKa, Leptinotarsa decemlineata. OnTmia-
ycnosar? cyqecTBosaHm B CesepHo6 AMepHKe, nocne qero npeAnonaraeTcR noTeHqnanbHaR
atranma BepoaTHocw 3a~o3a KonopaAcKoro xyKa B &man k13 QpaHqHki MoAenb CLIMEX ripen-
B cnyqae 3a~o3a HaceKoMoro B Kmafi.
References
AITKENHEAD, P. (1981) Colorado beetle-recent work in preventing its establishment in Britain. Bulletin OEPPIEPPO Bulletin 11, 225-234.
BAKER, C.R.B. & BAILEY, A.G. (1979) Assessing the threat to British crops from alien diseases and pests. In Plant Health: The Scientlfic Busi.yfor Admintrtratiw Control of P h t Diseuse.s and Pests (eds Ebbels, D.L. & King, J.E.), pp. 43-54. Blackwell, Oxford (GB).
BAKER, C.R.B. & COHEN, L.I. (1985) Further development of a computer model for simulating pest life cycles. Bulletin OEPP/EPPO Bulletin 15, 3 17-324.
BARTLETT, P.W. (1980) Interception and eradication of Colorado beetle in England and Wales, 1958-1977. Bulletin OEPP/EPPO Bulletin 10,481-489.
BOTTOMLEY, W. & SUTHERST, R.W. (1989) GENEx: a computer program which generates rules for an expert system. In Proceedings of the Simulation Society of AustruliailMACS 8th Biennial Conference, pp. 104 ~
110. CIE (1962) Distribution Maps of Pests no. 139. CAB International, Wallingford (GB). GRANSBO, G. (1980) Control measures towards Colorado beetle eradication in Sweden. Bulletin OEPPi
HARE, J.D. (1990) Ecology and management of the Colorado potato beetle. Annual RerieLr, ento tom dog?;
HOPPER, B.E. & CAMPBELL, W.P. (1989) Crop protection information needs: a NAPPO perspective. In Crop Protection Information: an International Perspectitse (eds Harris, K.M. & Scott, P.R.), pp. 225-233. CAB International, Wallingford (GB).
HURST, G.W. (1975) Meteorology and the Colorado potato beetle. W M O Technical Note no. 137. WMO, Geneva (CH).
WALKER, J.B. & IRVIN, A.D. (1990) Geographical information systems for studying the epidemiology of cattle diseases caused by Theileriu parca. Veterinary Record 126, 255-262.
MAYWALD, G.F. & SUTHERST. R.W. (1989) CLIMEX: recent developments in a computer program for comparing climates in ecology. In Proceedings of the Simulation Sociery of Au.ciraliu/lMACS 8th Biennial Conference, pp. 134-140.
MAYWALD, G.F. & SUTHERST, R.W. (1991) User’s guide to CLIMEX a computer program for comparing climates in ecology (2nd ed.). CSIRO Australia Diuisivn q/Entornology Report no. 48, 1-51.
EPPO Bulletin 10, 499-505.
35,81-100.
LESSARD, P., LEPLATTENIER, R., NORVAL, R.A.I., PERRY, B.D., KUNDERT, K., DOLAN, T.T., CKOZE, H.,
608 R . W. Sutherst et al.
MEATS, A. (1981) The bioclimatic potential of the Queensland fruit fly, Dacus tryoni, in Australia. Proceedings of the Ecological Society of Australia 11, 151-161.
PIEKARCZYK, K. & LIPA, J.J. (1985) Recent situation of the Colorado beetle (Leptinofrrrsa decemlineata) in Poland. Bulletin OEPP/EPPO Bulletin 15, 3 11-3 16.
SOUTHWOOD, T.R.E. (1977) Habitat, the templet for ecological strategies? Journal <$ Aninial Ecology 46, 337-365.
SUTHERST, R.W. & BOTTOMLEY, W. (1989) ExperTik: experiences in the development of an expert system for pest management. In Proceedings of the Sirnulalion Society of AustralialIMACS 8th Biennial Conference, pp. 1 17-1 22.
SUTHERST, R.W. & MAYWALD, G.F. (1985) A computerized system for matching climates in ecology. Agriculture, Ecosystems and Environment 13, 28 1-299.
WORNER, S.P. (1988) Ecochmdtic assessment of potential establishment of exotic pests. Journal of Economic Entomology 81, 973-983.
.