from customized cellular adhesion to synthetic ecology ... · from customized cellular adhesion to...
TRANSCRIPT

From Customized Cellular Adhesion to Synthetic Ecology: Characterizing the
Cyanobacterium Synechocystis PCC 6803 for Biofuel Production
by
Rebecca Allen
A Dissertation Presented in Partial Fulfillment
of the Requirements for the Degree
Doctor of Philosophy
Approved November 2016 by the
Graduate Supervisory Committee:
Roy Curtiss III, Co-Chair
Rosa Krajmalnik-Brown, Co-Chair
Bruce Rittmann
Willem Vermaas
ARIZONA STATE UNIVERSITY
December 2016

i
ABSTRACT
Sustainable global energy production is one of the grand challenges of the 21st
century. Next-generation renewable energy sources include using photosynthetic
microbes such as cyanobacteria for efficient production of sustainable fuels from
sunlight. The cyanobacterium Synechocystis PCC 6803 (Synechocystis) is a genetically
tractable model organism for plant-like photosynthesis that is used to develop microbial
biofuel technologies. However, outside of photosynthetic processes, relatively little is
known about the biology of microbial phototrophs such as Synechocystis, which impairs
their development into market-ready technologies. My research objective was to
characterize strategic aspects of Synechocystis biology related to its use in biofuel
production; specifically, how the cell surface modulates the interactions between
Synechocystis cells and the environment. First, I documented extensive biofouling, or
unwanted biofilm formation, in a 4,000-liter roof-top photobioreactor (PBR) used to
cultivate Synechocystis, and correlated this cell-binding phenotype with changes in
nutrient status by developing a bench-scale assay for axenic phototrophic biofilm
formation. Second, I created a library of mutants that lack cell surface structures, and
used this biofilm assay to show that mutants lacking the structures pili or S-layer have a
non-biofouling phenotype. Third, I analyzed the transcriptomes of cultures showing
aggregation, another cell-binding phenotype, and demonstrated that the cells were
undergoing stringent response, a type of conserved stress response. Finally, I used
contaminant Consortia and statistical modeling to test whether Synechocystis mutants
lacking cell surface structures could reduce contaminant growth in mixed cultures. In
summary, I have identified genetic and environmental means of manipulating

ii
Synechocystis strains for customized adhesion phenotypes, for more economical biomass
harvesting and non-biofouling methods. Additionally, I developed a modified biofilm
assay and demonstrated its utility in closing a key gap in the field of microbiology related
to axenic phototrophic biofilm formation assays. Also, I demonstrated that statistical
modeling of contaminant Consortia predicts contaminant growth across diverse species.
Collectively, these findings serve as the basis for immediately lowering the cost barrier of
Synechocystis biofuels via a more economical biomass-dewatering step, and provide new
research tools for improving Synechocystis strains and culture ecology management for
improved biofuel production.

iii
DEDICATION
I dedicate this dissertation to my grandmother, Shirley Dudas, with all my love.

iv
ACKNOWLEDGMENTS
First I would like to thank my two thesis co-advisors, Dr. Roy Curtiss III and Dr.
Rosa Krajmalnik-Brown, for taking a chance on an unknown student, an untested topic,
and an unfamiliar collaboration as co-advisors together. It’s really a testament to you that
you took on this endeavor with me, especially considering this work was not tied directly
to your existing research grant portfolios. It was truly an honor for me to be accepted as
your PhD student, and given a science home with your research groups. I also want to
thank my committee members, Dr. Bruce E. Rittmann and Dr. Willem Vermaas, for
sharing their excellence in their respective fields to help move this project forward. All
four of you were part of creating a world-class research environment for industrial-scale
microbial biofuel production that was a dream come true for me. Having the chance to
make connections by doing rotations in all of your labs, and being a part of this research
program at ASU was such an incredible opportunity for a graduate student. I am sure that
I will continue to reap the rewards of that experience for the rest of my scientific career.
I want to thank my fellow lab members, especially my co-authors including Dr.
Michael Fisher and Dr. Alex Zevin for collaborating with me, and the very kind and
generous people that took time to help me even though we weren’t working on the same
project, like Michelle Young, Dr. Michal Ziv-El, Dr. Wei Kong, Toby Gates, Dr. Hyun-
Woo Kim, Josh McIlwain, and others. My fellow students and teachers in the Biological
Design Graduate Program, who are a constant source of inspiration for their consistently
high standards as scientists and individuals. My very dear and tremendously talented
friends: Myonnie Bada-Albrecht, Katie Baker, Eric Templeton, and most especially,
René Daer, my fellow grad school soldier-at-arms, for their advice and encouragement,

v
and believing in me as a person and a scientist, and making me laugh. I literally could not
have done this without them. I also want to thank the brilliant online community of
feminists at Autostraddle.com, for helping me maintain good mental and social health
while navigating the patriarchy during grad school. They were essential, too.
I would like to acknowledge some very important teachers that made it possible
for me to join a PhD program. The Brun Lab at Indiana University, Bloomington was an
incredibly valuable training ground. Their excellence made it possible for me to be a truly
independent researcher at ASU. My chemistry teacher, Dr. William Lamb, for taking a
chance on allowing me into his independent research program in high school, and being
such a phenomenal educator. The Oregon Museum of Science and Industry, especially
the Demonstrator team led by Lynn Vanderkamp. My family, for encouraging me to get
an education. Although it’s unusual to do so, I am sincere in also thanking tax payers for
making it possible for people like me from a working-class background to earn a PhD,
become a member of a community of scholars, and try to make a better life.
Finally, I want to give the Arthur Ashe Leadership Award to Carole Flores and
Maria Hanlin. Arthur Ashe said that true leadership* isn’t the urge to surpass others at
whatever cost, but the urge to help lift others up. A lot of times, people don't receive
appreciation until after they have already succeeded, when it’s the people who haven’t
succeeded yet that benefit the most from encouragement. Carole and Maria are my role
models for their skill in this area of leadership, and I will do my best to emulate their
example in the future. I went many years at ASU before I started to have some success,
and their kindness and encouragement during those long years made a huge difference to
me, as I’m sure it did to many others. (*He said heroism, but leadership works too).

vi
TABLE OF CONTENTS
Page
LIST OF TABLES ................................................................................................................... ix
LIST OF FIGURES .................................................................................................................. x
LIST OF ABBREVIATIONS ............................................................................................... xii
CHAPTER
1 INTRODUCTION .................................................................................................1
Motivation and Historical Socio-Technological Perspective...........................1
Dissertation Objectives and Outline ................................................................4
2 BACKGROUND: TOWARDS A MODEL ORGANISM FOR AXENIC
PHOTOTROPHIC BIOFILM FORMATION .......................................................9
Phototrophic Biofilms Are Relevant to Ecology and Biotechnology ..............9
Features of Heterotrophic Bacterial Biofilm Formation Are Conserved ......12
Environmental and Molecular Signals for Inducing Biofilm Formation .......13
Mechanisms of Attachment Require Cell Surface Structures ........................15
Towards a Model Organism for Axenic Phototrophic Biofilm Formation ....15
3 SYNECHOCYSTIS PCC 6803 FORMS AXENIC BIOFILMS AND
AGGREGATES, WHICH REQUIRE CELL SURFACE STRUCTURES
AND ARE INDUCED BY CHANGE IN NUTRIENT STATUS .......................17
Introduction ....................................................................................................17
Materials and Methods ...................................................................................25
Results and Discussion ..................................................................................34
Conclusion .....................................................................................................50

vii
CHAPTER Page
4 COMPARATIVE TRANSCRIPTOMICS SUGGEST THAT
AGGREGATION BY SYNECHOCYSTIS PCC 6803 IS CORRELATED
WITH STRINGENT RESPONSE IN THE LIGHT ............................................55
Introduction ....................................................................................................55
Materials and Methods ...................................................................................61
Results and Discussion ..................................................................................63
Conclusions ....................................................................................................69
5 SYNTHETIC ECOLOGY FOR QUANTITATIVE PREDICTION OF ANTI-
CONTAMINATION STRATEGIES IN BIOFUEL-PRODUCING
CULTURES OF SYNECHOCYSTIS PCC 6803 ..................................................73
Introduction ....................................................................................................73
Materials and Methods ...................................................................................75
Results and Discussion ..................................................................................88
Conclusions ..................................................................................................107
6 SUMMARY, PERSPECTIVE, AND OUTLOOK ............................................112
Research Trajectory and Decision Checkpoints ......................................... 112
Interpretation of Findings in the Context of Current Paradigms of
Heterotrophic Bacterial Biofilm Formation .................................................117
Follow-Up Studies to Extend The Most Significant Findings of
This Research ..............................................................................................118
WORKS CITED ......................................................................................................123

viii
APPENDIX Page
A TABLES OF GENE EXPRESSION DATA FOR CHAPTER 3 ............147
B SUPPLEMENTARY FIGURES ..............................................................171

ix
LIST OF TABLES
Table Page
3.1 List of Strains and Plasmids Used in This Study .......................................... 39
3.2 List of Primers Used in This Study ................................................................. 40
5.1 Central Composite Design of a 23 Full Factorial Augmented With Center
Points and Axial Points ...............................................................................80
5.2 Optiplot Heterotroph Growth Response Predictions From Regression .......82
5.3 Kegg Ortholog Trait Markers and Their Phylogenic Distribution .............102
A.1 Differentially Expressed Genes Grouped By Categories of
Gene Function ...........................................................................................148
A.2 All Synechocystis Genes Predicted to be Up-Regulated During
Stringent Response. ...................................................................................166
A.3 All Synechocystis Genes Predicted to be Down-Regulated During
Stringent Response ....................................................................................169

x
LIST OF FIGURES
Figure Page
3.1 Macroscopic Biofilm Formation by Synechocystis Cultures in
Outdoor PBR ...............................................................................................35
3.2 Adapted Crystal Violet Assay Shows Axenic Biofilms Require
Change in Nutrient Status. ..........................................................................37
3.3 Microscopy Confirms That Absorbance Measured In Crystal Violet
Assay is Cells and Extra-cellular Material. ..................................................38
3.4 S-Layer and Pili are Required for Biofilm Formation by Synechocystis .....41
3.5 Co-Culture of Axenic P. Putida and Synechocystis Forms Dual-Species
Biofilms .......................................................................................................43
3.6 Wild-Type Aggregation Requires Cellular Energy; is Induced by
Change in Nutrient Status ...........................................................................45
3.7 Cell Surface Structures Modulate Synechocystis Aggregation ....................48
3.8 SDS-PAGE of Outer Membrane Proteins Shows No Difference Between
Aggregated and Un-Aggregated Cultures ...................................................49
3.9 Cellulase Treatment Does Not Disperse Aggregated Synechocystis Cells ..50
4.1 Incidence of Synechocystis Genes Predicted to be Differentially
Expressed During Stringent Response, Grouped by Condition ...................65
5.1 Model Consortia Capture Most Phyla Identities but Not Relative
Abundances of Related Populations. ...........................................................89
5.2 Regression Model Predicts Heterotroph Growth of Diverse Consortia in
LB Media.....................................................................................................91

xi
Figure Page
5.3 Surface Response Plot of Interaction Between NaCl and Kanamycin.........95
5.4 Laurate Time-Course Assay Using Defined Consortium 1 in
Synechocystis Supernatants ........................................................................ 96
5.5 Amount of Consortia Growth is the Same in Wild-Type and Mutant
Synechocystis Supernatants .........................................................................97
5.6 Community Structure of Consortia From Laurate Time-Course Assay .....100
5.7 PICRUSt Data of Community Function of Consortia From Laurate
Time-Course Assay ....................................................................................103
B.1 Genes for S-Layer, Wza are Not Required For Phototactic Motility ........172
B.2 STRING Occurrence View Output for NhaA ............................................173
B.3 Weighted Average Number of KEGG Markers per Growth Condition .....174
xii
LIST OF ABBREVIATIONS
AHL Acyl homoserine lactone
ANOVA Analysis of variance
BLAST Basic localized alignment search tool
BCA Bicinchoninic acid assay
c-di-GMP cyclic diguanylate monophosphate
DC1; DC2 Defined Consortium 1; Defined Consortium 2
DCMU 3-(3,4-dichlorophenyl)-1,1-dimethylurea
ECM Extracellular matrix
EPS Exopolysaccharide
FPKM Fragments per kilobase of transcript per million reads
FWLSD Fresh water lake sequence database
GC Gas chromatography
Kan Kanamycin sulfate
KEGG Kyoto encyclopedia of genes and genomes
LB Lysogeny broth
LPS Lipopolysaccharide
NC1; NC2 Negative Control 1; Negative Control 2
OM Outer membrane
ORF Open reading frame
OTU Operational taxonomic unit
PBR photobioreactor

xiii
PICRUSt Phylogenetic investigation of communities by reconstruction of
unobserved states
(p)ppGpp guanosine polyphosphate
QIIME Quantitative insights into microbial ecology
RIN RNA integrity number
RPS Released polysaccharide
RSH RelA/SpoT homolog
SDS-PAGE Sodium dodecyl sulfate polyacrylamide gel electrophoresis
SMP Soluble microbial products
STRING Search tool for retrieval of interacting genes/proteins
SR Stringent response
TCW Tempe Canal water
TR1;TR2 Treatment 1; Treament 2
UC1; UC2 Undefined Consortium 1; Undefined Consortium 2
WT wild-type

1
CHAPTER 1
INTRODUCTION
1.1 Motivation and historical socio-technological perspective
Across the entire course of prehistory, and throughout subsequent civilization,
humans have been influenced by the activities of microbes along two major trajectories:
enduring the negative effects of infectious diseases, and enjoying the benefits of
microbial processes for sustainable food, health, and environment. In the present day,
these influences continue, and frequently overlap, in the formal study of microbiology.
That these opposing influences share common ground can be partly attributed to the
fundamental nature of microbes such as bacteria, which is to combine an enormous
diversity of metabolic processes and capabilities across species, while reusing the
structural design of a single membrane-bound cell. Such physical and organizational
constraint drives extreme efficiency, including reusing subcellular structures that are
shared across microbial species and passed down along generations. Thus the ability and
mechanisms of bacteria to colonize a surface, for example, is equally relevant to
pathogenesis of an unfortunate human host, or increasing yields of farmer’s crops by
colonizing and fertilizing plant rood nodules.
Inspiration is an important driver of scientific progress; nature-inspired design has
as much relevance today as it did when Leonardo Da Vinci built flying machines in the
shape of a bird’s wings. Nature’s first engineers were microbes: the twentieth century
marked the beginning of the first golden age of molecular biology, and enabled
researchers for the first time to directly use molecular tools evolved by microbes billions
of years ago in order to address technological challenges facing society. A relatively

2
recent example includes the isolation of extremophiles such as Thermus aquaticus by
Thomas Brock and his undergraduate student, Hudson Freeze, of Indiana University,
Bloomington. They isolated this thermophile from hot springs at Yellowstone National
Park, and it was used to produce the source of heat-stable DNA Taq polymerase, which
was key to the advancement of the polymerase chain reaction (PCR), the single most
widely used procedure in molecular biology. This single innovation enabled PCR to
become an automated high-throughput process, which was a crucial lynchpin in the
development of genomics, bringing with it the second golden age of molecular biology in
the 21st century (10) (9).
Since the discovery of Thermus aquaticus, many more microbes been isolated that
have remarkable capabilities to grow in extreme environments, such as in conditions
nearly 20 times as salty as the ocean, in radioactive waste that is 3000 times the strength
of the lethal human dose, and in acid so strong it measures pH 0 (11). Bacteria and other
microbes have been solving difficult chemical engineering challenges for billions of
years in order to survive harsh environments during the course of evolution. They are
also uniquely suited to solve one of the grand challenges of the 21st century: that of a
sustainable global energy supply (12). According to the U.S. Energy Information
Administration’s International Energy Outlook for 2016, the global population will
increase to 9 billion by 2050, driving energy use up by 40% (13). In order to meet this
new energy demand, 26 trillion dollars of investment in new energy infrastructure must
be developed, and will result in a atmospheric carbon dioxide concentration of 1000 ppm,
over twice the level recommended by the International Panel on Climate Change. In
addition, new oil fields will be smaller and fewer, and therefore new petroleum will be
3
derived from oil shale, or by converting coal and natural gas into liquid fuels, further
driving up prices of fuel as well as basic necessities like food and clean water.
In the modern era, renewable energy has become essential to a sustainable food
supply, adding energy to the services that microbes provide to society as part of our basic
sustenance. Abiotic processes have recently been developed that enable direct conversion
of CO2 to ethanol at 63% yield using only a small amount of electricity-driven catalyst
(14), but it is unclear whether this nanotechnology will be scalable to industrial levels.
However, evidence in the fossil record shows that microbial phototrophs have a proven
ability to consume carbon dioxide and produce liquid fuel on a global scale: most crude
oil and other fossil fuels are derived from ancient algae and other photosynthetic
microbes that formed massive blooms in bodies of water hundreds of millions of years
ago. Furthermore, the first living organisms to cause global climate change were these
same photosynthetic microbes, driving the oxygenation of the earth’s atmosphere, and
greatly increasing the mineral diversity of the Earth’s crust (15).
Researchers in labs around the world are therefore investigating the use of
photosynthetic microbes such as cyanobacteria to make renewable, carbon-neutral
biofuels (16). However, historically, research of phototrophic organisms lags behind that
of microbial pathogens. For example, the cyanobacterium Prochlorococcus marinus, on a
per-organism basis, is estimated to be the most abundant species on Earth, and produces
about 20% of the world’s oxygen, in addition to being a major contributor to the global
carbon cycle. Yet despite its importance and its ubiquity, Prochlorococcus was not
discovered until 1991 (17). These relative priorities are maintained today, as can be seen
in the percentage of genome and meta-genome sequencing projects related to medicine

4
(47.5%) compared to environmental microbiology (7.9%) on the Genomes Online
Database (18), a storehouse of sequence information for 250,000 different organisms
(including a minority of non-microbial species).
1.2 Dissertation objectives and outline
Knowledge gaps in our understanding of the basic microbiology of phototrophs
are one of the bottlenecks that need to be addressed in order to bring microbial biofuel
production to market. My research objectives in this dissertation aim to address strategic
questions about the basic microbiology of the cyanobacterium Synechocystis, as detailed
below and in the following outline of each chapter. A common theme throughout these
chapters is the importance of the defining feature of all cells, namely, the cell wall. This
feature separates the cell’s inner contents from its outside boundary, regulates its
interaction with other cells and the environment, and can serve as a reservoir of nutrients
such as fixed carbon, among other functions, all of which are relevant to biofuel
production in phototrophic microbes like Synechocystis (19).
Starting at the cell surface, my objective was to characterize the genetics and
physiology of biofilm formation by Synechocystis, to determine how cells of a single
phototrophic species interact with each other, and with abiotic surfaces such as glass and
plastic, which are frequently used materials to culture microbial biofuel feedstocks. I
chose to focus on biofilms due to their relevance to basic science and to biofuel
applications, as described in more detail in the Background section. Next, I investigated
differential regulation of the transcriptome in aggregated and unaggregated Synechocystis
cultures in order to correlate regulatory networks on the inside of the cell with adhesion
phenotypes on the outside of the cell. Finally, I investigated whether altered

5
Synechocystis cell surface phenotypes may improve biofuel yield at the scale of microbial
populations by studying mixed-species cultures. I specifically tested whether
Synechocystis mutants correlated with increased biofuel yield by reducing the ability of
heterotrophic bacterial contaminants to grow in Synechocystis cultures.
A summary of each of these research aims is described for each Chapter in more
detail below. In Chapter 3, I report that biofuel-producing cultures of Synechocystis
underwent extensive biofouling of a large, outdoor photobioreactor under conditions
correlated with nutrient limitation. I hypothesized that phototrophic bacteria such as
Synechocystis are able to form axenic biofilms, and use cell surface structures such as
pili, S-layer, and exopolysaccharides (EPS) to attach and adhere to surfaces, similar to
other biofilm-forming heterotrophic bacteria. I developed a modified crystal violet assay
and found that axenic wild-type (WT) Synechocystis forms biofilms of cells and extra-
cellular material when shifted to altered nutrient conditions. Axenic WT Synechocystis
does not form biofilms in nutrient-replete medium (BG11). Also, unlike WT
Synechocystis, mutants lacking genes required for synthesis of cell surface structures such
as type IV pili and the S-layer do not form biofilms under altered nutrient status. I
conclude that pili and the S-layer are necessary but not sufficient for biofilm formation by
Synechocystis: an additional adhesion-mediating factor must be induced, such as through
dilution of growth medium, in order for pili and S-layer to facilitate biofilm formation.
To further elucidate the molecular mechanisms of cell-cell binding by
Synechocystis, I developed an aggregation assay and found that both pili and the S-Layer
were required for consistent aggregation, but mutants lacking wza, a gene required for
exopolysaccharide production in Synechocystis, has a super-binding phenotype. I

6
compared outer membrane (OM) fractions of WT and mutant cultures under treatment
and control conditions for aggregation. Coomassie stain of SDS-PAGE of these OM
proteins showed no difference in protein profiles, and preliminary data suggest
aggregated cells were not dispersed by treatment with cellulase. Overall, these data
support that the molecular mechanism for aggregation by WT Synechocystis is synthesis
and/or modification of cell surface structures by non-protein adhesive molecules in
response to environmental stimuli inducing aggregation, such as change in growth
medium status. In summary, I report that Synechocystis is a good candidate for a model
organism for axenic phototrophic biofilm formation, and describe two new rapid,
ecologically-relevant assays for further development of this area of study. I demonstrate
the utility of these assays in identifying non-biofouling mutant strains of Synechocystis,
and identifying environmental signals for rapid aggregation of wild-type Synechocystis
biomass; both useful phenotypes for biofuel applications.
In Chapter 4, I investigated the relationship between aggregation and stress
response in Synechocystis. The paradigm for bacterial aggregation is that it is an adaptive
response to environmental stress. Both cellulose-dependent aggregation and stringent
response (SR), a type of stress response, are widely conserved bacterial phenotypes that
can be induced by nutrient limitation and other environmental signals; however, they use
distinct regulatory pathways coordinated by different secondary messengers (c-di-GMP
and (p)ppGpp, respectively). It may therefore be possible for bacteria to coordinate these
two phenotypes separately, for example undergoing SR without aggregation, or vice
versa. Previous studies of photosynthetic bacteria such as the cyanobacterium
Synechococcus elongatus and the alpha-proteobacterium Rhodobacter sphaeroides

7
demonstrate that SR occurs upon shift to dark conditions. Additionally, several
cyanobacterial species, including Synechocystis, have been shown to use c-di-GMP-
dependent aggregation. I sought to better understand the possible role of SR in
Synechocystis aggregation. Here I report preliminary data from RNA sequencing
supporting the conclusion that aggregated cultures of Synechocystis have undergone SR.
Additionally, aggregation has been shown to be a light-dependent process in
Synechocystis; my data support that aggregated cells have not undergone SR from dark
conditions such as self-shading during aggregation. This represents the first known
evidence of SR correlated with aggregation in cyanobacteria, and the first report using an
environmental signal other than darkness to induce SR in cyanobacteria. I summarized
my findings by highlighting implications of the relationship between aggregation and SR
on cyanobacterial lifestyle and application, such as sedimentation and biofuel production.
In Chapter 5, I assessed the microbial ecology of the photobioreactor (PBR).
Synechocystis was previously engineered to secrete elevated levels of long-chain fatty
acids such as laurate, a jet fuel precursor (20). An outdoor 4,000-liter PBR of
Synechocystis culture that became contaminated by heterotrophic bacteria had reduced
yield of fatty acids. Current practice for maintaining very large outdoor monocultures
include use of chemical additives (salinity, alkalinity, and antibiotics) to create selective
growth conditions for crop protection, including microalgae. I hypothesized that using
additives well-tolerated by Synechocystis, such as salt, alkalinity and/or antibiotic, would
inhibit growth of heterotrophic bacteria (heterotrophs) while allowing Synechocystis to
flourish, improving biofuel yields. In the current study, I used regression analysis to make
quantitative predictions of heterotroph growth in response to levels of added salinity,

8
alkalinity, and the antibiotic kanamycin in LB liquid media and also in Synechocystis
supernatants. Defined Consortia of heterotrophs that included laurate-consuming species
isolated from PBRs and also freshwater sources were used to reproducibly simulate the
PBR contaminome under controlled laboratory conditions.
In LB liquid media, heterotroph growth responses were accurately predicted by
levels of these three additives (NaCl, pH, and kanamycin) across diverse Defined and
Undefined Consortia. In Synechocystis supernatants, presence of additives was able to
protect laurate for over 72 hours by suppressing heterotroph growth. High-throughput
16S rRNA gene sequencing and PICRUSt metagenomic analysis (Phylogenetic
Investigation of Communities by Reconstruction of Unobserved States) of Defined and
Undefined Consortia growth were consistent with predictions that abundant contaminant
taxa grown in presence of additives belong to an unrelated guild of phylotypes carrying a
common ‘minimum core’ of 7 different adaptive trait marker genes conferring tolerance
or adaptation to these three additives; abundant taxa in negative control samples had
fewer and/or absent resistance trait genes. I concluded that this pilot study supports use of
this modular platform of statistical modeling, sequence analysis, and artificial Consortia
to quantitatively model bacterial contamination and biofuel productivity of PBRs under
controlled conditions.
In Chapter 6, I summarized my findings and outline the implications of this work.
I identify several high-priority studies to advance the most significant of these findings.

9
CHAPTER 2
BACKGROUND: TOWARDS A MODEL ORGANISM FOR AXENIC
PHOTOTROPHIC BIOFILM FORMATION
2.1. Phototrophic biofilms are relevant to ecology and biotechnology
There are many more bacteria on Earth than there are stars in the known universe
(21); most of them exist in multi-cellular communities called biofilms (22). Mixed-
species phototrophic biofilms (containing heterotrophs and phototrophs) contribute to
global nutrient cycling in terrestrial and aqueous environments (23-28). Phototrophs
occur in all three domains of life, including diverse phyla distributed across the bacterial
domain: Proteobacteria (purple sulfur and non-sulfur bacteria), Chloroflexi and Chlorobi
(green sulfur and non-sulfur bacteria), Cyanobacteria (oxygenic phototrophs), Firmicutes
(Heliobacteria), and Acidobacteria; each of these bacterial phyla have been identified in
mixed biofilm communities (29-34). Among phototrophs, members of phylum
Cyanobacteria are noteworthy both as primary producers capable of carbon and nitrogen
fixation, and for their prevalence in biofilms across time and space. Contemporary
stromatolites in Shark Bay, Australia and a few other locations (35-37) are cyanobacteria-
containing microbial mats that mineralize carbonate as part of their metabolic activities
(lithification). They are of particular importance to understanding how biogeochemical
cycles were established on early Earth, as they occur prominently in the fossil record at
least 3.4 billion years ago (15, 38-40) (although recent genomic evidence indicates these
were likely ancestors of cyanobacteria that predate the evolution of oxygenic
photosynthesis (41)). Additionally, the incidence of cyanobacteria in surface-associated
consortia from extreme environments including hot springs (28), hyper-saline lakes (42),

10
desert crusts (43-45), and outside the International Space Station and simulated Mars
surface conditions (46-48) support their relevance to astrobiological studies.
The ability of phototrophic biofilms to cycle carbon and other nutrients has
obvious applications for bioremediation and bioenergy applications. Compared to
traditional photobioreactors (PBRs), where cells remain suspended in culture, biofilm
PBRs were over three times more efficient at removing sulfate from waste water effluent
(49). Likewise, hydrogen production by biofilm PBRs was 25 times more efficient than
traditional PBRs (50). However, in traditional PBRs or open ponds, unwanted biofilm
formation (termed biofouling) can interfere with flow of growth medium, immersed
sensor function, and light penetration. Studies of marine environments have shown that
biofouling in the photic zone is dominated by phototrophs (51). Biofouling
countermeasures in open ponds include plastic polyvinylchloride liners and raceway
flushing, with limited success (52). Current practice to mitigate industrial-scale
biofouling use biocides such as copper-containing paints for the hulls of ships; the
environmental toxicity of heavy metals is driving research into alternatives including less
toxic chemical paint additives (53-56). Knowledge of genetic and molecular mechanisms
of biofilm formation by phototrophs would enable rational engineering of strains with
customized adhesive properties, such as non-biofouling strains for traditional cultivation
systems, or enhanced performance of biofilm PBRs.
The literature describing in situ mixed-species phototrophic biofilms is extensive,
but there are few studies (reviewed below) describing biofilm formation by a single
(axenic) species of WT phototrophic microbe; thus the role of phototrophs in colonizing
environments in order to establish these essential biogeochemical cycles and

11
biotechnology processes is poorly understood. An as-yet untested paradigm of mixed-
species biofilms is that these microbial communities are initiated by species other than
phototrophs, which may lack the ability to initiate biofilm formation and are only able to
join pre-existing biofilms. For example, one study found that surfaces pre-colonized by
heterotrophs had more rapid subsequent growth by phototrophs (57).
Since there are no extant examples of growing axenic phototrophic biofilms,
methods to utilize phototrophs in simulated biofilms for biotechnology applications tend
to use physical or chemical means to artificially create multi-cellular communities;
examples include immobilization of phototrophs such as R. palustris and Synechocystis
on various thin-film substrates or alginate beads for use as a biocatalyst (58-61). Benthic
sedimentary axenic biofilms have been developed using artificial sand as a biofilm
substrate for Prosthecochloris aestuarii strain CE 2404, a green sulfur photolithotroph,
and Thiocapsa roseopersicina strain 5811, a purple sulfur anoxygenic photoautotroph
(62).
Colony formation on agar plates has been described as a type of biofilm; for
example, studies with model heterotrophic bacteria Bacillus subtilis and Salmonella
enterica use colonies on agar plates as a standard biofilm assay (63, 64); these species
form colonies with pronounced macroscopic and symmetrical reproducible three-
dimensional structures. Many species of phototrophic microbes can also form colonies on
agar plates, and some have had three-dimensional aspect of the colonies characterized
biochemically (65); this type of growth mode assay would be especially relevant to
epilithic ecology, such as biodegradation of stone Mayan artifacts (66). However, a study
of Pseudomonas aeruginosa suggests that colony formation, biofilm formation and

12
planktonic growth (liquid cultures) are distinct modes of growth and that colony protein
profiles are more similar to that of planktonic cells (67).
Some mutant strains of Synechocystis (68, 69) and Synechococcus elongatus PCC
7942 (70, 71) (described in more detail in Chapter 3) with altered exopolysaccharide
and/or other cell surface structures have been found to be aggregative and/or form
biofilms in liquid cultures as detected by small flocks or adherence to glass test tube or
flask surfaces. These mutants have revealed important insights into the molecular
mechanisms of adhesion by phototrophs, but are perhaps less ecologically relevant
models for biofilm formation than WT strains. WT Synechocystis can form biofilms on
the bottoms of standing flasks of culture after several weeks’ incubation in blue light, but
the growth rate is linear rather than exponential in this condition, limiting the ability to
compare these results to standard biofilm assays of exponentially-growing heterotrophic
bacteria. Similarly, WT Thermosynechococcus vulcanus RKN is shown to aggregate
when shifted from standard growth conditions to blue light in the cold (72). In summary,
my review of the literature did not identify any extant studies establishing that an axenic
WT phototrophic species from any domain of life is able to initiate biofilm formation in
conditions analogous to characteristic biofilm studies conducted with heterotrophic
bacteria, as described below, which limits our ability to perform comparative analysis.
2.2 Features of heterotrophic bacterial biofilm formation are conserved
In contrast to the dearth of literature describing mechanisms of biofilm formation
by phototrophs, a vast and expanding literature describes the molecular mechanisms,
genetic regulation, and physiological characteristics of biofilm formation by
heterotrophic bacteria (73, 74), most notably that of human pathogens such as

13
Escherichia coli (75), Salmonella species (76), and Pseudomonas aeruginosa (77).
Biofilm formation has also been well-characterized in a few other heterotrophic bacteria
such as Agrobacterium tumifaciens, a pathogen of many agriculturally important plants
(78), and Caulobacter crescentus, a model organism for cell cycle control and polar
development (79). Although there is not a consensus definition of biofilm formation
(partly because the qualities and mechanisms of forming biofilms varies greatly between
species and also across different conditions by the same species), certain characteristic
features of a biofilm have emerged, which were largely conducted using axenic
exponentially-growing liquid-phase biofilm assays over the course of a few hours to
days, using a submerged abiotic biofilm substratum such as a microscope slide coverslip.
Specifically, biofilm formation requires cell energy input and is characterized by distinct
stages of development from initiation of cell-surface contact to biofilm maturation, and
results in a population of cells that are surface-bound and enclosed in an extracellular
matrix (80). These characteristics likely do not apply to all bacteria, but are commonly
encountered among bacterial biofilms studied to date.
2.3 Environmental and molecular signals induce biofilm formation
Initial attachment is frequently the focus of experiments to determine the
environmental signals causing a transition from suspended to attached growth modes
comprising the first stage of biofilm formation. These signals include but are not limited
to change in nutrient status, quorum-sensing, or detection of specific surface molecules
on host cells during infection by pathogens (reviewed in (73)). The effect of nutrient
status (limited or replete) on biofilm formation varies greatly, depending on bacterial
species and also environmental factors. For example, nutrient limitation enhances biofilm

14
formation by Salmonella enterica serovar Typhimurium (81), suggesting biofilm
formation is a type of stress response. On the other hand, abundant sugars enhance
biofilm formation by Vibrio cholerae, which could be interpreted as colonizing nutrient-
rich environments as part of a chemotactic response (82). Similarly, change in osmotic
pressure (salts, sugars, or other osmolytes) can either induce or inhibit biofilm formation
depending on strain physiology of diverse heterotrophs (83-85).
Some strains generate their own biofilm signaling molecules. Quorum-sensing in
bacteria such as Vibrio fischeri require a minimum concentration of specific metabolites
such as acyl homoserine lactone (AHL) before attaching to surfaces (86). While AHL has
been detected in environmental (multi-species) biofilms containing the cyanobacterium
Gloeothece PCC 6906 (66), it is still unknown whether these biofilms are induced by
quorum sensing from Gloeothece. I and others found no other studies that identified
quorum sensing by a phototroph whether in a biofilm or other growth phase (87),
although quorum-quenching signals were detected in Anabaena PCC 7120 liquid cultures
(88). Removal of biofilm suppression is another initiation mechanism: a study of
Synechococcus elongatus PCC 7942 found that WT secretes an as-yet unidentified small
molecule into the growth medium that inhibits biofilm formation; thus certain mutant
strains form biofilms as they are deficient at one or more steps in the inhibitor secretion
pathway (71). In any case, once a signal is detected allowing a bacterial cell to transition
from planktonic to sessile states, molecular cascades occur to coordinate wide-ranging
physiological changes in the cell, including the down-regulation of genes required for
swimming and up-regulation of extracellular matrix synthesis genes for adhesion; c-di-

15
GMP appears to be a conserved metabolite signal molecule coordinating this transition
across bacterial species (89, 90), discussed further in Chapter 3.
2.4 Mechanisms of attachment require cell surface structures
The initial stages of biofilm formation (transient attachment and more permanent
adhesion of single cells to a substratum) are mediated by cell surface structures such as
filaments of protein and glycoprotein (pili, flagella) and adhesive exopolysaccharides (74,
91, 92). Flagella and pili are hypothesized to contribute to attachment by changing the
charge distribution of a cell, thereby reducing the amount of electrostatic and hydrophilic
repulsion between cell and substratum in aqueous solutions (93). The filamentous shapes
of these appendages have reduced surface area compared with the cell body, thereby
reducing the electrostatic and hydrophilic repulsion to be overcome in order to initiate
contact with the substratum. These protein filaments are frequently tipped with adhesins
such as glycoproteins, promoting surface adhesion. Pili and flagella also contribute
motility to cells, which is thought to facilitate overcoming repulsion between cell and
substratum as well. In addition, once pili have initiated contact with the surface, the pilin
motors are activated and retract the pili into the cell, thereby drawing the cell body closer
to the substratum in an energy-dependent process, until the pili are completely retracted
and the cell body is in contact with the substratum (91). Mutants lacking pili and/or
flagella are unable to attach to surfaces, and have reduced biofilm formation; those
studies will be described in more detail in Chapter 3.
2.5 Towards a model organism for axenic phototrophic biofilm formation
Growth of axenic phototrophic biofilms under controlled laboratory conditions
would enable controlled study of their molecular mechanisms, genetic regulation, and

16
physiology, but there is currently a lack of rapid, ecologically relevant assays for
phototrophs that are analogous to those used in the existing canon of axenic heterotrophic
bacterial biofilm formation. Furthermore, identification of genes and structures essential
for a phototroph to form biofilms would inform rational engineering of strains with
customized adhesive properties for different biotechnology applications. Despite the
importance of phototrophic biofilms to ecology and biotechnology, there is currently a
lack of genetically tractable phototrophic model organism(s) to use in an analogous
manner as has been established with laboratory studies of heterotrophic bacteria biofilms.
The cyanobacterium Synechocystis is a model organism for the study of oxygenic
photosynthesis, is genetically modifiable with a fully annotated genome sequence, and as
such increasingly used as a microbial biofuel feedstock strain (20, 94, 95). I hypothesized
that phototrophs, specifically Synechocystis, are able to form axenic biofilms, and use cell
surface structures such as pili, S-layer and EPS to attach and adhere to surfaces, similar to
other biofilm-forming heterotrophic bacteria. To test this hypothesis, I screened the
literature to identify genes required for cell surface structures important for biofilm
formation in heterotrophic bacteria that had putative homologs in Synechocystis; these
were targeted for deletion and their biofilm formation and aggregation were studied using
modified assays.
Customizing the cell surface may confer added benefits to feedstock strains with
regard to improved nutrient fluxes, increased permeability of exported biofuels, reduced
sensitivity to pathogens or predators, or suppressing the growth of contaminants by
reducing concentrations of soluble microbial products (SMPs) (19). Some of these
aspects are described in Chapter 5.

17
CHAPTER 3
SYNECHOCYSTIS PCC 6803 FORMS AXENIC BIOFILMS AND AGGREGATES,
WHICH REQUIRE CELL SURFACE STRUCTURES AND ARE INDUCED BY
CHANGE IN NUTRIENT STATUS
3.1 Introduction
3.1.1 Overview and hypotheses
Synechocystis is model organism for photosynthesis, and has been genetically
modified for biofuel production (20). Knowledge of the environmental signals and
molecular mechanisms of biofilm formation by phototrophic bacteria would inform
rational engineering of customized cellular adhesion for biofuel applications, as well as
ecological insights into the physiology of mixed-species biofilms containing heterotrophs
and phototrophs (23, 96, 97). A review of the literature did not identify any studies
reporting a biofilm assay for WT phototrophic bacteria using exponentially-growing
cultures, as is typically used for biofilm studies of heterotrophic bacteria. Thus, although
a few recent studies of cyanobacterial biofilms have been reported with mutant strains,
and also WT under slow-growing conditions, has given important initial progress in this
area (described below), progress has been limited by the lack of a model organism and
assays for axenic phototrophic biofilm formation enabling comparative biology studies
with the canon of related work in heterotrophic bacteria. This area of research remains
understudied relative to its importance in basic and applied microbiology.
I hypothesize that phototrophs, specifically WT Synechocystis, are able to form
axenic biofilms in log phase, and use cell surface structures such as pili to attach and
adhere to surfaces, similar to other biofilm-forming heterotrophic bacteria. To test this

18
hypothesis, I screened the literature to identify genes required for cell surface structures
important for biofilm formation in heterotrophic bacteria that had putative homologs in
Synechocystis; these were targeted for deletion. Synechocystis cell structures of interest to
putative biofilm formation include the S-layer (surface layer protein), EPS
(exopolysaccharide), and pili.
3.1.2 Role of S-layer in biofilm formation
Synechocystis S-layer protein (Sll1951) is visible in TEM as a honeycomb-like
surface texture on wild-type cells (R. Roberson, unpublished) (98, 99). It is a
glycosylated protein, which may contribute to adhesive or electrostatic properties of the
Synechocystis cell surface. Deletion of S-layers enhances biofilm formation in Bacillus
cereus (100) and C. crescentus (Yves Brun, personal communication).
3.1.3 Role of pili in biofilm formation and motility
Synechocystis has thousands of Type IV pili arranged peritrichously on its surface
(101). These pili are glycosylated along their entire length; mutations causing altered
glycosylation of PilA, the pilin subunit, cause motility defects (102). PilC has been
shown to be a chaperone protein for assembly of PilA monomers into pili structures in
heterotrophic bacteria (103). In Synechocystis, pilC mutants (slr0162-0163) are apiliate
(bald) (104), consistent with this predicted role. Pili are required for biofilms in E. coli
and C. crescentus (91, 105). Interestingly, knockout of a putative pilC homolog,
pcc7942_2069 confers a biofilm-forming phenotype to S. elongatus (71), which is
believed to be related to the role of PilC in secreting an unidentified biofilm-inhibiting
small molecule by WT strains of S. elongatus.

19
Motility is a feature of initiating biofilm formation in many bacterial species (74).
Pili confer twitching motility to Synechocystis (106), which allows it to move over
hydrated surfaces but not swim through liquid. Pili, EPS and S-layer have all been
implicated in motility for cyanobacteria, including Synechocystis. Specifically, EPS is
hypothesized to play a role in gliding motility in Synechocystis, independent of the
glycosylated pili (106). S-layer (oscillin protein) (107) and EPS (108) are both required
for motility in filamentous gliding cyanobacteria (43); their role in coccoid Synechocystis
twitching motility has not yet been reported to my knowledge.
3.1.4 Role of EPS in biofilm formation: Wzy-dependent Group 1 capsular EPS.
Many cyanobacteria synthesize EPS (109, 110); here I review relevance of
cellulose, Wza/Wzc dependent EPS, and released polysaccharides (RPS) such as colanic
acid to Synechocystis EPS. Synechocystis EPS has been biochemically characterized
using acid hydrolysis and chromatography of resulting monomers (111). The negative
charge conferred on the cell surface by uronic acids and sulfate groups is a common
feature of cyanobacterial EPS structure (reviewed in (110)). Bacterial EPS export systems
are best characterized in E. coli, which includes Group 1 capsule export (112). Group 1
capsule is one of four major groups of capsular EPS characterized in E. coli based on
features of biochemistry and genetic regulation. Group 1 capsule shares Wzy-dependent
polymerization and Wza-dependent export with Group 4 capsule, but has different
immunological properties (previously categorized under K-antigen groups), and unlike
Group 4 capsule, is conserved in Klebsellia and Erwinia species.
A bioinformatic search of the Synechocystis predicted proteome revealed two
putative homologs to proteins required for Group 1 capsular export in E coli.

20
Specifically, a BLASTP (113) search for Wza, Wzc, Wzx, and Wzy homologs in the
Synechocystis predicted proteome identified putative homologs to Wzc and Wza, which
act as a gating mechanism / polymerase and outer membrane porin of Group 1 capsule
synthesis and export in E. coli, respectively (114).
Sll1581 is a putative homolog to Wza (28% identity, 42% similarity using default
BLASTP search parameters) (this study and (115)). The predicted role for Sll1581 is
consistent with its localization to the outer membrane of Synechocystis as determined
previously by mass spectroscopy (116). Deletion of wza homologs in various
heterotrophic bacteria results in loss of capsule (117) and also impaired biofilm formation
(118-120). sll1581 was deleted in Synechocystis and the resulting mutants had EPS levels
about 25% of that for wild-type, but no change in released polysaccharide (RPS) level.
This mutant showed spontaneous auto-sedimentation as measured by a 3-week standing
flask assay of liquid cultures compared to wild-type cells; the biofilm phenotype of this
mutant was not tested (121). A second putative homolog Sll0923 has 21% identity and
39% similarity to E. coli Wzc. I determined that the Walker A and B boxes and the C-
terminal tyrosine-rich domain required for Wzc activity are conserved in this homolog
(not shown). In a previous study, this mutant did not sediment, having the same
sedimentation phenotype as wild-type (121). Interestingly, the wzc mutant had a less
severe EPS defect, maintaining about 50% of wild-type EPS levels, whereas it showed a
50% reduction in RPS, compared to the wza mutant that had WT levels of RPS. It is
unknown whether these mutants had altered EPS composition, in addition to EPS
quantity.

21
Despite these two homologs, Synechocystis lacks putative homologs to Wzx or
Wzy, which characterize Group 1 (and Group 4) capsule export, a Wzy-dependent
process in E. coli (112). It may be that the functions of Wzx and Wzy in Synechocystis
are provided by ABC transporters or other enzymes, similar to Group 2 and Group 3
capsule export in E. coli. This hypothesis was previously raised in the literature using
bioinformatic comparison across many phototrophic phyla including diverse
cyanobacteria (115), in addition to Synechocystis. Additional support for this hypothesis
found that deleting genes originally identified in the Synechocystis genome as putative
homologs in LPS O-antigen (lipopolysaccharide, comprising the outer leaflet of the outer
membrane) transport had WT LPS but altered EPS quantity and quality, with different
monomer ratios compared to WT EPS (69). The mutated genes slr0977 and slr0982 had
homology to wzm and wzt in E. coli, whose products function together as an ABC-
transferases in O-antigen LPS export across the inner membrane. Since Wzm and Wzt are
exclusive to LPS O-antigen export in E. coli, whereas homologous ABC transporters
KpsT and KpsM function in EPS export (122) it is possible that these Synechocystis
putative ABC transporters are more accurately described as homologs to KpsM and
KpsT, rather than Wzm and Wzt.
Thus my current model for Wza/Wzc dependent EPS synthesis and export in
Synechocystis includes a hybrid of two canonical EPS export systems in E. coli: Group 2
(or 3) capsule biosynthesis by ABC-transporter activity of KpsMT homologs including
Slr0977 and Slr0982, and Group 1 (or 4) EPS export by outer membrane porin and
gating/polymerase enzyme homologs of Wza and Wzc, namely Sll1581 and Sll0923.
Colanic acid is synthesized and exported in a similar way as Group 1 capsule in E. coli,

22
but it is under different genetic regulation and, because it lacks the Wzi anchor protein, is
released into the supernatant rather than remaining attached to the cell (112, 123). I did
not find a homolog to Wzi in Synechocystis, using BLASTP search default parameters
(124). Thus I cannot eliminate the possibility that Synechocystis produces RPS analogous
to colanic acid of E. coli, though if not, it may be that Synechocystis uses an alternate
anchoring mechanism than Wzi.
3.1.5 Role of EPS in biofilm formation: cellulose
Cellulose is a component of cell-surface associated EPS in some bacteria. In
heterotrophic bacteria, genes for cellulose biosynthesis have been best characterized in E.
coli and S. typhimurium (bcs genes) where they contribute to biofilm formation (125);
some homologs to bcs genes were found in cyanobacteria, but not others (115). However,
cellulose has been detected in the EPS of several cyanobacterial species (72, 126) with
homologs to CesA, the cellulose synthase conserved in eukaryotic plants (127). In two
other studies, cyanobacteria closely related to Synechocystis, namely Synechococcus
strain PCC 7002 (126) and Thermosynechococcus vulcanus RKN (72, 128) were shown
to have cellulose-dependent aggregation.
Cellulose synthase genes are not found in all cyanobacterial species (127).
Synechocystis contains one cellulose synthase motif DDD35QXXRW, in Sll1377, which
has homology to CesA of Thermosynechococcus vulcanus RKN (query coverage
showing regions of homology to 48% of the full Sll1377 protein length). However, in
another study of 12 diverse cyanobacterial species, cellulose was not detected in
Synechocystis or Synechococcus elongatus PCC 7942; these studies were presumably
conducted under nutrient replete growth conditions. This survey included both

23
filamentous nitrogen-fixing species and coccoid-shaped non-nitrogen-fixing species
(such as Synechocystis and Synechococcus species) screened for the presence of cellulose
(in non-aggregated cultures) using four different methods, including nano-gold labeling,
and x-ray crystallography. This study confirms presence of cellulose in 6 species, and is
inconclusive for the remaining species.
A second line of evidence in the literature ties cellulose-dependent aggregation to
environmental signals via the highly conserved secondary messenger, c-di-GMP (cyclic
diguanosine monophosphate). This metabolite was first identified as required for
bacterial cellulose production by the cellulose synthase BcsA in Gluconacetobacter
xylinus (129). S. enterica, E. coli and Pseudomonas fluorescens have all shown
aggregation via c-di-GMP dependent cellulose production. (129, 130). A series of studies
shows that the cyanobacterium T. vulcanus aggregates at low temperatures in response to
blue light (72, 128). In their three-step model, supported with mutational analysis, in vitro
diguanylate cyclase activity and other data, SesA (Tlr0924) was shown to have
diguanylate cyclase activity (formation of c-di-GMP) in response to blue light.
Subsequently, the c-di-GMP is predicted to bind to cellulose synthase CesA (Tvtll0007),
as has been shown with cellulose synthases in other bacteria. Finally, CesA activity
results in synthesis of cellulose, which causes T. vulcanus cells to aggregate.
Not all cyanobacteria have protein sequence predicted for diguanylate cyclases
necessary for synthesis of c-di-GMP (131). Therefore, it is likely that this c-di-GMP
mechanism of cellulose-mediated aggregation is not universal across all cyanobacterial
species. c-di-GMP levels have been correlated with aggregation in Synechocystis, which
has 27 putative diguanylate cyclases. Specifically, constitutive expression of transgenic

24
diguanylate cyclase from E. coli that is known to be active in other species of bacteria
was sufficient to cause aggregation and biofilm formation by Synechocystis in white light
(132). In WT Synechocystis, levels of c-di-GMP from endogenous diguanylate cyclase
activity are naturally low under white light and high in blue light; increase in biofilm and
aggregation correlated with increase in c-di-GMP under blue light conditions, though this
study did not report cellulose status.
Interestingly, the authors concluded that additional factors besides c-di-GMP
levels may be governing these cell-binding phenotypes based on the observation that in
green light, c-di-GMP levels were higher but biofilm and aggregation levels were still
low. The same pattern was true for aggregation and c-di-GMP levels in green vs blue
light for T. vulcanus. It may be that c-di-GMP levels must reach a certain unknown
threshold before cell binding occurs, and mid-level c-di-GMP levels in green light are
below this threshold. It is worth noting that growth rate correlates with c-di-GMP levels
as reported in this study: fastest growth and lowest c-di-GMP in white light; intermediate
growth and c-di-GMP in green light, and slowest growth/highest c-di-GMP in blue light.
This raises the possibility that light wavelengths are indirectly influencing c-di-GMP
levels via growth rate. This is consistent with a previous report suggesting that arithmetic
(linear, rather than exponential) growth rate in blue light is attributed to reduced
photosynthesis (133). If so, then growth in blue light corresponds to low cellular energy
level for Synechocystis. Nutrient limitation such as carbohydrate starvation is frequently
correlated with increased c-di-GMP levels in heterotrophs (134), but since heterotrophs
get both nutrients and energy from their carbon sources, these data do not preclude that c-
di-GMP is responding to energy limitation. This would be consistent with phototrophs

25
upregulating c-di-GMP levels during energy limitation as well, such as during growth in
blue light, corresponding with reduced photosynthetic activity.
3.1.6 Summary of findings
In this Chapter, I report incidence of extensive mixed-species phototrophic
biofilm formation in a large outdoor photobioreactor used to grow WT Synechocystis.
Next, I adapted the crystal violet assay commonly used for biofilm study of heterotrophic
bacteria and identified growth conditions which induce axenic WT Synechocystis cultures
to form biofilms. I also developed a rapid aggregation assay to compare results of the
biofilm assay for environmental conditions inducing rapid cell-cell binding behavior. I
engineered targeted genetic mutations of genes sll1581 (wza), slr0923 (wzc), sll1951 (S-
layer) and slr0162-0163 (pilC) required for cell surface structures and screened these
mutants for biofilm formation and aggregation phenotypes. Finally, I present preliminary
experiments describing the cell surface biochemistry and motility of these mutants to
correlate biofilm, aggregation, and motility data with cellulase sensitivity of aggregated
cells, and protein measurements of outer membrane proteins. I summarize my findings of
cell-cell binding in Synechocystis for testing in future studies, and discuss the
implications of my model to biofuel production.
3.2 Materials and Methods
3.2.1 Culture growth conditions
Unless indicated otherwise, Synechocystis cultures were grown as follows: 100
mL starter cultures were grown in 500 mL Erlenmeyer flasks in BG11 medium with 50
µg/mL kanamycin sulfate as needed (135) to mid-log (OD730 ~0.5 – 0.6) at 50 µMol
photons / m2 / second continuous illumination and 120 rpm shaking with 0.8 mL/min air

26
bubbled through a 0.22 micron air filter in a growth chamber maintained at constant 30%
humidity. Air was metered using a flow meter (Cole-Parmer). The air bubbled through
the culture was additionally pre-humidified by passing through a side-arm flask of sterile
dH2O.
3.2.2 Assessing axenic status of bacterial strains
Axenic status of Synechocystis culture stocks was determined by T-RFLP to
detect bacterial contaminants as described previously (136). Liquid cultures were
prepared using sterile technique and cell pellets were collected via centrifugation for 5
minutes at 6,000xg. Decanted pellets were processed to extract genomic DNA using the
Blood and Tissue DNeasy kit (QIAGEN) with indicated modifications for Gram-positive
bacteria. The 16S rRNA gene was amplified from genomic DNA using Taq Master Mix
PCR kit (QIAGEN) and universal bacterial primers: HEX-labeled 8F (AGA GTT TGA
TCC TGG CTC AG) and unlabeled reverse primer 1392R (ACG GGC GGT GTG T)
(137). Resulting amplicons were purified with QIAQuick PCR Purification Kit
(QIAGEN) and digested with restriction endonuclease enzymes (138) HaeI, HhaI, MseI,
and MspI (New England Biolabs). Digested fragments were analyzed with a 3730
capillary sequencer (Applied BioSystems) and sized via ROX 1000 ladder
(ThermoFisher). Additionally, visual screening with light microscopy at 100x was used
to detect non-bacterial contaminants. To the extent that contamination is detectable by
these two methods, cultures were considered axenic if they did not have any non-
Synechocystis peaks in resulting fragment spectra, and no non-Synechocystis cells were
detected microscopically.

27
3.2.3 Modified crystal violet assay
The crystal violet assay was adapted to Synechocystis from methods described
previously (‘plastic binding assay’) (91). Starter cultures were sub-cultured to 100 mL at
OD730 ~ 0.2 and grown again to log phase as follows: for control cultures (no nutrient
dilution), growth conditions were as described above; for experimental cultures, nutrient
dilution was introduced by removing the water flask that humidified the air bubbled
through the culture (described above), such that the culture flask would evaporate to ~84
mL volume over 24 hours, equivalent to a nutrient strength of approximately 1.20x
BG11. Returning this culture to 1x BG11 at time=0 of biofilm assay (below) therefore
introduces a shift from higher to lower nutrient condition.
Control and experimental cultures were pelleted by centrifugation at 6,000xg for 5
minutes, and resuspended in 1xBG11 to an OD730 of 0.05. Three mL of culture was
added to each well of a 12-well plate (Corning Costar, Fisher Scientific) that contained
thick (0.25-mm) glass coverslip as biofilm substratum (Fisher Scientific) that had been
trimmed to fit vertically into the well using a diamond scribe (Ted Pella, Inc.). Plates with
coverslips inserted, and with plate lids removed and inverted in cross-linker (Spectroline
Spectrolinker XL-1500), were sterilized by UV radiation (254 nm) for 400 seconds at
1,500 µW/cm2 (600 mJoules/cm2). After inoculation, lids were sealed onto plates with
Parafilm M and cellophane tape to minimize evaporation. Plates were incubated for 72
hours on a platform shaker at 72 rpm under 32 µMol photons / m2 / second in a chamber
humidified to 30%. Three wells per culture were normalized to % of WT positive control
for each experiment. BG11 medium without inoculum was used as a blank.

28
Coverslips were removed and rinsed 10 seconds per side with a strong stream of
BG11 from a squeeze bottle, and excess solution was wicked off by standing the
coverslip edgewise on absorbent paper for 2 seconds. Coverslips were then stained by
inserting in wells containing 4 mL of 0.01% aqueous crystal violet solution (w/vol) for 5
minutes in a separate tissue culture plate. Unbound stain was rinsed and wicked as above.
Coverslips were dried in small weigh boats in ambient air overnight in the dark and used
for qualitative assessment (imaging) or quantified by dissolving in 1 mL of DMSO with
platform shaking for 20 minutes in the dark or until coverslip stain was removed (up to
45 minutes). Crystal violet absorbance was measured at 600 nm; the amount of
absorbance is a proxy for quantifying the amount of cellular material bound to coverslips.
The final culture OD730 of each well was also measured to correlate culture growth with
biofilm growth.
3.2.4 Live-dead staining and imaging of biofilms
Biofilms were grown on glass coverslips as described in the crystal violet assay.
100 µL of BacLight live-dead stain (ThermoFisher) was prepared according to
manufacturer’s instructions was applied to biofilm and incubated for 15 minutes at room
temperature in the dark. BacLight solution was wicked off as above and then the biofilm
was placed on a chilled microscope slide on ice. 100 µL of 1.6% low-melt agarose in
sterile isotonic solution (1%NaCl w/vol in dH2O) was applied to the chilled coverslip.
Coverslips with agarose overlay were attached to the interior of a small Petri dish with
dental wax and then immersed in isotonic solution. Biofilms were imaged using a Leica
TCS SP5 II with 10x or 63x DIC dipping lens. Sample fluorescence was excited by argon
laser and live and dead stain collected through FITC and Texas Red filters, respectively.

29
Biofilm heights were calculated manually by measuring samples of interest using the pre-
calibrated Z-axis of the SP5 II. For dual-species biofilm, log-phase WT Synechocystis
cultures were prepared as usual, and then inoculated with stationary-phase Pseudomonas
putida culture grown in LB broth to a 100:1 ratio of Synechocystis:P. putida ODs.
Incubation of dual-species culture in flasks was continued as with Synechocystis growth
conditions for 24 hours as described above to induce biofilm formation, and then the
crystal violet assay was conducted as described previously.
3.2.5 Plasmid and Strain Construction
DNA manipulation was carried out using standard procedures (138). Suicide
plasmids for replacing Synechocystis genes with a KmRsacB cassette were constructed by
four-part ligation into commercial vector pGEM 3Z (Promega), a pUC18 derivative. The
KmRsacB cassette from pPSBA2KS (139) contains markers for kanamycin resistance and
sucrose sensitivity. PCR fragments of ~500 bp located upstream and downstream of each
gene targeted for removal were amplified from the Synechocystis genome using primers
from Table 3 to select locations of double homologous recombination flanking the gene
of interest for each suicide vector. Flanking regions, pGEM 3Z, and the KmRsacB
cassette were stitched together by restriction digest and ligation. Briefly, NheI and EagI
digested restriction sites were generated between the two flanking sequences to
accommodate the digested KmRsacB fragment, and BamHI and SphI (New England
Biolabs) sites allowed insertion of these three fragments into the pGEM 3Z multi-cloning
site. For example, I created the plasmid pΨ541 (for replacing pilC with KmRsacB) by
ligating digested PCR products amplified from upstream and downstream regions of pilC
with digested KmRsacB and pGEM-3Z. (For replacing wzc, BamHI and XbaI were used

30
to insert the KmRsacB cassette, and SacI and SphI were used to insert the fragments to
create pΨ546). Ligation reactions were transformed into competent E. coli (5-alpha, New
England Biolabs) and transformants were screened by antibiotic selection and DNA
sequencing.
Design of KmRsacB suicide plasmids incorporated genomic context of each gene
to avoid introducing polar effects of neighboring genes from altered putative promoter
regions, as follows. For sll1581, the last 100 bp of the predicted open reading frame (orf)
were left intact in order not to delete the region directly upstream of neighboring orf
sll1582. Similarly, the putative promoter regions of sll1581 and ssr2843 overlap;
therefore this region was not included in the replacement region in order to preserve
native expression of orf ssr2843 in sll1581 mutants. For the remaining three mutant
strains, both gene and upstream region (predicted promoter) were targeted for KmRsacB
replacement. For the intergenic region mutant, the genome coordinates from 1,418,681
bp to 1,418,995 bp between divergent orfs slr2060 and sll1956 were predicted to be a
neutral site, as it did not show presence of predicted orf nor transcription activity, such as
for non-coding RNA or small peptide encoding RNA not included in NCBI genome
annotation according to (140).
3.2.6 Transformation and complementation
Mutants of Synechocystis were generated as previously described (69). Briefly,
log-phase culture was centrifuged as above and cell pellet resuspended to 200 uL volume
equivalent of OD730 = 2.5. Four µg of suicide vector was added to Synechocystis and
incubated for 6 hours in BG11 without antibiotic, with intermittent shaking. The
transformation reaction was plated onto a Nuclepore Track-etch membrane (Whatman)

31
on a BG11 agar plate. These were then incubated for 24 hrs at 30°C with 50 µmol
photons/m2/second. Following this incubation, membranes were transferred to a BG11
plate containing 50 µg/mL kanamycin and incubated for ~2 weeks until single colonies
appeared. To ensure complete segregation of the mutants, colonies were re-streaked for
isolation 3-5 times on BG11 with 50 µg/mL kanamycin. Kanamycin-resistant colonies
were screened via PCR with primers internal to genes targeted for deletion to determine
complete segregation.
Since natural competence in Synechocystis requires Type IV pili (101), I prepared
electro-competent cultures of apiliate pilC mutants in order to transform them with
complementation plasmids, as described previously (141, 142). Briefly, I centrifuged and
resuspended cell pellets from 50 mL of log-phase Synechocystis culture in sterile 10%
glycerol solution, with a final 500 µL volume. 60 µL aliquots of cells were mixed with 10
µL purified plasmid in up to 30 µL volume (H2O, or 10 µL if in 10 mM TE buffer), using
high concentrations of DNA (300 – 3000 ng/µL). Cells and DNA are added to 0.1 cm
electroporation cuvettes and then pulsed with 12 kV/cm, 25 µF, 400 ohms setting
(standard for electrocompetent E. coli). Cells were resuspended in 900 µL BG11, transfer
to test tubes with 2 mL additional BG11, and incubate as described previously until
OD730 doubled. To select for transformants, cells were centrifuged and pellet resuspended
in 500 µL supernatant for plating a range of volumes on selective medium (BG11
supplemented with 30 µg/mL streptomycin and spectinomycin). Complementation
plasmids were created by amplifying gene of interest from Synechocystis genome via
PCR, and cloning into expression vector pΨ568, a derivative of RSF1010 broad-host
plasmid, created via restriction endonuclease digestion with AbaI and AbaII.

32
3.2.7 Isolation and analysis of outer membrane protein fractions
Cells were lysed and fractionated using standard methods (143). 15 mL volumes
of culture were pelleted by centrifugation at 6,000xg for 5 minutes; cell pellets were
stored at -80 °C. Pellets were resuspended in 1.2 mL of 50 mM ammonium bicarbonate
buffer solution with HALT protease inhibitor (ThermoFisher) on ice. 600 µL of sample
were added to 2 mL cryo-vials with 400 µL of 0.1 mm zirconium beads. Cells were lysed
by bead-beating for 7 cycles; one cycle was comprised of 30 seconds beating at
maximum speed, followed by 2 minute incubation on ice (Mini BeadBeater, BioSpec).
Whole cell lysates were fractionated using differential centrifugation. Lysates
were transferred to new tubes. Unlysed cells were pelleted at 1,600xg for 5 minutes.
Supernatants were transferred and total membrane fraction was pelleted at 16,000xg for 1
hour. Total membrane pellet was resuspended in 500 µL of 20 mM Tris pH 8 and 500 µL
0.8% Sarkosyl on ice, and incubated at 4°C with inversion for 90 minutes. Outer
membrane fraction was pelleted at 16,000xg for 8-12 hours at 4°C. Supernatant was
removed, and final pellet (enriched for outer membrane fraction) was resuspended in 50
µL of 20 mM Tris buffer pH 8. Samples were quantified via BCA assay (Sigma Aldrich).
Volumes equivalent to equal protein (20 µg per well) were added to SDS loading buffer,
heated at 100°C for 10 minutes, and loaded onto Mini-Protean TGX gradient acrylamide
gels (4-20%) (BioRad Laboratories, Inc.) for PAGE. Protein bands were imaged via
Coomassie stain.
3.2.8 Aggregation assay
100 mL of mid-log culture (OD730 of 0.5 – 0.6) was pelleted as previously and
resuspended in either supernatant (negative control) or 0.8x BG11 (treatment condition)

33
and decanted into 100 mL glass graduated cylinders. The starting OD730 is measured and
the standing cultures are incubated at 30 °C with illumination as described above. The
final OD730 after 3-6 hours is measured by sampling 1 mL of culture from the 50 mL
mark on the cylinder. Aggregation is reported as normalized percentage change in OD, as
follows: [(Final OD – Starting OD) / Starting OD] x 100. Negative % aggregation in
negative controls indicates that the culture density increased over time due to cell growth,
and minimal aggregation occurred.
3.2.9 Cellulase treatment of aggregated cultures
Three mLs of aggregated cultures were transferred to 15 mm glass test tubes, and
100x stock preparations were added to final concentrations of 0.60 U / mL Aspergillus
niger cellulase (Sigma-Aldrich), as described previously (72). An equal volume of water
was added to a negative control culture. Cultures were mixed and incubated without
shaking at 30°C in the light, as for cultivation conditions. After incubation, cultures were
gently resuspended, and 1 mL aliquots were transferred to semi-micro cuvettes and
allowed to settle for 1 hour.
3.2.10 Motility and phototaxis assay
Phototaxis assay was adapted from (104). Log-phase cultures were diluted to
OD730 of about 0.25 and 10 µL spotted on motility agar (BG11 medium prepared in 0.5%
Difco BactoAgar) in grid-lined square petri dishes such that inocula were oriented
directly over grid lines. Plates were sealed in Parafilm M and incubated at 30°C and 30%
ambient humidity under directional illumination (a dark box with a 30 µMol photons / m2
/second light source at one end). Strains were graded as motile using qualitative
assessment of colonies having blurred edges and having elongated away from grid line,

34
as compared to pilC negative control strain colony known to be amotile (104), which
grows in a symmetrical disc centered on top of grid line and with crisp edges (Appendix
B, Figure B.1). Alternatively, plates were streaked on motility agar for isolated colonies
and placed in standard illumination; motile colonies were identified by larger size with
hazy edges, and amotile colonies smaller with clearly defined edges.
3.2.11 Statistical analysis
Data were analyzed using two-tailed paired Student’s t-test of at least three
biological replicates, with alpha level at 0.05 for the null hypothesis (no difference
between sample means). Differences between sample means were considered statistically
significant if the resulting test statistic had a p-value <0.05.
3.3 Results and Discussion
3.3.1 Biofilm formation in outdoor PBR correlated to water hardness
WT Synechocystis cultures (SD100) were grown in a 4000 liter outdoor PBR.
When cultures were inoculated into sterile growth medium prepared from hard (tap)
water, I observed consistent and florid growth of green biofilms in the PBR (n = 3
biological replicates). Figure 3.1 presents representative images illustrating that the
visible biofilm accumulated in characteristic stages from isolated colonies to thick
confluent growth during one week of semi-batch PBR operation (Days 7-11). In
subsequent rooftop PBR cultures with medium prepared with softened tap water, biofilms
were no longer prevalent (n>3 biological replicates; data not shown). Under the
conditions tested, my data are consistent with the hypothesis that biofilms containing
Synechocystis form only when nutrients were reduced due to precipitation by hard water,
and not present in nutrient replete conditions with no precipitation in softened tap water.

35
3.3.2 Wild-type Synechocystis forms axenic biofilms when growth medium is diluted
The roof-top PBR construction enables biofilm sampling at the conclusion of
experiments but not during operation; additionally, it is operated under conditions that are
Figure 3.1. Macroscopic biofilm formation by Synechocystis cultures in outdoor PBR.
Representative images of macroscopic biofilms from one PBR culture are shown growing in 4000 liter
outdoor roof-top PBR inoculated with WT Synechocystis (n=3 biological replicates of PBR inoculation
and operation without water softening step). Area marked with red bracket received full diurnal sun
exposure. Area marked with blue bracket was continuously covered. Area with yellow bracket was only
covered for the times of day with most intense illumination (2:30 – 3:30 p.m. daily). Reactor was operated
in semi-batch mode, with lag phase corresponding to maintenance of culture density for the first week
after inoculation (Day 0 -7).
Day 7 – Day 11: Macroscopic biofilm formation was observed in red bracket area of maximum
illumination that conformed to typical stages of bacterial biofilm formation, starting with isolated colonies
on day 7 (corresponding to day 2 of exponential planktonic growth); more isolated colonies on day 8; a
confluent but thin lawn on day 9; and a thicker biofilm with some non-laminar shedding by day 11.
Biofilm formation only occurred on surfaces receiving full diurnal sun exposure (red bracket); areas with
no sunlight (blue bracket) or partial diurnal sunlight (yellow bracket) did not grow any macroscopic
biofilms. On day 12, biofilms turned grey, corresponding with loss of planktonic culture density, and the
experiment was terminated after 27 days operation.

36
not axenic. To assess axenic Synechocystis biofilm formation under controlled laboratory
conditions, I adapted the crystal violet assay (“plastic binding assay” as described in (91))
typically used to study heterotrophic biofilm formation to Synechocystis biofilms.
Specifically, I screened biofilm formation in a range of conditions including 0-120 rpm
shaking, 4-50 umol photons/m2/second, and a range of BG11 concentrations from 0.4x to
1.2x BG11, measured every 24 hours for 5 days (data not shown). Maximum biofilm
formation as measured by crystal violet staining was determined to be 32 uMol
photons/m2/second at 30 °C, 72 rpm shaking, for 72 hours. It is noteworthy that unlike
heterotrophic bacteria growth in batch mode in this assay, Synechocystis does not form
biofilms unless shifted to diluted nutrient conditions via an evaporation and reconstitution
process (see Materials and Methods), as shown in Figure 3.2, below. In Figure 3.3A,
below, I verified that material stained with crystal violet was attached cells and extra-
cellular material. In Figure 3.3B, below, scanning laser confocal microscopy revealed
biofilms corresponding to these crystal violet data as isolated micro-colonies
approximately 300 microns wide and 1-2 cells tall (n = 12 biological replicates).

37
3.3.3 Synechocystis requires cell surface structures to form biofilms
I genetically engineered knock-out mutations of genes required for Synechocystis
cell surface structures that are related to biofilm formation in other bacteria, as identified
by literature and bioinformatic search. Specifically, I used allelic exchange of the
KmRsacB marker to remove genes previously shown to be essential for pili (pilC,
slr0162-0163), EPS (wza, sll1581), and S-layer (sll1951). I inserted the same marker at a
neutral site in WT strain SD100 to create a kanamycin-resistant control strain SD525, in
order to control for effect of growth under selection by kanamycin on biofilm formation.
Three independent isolates of each fully segregated clone were confirmed by PCR and
sequencing. I verified that sll1581 and sll1951 genes are not required for motility in
SD500, a motile sub-strain of WT Synechocystis (Supplementary Figure B.1). Therefore,
there are no motility-related changes upstream of the pilC mutation in the SD100 non-
motile WT strain (104) that could potentially influence biofilm formation. The list of
strains (by SD number) and plasmids (by pψ number) that were used in this study are
Figure 3.2. Adapted Crystal Violet Assay shows axenic biofilms require change in nutrient status.
The crystal violet assay was adapted to include a growth medium dilution step (treatment) or no
dilution step (control). Wild-type Synechocystis does not form axenic biofilms on glass coverslips under
nutrient replete conditions (control) (p-value <0.05; N = 4 biological replicates per condition, 12
biofilm coupon samples per biological replicate).

38
listed in Table 3.1; primers used are in Table 3.2. In Figure 3.4, below, both pili and S-
layer are shown to be required for biofilm formation by Synechocystis, as measured by
the modified crystal violet assay. The wza mutants appeared to have a growth defect
under conditions used in the modified crystal violet assay (compare green bars in Figure
3.4). As growth and/or energy is required for biofilm formation in other bacteria (91), it
could not be determined whether Wza-dependent EPS is required for biofilm formation
by Synechocystis.
3.3A 3.3B
Figure 3.3. Microscopy confirms that absorbance measured in crystal violet assay is attached cells and
extracellular material.
Figure 3.3A: Phase contrast (black-and-white) imaging with 100x objective lens was used to visualize
biofilms grown on glass coverslips and then stained with crystal violet in the treatment condition;
stained material corresponded to cells (~1.5 micron diameter) and extracellular matrix (ECM) (n=3
biological replicates). Control coverslips had no attached cells and no stained material (not shown).
Figure 3.3B: Scanning laser confocal microscopy was used to image auto-fluorescent cells in biofilms
grown under treatment condition (without crystal violet staining) (n=12 biological replicates). Bar =
300 microns. Green Z-axis cross-sections of biofilms are shown in margins.

39
Table 3.1: List of strains and plasmids used in this study.
SD Number Parent Strain Mutation Source
N/A Pseudomonas putida wild-type Gift from Nielsen lab, ASU
SD100 WT Kazusa variant wild-type Gift from Vermaas lab, ASU
SD500 WT Paris variant wild-type Pasteur Cyanobacterial
Collection
SD506 EPS-minus strain slr0977 Fisher et al, 2013
SD515 Paris wza::KmR sacB sll1581 This study
SD517 Kazusa wza::KmR sacB sll1581 This study
SD519 Kazusa pilC::KmR sacB slr0162-0163 This study
SD520 Paris pilC::KmR sacB slr0162-0163 This study
SD522 Paris s-layer::KmR sacB sll1951 This study
SD523 Kazusa s-layer::KmR
sacB sll1951 This study
SD525 Kazusa
intergenic::KmRsacB intergenic This study
SD546 Kazusa wzc::KanSac sll0923 This study
SD577 Kazusa pilC::KmR sacB +
pPSI 568 PilC slr0162-0163 This study
SD578 Kazusa pilC::KmR sacB +
pPSI 568 Wza sll1581 This study
pψ Number Vector Construct Source
540 pGEM 3Z wza up KanSac dn This study
541 pGEM 3Z pilC up KanSac dn This study
543 pGEM 3Z s-layer up KanSac
dn This study
545 pGEM 3Z intergenic up
KanSac dn This study
546 pGEM 3Z wzc up KanSac dn This study
550 pGEM 3Z wza complement This study
552 pPSI 568 pilC complement This study
553 pPSI 568 wza complement This study
568 RSF1010 expression vector Gift from Soo-Young Wanda
pPsbA2ks pPSBA2 source of KanSac
marker Lagarde et al, 2000
540 pGEM 3Z wza up KanSac dn This study
541 pGEM 3Z pilC up KanSac dn This study

40
Table 3.2: List of primers used in this study.
Primer # Primer name Primer Sequence Description
1 Up wza F NheI (Eag) ggattggctagcattcatagcattcggccgatg 5' primer for
upstream of wza
2 Up wza R SphI cctggatacgacgcatgccatcatctaag 3' primer for
upstream of wza
3 Dn wza F BamHI gcttgcagggcataatttttggatccacaagattcc 5' primer for
downstream of wza
4 Dn wza R NheI
(stop)
ccaactttaagaaacaatgatgtagtcttagc
tagcaccagtggttaaact
3' primer for
downstream of wza
5 Up wzc F SacI gcactgtccctatgcgagctcaagccagta 5' primer for
upstream of wzc
6 Up wzc R BamHI gcttgtaaggcaggggatccaccaact 3' primer for
upstream of wzc
7 Dn wzc F BamHI
(XbaI)
cgcttgatcacggatccatatctagaaataaa
aaccagttcaga
5' primer for
downstream of wzc
8 Dn wzc R Sph R ggttcatcactcaaaagcatgctggcatcc 3' primer for
downstream of wzc
9 Up s-layer F BamHI gggcagtaagcgacgggatccagctcgtttaag 5' primer for
upstream of s-layer
10 Up s-layer R Nhe! ggatttaatctctaaatctgctagctaaagttacgg 3' primer for
upstream of s-layer
11 Dn s-layer F NheI
(Eag) gcacttttcagacacttgctagcggccggggaaaa
5' primer for
downstream of s-
layer
12 Dn s-layer R SphI ggttggtcttactatagcatgcaggtggtaacgga
3' primer for
downstream of s-
layer
13 Up pilC F BamHI ccaatgctctgcggggatccttacgggaagatccg 5' primer for
upstream of pilC
14 Up pilC R NheI ggtcagatgattagggggctagcaccgaaaaacttatg 3' primer for
upstream of pilC
15 Dn pilC F NheI (Eag) gccgctagcgttgtgaagagagtacggccgcac 5' primer for
downstream of pilC
16 Dn pilC R SphI gcggcattcccaagtaaagcatgcgctctttaa 3' primer for
downstream of pilC
17 pilC compl F NdeI ccccctaatcatatgaccccaaactattaagc 5' primer for pilC
16 pilC compl R SalI gtcacaagcaatcagtcgacagcagagc 3' primer for pilC
19 Up KanR F BamHI gcctgcaagagaattttaataaccttggatcc
gatcccaatcaa
5' primer for
upstream of
intergenic region
20 Up KanR R NheI ggtataagttgttcagtttatttataccggag
aaaccgctagcaataat
3' primer for
upstream of
intergenic region
21 Dn KanR F NheI
(Eag) gcaggctagcaacaacggccgcgaaggtttgaaag
5' primer for
intergenic region
22 Dn KanR R SphI gcaaaccaccttggcatgcgaaattaatcaacgggcagaa 3' primer for
intergenic region

41
3.3.4 Synechocystis forms dual-species biofilms with P. putida.
One untested paradigm of mixed-species biofilm formation is that phototrophs are
deficient in or unable to initiating biofilm formation, and occur in mixotrophic biofilms
by joining communities that are established by heterotrophic microbes (23). However,
when viewed macroscopically, roof-top PBR biofilm formation only occurred in
illuminated areas (Fig 3.1); biofilm and planktonic community identity included diverse
heterotrophic bacteria (clone library data not shown). The absence of visible
heterotrophic biofilms in un-illuminated areas suggests that in mixed cultures that occur
in this outdoor PBR, Synechocystis determines total biofilm growth, as Synechocystis is
an obligate phototroph and does not grow in shaded areas.
Figure 3.4. S-layer and pili are required for biofilm formation by Synechocystis.
Mutant and WT strains (see Table 3.1, above) were assessed using treatment condition as with Figure
3.2. Attached cells of mutant strains lacking S-layer (Slyr) or pili (PilC) were deficient compared to WT
(p-value < 0.05 for all mutants. N = 4 biological replicates using two independently isolated clones of
each mutant strain.) The wza mutant showed a growth defect under these conditions (green bars), so its
biofilm status could not be directly compared with WT.

42
To investigate, I grew axenic WT Synechocystis and P. putida cultures separately,
and combined them to conduct dual-species biofilm analysis. I chose P. putida because it
can grow on a multitude of fixed carbon sources (144) such as those making up the
soluble microbial products (SMPs) of Synechocystis supernatants (136), and also is able
to form biofilms (145). Cultures were combined in a 100:1 ratio of Synechocystis:P.
putida cells/mL. This ratio was chosen to approximate environmental contamination of
outdoor PBR Synechocystis cultures with heterotrophic bacteria, as being more relevant
than a 1:1 ratio, for example.
In Figure 3.5, below, co-culture biofilms or attached single cells included
Synechocystis and P. putida, or Synechocystis alone, but rarely P. putida alone (white
arrow), as determined by auto-fluorescence and live-dead stain. Additionally I found the
similar punctate structure occurring between axenic Synechocystis and axenic co-culture
with P. putida. These preliminary data, while inconclusive, are consistent with the
hypothesis that Synechocystis determines total biofilm formation and structure in axenic
co-culture with P. putida, which could be occurring at the initiation, growth and/or
maturation stages of biofilm formation. Additionally, the observation that no biofilm
formation occurred in the roof-top PBR once the water softening step was implemented
into the cultivation system process is consistent with the conclusion that the results with
P. putida also apply to other heterotrophs, namely that in mixed cultures grown in
autotrophic medium such as BG11, Synechocystis is driving biofilm formation in PBRs,
not heterotrophs.

43
Figure 3.5. Co-culture of axenic P. putida and Synechocystis forms dual-species biofilms.
Biofilms imaged with a 40x objective dipping lens were induced as with treatment condition (dilution
step), Figure 3.2. Shown is maximum projection of a Z-series stack of a dual species biofilm of
Synechocystis and P. putida co-culture labeled with live/dead stain.
Red (upper left): All dead cells and live Synechocystis auto-fluorescence.
Green (upper right): All live cells.
Grey (lower right): Bright field image.
Yellow (lower left): Overlay of red, green, and bright field.
Isolated live P. putida can be identified by presence of green fluorescence in the upper left panel that
does not correspond to red fluorescence in the upper right panel (white arrows).

44
3.3.5 Synechocystis aggregation requires cellular energy and is induced by change in
nutrient status
Crystal violet data show that pili and S-layer are necessary but not sufficient for
biofilm formation (Figure 3.4); presence of these structures do not cause WT cells to
form biofilms unless some additional unknown factor is induced by nutrient dilution. An
aggregation assay was developed to better understand both the environmental signals and
molecular mechanisms of cell-cell binding in Synechocystis. Aggregation is related to
biofilm formation in that it requires cell-cell binding and forms multi-cellular
communities as flocs relevant to many of the same environmental and biotechnology
applications (146, 147). Additionally, the amount of cellular material in biofilms grown
on coverslips by Synechocystis was insufficient for commonly used biochemical assays
for protein or RNA analysis. Therefore, I developed a rapid static aggregation assay to
further characterize molecular mechanisms of cell binding by Synechocystis.
Wild-type Synechocystis cultures with a starting OD730 = 0.5 – 0.7 aggregate an
average of 56% +/- 6% total biomass within 6 hours when shifted to reduced strength
medium (0.8x BG11), compared to negative control cultures resuspended in supernatant
(Figure 3.6, below), consistent with formation of biofilms (Figure 3.2, above). The role of
cellular energy in aggregation was also investigated. Cultures induced for aggregation by
shift to 0.8x BG11 remained suspended when incubated in the dark, or when the
herbicide DCMU (3-(3,4-dichlorophenyl)-1,1-dimethylurea) was added to a 5 µM
concentration in nutrient-diluted cultures incubated in the light. Dark conditions and

45
DCMU conditions both block electron transport for cellular energy generation (148, 149).
When dark-incubated nutrient-limited cultures are shifted to illuminated conditions, they
aggregate to the same degree as without dark incubation. Therefore, the aggregation
phenotype requires cellular energy; i.e. it is not a passive sedimentation process
facilitated by changes in electrostatic or hydrophilic cell-cell attraction due to change in
nutrient status, for example, but requires active cellular energy production.
Figure 3.6. Wild-type aggregation requires cellular energy; is induced by change in nutrient status.
All cultures were shifted to 0.8x BG11 to induce aggregation, unless otherwise indicated.
Sup. = supernatant; negative control (cells were resuspended in supernatant). A negative % aggregation
(‘Sup.’) indicated the culture increased in density and did not aggregate over the course of the
experiment (~6 hours). DCMU = a.k.a. Diuron, an herbicide that inhibits cellular electron transfer. Dark
= culture was incubated in the dark. D->L = ‘Dark’ culture shifted to light conditions. 1.0x and 1.2x =
shifted to 1.0x or 1.2x BG11, respectively. Sup. 1.2x = the cells were resuspended in supernatant, and
spiked with additional concentrated BG11 stock solutions for an approximate final concentration of
1.2x BG11 in supernatant.

46
3.3.6 Soluble microbial products do not influence aggregation
During the aggregation assay, conditioned supernatant is exchanged for fresh
growth medium. In this step, the extracellular environment is modified in two ways: SMP
are removed, and the osmotic/ nutrient / salt condition of the culture is altered. One or
more of these signals could be influencing aggregation. For example, presence of SMP
could inhibit cell-cell binding in supernatant negative controls, as was shown with S.
elongatus (71), and/or removal of SMP could signal cells to induce aggregation through
unknown mechanisms in treatment conditions, and/or change in nutrient status could
induce aggregation in combination, either independently or in conjunction with SMP
removal. I tested altering nutrient strength without removing SMP, which was
accomplished by spiking 100 mL supernatant with microliter volumes of concentrated
BG11 stock solutions to an estimated 1.2x BG11 final concentration. Aggregation when
nutrient strength was increased by shift to fresh BG11 at 1.2x concentration served as a
negative control. I found that aggregation in supernatant +1.2xBG11 was the same as that
measured for aggregation with fresh 1.2xBG11. I conclude that removal of SMPs is not
required for aggregation signaling or for mediating cell-cell binding.
3.3.7 Cell surface molecules modulate aggregation
In Figure 3.7 below, I compared aggregation phenotypes between WT and mutant
strains under 0.8x BG11 conditions. The S-layer mutant had bi-modal aggregation
phenotype: either a high level of aggregation (42% +/- 2%; n=2) or no aggregation (3%
+/- 3%, n=2). This suggests that S-layer facilitates aggregation, but its absence can be
overcome under commonly occurring yet unknown conditions. As the S-layer mutant is
also deficient in biofilm formation, it is possible that S-layer is important for initial

47
attachment, and this plays a bigger role for attachment to glass than it does for cell-cell
binding. Mutants lacking wzc had WT levels of aggregation, whereas mutants lacking
wza had enhanced levels of aggregation. This is consistent with previously reported
results showing that a wza mutant sediments more readily than a wzc mutant, which
correlates to less cell-bound EPS in the wza mutant compared with the wzc mutant (25%
vs 50%, respectively) (121). This suggests that capsular EPS production promotes
dispersal of cells, and absence of EPS creates a super-binding phenotype due to increased
facility of initiating cell-cell contact.
The pilC mutant strain was deficient in aggregation; complementation restored
WT aggregation, indicating that any unknown spontaneous secondary mutations in the
pilC mutant genome background did not contribute to the aggregation defect phenotype.
The role of pili in aggregation may be due to facilitating cell-cell contact via
glycoproteins and/or overcoming electrostatic or hydrophilic repulsion. PilC, as a
cytoplasmic chaperone in PilA subunit export, may also facilitate export of an aggregant,
either directly or through assembled hollow pili. In summary, my current model is that
aggregation is energy-dependent, induced by changes in nutrient / salt / osmotic strength,
but not removal of SMPs, in a process that requires pili, is facilitated by S-layer, and is
reduced but not prevented by wza-dependent cell-bound EPS.
3.3.8 Characterization of cell surface biochemistry to identify putative aggregation
molecules.
As with biofilm formation, pili and S-layer are necessary but not sufficient for
aggregation by wild-type Synechocystis: an additional factor induced by change in
growth medium status is required for aggregation to occur. I hypothesized that WT

48
Synechocystis is producing novel unknown adhesive molecule(s) (aggregant(s)) on its
surface in response to changes in growth medium, causing aggregation. To detect these
putative aggregants, I isolated outer membrane protein fractions of WT and mutant
strains under treatment and control aggregation conditions (four biological replicates per
condition). Samples were split before loading on gels to include both boiled and unboiled
preparations of proteins, as some proteins are heat labile. As seen in Figure 3.8, below, I
did not identify any putative protein aggregants (adhesins) that were expressed at higher
levels in the treatment (aggregated) cultures vs negative control, as determined by
differential band patterns of Coomassie stained gels analyzed by SDS-PAGE. This result
may indicate that aggregation is not mediated by synthesis of outer membrane proteins,
although more definitive conclusion would require identification and quantitation of
Figure 3.7. Cell surface structures modulate Synechocystis aggregation.
All cultures were shifted to 0.8x BG11. WT = wild-type. Wza, Wzc, PilC, Slyr = mutant strains lacking
proteins indicated; Comp = complementation strain for mutant lacking PilC. For details on strain
construction, see Table 3.2. Columns with different letters above them have statistically different
amount of aggregation, p-value < 0.05.

49
specific outer membrane proteins under each growth condition, as proteins of more than
one identity can co-migrate in a given band.
3.3.9 Degree of cell aggregation is not affected by treatment with cellulase
Although previous reports did not detect cellulose in Synechocystis (127), c-di-
GMP-dependent aggregation has been reported in this species (132), which is often
correlated with cellulose-dependent aggregation, including for cyanobacteria (72, 128).
Aggregated cells of the cyanobacterium T. vulcanus were visibly dispersed by treatment
with cellulase, consistent with the role of cellulose in causing aggregation in this species
(72). I used the cellulase assay described for T. vulcanus to test for role of cellulose in
Synechocystis aggregation. As seen in Figure 3.7 below, I saw no dispersal of aggregated
Figure 3.8. SDS-PAGE of outer membrane proteins shows no difference between aggregated and un-
aggregated cultures.
Ind. = aggregation induced by shift to 0.8x BG11; Unind. = negative control cultures resuspended in
supernatant. Boil = sample was boiled before loading onto gel; Not Boil = sample not boiled before
loading onto gel.
kDa
250
130
100
70
55
35
25
15
10
5
Ladder WT WT WT WT
Unind. Ind. Unind. Ind.
Boil Boil Not Boil Not Boil

50
cells in cellulase-treated cultures compared to a negative control. This result suggests
that, unlike T. vulcanus, cellulose is not required for aggregation in Synechocystis.
However, these data are preliminary and additional experiments testing the activity of the
cellulase enzyme and for the presence of cellulose in extracellular matrices of cells are
needed for definitive conclusions. It may be that additional aggregants such as proteins
also contribute to aggregation in Synechocystis, or less likely, that cellulose plays no role
in Synechocystis aggregation.
3.4. Conclusions
3.4.1 Synechocystis forms axenic biofilms using the modified crystal violet assay
These results show Synechocystis is able to form log-phase axenic biofilms (Fig.
3.2) and aggregates (Fig. 3.5). I conclude that Synechocystis is a suitable model organism
for phototrophic biofilm formation, which addresses a significant gap in the field of
microbiology. I also report the development of two rapid assays relevant to ecological
Figure 3.9. Cellulase treatment does not disperse aggregated Synechocystis cells.
Aggregated wild-type cells were treated with cellulase (left) or an equal volume of cellulase-free buffer
(right) and incubated overnight. 1 mL samples were transferred to cuvettes, and cell dispersal was
measured by absorbance of suspended cells, as described previously, to evaluate role of cellulose in
aggregation. No qualitative or quantitative effect of cellulase was detected (n = 4 biological replicates).

51
and biotechnological studies of axenic cell-cell binding under controlled laboratory
conditions, namely a modified crystal violet assay and an aggregation assay, which
enable comparative biological studies with the canon of axenic heterotrophic biofilm
formation. I demonstrate the utility of these assays in performing mutational analysis of
cell surface structures required for cell-cell binding under these two conditions, namely
pili and S-layer, and show that dual-species biofilm microscopy is supported by these
methods. These findings include the report of a non-biofouling strain of Synechocystis,
the pilC mutant SD519, which would be advantageous for use as a feedstock strain in
planktonic PBR or open ponds. Additionally, I used these assays to determine that change
in nutrient status of WT Synechocystis cultures is one possible environmental signal for
rapid, economical biomass harvesting method convenient to bioenergy applications. It is
also worth noting that neither Wza nor S-layer are required for phototactic motility
(Supplemental Figure B.1), indicating that Synechocystis uses some other source of
extracellular material to facilitate movement across surfaces (106).
3.4.2 Mutational analysis supports novel role for Wza-dependent EPS in promoting
dispersal of cells in planktonic cultures
Overall, my evidence supports a model of cell-cell binding that is regulated by
two different mechanisms depending on growth status. During nutrient-replete planktonic
growth, the negatively-charged EPS keeps cells distributed by electrostatic and possibly
hydrophilic repulsion; this could benefit the cell by limiting self-shading that would
otherwise be caused by sedimentation (121) or transient contact in cell suspensions (150).
Under conditions of altered nutrient status, a second aggregation mechanism over-rides
this cell-cell repulsion through unknown means that likely involves export of a non-

52
protein aggregant such as cellulose or other component in response to environmental
signals, based on results in this study and also assuming similar mechanisms to those
previously reported in other cyanobacteria. Overlaying of the capsular Wza-dependent
EPS with an additional layer of new material may compensate for the electrostatic
repulsion of Wza-dependent EPS by creating a physical bridge across intercellular
distances, while also promoting cell-cell binding through electrostatic and/or hydrophilic
attraction or adhesion by the new aggregant material. I note that, compared with
heterotrophic bacteria, which use Wza-dependent Group 1 capsular EPS to promote
biofilm formation, in Synechocystis and possibly other cyanobacteria such as F.
diplosiphon (132), this cell surface structure prevents aggregation under nutrient replete
conditions. If this trend holds true with study of additional cyanobacteria, it represents a
new paradigm in bacterial biofilm formation, and illustrates how development of this
understudied field of axenic phototrophic biofilm formation may yield interesting insights
into molecular mechanisms of the divergent evolution of biofilm formation between
phototrophs and heterotrophs, giving a new perspective on how pathogens like E. coli
adapted biofilm formation as part of the infection process. An additional definitive
comparison would be to assess the aggregation and sedimentation phenotypes of the E.
coli wza mutant under similar conditions as for Synechocystis in this study.
Environmental signals inducing aggregation include both increase and decrease in
nutrient strength (Figure 3.6), as well as in blue light (132). Whether these diverse
environmental signals are part of the same pathway related to energy limitation, or are
separate pathways to induce aggregation, is undetermined. Based on my results, I
describe here one possible parsimonious molecular model for cell-cell binding during

53
Synechocystis aggregation. The cell regulates this phenotype in response to
environmental change. Two-component signal transduction systems have been
characterized as detecting and regulating response to diverse signals, including changes
in nutrients, salt, and osmotic pressure (151-154); I propose that the environmental
signals for aggregation are likely also detected by the cell through as-yet undetermined
two-component system(s), which then activates the c-di-GMP-dependent aggregation
pathway. Although the data reported here do not allow distinction between different
stages of biofilm formation or aggregation, my results are consistent with a model of
passive cell-cell contact facilitated by pili and S-layer, and inhibited by Wza-dependent
EPS (Figure 3.7).
Over the course of 2-3 hours, transcriptional changes initiated by the two-
component regulatory system induce energy-dependent synthesis and export of unknown
adhesive molecule(s). This process does not require Wza/Wzc proteins (Figure 3.7) so it
is not caused by increased export of polysaccharide analogs to E. coli Group 1 capsule or
colanic acid. My preliminary data also contradict cellulose as the aggregant, as my cells
were not dispersed upon treatment of cellulase, but additional control experiments are
needed for definitive conclusions. PilC, a cytoplasmic chaperone of PilA export, may be
directly required for exporting this putative aggregant, or indirectly enable aggregant
export through Type IV pili, which enable transport of molecules related to
cyanobacterial adhesion (71). As I did not detect differential expression of membrane
proteins in aggregated cultures, my data support that the unknown aggregant may be a
non-cellulose, non-colanic acid polysaccharide. Biochemical characterization of

54
supernatants and ECMs via total carbohydrate measurements are underway to test this
theory.
3.4.3 Implications for naturally-occurring phototrophic biofilm formation
The extent to which other phototrophic microbes are able to initiate axenic
biofilm formation during the modified crystal violet assay or other means remains to be
tested. As photolithoautotrophs such as Synechocystis have one of the few metabolic
profiles able to grow in environments without biotic resources such as fixed carbon and
fixed nitrogen, it is possible that one of their ecological roles is colonizing surfaces that
are initially uninhabitable by heterotrophic microbes (155). If so, it may be that many
microbial phototrophs are able to initiate biofilm formation, though not necessarily under
the same growth conditions described in this study.
The lack of macroscopic biofilms in shaded areas of the roof-top PBR, and the
similarity of microscopic appearance of axenic Synechocystis biofilms on glass coverslips
with dual-species biofilms co-cultured with P. putida, are preliminary evidence that
phototrophs are driving the total biofilm formed in mixed cultures under those conditions.
Whether this represents a generalizable paradigm to other growth conditions or
phototrophs is undetermined; however, the assays and model organisms to study axenic
phototrophic and defined synthetic community biofilms such as those described in this
study are a useful tool to address these questions.

55
CHAPTER 4
COMPARATIVE TRANSCRIPTOMICS SUGGEST THAT AGGREGATION BY
SYNECHOCYSTIS PCC 6803 IS CORRELATED WITH STRINGENT RESPONSE IN
THE LIGHT
4.1 Introduction
Stringent response (SR) is one of several known highly conserved stress
responses in bacteria that entails rapid coordinated shifts in multiple cellular pathways to
adapt to environmental signals, including nutrient limitation (reviewed in (156)).
Originally described in E. coli, the name SR refers to the stringency or restricted
condition of reduced RNA synthesis under nutrient limitation in WT, in contrast to the
so-called relaxed response in a relA mutant, which does produce RNA under nutrient
limitation (157, 158). A universal feature and criterion of SR is use of secondary
messenger (p)ppGpp or ppGpp, guanosine (penta or) tetra-phosphate. In heterotrophic
bacteria, this metabolite interacts directly or indirectly with sigma factors (which are
required for RNA polymerase activity) and other regulatory molecules to effect rapid
large-scale synchronized changes in transcription levels. Levels of this poly-
phosphorylated guanosine act as an alarmone, and are regulated in Gram-negative
bacteria by the relative activities of a synthase RelA and a hydrolase SpoT (which also
has limited (p)ppGpp synthase activity in response to other nutritional signals (159)). In
Firmicutes and other Gram-positive bacteria such as Bacillus subtilis, (p)ppGpp regulates
activity of RNA polymerases indirectly through controlling levels of purines, especially
GTP (160).

56
Many bacteria, including Synechocystis (161) include both synthase and hydrolase
activities as separate domains of a single protein, termed a RelA-SpoT homolog, or RSH
(162). In E. coli, the activity of RelA is determined by conformational changes of the
enzyme when bound to ribosomes lacking sufficient charged tRNA (163). While the
Synechocystis RSH gene was able to complement (p)ppGpp synthase activity in an E. coli
null mutant, the mechanism for (p)ppGpp regulation of cyanobacteria has not been
characterized. Phylogenic analysis shows that essential motifs for mechanisms of action
of (p)ppGpp in heterotrophs, such as by binding to ribosomes or modulating GTP levels,
are not conserved in cyanobacteria (164, 165).
SR is an adaptive response to stress that confers survival advantage to the cell by
down-regulating pathways related to so-called “house-keeping” functions of normal cell
growth and proliferation, such as those regulated by sigma 70, while up-regulating
pathways to activate stress responses, regulated by alternative sigma factors such as
sigma S (RpoS), sigma 54 and sigma 32. The effect of SR in E. coli and other
heterotrophic bacteria has been correlated with transition to stationary phase (156, 157,
166), as well as increased virulence of log-phase cells (167), including formation of
multi-drug resistant persister cells (158) and induction of toxin-antitoxin bacteriophage
defense mechanism (168). In the absence of SR, such as with mutant strains of E. coli
lacking (p)ppGpp, cells will have the same proteomic profile in stationary phase as in
exponential phase, causing much reduced survival rates in stationary phase compared to
WT stationary-phase cells (169).
Genes and processes specifically affected by SR vary across different bacteria and
growth conditions (158), but frequently include up-regulation of trans-translation (a

57
mechanism for rescuing stalled ribosomes due to amino acid shortage (170)) as well as
amino acid biosynthesis and uptake, proteolysis, universal stress protein A (166),
glycolysis and/or glycogen catabolism (171), and osmotic and other stress response
genes, as well as some phage promoters (172). Genes down-regulated during SR are
largely related to macromolecule biosynthesis, such as the afore-mentioned rRNA
synthesis and elongation factors, DNA replication genes (173), and cell growth (fatty
acids and peptidoglycans, for example) (174). In E. coli and also in Gram-positive
bacteria, (p)ppGpp has also shown to directly interact with certain groups of proteins,
including GTPases, thereby inhibiting their role in initiation or elongation of protein
synthesis (175).
Environmental signals that induce SR include nutrient limitation and other
stressors. Amino acid starvation is a nearly universal activator of SR across all bacteria
studied thus far, with the exception of Vibrio spp. (156). Acid or alkaline stress response
and heat shock have also been shown to induce SR in various bacteria (156). Whereas in
E. coli and other species, amino acid starvation is sufficient for SR activation, in the
oligotroph C. crescentus, SR required both amino acid starvation and also a second
limitation of nitrogen or overall carbon supply (176). R. sphaeroides, an alpha-
proteobacterium capable of anaerobic photosynthesis, induces SR upon shift from light to
dark (177); S. elongatus, a cyanobacterium, also shows SR upon shift to dark (178). An
auxotrophic mutant of R. sphaeroides had a SR when deprived of the amino acid leucine
(177).
SR has been correlated with cell-cell binding as biofilm formation in many
heterotrophic pathogens. This is consistent with the essential role of (p)ppGpp in
58
regulating a large portfolio of pathogenic phenotypes related to invasion, survival and
persistence during infection of hosts by these bacteria, which may or may not include
biofilm formation (179). In E. coli, biofilm formation is (p)ppGpp-dependent, but only
under specific growth conditions (slow growth rate and also serine limitation) (180).
Enterohaemorrhagic E. coli deficient in (p)ppGpp production loses adherence required
for attaching to host cells, in addition to losing expression of pathogenicity islands
required for invasion and destruction of host cells (181). Similarly, Listeria
monocytogenes relA mutants were also deficient in both surface attachment and also
virulence (182).
Similar to biofilm formation by pathogens, the generally non-pathogenic
oligotrophic bacterium C. crescentus, which has a motile cell and an attached cell over
the course of its life cycle, increases (p)ppGpp during transition to attachment as part of a
larger regime change in physiology, including becoming competent for cell growth and
division. Unlike other bacteria, higher (p)ppGpp levels during nutrient limitation
correspond to the motile cells in this species, rather than the attached cells (183).
Myxococcus xanthus, which feeds on other bacteria for its primary food source, has a
feedback mechanism that allows it to continue to form (p)ppGpp-dependent fruiting
bodies (multicellular aggregates) even when amino acids are not limiting (184).
Generalizing from these results in heterotrophs, the mechanisms and conditions of
(p)ppGpp-dependent cell-cell binding to vary by species and are part of a larger
physiological adaptation to the specific lifestyles of the bacteria. Therefore, it is plausible
that aggregation or other forms of cell-cell binding is not a requirement of SR under all
conditions. Consistent with this view, a study of the cyanobacterium S. elongatus

59
showed that SR occurs when shifted to dark conditions (178); aggregation was not a
phenotype reported as part of this study, or other studies of SR in Anabaena PCC 7120
and R. sphaeroides (185) (164, 165). Cyanobacteria include a circadian rhythm to
coordinate global gene expression in anticipation of predictable 24-hour cycles of light
and dark (186, 187); these studies also do not report aggregation upon shift to dark
conditions, which also support that aggregation is not a requirement of SR in
cyanobacteria.
While circadian rhythm induces transcriptional changes in advance of nightfall,
SR is induced after shift to darkness in S. elongatus, and the degree of SR did not
correlate with the timing of the internal clock mechanism of entrained cultures (178),
suggesting that SR and circadian rhythm are regulated separately in S. elongatus. This
would be beneficial in that it would allow S. elongatus to activate SR during
unpredictable shifts to dark caused by changes in daytime weather conditions, for
example. Growth in dark conditions is similar to stationary phase for phototrophs, which
use light as a primary energy source: dense cultures create light-limiting conditions due
to self-shading of cells (150, 188, 189), resulting in reduced translation and switch to
maintenance-level heterotrophy from rations of limited glycogen stores (190). Since
aggregation results in self-shading, it may be that one of the consequences of aggregation
is dark-induced SR, which would reverse the cause-and-effect paradigm such that the
stringent stress response is an effect of aggregation, rather than the cause. Alternatively,
since SR occurs in the dark in phototrophs, whereas aggregation occurs in the light, it
may be that aggregation in does not engender a SR at all in these phototrophs.

60
As described previously, several species of cyanobacteria have been reported to
have c-di-GMP dependent aggregation and biofilm formation in response to a variety of
environmental factors including wavelengths of light, temperature, and salinity (128,
132); these studies did not report on whether SR was activated in aggregated cultures. I
serendipitously identified a condition of sterile-filtered, autoclaved, room-temperature
supernatant as inducing rapid floating floc formation (3 hours); the rapidity and degree of
aggregation suggested a strong regulatory response that could be profiled more
effectively than the slower 6 hour aggregation reported in Chapter 3.
Here I report preliminary transcriptomic evidence supporting the conclusion that
aggregation is correlated with SR in the light in Synechocystis. I compared my RNA seq
results of genes differentially expressed between aggregated and control Synechocystis
cultures to 50 conserved genes identified as related to SR in S. elongatus due to being
differentially expressed across at least two of three different comparisons of wild-type
and mutant (relA mutant, (p)ppGpp-constitutive mutant) cultures under dark and light
conditions. Additionally, I grouped the list of differentially expressed Synechocystis
genes according to predicted function, and report anticipated outcomes for SR as
indicated by genes that are differentially expressed across diverse bacteria during SR
(such as down-regulation of ribosomal RNA genes and up-regulation of certain stress
response genes) for both aggregated and control conditions. I discuss the implications of
my findings for improved understanding of cyanobacterial physiology under natural
conditions and for biofuel applications.

61
4.2 Materials and Methods
4.2.1 Aggregation of cultures
Synechocystis wild-type cultures were grown as described previously.
Exponentially growing cultures (OD730 ~ 0.8) were harvested by centrifugation at
6000xg for 20 minutes. Control cultures were resuspended in sterile-filtered supernatant.
For aggregated cultures, the supernatant was sterile-filtered, autoclaved for 15 minutes,
returned to 30 °C by shaking in ice bath, and then returned to cultures. Cell suspensions
were then transferred to 100 mL glass cylinders and incubated statically with illumination
until aggregation occurred (3 hours).
4.2.2 Isolation, sequencing and analysis of RNA transcriptomes
Aggregated and unaggregated cultures (15 mL per sample) were transferred
directly to RNA Protect Bacteria reagent according to manufacturer’s instruction
(QIAGEN). RNA Protect treated cells were then pelleted by centrifugation at 6,000xg for
5 minutes, decanted, and stored at -80 °C. Cells were lysed by enzymatic digestion
method and RNA was isolated using the RNeasy purification kit (QIAGEN) according to
manufacturer’s instructions. RNA elutions were treated with DNase I (Rapid-Out,
Thermo-Fisher) and assessed with an Agilent 2100 BioAnalyzer; all RNA had an RNA
integrity number (RIN) score of at least 7 except for Control Sample 1, which had a RIN
score of 5.8.
RNA was fragmented to 200 bp using a Covaris 220 shearing instrument before
automated reverse transcription and cDNA library amplification on an Apollo 324 robotic
liquid handling platform (IntegenX) using a Single Primer Isothermal Amplification kit
(NuGEN). Illumina-compatible adapters and barcodes were ligated to the cDNA using

62
the KAPA DNA Library Preparation Kit (KAPA Biosystems). cDNA libraries were
amplified using Hifi Library Amplification kit (Kapa Biosystems), and quantified via
BioAnalyzer and qPCR. Libraries are multiplexed and denatured according to Illumina
instructions. The NextSeq System platform (Illumina) was used to perform high output
sequencing (1x75 base pairs, 400 million reads) for a predicted sequencing depth
(clustered with other libraries) of approximately 2080x coverage of the Synechocystis
genome (~3.6 MB).
RNA-seq reads for each sample were quality checked using FastQC v0.10.1.
FASTA and .gtf files of Synechocystis PCC 6803 substrain GT for genome sequence and
annotation references were accessed from Ensembl (191), release 29, bacterial collection
10 (192). A series of sequence quality control metrics were generated on the .BAM files
by RNA-SeQC v1.1.8 (193). Reads were aligned to the reference genome using TopHat
v. 2.1.1 (194) and Cufflinks v2.2.1 was used to report FPKM values (fragments per
kilobase of transcript per million mapped reads) and read counts (195). FPKM for
differential expression was used in edgeR package from Bioconductor v3.2 in R 3.2.3
(196). A multi-dimensional scaling (MSD) plot was drawn by plotMDS, in which
distances correspond to leading log-fold-changes between samples. False discovery rates
were corrected for statistical significance from multiple comparisons using Benjamini–
Hochberg adjustment. Pathway enrichment with DAVID v 6.7 (197, 198) was used to
identify affected pathways in expression data from the Gene Ontology database (GO
Terms) (199).
Differentially expressed genes with p-values < 0.05 were selected; each of these
entries have at least a 4-fold change in expression level between control and treatment
63
samples. This list of candidate differentially expressed entries was further manually
curated by BLASTP search of entries using default parameters to assign predicted
functions. Additionally, entries that did not show consistent expression trend between
condition and treatment replicates (i.e. inconsistent / overlapping FPKM ranges between
treatment and control conditions) were excluded from the set of potentially biologically
significant differentially expressed transcripts. The final lists of genes were grouped
according to biological function (Table A.1).
4.3 Results and Discussion
4.3.1 Genes predicted to be up-regulated during stringent response
In Figure 4.1, I anticipate that if aggregated cultures are undergoing stringent
response, then I should see a larger number of gene entries in the Aggregated section of
Figure 4.1A, and in the Control section of Figure 4.1B. I discuss each of those predictions
separately. First, in Figure 4.1A (below), I found strong evidence supporting the
conclusion that aggregated Synechocystis cultures have undergone SR, based on up-
regulation of several genes central to SR phenotype in bacteria; namely hpf, uspA, and
also trnY. Up-regulation of ribosome hibernation promotion factor hpf in aggregated
Synechocystis cultures (Table A.1, p-value = 0.03) was also reported in S. elongatus
cultures under all three comparisons correlating with elevated (p)ppGpp. This factor
causes (p)ppGpp-dependent dimerization and inactivation of ribosomes by promoting
dimerization during SR in a variety of Gram-positive and Gram-negative bacteria (200,
201). In S. elongatus, up-regulation of hpf correlated with direct measurement of
increased (inactivated) ribosome dimers and a 2-fold decrease in protein synthesis; ∆hpf
mutants did not form ribosome dimers.

64
Up-regulation of uspA, coding for universal stress protein (Table A.1, p-value =
0.0007), was also detected in aggregated cultures. uspA is found in all domains of life and
is upregulated in response to a number of stressors, including activation by (p)ppGpp
during SR (202). In E. coli, high levels of (p)ppGpp cause de-repression of uspA by the
repressor FadR under conditions of severe starvation (166). uspA was not reported for SR
in S. elongatus, which may be due to the fact that SR was induced by shift to dark, rather
than nutrient-specific condition. Additionally, UspA has been implicated in response to
UV stress and DNA damage conditions (203), which may be negatively regulated in
phototrophs in dark conditions (but not aggregation conditions in the light), although this
has not been addressed in the literature. Up-regulation of trnY, for biosynthesis of tRNA
(Table A.1, p-value = 4E-4) was also found in aggregated Synechocystis cultures. Amino
acid biosynthesis and import is one of the hallmarks of SR, as activation of SR is tied to a
molecular mechanism of amino acid starvation in characterized bacterial systems, and up-
regulation of amino acid synthesis is a logical adaptive response to amino acid limitation.

65
Additional supporting evidence that is consistent with SR while not directly tied
to (p)ppGpp-dependent mechanisms included up-regulation of homologs for iron citrate
uptake (fecB, p-value 0.03) and also for thioredoxin (trxA, p-value 0.04) which is used to
regulate redox levels such as during transition from photosynthesis to respiration (204,
205). Furthermore, most of the genes grouped under biomolecule export, cell wall
biogenesis, secondary metabolite production, and DNA replication (Table A.1, categories
4.1A
4.1B
Figure 4.1: Incidence of Synechocystis genes predicted to be differentially expressed during stringent
response, grouped by experimental condition.
Figure 4.1 summarizes the results of Table A.1, which is a list of Synechocystis gene expression results
for 50 homologs identified as differentially expressed during stringent response in other bacteria. These
homologs were curated from RNA seq data of S. elongatus genes differentially regulated under at least
2 of 3 comparisons in WT and two mutant strains under dark and light conditions. Additionally, genes
reported in the literature as widely conserved parts of stringent response were also included. In Figure
4.1A, RNA seq results are reported for all homologs in Table A.1 predicted to be up-regulated during
stringent response, and are grouped according to whether they are up-regulated in aggregated cultures
(left), control cultures (right) or unaffected by growth condition (middle, intersection). Similarly, Figure
4.1B reports results for homologs predicted to be down-regulated. Entries of specific interest in each
category are listed in text under the total number of entries in that category.

66
5, 13, 15, and 16) were down-regulated in aggregated cultures (19 genes) vs control (6
genes), consistent with predictions for SR. As most genes in Synechocystis contribute to
multiple categories of function, the role assignments in Table A.1 are somewhat arbitrary,
so these findings are inconclusive without additional information determining their
specific role, if any, in SR.
Overall, only 3 of the 7 genes in S. elongatus reported to be up-regulated by
(p)ppGpp across all three comparisons tested are conserved in the Synechocystis genome;
of these 3 genes, only one was also up-regulated in aggregated Synechocystis cultures,
namely hpf. Not coincidentally, the other 4 S. elongatus genes were annotated as
hypothetical and did not exist as homologs in Synechocystis; likewise, many hypothetical
genes up-regulated in aggregated Synechocystis cultures (Table A.2) did not exist as
homologs in S. elongatus, suggesting that hypotheticals not conserved between these two
closely related cyanobacterial species may represent variation in how they customize
their SR mechanism. Other genes up-regulated in S. elongatus in all SR conditions tested
include transcription of glutamate synthase inactivator gifA. In contrast, this study
showed gifA genes were not differentially regulated between aggregated and control
cultures of Synechocystis (p-value = 0.1, Table A.1). The function of GifA is a repressor
of glutamine synthase (206) under certain conditions, including increased role of
ammonium as a nitrogen source (207). In this study, the gifA result suggests that
aggregated cultures of Synechocystis are experiencing lowered /decreased ammonium
status, which is consistent with up-regulation of an ammonium permease (uptake) gene in
aggregated cultures (Table A.2, Category 3, amt1, p-value = 0.046).

67
Some of these results contradicted the conclusion that aggregated cultures
undergo SR. Specifically, two genes related to translation went against trends consistent
with SR: smpB (p-value = 0.045), which relates to trans-translation (ribosome recovery
mechanism during SR (208)) was higher in control cultures (Figure 4.1A). Similarly, the
gene for the large ribosomal protein, rpmC (p-value = 0.0075) was higher in aggregated
cultures of Synechocystis (Figure 4.1B), whereas SR would predict reduced ribosomal
protein synthesis under this condition. In the results with S. elongatus, genes for trans-
trans mechanisms or ribosomal proteins were not reported as differentially expressed.
The authors indicated that SR of heterotrophic bacteria includes translation-regulating
mechanisms on a variety of time-scales, from rapid action of (p)ppGpp directly on
ribosome translation activity (209, 210), to slower effects of reducing transcription of
ribosomal proteins via modulating activity of sigma factors. The molecular mechanisms
of cyanobacterial (p)ppGpp on activating SR is unknown, but given the results of S.
elongatus SR transcriptomes, it’s possible that the higher transcription of 50S ribosomal
protein in aggregated Synechocystis cultures and trans-translation in control cultures was
due to slower response of these regulatory mechanisms during SR. Additionally, the
control cultures up-regulate larger numbers of stress response genes (19 in control vs 6 in
aggregated condition, Table A.2, category 4 and category 11) that may also have
mechanisms for conserving translation resources.
4.3.2 Genes predicted to be down-regulated during stringent response
In Figure 4.1B, the difference in my predicted results of down-regulated genes
from those in S. elongatus could be attributed to use of nutrient status instead of dark
conditions for inducing SR. Specifically, S. elongatus shows down-regulation of sbtA

68
expression in the dark vs the light in wild-type, and also down-regulated in a (p)ppGpp+
constitutive mutant in the light vs control WT in the light, but up-regulated in the dark
(WT) vs a relA mutant in the dark. If sbtA expression levels were only affected by
(p)ppGpp as part of SR, then it should have down-regulated in all three comparisons. The
fact that it is not down-regulated in WT in the dark compared to the relA mutant in the
dark suggests that sbtA expression is responding to illumination status, in addition to SR.
SbtA is a bicarbonate transporter whose expression is light-dependent (211), consistent
with this analysis. In Synechocystis, sbtA was not differentially regulated between
aggregated and control cultures (Figure 4.1B). Similarly, hspA correlated with increased
(p)ppGpp with 2 of 3 comparisons in S. elongatus but not in the (p)ppGpp-constitutive
mutant in the light; this gene is known to be strongly down-regulated in the dark in S.
elongatus (212) and likely requires additional dark-induced factors for its regulation.
hspA was upregulated in my control culture (Table A.1, p-value = 0.005).
4.3.3 Genes related to the illumination status of aggregated cultures
I sought to better characterize the illumination status of aggregated vs control
cultures, to determine whether self-shading of aggregated cells was causing dark
conditions sufficient to induce SR. In a previous study, cmpB (slr0041, bicarbonate
transport permease) is down-regulated nearly 12-fold in Synechocystis within 1 hour in
the dark (213); while this gene was down-regulated in aggregated cultures in my study, it
was not to a statistically significant degree (p-value = 0.15, data not shown), suggesting
that either that the degree of aggregation was insufficient to create darkness through self-
shading in most of the cells, or that the cells were harvested before maximum reduction
of this transcript level due to darkness. Additionally, psbA2 has been previously shown to

69
be up-regulated 6-fold Synechocystis within 15 minutes of shift from dark to light (214,
215); my results do not support significant difference in psbA2 levels between treatment
and controls (p-value = 0.65; data not shown). I conclude that my aggregated cultures
were not self-shaded to a degree sufficient to create dark conditions, relative to control
cultures. I note that aggregated cultures may however experience lower light than
controls, based on up-regulation of 6 genes coding for light-harvesting pigments (216,
217) (Table A.1, category 12: phototrophy).
4.4 Conclusions
4.4.1 Synechocystis undergoes SR during aggregation in the light
The biological purpose of SR is to provide survival adaptation during stress. In S.
elongatus, it has been characterized as induced to maintain viability in the dark when
energy and nutrients are rationed. These findings provide preliminary evidence that
Synechocystis also undergoes SR during change in nutrient status in the light, most likely
nutrient limitation, as indicated by up-regulation of ribosome hibernation promotion
factor hpf, universal stress response transcript uspA, and other genes consistent with SR
phenotype. Since aggregation is light-dependent, and dark-condition genes such as hspA
and cmpB were not up-regulated in aggregated cultures, I conclude that the SR was not
due to light limitation caused by self-shading of cells in aggregated cultures. While many
of these results did not correlate with the patterns of gene expression in S. elongatus SR,
especially in genes predicted to be down-regulated (Figure 4.1), I find that most of these
inconsistencies can be attributed to the use of dark conditions rather than nutrient status
to induce S. elongatus SR. This is the first evidence of a WT cyanobacterium undergoing
SR in the light upon change in nutrient status, which is consistent with SR due to nutrient
70
limitation in heterotrophic bacteria, and consistent with the cause and effect paradigm of
aggregation occurring as a result of stress.
4.4.2 The role SR and aggregation in natural environments
In Enterococcus faecalis, a Firmicutes, loss of (p)ppGpp regulation affects
secondary carbon metabolism; evidence supports use of basal fluctuations in (p)ppGpp
levels to respond to minor changes in external and internal carbon fluxes for cellular
fitness, not just survival (218). In Beta- and Gamma-proteobacteria (including E. coli),
levels of (p)ppGpp are not biphasic in activating physiological responses, but rather occur
along a gradiation (158), with SR only occurring at higher levels of (p)ppGpp when other
homeostasis mechanisms for restoring amino acid levels, such as the leucine-responsive
protein pathway, have failed (158). I have shown previously in Chapter 3 that
Synechocystis, upon shift to reduced nutrient strength, undergoes sedimenting
aggregation in about 6 hours, whereas autoclaved nutrients (this study) induce rapid,
floating flocs of aggregation in just 3 hours. If so, then the degree of aggregation can
serve as an indicator of not just the presence or absence of SR, but also the severity of the
response. It is assumed that the difference in floating versus sedimenting aggregated cells
comprises a difference in rate and quantity of aggregation, but not type of aggregation.
Migration of cyanobacteria through the water column is a normal part of their
seasonal adaption, forming blooms on lake surfaces in spring and benthic layers in the
winter (219, 220). Aggregation into buoyant flocks during transition to spring season is
part of this process of migration. One of the predicted benefits of aggregation under
nutrient limitation in cyanobacteria is that both sedimentation or floating flocculation
promote migration of cells through the water column to new locations with improved

71
nutrient status; presumably the degree of aggregation is tuned to the degree of nutrient
limitation, such that severe nutrient stress promotes increased travel distance.
4.4.3 Suggested future work
It is noteworthy that in cyanobacteria, dark conditions (and SR) do not entail
aggregation, whereas SR under nutrient limitation in the light is accompanied by
aggregation. These results suggest that aggregation is regulated separately from SR,
which is different than the cause-and-effect paradigm that aggregation is the result of
stress response such as SR. If a (p)ppGpp-null mutant of Synechocystis is unable to
aggregate under nutrient limitation despite having the full complement of c-di-GMP-
dependent genes known to be needed for cellulose-dependent aggregation, that would
suggest that the SR regulatory circuits include an optional on-off switch for aggregation;
identification of this switch in bacteria would be beneficial for both basic and applied
science in synthetic biology of biofuels and medicine. Alternatively, if this mutant were
able to aggregate, this would contradict interpretation of aggregation as part of a
conserved stress response like SR. Additional studies with such a (p)ppGpp-null mutant
would help to refine understanding of how stress from nutrient limitation is distinct from
regulatory pathways of stresses that engender SR. Additional elements to include in
these proposed experiments would be using differential RNA sequencing (separate sense
and anti-sense transcriptomes), as a previous study identified 314 non-coding RNAs, 866
genes potentially regulated with anti-sense RNA, in addition to the identification of
small-peptide RNAs, all of which have had their transcriptional start sites mapped, but
whose roles in biological function are understudied (140). Finally, mutational analysis of

72
hypothetical genes or other genes found to be differentially regulated in this study would
be valuable.
In addition to increasing understanding of the basic science of cyanobacterial
physiology, aggregation is also useful as an indicator of culture health for biofuel
feedstock cultivation systems. SR could likewise be engineered to activate a reporter
molecule such as green fluorescent protein to rsh transcription, enabling PBR engineers
to more easily monitor stress response in cultures or in engineering strain metabolism,
even when aggregation does not occur. These findings suggest that one strategy to begin
this work would be comparing transcriptomes of dark condition vs cultures with altered
nutrient status in Synechocystis to help clarify the minimum core of genes conserved in
SR between these two conditions. In general, identifying which environmental
conditions result in SR with and without aggregation will help cultivation system
engineers and strain engineers to capitalize on the whole range of metabolic capabilities
and growth conditions biocompatible with this versatile, highly adaptive organism.

73
CHAPTER 5
SYNTHETIC ECOLOGY FOR QUANTITATIVE PREDICTION OF ANTI-
CONTAMINATION STRATEGIES IN BIOFUEL-PRODUCING CULTURES OF
SYNECHOCYSTIS PCC 6803
5.1 Introduction
To fulfill the promise of microalgal biofuels as a carbon-neutral, renewable
alternative to fossil fuels, cultures must be grown at unprecedented scale, while
maintaining low cost; for recent reviews, see (221-223). Current approaches to
maintaining healthy and productive biofuel feedstock cultures at large scale draw from
modern industrial agriculture techniques, including use of selective growth conditions,
antibiotics, and co-culture techniques. For example, in open ponds of microalgae, fish are
introduced in order to reduce predation by zooplankton (224). Co-culture of ‘refuge’
species also protects more vulnerable macro-algae feedstock cultures from predation
(225). Deliberate co-culture of multiple microalgal feedstocks in open ponds in order to
increase biomass production and reduce grazing by zootrophs (Daphnia pulex) have also
been used (226).
Synthetic ecology is an emerging specialty in microbiology (reviewed in (227-
229)). Capabilities and interest have accelerated in recent years due to advances in next-
generation sequencing, bioinformatics, and synthetic biology. Methods for synthetic
ecology include rational design of defined minimal or representative microbial consortia
to simulate naturally occurring populations. Recent ecosystems to be studied include
natural systems such as the human gut (230), and engineered systems such as bioreactors

74
(226, 229, 231). A literature search did not identify any studies to dae that attempt to
model naturally occurring PBR contamination using an artificial microbial consortium.
Synechocystis has been engineered previously to secrete elevated levels of long-
chain fatty acids such as laurate (20). These strains were cultivated in a 4000-liter rooftop
photobioreactor (PBR) as a test-bed for industrial-scale production of this J8 jet-fuel
precursor (232). Decrease in laurate yield corresponded with increase in growth of
heterotrophic bacteria in the PBR (hereafter referred to as heterotrophs) (233). These
heterotrophs were able to grow using soluble microbial products (SMP) of Synechocystis
for fixed carbon and nitrogen, as well as consuming laurate (136).
The objective of this pilot study was to test the proof-of-concept of whether it is
possible to accurately and reproducibly model the bacterial PBR contaminome under
controlled laboratory conditions in order to predict optimal PBR operation. The approach
I used was to build a statistical model using an artificial Defined Consortium of
heterotrophic bacteria, and see if the model predictions were still accurate when other
contaminant species were used. Specifically, I built a regression model using a Defined
Consortium comprised of a set of 40 axenic isolates of heterotrophic bacteria, and tested
model predictions using novel Consortia. In this test case, I chose to optimize levels of
three chemical additives that I hypothesized would be effective in mitigating the
accumulation of heterotrophic bacteria while allowing Synechocystis to flourish, namely
alkalinity, sodium chloride, and the antibiotic kanamycin.
In addition to building and testing these models, I performed a set of experiments
to better inform the interpretation of the model results. First, I conducted a laurate time-
course assay to test whether levels of salt, kanamycin, and/or pH predicted to be optimal

75
by the model were sufficient to protect the presence of laurate in deliberately
contaminated Synechocystis cultures. I also screened a panel of mutant Synechocystis
strains previously shown to lack cell surface structures (99, 101, 102, 104, 121) to
investigate the effectiveness of genetic means of reducing contaminant food sources in
the PBR supernatant. Finally, I used Illumina-generated 16S rRNA gene sequence data
and PICRUSt metagenomic prediction (234) to assess Consortia community structure and
function for improved understanding of PBR contaminome ecology, thereby informing
improved contaminant mitigation strategies suggested by my results.
5.2 Materials And Methods
5.2.1 Defined consortia:
All isolation and propagation of bacterial cultures was conducted axenically at 30
°C and 24-hour illumination, with shaking or aeration of liquid cultures, unless otherwise
indicated. Axenic status of Synechocystis culture stocks was determined via microscopy,
and also T-RFLP, as follows: liquid cultures were prepared using sterile technique and
cell pellets were collected via centrifugation for 5 minutes at 6,000xg. Decanted cell
pellets were processed to extract genomic DNA using the Blood and Tissue DNeasy kit
(QIAGEN) with indicated modifications for Gram-positive bacteria. The 16S rRNA gene
sequence was amplified from genomic DNA using Taq Master Mix PCR kit (QIAGEN)
and universal bacterial primers: HEX-labeled 8F (AGA GTT TGA TCC TGG CTC AG)
and unlabeled reverse primer 1392R (ACG GGC GGT GTG T) (137). Resulting
amplicons were purified with QIAQuick PCR Purification Kit (QIAGEN) and digested
with restriction endonuclease enzymes (138) HaeI, HhaI, MseI, and MspI (New England
Biolabs). Digested fragments were analyzed with a 3730 capillary sequencer (Applied

76
BioSystems) and sized via ROX 1000 ladder (ThermoFisher). To the degree that these
methods are able to detect contamination, cultures were considered axenic if they did not
have any non-Synechocystis peaks in resulting fragment spectra.
Heterotrophic bacteria for Defined Consortia were assembled from diverse
sources, including non-axenic cultures grown in shake flasks or PBRs (150) cultivating
WT Synechocystis parent strain (136) or fatty-acid secreting mutant SD304, a kanamycin-
resistant version of SD277 (20). Ten of the strains of Consortium 1 were isolated by
growth on BG11 agar plates (135) supplemented with sodium laurate as sole organic
carbon source. Colonies with varying appearances were preferentially selected to increase
likelihood of sampling diverse phyla. Isolated colonies were re-streaked repeatedly as
needed to generate axenic stocks, which were then propagated on LB agar plates (138).
Single colonies were used to inoculate LB liquid growth medium and incubated overnight
at 30 °C with shaking. Samples of liquid culture were frozen at -80 °C with sterile 10%
glycerol.
Additional sources of heterotrophs for Defined Consortium 1 included Tempe
Canal, an open-air fresh water body fed by Arizona watershed surface and ground water
(235), including the Verde and Salt River watersheds (sample site latitude 33.4217;
longitude -111.927). Bacteria from water and soil samples from Tempe Canal were
harvested via centrifugation at 6,000xg for 15 minutes, resuspended in 100 mL of log-
phase Synechocystis culture, and incubated for 7 days to ensure heterotrophs chosen for
Consortia were viable under experimental conditions. The culture was then centrifuged as
above and the cell pellets were used to inoculate LB agar plates. Colonies with diverse
phenotypes were propagated on new LB agar plates until axenic.

77
For Defined Consortium 2, all 40 isolates were sampled from non-axenic Synechocystis
cultures grown in PBRs or flasks, and isolated on LB agar plates as above.
5.2.2 16S rRNA gene sequencing and BLAST identification of Defined Consortia
Isolates:
Axenic cultures of each of the 80 isolates for the two Defined Consortia were
grown overnight in LB liquid medium. 1 mL samples were harvested as described above.
To identify species, 16S rRNA was prepared and purified as described above using
unlabeled primers. Sequencing reactions were prepared and purified using standard
procedures (138). 16S rRNA sequences were determined via Applied Biosystems 3730
capillary sequencer. Species identities of nearest related OTU were assigned by BLASTN
search of NCBI Microbe database using default parameters (236). All BLAST identity
scores were at least 99% (data not shown).
Community analysis of Consortium growth in Synechocystis supernatants was
performed as described previously (136), in accordance with Earth Microbiome Project
guidelines (237). Genomic DNA was isolated from cell pellets as described above. The
V4 regions of 16S rRNA gene libraries were amplified using bar-coded 806f and 515r
primers (238). The resulting 16S rRNA gene libraries were analyzed via Illumina MiSeq
2000 platform. Sequence data were analyzed using QIIME software package version
1.8.0 using default parameters, unless noted otherwise. Sequences were clustered in
OTUs having 97% similarity with uclust (239). Representative sequences for each OTU
were classified using the RDP classifier version 2.2 (240) and retrained on the
Greengenes (241) database v. 13.8 pre-clustered at 97% identity. Representative
sequences were aligned with PyNAST v. 1.2.2 (242) and a phylogenetic tree was

78
constructed with FastTree (243) for use in phylogenetic diversity calculations. Singletons
and chimeras (244) were removed, and sample sets were normalized via rarefaction. I
modified taxonomy plot data at genus level for each sample by aggregating all genera at
less than 6% relative abundance for that sample into an ‘Other’ category.
5.2.3 Selection of mitigation factors and levels
Factors (salinity, antibiotic, and alkalinity) were chosen for applicability to large-
scale microbial biofuel cultures. High factor levels were empirically determined using
viability and growth-rate screens, such that the final statistical model would encompass
the complete range of additive concentrations biocompatible with laurate-producing
Synechocystis strains (the biocompatible sample space).
Kanamycin (kan) was chosen as a representative antibiotic because its activity is
not affected by salinity or alkalinity, nor is it photo-degraded. All 80 heterotroph isolates
of the two Defined Consortia were screened on LB agar plates supplemented with 50
µg/mL of kanamycin; both Consortia contained 10 kan-resistant isolates and 30 kan-
sensitive isolates (data not shown). To establish the range of kan concentrations to be
tested in the statistical model, kan-resistant Synechocystis biofuel strains were grown in a
serial dilution from 0-400 µg/mL kanamycin in 100 mL of BG11 liquid media; 200
µg/mL was selected as the high level of kan concentration as it showed no growth rate
defect compared to the negative control (data not shown).
Similarly, Synechocystis is naturally salt-tolerant (2), able to grow in liquid BG11
cultures with up to 0.8 M added NaCl (data not shown); sea water on average is ~0.6 M
salinity. I selected 0.6 M as the high level of added NaCl concentration with robust

79
growth rate by laurate-secreting strain SD304, and because of its relevance to seawater
cultivation.
Synechocystis is also naturally alkaliphilic, with optimal growth in BG11 between
pH 7 and 8.5, and reasonably robust growth up to pH 11 (150, 245). I screened
biocompatibility of Synechocystis strains in BG11 liquid buffered with a variety of
common cell culture buffers. I observed Synechocystis growth in BG11 media at pH 7.5
buffered with TES (pKa of 7.4); Tricine buffered to pH 8.5 (pKa of 8.1); and CHES
buffered to 9.5 (pKa of 9.3) (data not shown) as similarly rapid to growth in unbuffered
BG11. All buffers were at 10 mM concentration.
5.2.4 Factorial Analysis, Regression and Model Testing in Rich Media.
I prepared 15 bottles of sterile liquid LB media (100 mL each) with levels of the
three additives in different combinations of concentrations according to the conditions
indicated for Tubes 1-17 in Table 5.1 (uncoded levels). Three mL samples of each type
of medium were transferred to 17 sterile test tubes. Data for a total of three biological
replicates were generated using Defined Consortium 1; each replicate was performed
using consortium isolates that were freshly inoculated from freezer stocks to LB agar
plates.

80
Table 5.1: Central composite design of a 23 full factorial augmented with center points and axial points.
Coded Levels Uncoded Levels
Category Tube # Added
NaCl
Kan.
sulfate
pH (10
mM
buffer)
Added
NaCl,
Molar
Kan.
sulfate,
ug/mL
pH (10
mM
buffer)
Full
Factorial
1 1 1 1 0.51 170.67 9.20
2 1 1 -1 0.51 170.67 7.80
3 1 -1 -1 0.51 29.30 9.20
4 1 -1 -1 0.51 29.30 7.80
5 -1 1 1 0.09 170.67 9.20
6 -1 1 -1 0.09 170.67 7.80
7 -1 -1 1 0.09 29.30 9.20
8 -1 -1 -1 0.09 29.30 7.80
Center
points
9 0 0 0 0.30 100.00 8.50
10 0 0 0 0.30 100.00 8.50
11 0 0 0 0.30 100.00 8.50
Axial points
12 -1.414 0 0 0.00 100.00 8.50
13 1.414 0 0 0.60 100.00 8.50
14 0 -1.414 0 0.30 0.00 8.50
15 0 1.414 0 0.30 200.00 8.50
16 0 0 -1.414 0.30 100.00 7.50
17 0 0 1.414 0.30 100.00 9.50
81
Each of the 40 isolates of Defined Consortium 1 freezer stocks were streaked on
LB agar plates and incubated for 2 days at 30 °C. Samples of an isolated colony from
each stock were propagated overnight in 40 separate 3-mL cultures of LB liquid medium
without additives. The growth of each of the 40 liquid cultures was estimated by
measuring absorbance units at OD600. To prepare the Consortium, different volumes of
each of the 40 axenic cultures were combined in a single new test tube such that each
strain contributed to approximately 1/40 the total OD600 in the new tube. The final mixed
population of heterotrophs in the new tube comprised Defined Consortium 1. The same
process was applied to isolates 41-80 to create Defined Consortium 2 when needed.
The Defined Consortium was mixed to a 1 mL volume at an OD600 of 1.0, and
used as an inoculum for Tubes #1-17 at a starting OD600 of 0.001 (representing the
combined contribution of all 40 isolates). The 17 tubes were incubated for 24 hours as
previously and the OD600 of each tube was recorded. These data were direct inputs for
statistical analysis (they were not normalized or transformed before analysis).
5.2.5 ANOVA, Regression Analysis, and Testing of Model in LB broths.
The response variable was combined growth of the heterotroph contaminants in
Defined Consortium 1, as measured by absorbance at OD600 at 24 hours. ANOVA and
regression using least squares fitting were performed on coded units using Minitab 16
statistical software (246). Trials were blocked by replicate, and linear and second-order
factors and interactions were analyzed. ANOVA output (not shown) was used to
generate a response regression model with factor levels measured in coded units
(Equation 1, below).

82
Model adequacy checking by normal probability plot of residuals, and plots of
residuals vs run order and fit values corresponded with acceptable levels (247) (not
shown). In Figure 5.3, a surface response plot corresponding to Equation 1 is shown were
generated using the surface plot function in JMP Pro 12 (248). In Table 5.2, below,
model predictions of the total OD600 after 24 hours were generated for 4 different growth
conditions using the Minitab OptiPlot function to solve the regression (Equation 5.1,
Results and Discussion).
To test model predictions, I prepared media and Defined Consortium 1 as
described above, for two replicates, as well as Defined Consortium 2 for two replicates.
To test the model using an Undefined Consortium, 1.5 liters of Tempe Canal Water
(TCW) was collected and pelleted via centrifugation at 6,000xg for 20 minutes at room
temperature. The supernatant was decanted and the cell pellets resuspended in 100 mL of
LB plain liquid. A 2 mL aliquot was pelleted and frozen for subsequent community
analysis (‘TCW’ Figs. 5.1 and 5.5). The culture was grown for 24 hours and another 2
Table 5.2: Optiplot heterotroph growth response predictions from regression.
Y = OD600
(heterotroph
growth
absorbance
units)
Added Salt,
Molar
Kanamycin
sulfate,
ug/mL
pH (10 mM
buffer)
Y predicted
(heterotroph
growth
absorbance
units at
OD600)
Y lower
(95%
confidence
interval,
absorbance
units at
OD600)
Y upper
(95%
confidence
interval,
absorbance
units at
OD600)
Max 0 56.6 7.5 5.92 5.07 6.8
Min 0.6 200 8.73 -1.14 -2.00 0.04
Y=3.0 0.3 150 9.5 3.0 2.62 3.71
Y=0.01 0.58 200 7.5 0.01 -0.77 0.33

83
mL aliquot was removed (‘UC1’ Figs. 5.1 and 5.5.). This LB inoculum served as one
replicate of an Undefined Consortium, and was used to inoculate the model test media to
a starting OD600 of 0.001, as with Defined Consortia. The two replicates for the
Undefined Consortia were sampled from the same location on different dates (January
30th and August 20th 2015, respectively).
5.2.6 Factorial analysis of heterotroph mitigation in Synechocystis cultures and
supernatants.
Synechocystis cultures were grown as described above in BG11 media prepared
with levels of additives corresponding to 17 conditions in Table 5.1 in the same manner
as for LB media described above. Synechocystis supernatants were prepared using axenic
100 mL cultures of SD305, a kanamycin-resistant Synechocystis strain previously
engineered to secrete fatty acids (20). These cultures were grown to log-phase (OD730 of
~ 0.5) in BG11 liquid without additives. Log-phase cultures were sterile-filtered through
0.22 micron SteriCup filtration units (MilliPore), and salt, kanamycin and buffer
solutions were added axenically to create test conditions described as listed in Table 5.1,
Tubes 1-17. These tubes were then inoculated with Defined Consortium 1, prepared as
described above, to a starting heterotroph OD of 0.001, and incubated for 6 days. Every
24 hours, cfu dilutions were propagated on LB agar plates in order to measure cfu/mL.
5.2.7 Growth of consortia in supernatants of mutant Synechocystis cultures.
Synechocystis strains (Table 3.2) lacking pili (pilC, SD519), EPS (slr0977,
SD506) and S-layer (sll1951, SD523) (69, 99, 104) were prepared as described in
Chapter 3. Supernatants of these strains were prepared and inoculated with Defined
Consortium 1, with no additives present, and incubated as described above for 6 days.
84
Heterotroph cfu/mL were measured from Day 6 by propagating supernatant samples on
LB agar plates and counting subsequent colony formation after incubation at 30 °C for 2
days. The log10 of cfus/mL for each strain was calculated and growth of Defined
Consortium 1 in supernatants from mutant strains was reported by normalizing to the
same measurement in wild-type strains (Figure 5.5, below)
5.2.9 Laurate time course assay
Supernatants of Synechocystis strain SD305 were inoculated with Defined
Consortium 1, or with an Undefined Consortium. Additive levels for the treatment flasks
were the same as those levels predicted by Eq. 5.1 to minimize heterotroph growth in LB
over 24 hrs (‘Min’), namely 0.6 M added NaCl, 200 ug/mL kan, and pH 8.73 (10 mM
Tricine, pKa of 8.1; Table 5.2). The negative control had 0 M added NaCl, 0 µg/mL kan,
and pH 7.5 (10 mM TES, pKa of 7.4). A positive control for laurate stability had the
same levels of additives as negative controls, but with no Consortium added, in order to
test whether Synechocystis supernatant alone was able to degrade laurate under these
conditions, for example due to presence of beta-oxidation enzymes released from cells.
All flasks contained 100 mL culture volume and were spiked with a laurate stock
solution to a starting concentration of 100 mg/L (100 ppm) at the start of the time course
(Day 0 data). Every 24 hrs, 10 mL of culture from each flask was removed and laurate
was collected via hexane extraction as described previously (20). Briefly, 10 mL culture
was combined with 10 mL hexane in Oak Ridge tubes, with 0.2 g NaCl and 200 µL of 1
M H2PO4. Tubes were shaken at 200 rpm for 30 minutes at 37 °C. Extracted laurate was
then collected by centrifugation at 20,000xg for 20 minutes, with supernatant transferred
to gas chromatograph sample vials stored at -80 °C until measured. Laurate was

85
quantified via FID-GC on a Shimadzu GC 2010. Laurate peak areas were calibrated via
measurement of dilution series of sodium laurate standards of known concentrations.
Heterotroph cfu/mL were measured at each time point by plating on LB agar plates as
described above (Defined Consortium 1), or by flow cytometry (Undefined Consortium
1). For flow cytometry, 1 mL of culture was centrifuges at 6,000xg for 5 minutes,
decanted, and cell pellet resuspended in isotonic neutral buffered formalin 10% (1xPBS,
pH 7.7), and fixed for 24 hours at 4 °C. After fixation, cells were again collected by
centrifugation as above, and then resuspended in sterile isotonic saline and stored at 4 °C.
To count cells, samples were labeled with 5 µM SytoX green nucleic acid stain
(Invitrogen). Green labeled counts/mL were compared with a dilution series of samples
of known labeled cell concentration as determined by fluorescence microscopy
hemocytometer. Flow cytometer model BD Accuri C6 Plus Flow Cytometer from BD
Biosciences was used with native software. Flow cytometry data and laurate data are
biological replicates (n=2 flasks per condition). Cfu data are reported as technical
replicates (3 measurements of one flask per condition).
5.2.10 KEGG ortholog trait markers and their taxonomic distribution.
Candidate gene markers for tolerance to additives were initially identified from
literature search (Table 5.3). Taxonomic distributions of putative orthologs were
identified using STRING 10 database (1,678 bacteria) (249). As an example of how
STRING data are reported: the NhaA protein functions as Na+:H+ anti-porter in E. coli to
provide tolerance to excess NaCl; other genes in the nha operon such as nhaR code for
regulatory/accessory proteins. To perform the search, ‘NhaA’ search term from the
organism E. coli (no sub-species specified) was used to query the STRING 10 database

86
with default parameters. The top relevant search result was selected. Under ‘Occurrence’
view, taxonomic distribution of the ortholog was displayed for 29 different bacterial
clades on the vertical axis, with the number of taxa per clade ranging from 1
(Gemmatimonas aurantiaca; others) to 411 (Firmicutes), as shown in the Appendix,
Figure B.2. The number of clades containing at least one species with a putative NhaA
ortholog sequence alignment score of 80 bits or higher were counted up, and then divided
by number of total clades (29 clades) to generate %S scores reported in Table 5.3. Scores
below 60 bits are considered possibly weak or spurious orthology as a rule of thumb
according to the STRING website. Functional partners reported with NhaA were not
considered for calculating %S. The %S STRING scores for all trait marker orthologs in
Table 5.3 were assessed using the same tree of 29 clades.
Taxonomic distributions of a given marker were estimated using the Occurrence
view from the STRING database (Appendix B Figure B.2). Taxonomic distribution of
kanamycin phosphatase markers were not available in STRING, as kanamycin
phosphatase activity does not require protein-protein interactions required for curation in
the STRING database. I therefore used KEGG taxonomy view to ascertain the
distribution of K19300, which was found in multiple taxa across many phyla
(Enterobacteraceae, Alpha-, Beta, and Gamma-Proteobacteraceae, Firmicutes and
Actinobacteria; data not shown). I conclude this marker also has wide taxonomic
distribution.
5.2.11 Predictive Metagenomic analysis using PICRUSt.
QIIME 16S rRNA gene sequence data was used as input for PICRUSt software in
order to curate a master file (not shown) of all unique KEGG (250) orthologs (6908

87
orthologs total) predicted to occur in the total pool of all sequenced Consortia samples.
Twenty KEGG orthologs for trait markers of interest were identified. Identification was
initiated by searching the master file for the KEGG ortholog numbers corresponding to
orthologs identified by literature search. Additional markers coding for the same trait
mechanism were found by using the KEGG definition search terms such as those listed in
Table 5.3 (‘Adaptive mechanism’).
The final comprehensive list of 20 KEGG markers was used as input for
searching predicted metagenomes of abundant OTUs per sample (at least 10% total
abundance per sample) as PICRUSt (234) output. Table 5.3 was redacted to exclude most
markers that were not found in abundant OTU metagenomes (Fig. 5.6); all trait
mechanisms from the original 20 markers are still represented in the redacted list of 15
markers.
The most recent version of PICRUSt available uses GreenGenes v. 13.5; therefore
QIIME analysis was repeated using closed reference OTU picking using GreenGenes
v13.5 in order to correlate exact OTU numbers (one number per unique 16S rRNA gene
sequence) with their corresponding metagenomic prediction outputs from PICRUSt.
Because QIIME groups OTU abundance by genus, potentially including contributions
from more than one unique sequence per genus abundance, I sorted PICRUSt outputs by
most abundant OTU number per sample. For all abundant genera of interest, there was
one unique OTU number (unique 16S nucleotide sequence from Illumina dataset)
contributing to >90% of the total genus abundance. Metagenomic prediction data for each
OTU in Fig. 5.6 are for these unique abundant OTU numbers for each genus.

88
Five of the KEGG markers of interest were not found in the PICRUSt
precalculated metagenomics file for GreenGenes v13.5 (IMG v4), “KEGG Orthologs”:
K18095 (mexY), K18145 (adeA), K18324 (acrD), K19299 (nptIII) and K19300 (nptII).
These KEGG orthologs were likely not part of the IMG v 4 database at the time the file
was created (M. Langille, personal communication, PICRUSt users online forum). I
therefore used BLASTN (239) of the Microbe database for each of the 11 most abundant
OTU 16S sequences to identify the most closely related species with a fully sequenced
genome in the KEGG Organisms database. For all species except two, the % identity
between the 16S sequence data and KEGG organism was at least 98% for the full
sequence length (not shown). For Acinetobacter it was 96%; for Cloacibacterium, it was
93%. Presence of these five KEGG orthologs was then assessed for these 11 abundant
OTUs by searching the resulting KEGG organisms databases for each of the 5 KEGG
markers.
5.3 Results And Discussion
5.3.1 Illumina sequence data show identity but not abundance of contaminant phyla is
relatively conserved across Consortia
In Figure 5.1, I used the freshwater lake sequence database (FWLSD) (1) as a
reference for approximating the global bacterial meta-community of freshwater
microalgae cultivation system contaminomes, due to niche similarities (mesophilic, fresh
water, illuminated, aerobic, and relatively oligotrophic). Compared to the FWLSD, the
LB outgrowth (UC1) of Tempe Canal Water (TCW) was enriched for Gamma-
proteobacteria phylotypes, with reduced levels of Bacteroidetes phylotypes. Defined

89
Consortium 1 appears to most closely resemble FWLSD in terms of identities, with 6 of 7
phylotypes at the phylum level occurring in both populations.
Relative abundances are less conserved, with major differences such as higher
Firmicutes and lower Beta-proteobacteria in DC1 than TCW. The higher incidence of
Firmicutes in UC1 can be attributed to the source TCW being higher in Firmicutes as
well, whereas lack of Bacteroidetes could be due to competitive growth disadvantage
during LB propagation (compare TCW and UC1 for Bacteroidetes, for example). The
absence of Bacteroides from both Defined Consortia could be due to slower growth rate
in rich medium compared to other isolates. For example, it is present at 5.5% abundance
in TCW, has only trace occurrence in the subsequent LB outgrowth culture UC1 that
Figure 5.1. Model Consortia capture most phyla identities but not relative abundances of related
populations. FWLSD = Fresh Water Lake Sequence Database (1). TCW = Tempe Canal Water.
UC1 = Undefined Consortium 1, created by propagating TCW in LB broth for 24 hours to use as a
contaminant inoculum. DC1 and DC2 = Defined Consortia 1 and 2, comprised of 40 isolates each of
heterotrophic bacteria.

90
supports rapid growth by certain phyla, but then subsequently regains higher abundance
(21.9% +/- 12.0%) when inoculated into Synechocystis supernatants which engender
slower growth rates (NC1 and NC2). Thus Bacteroidetes is competitive in relatively
oligotrophic environments (Tempe Canal Water; supernatants) compared to rich medium
(LB broth). Studies show this phylum specializes in lake conditions associated with high
dissolved organic carbon and a role in degrading organic biopolymers, such as in periods
following cyanobacterial blooms (1, 251).
5.3.2 Model predicts amount of heterotroph growth in LB broths independent of which
contaminant species are present.
I curated axenic heterotroph isolates to create artificial Defined Consortia. The
amount of phylogenic diversity sufficient to generate a statistically significant regression
(Equation 5.1, below) in LB media as calculated by ANOVA was determined
empirically; 10 isolates per Defined Consortium were insufficient (data not shown),
likely due to absence of kan-resistant isolates. Additional factors not included in the
experimental design may be influencing the growth response, and also contribute to lack
of fit of the regression. For example, growth rate under the conditions measured would
likely influence the OD600 growth response. The Defined Consortium 1 isolates have a
slower average growth rate in LB plain broth than Defined Consortium 2 (not shown).
The faster growth rate of Consortium 2 would be especially relevant during the most
rapid part of the growth curve, which is log phase. In the model testing (Figure 5.2), the
‘Max’ test condition is in linear phase, and the ‘Min’ and ‘0.01’ conditions are in lag
phase, whereas the ‘3.0’ condition is closest to logarithmic phase. This may explain why
the ‘3.0’ condition of relatively faster-growing Defined Consortium 2 exceeded model
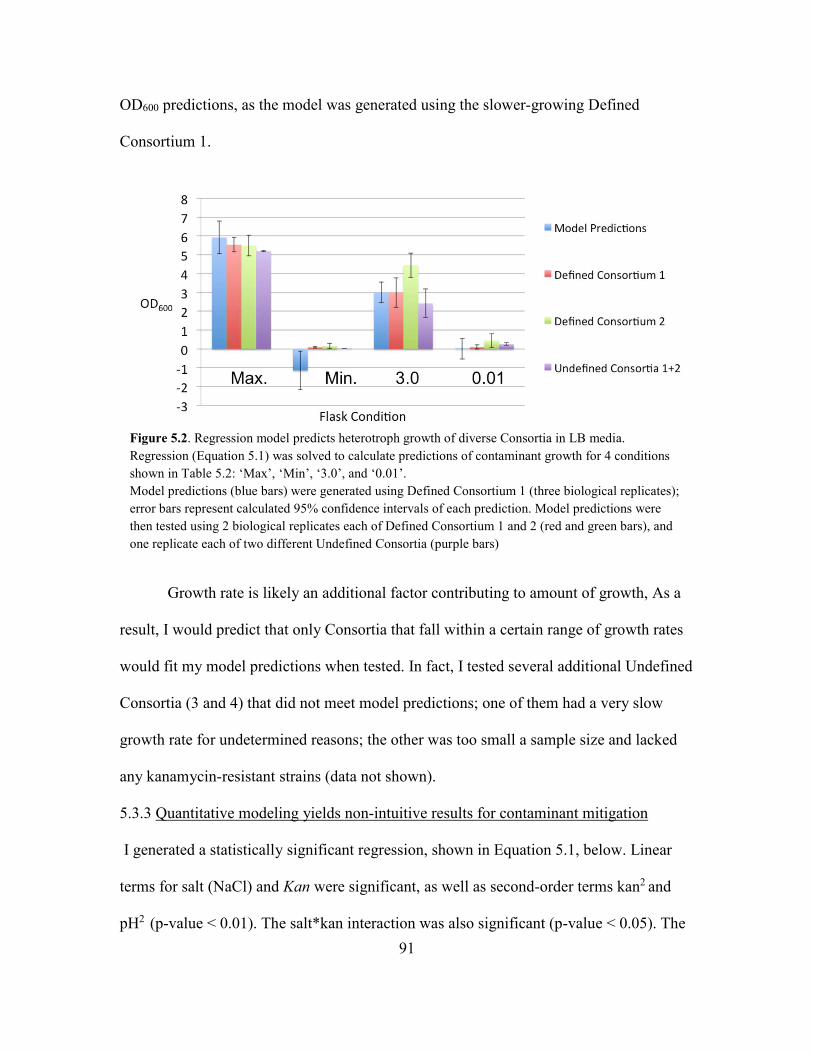
91
OD600 predictions, as the model was generated using the slower-growing Defined
Consortium 1.
Growth rate is likely an additional factor contributing to amount of growth, As a
result, I would predict that only Consortia that fall within a certain range of growth rates
would fit my model predictions when tested. In fact, I tested several additional Undefined
Consortia (3 and 4) that did not meet model predictions; one of them had a very slow
growth rate for undetermined reasons; the other was too small a sample size and lacked
any kanamycin-resistant strains (data not shown).
5.3.3 Quantitative modeling yields non-intuitive results for contaminant mitigation
I generated a statistically significant regression, shown in Equation 5.1, below. Linear
terms for salt (NaCl) and Kan were significant, as well as second-order terms kan2 and
pH2 (p-value < 0.01). The salt*kan interaction was also significant (p-value < 0.05). The
Figure 5.2. Regression model predicts heterotroph growth of diverse Consortia in LB media.
Regression (Equation 5.1) was solved to calculate predictions of contaminant growth for 4 conditions
shown in Table 5.2: ‘Max’, ‘Min’, ‘3.0’, and ‘0.01’.
Model predictions (blue bars) were generated using Defined Consortium 1 (three biological replicates);
error bars represent calculated 95% confidence intervals of each prediction. Model predictions were
then tested using 2 biological replicates each of Defined Consortium 1 and 2 (red and green bars), and
one replicate each of two different Undefined Consortia (purple bars)

92
linear term for pH was not statistically significant (-0.16*pH; p-value = 0.072). The R2
predicted value for this regression is 82.9%. The term Y refers to total Consortium
growth as measured by absorbance units at OD600.
Eq. 5.1: Y = 3.28 – 1.36 (salt) – 0.75(kan) – 0.44(kan2) + 0.31(pH2) – 0.22(salt*kan).
When examining the regression model as a whole, I identified some non-intuitive
results that illustrate the benefit of this quantitative approach for studying combinations
of additives. Specifically, I anticipated that the condition for minimum amount of
heterotroph growth would correspond to the maximum level of all three additives. While
this holds true for levels of kan (200 µg/mL) and salt (0.6 M) predicted by the model
(Table 5.2, ‘Min’), it is not the case for pH (8.73, instead of the maximum 9.5), since the
pH2 term has a positive coefficient in the regression. I tested at n=3 with Undefined
Consortia that growth in 0.6 M NaCl, 200 ug/mL kan and pH 9.5 did result in higher OD
than that for the ‘Min’ condition, as the model predicted (data not shown). This is an
especially surprising result considering that the pH of the source environments for
isolates and Undefined Consortia is pretty close to pH 8.73: bench-top PBRs average
approximately pH 8.5-9.5 under non-carbon-limited operating conditions, and the pH of
Tempe Canal Water was measured as 8.2 +/- 0.5 at ~25 °C (n=2 daytime measurements
in August and April). In general, Consortia growth should be more robust under
conditions similar to those from which they were isolated; my results contradict this.
Furthermore, as noted previously, NaCl anti-porter activities (which provide
tolerance to both alkalinity and sodium; see Table 5.3) are pH-sensitive; NhaA in E. coli
has a maximum anti-port activity at pH 8.5 (252) and declined at higher pH levels. This
means that the combination of 0.6 M NaCl and pH 9.5 should be even more effective at

93
suppressing heterotroph growth compared to pH 8.73, as the Na+ : H+ antiporters required
for such growth would be deactivated, but this is not the case, as correctly predicted by
the model.
One possible explanation for the observation that more alkalinity (pH 9.5 vs. pH
8.73) results in unexpectedly higher heterotroph growth could be due to the fact that
batch growth in LB liquid medium results in very dense cultures (~10^9 cells/mL), which
tends to cause anaerobic fermentation due to oxygen limitation, driving acidification of
the growth medium that greatly exceeds the buffering capacity (253). This acidification
then arrests growth, which would mean that starting at a higher pH of 9.5 would enable
more growth before becoming limited by acidification of the medium. This loss of
buffering capacity in dense cultures may also explain why there is no statistically
significant interaction term between salt and pH in the regression (i.e. no salt*pH term in
Eq. 5.1), despite overlapping adaption mechanisms for these two additives.
Another interesting attribute of the model is the synergistic interaction between
NaCl and kanamycin, even though PICRUSt data show that none of the mechanisms for
trait markers in abundant OTUs are present against both salt and kanamycin (Table 5.3,
below). Instead, this synergy may be due to the cell’s requirement to import H+ for both
ATP synthesis and Na+ export. Markers found in abundant treatment OTUs, namely
kanamycin phosphatase (K19300), use ATP as a co-factor; various Na+:H+ anti-porters
also confer tolerance by importing H+. The biological consequence would then be that
kanamycin is more effective in the presence of NaCl because the Na+ export competes for
importable H+ resources with ATP synthase needed for kanamycin deactivation. As a

94
result, NaCl and kan combined have a synergistic effect (and interacting regression term)
in suppressing heterotroph growth.
5.3.4 Surface response model identifies opportunities for cultivation system engineers to
make strategic decisions for customizing operation parameters
Although this model is for growth in LB media rather than Synechocystis cultures, the
interaction between salt and kanamycin illustrates the general utility of statistical
modeling for optimizing cultivation conditions. For example, to achieve a predicted
OD600 of 0 absorbance units (at 24 hours’ growth), engineers could either use 0.6 M NaCl
with 31.5 µg/mL kan, or 0.13 M NaCl and 200 µg/mL kan. Kanamycin is much more
expensive to purchase than NaCl, so the first option could reduce cost without sacrificing
total contaminant mitigation under the conditions tested. Alternatively, if cultivation
system materials are not chemically compatible with high salt concentrations, the second
option would be preferred as kanamycin is more chemically benign. Green contour lines
in Figure 5.3 (below) help to identify additional opportunities for strategic decision-
making across a given heterotroph growth outcome.
Unlike with growth in LB broth, factorial analysis of heterotroph growth data in
Synechocystis supernatants did not result in a statistically significant regression (data not
shown). However, growth differences among certain growth conditions (Flask 1 and
Flask 8) were significantly different (not shown). I therefore proceeded with studies of
these two flask conditions to evaluate performance of additives with regard to net biofuel
yield and metagenomic analysis of Consortia.

95
5.3.5 Additives protect laurate in deliberately contaminated Synechocystis supernatants
In Figure 5.4, below, I observed that in the absence of additives, heterotroph
growth and laurate decay occurred within 24 hrs in Synechocystis supernatants. In
presence of additives, heterotrophs did not increase above starting concentration until
Day 3, when laurate levels also began to drop. Control flasks with no heterotrophs (or
additives) retained initial laurate concentration for 6 days (not shown), demonstrating that
the protective effect of additives was due to the inhibition of heterotroph growth.
Figure 5.3. Surface response plot of interaction between NaCl and Kanamycin.
Heterotroph growth response Y on the z-axis is in absorbance units at 600 nm, OD600.
kan = coded levels of Kanamycin added; salt = coded levels of added NaCl. Data points (black) are
response surface plus residuals. Green contour lines of orthogonal projection are cross sections of the
response surface through points of constant OD600 value (values indicated with green numbers) across
varying combinations of NaCl and kanamycin levels. The pH for this plot was set to coded level = 0,
corresponding to uncoded level of pH = 8.5
Y

96
5.4A
5.4B
Figure 5.4. Laurate time-course assay using Defined Consortium 1 in Synechocystis supernatants.
Treatment condition in 5.4A corresponds to levels of additives predicted to correspond to Minimum
heterotroph growth in LB media according to regression model (Eq. 5.1, Table 5.2). Cfu/mL = colony
forming units per mL of culture as measured on LB plain agar plates; shown in blue dotted lines on the
right vertical axes. Laurate mg/L = laurate concentration as measured by gas chromatography, shown in
red dashed lines on the left vertical axes.

97
5.3.6 Amount of Consortia growth is the same in WT and mutant Synechocystis
supernatants
In Figure 5.5, below, I compared the relative amount of contaminant growth in
supernatants of mutant Synechocystis strains with that of WT strains by comparing ratios
of the log10 of cfus/mL for each condition. If cell surface structures of WT strains such as
pili, EPS, or S-layer contributed to growth of Consortia, such as by contributing to SMPs
(136), then I would predict that these normalized ratios would be less than the 100%
negative control ratio between supernatants of WT cultures. My preliminary data (n=2
biological replicates, Defined Consortium 1) indicate that these mutant strains phenocopy
WT in terms of total contaminant growth, suggesting that these surface structures do not
substantially contribute to total supernatant SMP.
Figure 5.5. Amount of Consortia growth is the same in WT and mutant Synechocystis supernatants.
Supernatants of Synechocystis strains (Table 3.2) lacking pili (‘PilC’, slr0162-0163, SD519), EPS
(slr0977, SD506) and S-layer (‘Slyr’, sll1951, SD523) were prepared as for WT (SD525) and used to
propagate Defined Consortium 1 (two biological replicates). These mutants lack the cell surface
structures indicated, which may contribute to total SMPs in the supernatants that comprise the
contaminant food supply. Log10 ratios of contaminant growth in mutant vs WT supernatants were

98
5.3.7 Study of community structure and function for ecological insight into regression
model
I wanted to better understand my result in Figure 5.2; specifically, how it was
possible to quantitatively predict the amount of contaminant growth in LB liquid media
across different bacterial species. I formulated two possible hypotheses to explain this
result. Hypothesis 1, the ‘superbug’ hypothesis, predicts that the reason I measure the
same OD600 for a given condition across multiple Consortia is because of the presence of
ubiquitous isolate(s) with a competitive growth advantage under all the conditions tested.
As a result, I would measure the same OD600 across different Consortia because I was
repeatedly measuring the growth of the same ‘super-bug(s)’ for all Consortia and
conditions.
Hypothesis 2, which I termed the ‘ubiquitous function’ hypothesis, is based on the
premise that bacteria have encountered salt stress, pH stress and antibiotics across all
different environmental niches throughout the course of evolution, such that genes
conferring salt tolerance, for example, are widely conserved across diverse phyla, and are
somewhat modular, able to function relatively independently of the genomic context of a
particular species. This hypothesis is an application of the Unified Neutral Theory of
Hubbell, which states that traits not selected for in a given environment are ecologically
equivalent, or neutral (254, 255).
Hypothesis 1 predictions can be tested by analyzing the community structure, and
Hypothesis 2 can be tested by examining community function. Accordingly, I used 16S
Illumina sequencing of the 16S rRNA genes and also PICRUSt metagenomic prediction
to analyze community structure and function. For these analyses, I used Consortium

99
samples generated during the laurate time course assay at Day 0 and Day 6 (start and end
points).
5.3.8 16S Illumina sequence data show that contaminant identities are not predicted by
growth condition
In Figure 5.6, below, I show the relative abundances of OTUs for each growth
condition. Hypothesis 1 predicts the presence of a single ‘superbug’ OTU as
predominantly abundant across diverse Consortia. I can see many unique OTUs in the
treatment condition replicates TR1 and TR2, which are very diverse and different
between the two different Consortia, and the same is true for negative control replicates
NC1 and NC2 across Consortia. I therefore reject the ‘super-bug’ hypothesis.

100
5.6A
5.6B
Figure 5.6. Community structure of Consortia from laurate time-course assay.
16S rRNA gene sequencing of samples from Day 0 and Day 6 time points of laurate time course assay
from Defined Consortium 1 (Figure 5.6A, above) and Undefined Consortium 1 (Figure 5.6B, below)
were analyzed using QIIME. Each different colored segment shows the abundance contributed by a
unique 16S rRNA gene sequence, but is identified at the Phylum level for familiarity. The relative
abundance is listed as percentage of total abundance per sample, normalized to 100%. For 5.6A and
5.6B, NC1 and NC2 = negative control replicates sampled at end of time course (Day 6); TR1 and TR2
are corresponding treatment replicates.
5.6A: DC1a and DC1b are replicates of Defined Consortium 1 inoculum used at time point 0 days.
5.6B: TCW = Tempe Canal Water sample before LB outgrowth. UC1 = Undefined Consortium 1,
comprised of TCW after LB outgrowth, used as inoculum at time point 0 days.

101
5.3.9 PICRUSt metagenomic predictions indicate that growth in presence of additives
predicts type and quantity of trait markers
In order to test Hypothesis 2, I performed three steps. First, I used literature
search and PICRUSt software to curate a list of trait markers that are relevant to rapid,
physiological adaptations to the presence of these additives on timescales relevant to the
duration of my experiments. I identified 15 markers, shown in Table 5.3, below. Second,
I used the STRING database to describe the phylogenic distribution of these markers, to
test the prediction of Hypothesis 2 that they would be widely distributed across the
bacterial domain. I show in Table 5.3, below, that this prediction is consistent with
STRING phylogeny data, with an average %S score of 76.7%. In step 3, I used PICRUSt
to predict occurrence of these markers in abundant contaminant OTUs identified from my
Illumina sequence data.
Metagenomic prediction shows growth in additives is predicted by a ‘minimum core’ of 7
trait markers across unrelated phylotypes.
I used PICRUSt to assess the presence of trait markers for OTUs that were most
abundant (>10% relative OTU abundance per sample) in both treatment and negative
controls. I assessed both the total number of markers between conditions, and also the
types of markers present for each growth condition. As seen in Figure 5.6, I found that
abundant OTUs in all samples for treatment conditions had at least 7 markers, whereas
those in negative controls had no more than 6. When the number of markers was
weighted by the total relative abundance of OTUs for all samples within a growth
condition, I found that 60% of all abundant treatment OTUs had 7 markers, whereas
OTUs in negative controls were about 1/3 each of 4, 5, or 6 markers (Figure B.3).

102
Table 5.3: KEGG ortholog trait markers and their phylogenic distribution.
Additive Adaptive
mechanisms Organism Ortholog
KEGG
Number
% clades
(%S Score)
NaCl Compatible solute
biosynthesis Synechocystis (2) stpA K05978 69%
NaCl Compatible solute
transport Synechocystis (2) ggtA K10112 100%
NaCl,
pOH Na+:H+ anti-porter Synechocystis (3) nhaA
K03313
53.3%
NaCl,
pOH
monovalent cation:H+
antiporter E. coli (4)
mrpA
(ybaL, mnhA)
K03316
(K03455,
K05565)
100%
NaCl,
pOH
Ion homeostasis
K+:H+ anti-port Synechocystis (2) ktr, kdpA K01546 62.1%
pOH H+ transporting
ATPase E. faecalis (5) atpH (atpB)
K02113
(K02108) 75.9%
Kan aminoglycoside 3'-
phosphotransferases S. aureus (6)
Aph3-II;
(aph3’III)
K19299,
(K19300) N/A
Kan,
pOH
multidrug / efflux
transport protein E. coli (3) mdfA, cmr K08160 41.4%
Kan Aminoglycoside
/multi-drug efflux E. coli (7) acrD K18324 93.1%
Kan Aminoglycoside /
multi-drug efflux
P. aeruginosa PAO1
(8-10) mexY K18095 93.1%
Kan
Aminoglycoside /
multi-drug efflux
A. baumannii (7)
adeA
K18145
79.3%
Additives are color-coded, with different molecular mechanisms for a given additive indicated by
different shades within each color. Markers conferring tolerance to NaCl are in shades of orange;
markers related to import of H+ (as hydronium) are colored in shades of brown; and markers related to
Kanamycin (Kan) resistance are shown in shades of blue. %S score refers to prevalence of ortholog in
bacterial domain, calculated using STRING database.

103
5.7A
5.7B
Figure 5.7. PICRUSt data of community function of Consortia from laurate time-course assay.
PICRUSt data correspond to the abundant unique 16S rRNA sequences and identities in Figure 5.6.
Abundances are given as replicate averages of the samples indicated. Figure 5.7A corresponds to identities
from negative control conditions (above), and Figure 5.7B corresponds to identities from treatment
conditions (below).KEGG ortholog markers are described in Table 5.3, with the same color-coding.

104
While it’s not surprising that selective growth conditions in the treatment samples
would enrich for strains carrying kanamycin resistance genes, for example, it is
noteworthy that such markers would be largely absent from abundant OTUs in negative
control strains, because these markers are widely distributed across diverse taxa. This is
not fully explained by relative growth advantage of strains with fewer markers under
permissive growth conditions, as strains abundant in negative control samples still carry
an average of 5 markers. Thus while trait markers are important for determining
community structure under different growth conditions, other factors are also important
in predicting Consortia ecology.
As shown in Figure 5.7, marker type was also predicted by growth condition. In
treatment conditions, all abundant OTUs had a minimum core of 1 kan-resistance marker
(blue), 3 H+ importers (brown), and 3 Na+ ion adaption markers (orange). No abundant
OTUs in the negative control samples had this minimum core of markers; four of six
abundant OTUs in negative controls were missing a kan-resistance marker, and most had
fewer H+ import and Na+ export markers. As a positive control for my analysis pipeline,
all strains showed the presence of F-type ATPase genes (K02113 and K02108; atpBH),
which code for highly conserved bi-directional protein complex subunits of cellular
respiration that can either import H+ or alternatively synthesize ATP using a proton
gradient.
Because the regression coefficients of the quantitative model are based on coded
units (see Table 5.1), the magnitude between different terms and factors can be directly
compared to facilitate interpretation of model predictions at different levels of additives
within the sample space tested. Accordingly, the model predicts that the single most

105
significant factor in mitigating heterotroph growth is the added NaCl, because it has the
largest negative coefficient. This is consistent with the PICRUSt data (Fig. 5.6), which
shows that the difference in number of KEGG markers between treatment and control
abundant OTUs is largely due to differences in markers related to Na+ ion (shades of
orange and light brown).
These results are consistent with the reported ubiquitous and modular function of
these markers. Ion homeostasis and salt and nutrient stress responses that are relevant to
the time scales and mechanisms in this study include physiological changes in water-
borne pathogenic bacteria such as in E. coli and Vibrio cholera that must survive immune
response during host infection, but also persist in external environments such as
waterways during transmission between hosts (3). For example, the Na+:H+ anti-porter
NhaS3 from Synechocystis was able to restore salt tolerance in an E. coli mutant lacking
its native sodium anti-porter activity (256). In another study, bacterial biofilms colonizing
the surface of sea lettuce macroalgae (U. australis) (257) showed that only 15% of
bacterial species were conserved across sea lettuce biofilm samples, but nearly 70% of
samples had the same set of core functional genes. Importantly, bacteria with the same
core of functional genes may be taxonomically distant, forming a smaller ‘guild’ of
unrelated phyla that are competent for biofilm formation that occur within the larger
bacterial microbiome exposed to sea lettuce surfaces.
The Ubiquitous Function hypothesis does not preclude a role for microbial
interactions influencing Consortia ecology. Previous studies have shown that stochastic
elements (such as random immigration of species from a larger meta-community into a
smaller niche microcosm) and deterministic elements (such as heterogeneous niche

106
micro-environments), are not mutually exclusive (254, 255). For example, studies of
root-associated soil fungi (254) and termite gut bacteria (255) found that deterministic
elements (soil pH; termite foregut and hind-gut microenvironments, respectively) were
important predictors of microbial communities.
Especially in Synechocystis supernatants, it may be that the growth differences
shown in Figure 5.4 could either be due to differences in growth rate in oligotrophic
medium, and/or microbial interactions that may not occur in LB broth. An interaction
specifically involving cyanobacteria has also been identified: Prochlorococcus, which is
abundant in open oceans, relies on other ocean-dwelling microbes to detoxify hydrogen
peroxide generated by solar energy absorbed by organic compounds (258). Bacteroidetes,
which was detected in TCW (Figure 5.1) and which are reported to be most abundant in
fresh-water lakes after cyanobacterial blooms because of their ability to biodegrade
complex polysaccharides and other biopolymers, may enable other heterotrophs to thrive
(1).
However, although many synthetic ecology studies focus on microbial
interactions, a systematic test of cultures of aqueous samples were shown to be
dominated by competition for nutrients rather than cooperative interactions such as
syntrophies in oligotrophic medium (beech leaf media) (259). Additionally, if microbial
interactions such as syntrophies are important predictors of contaminant growth in
Synechocystis cultures, then I would not see a single OTU dominating the total
heterotroph abundance in a given sample, which is what I observed in the Treatment
Condition of Defined Consortium 1 (Figure 5.6A), where 95% of total abundance is
occupied by a single genus of Achromobacter.

107
5.4 Conclusion
These results show that levels of additives were largely able to predict the amount
of Consortia growth in LB broth, independent of which species were present (Figure 5.2).
Augmenting experimental design to control for the effect of growth rate and pH levels,
such as with automated logging and/or utilizing chemostatic/turbidostatic experimental
conditions, would enhance model accuracy, especially in relatively oligotrophic growth
medium of Synechocystis cultures. I also demonstrated that NaCl, kanamycin, and
alkalinity protect laurate for 3-4 days in deliberately contaminated Synechocystis
supernatants by suppressing the growth of contaminants. Synechocystis mutants with
altered cell surface structures did not impact the amount of Consortia growth.
Engineering feedstock strains to produce fewer SMPs, such as by deletion of wzc, which
has been shown to result in 50% reduction of released exopolysaccharides compared to
wild-type Synechocystis (121), may enable an additional genetic means of contamination
management.
Preliminary metagenomic and community abundance data support the conclusion
that traits rather than species are the key determination of community structure for
selective growth condition in the presence of NaCl, kanamycin and alkalinity, which
supports my hypothesis that function and not structure is what predicts the bacterial PBR
contaminome under these conditions. This model should be tested using direct gene
expression measurements with additional diverse Consortia.
I conclude that these data are consistent with a ‘minimum core’ of markers
occurring in a guild of unrelated contaminant species predicts growth in the presence of
additives, which is based on the premise that unrelated species with similar traits are

108
ecologically equivalent during competitive growth (257). I did not see much overlap
between abundant species identities in treatment flasks between Consortia drawn from a
single ‘meta-community’ of heterotrophs (both Defined and Undefined Consortia
included species from Tempe Canal Water). I did find that growth condition was a good
predictor of a core set of functional genes, namely of 7 KEGG markers present in all
abundant treatment OTUs (Figure 5.7). Bacterial phyla vary widely in their genetics and
physiology; it is challenging to meaningfully capture this diversity using only a small,
defined consortium. However, my study indicates that the traits necessary to grow as
contaminants in the presence of one or more of these commonly used additives are
widely represented, such that much of the increase in phylogenic diversity between these
Defined and Undefined Consortia is functionally redundant to the response variables of
interest in this study (contaminant growth and laurate consumption in the presence of
different combinations of these additives).
5.4.1 Results suggest knowledge of genetic regulation and molecular mechanisms of
additive tolerance to inform strategic combinations of additives.
Figure 5.4 showed that additives protect laurate consumption by inhibiting growth
of heterotrophic bacteria. Na+ toxicity is due to competitive binding with K+-dependent
enzymes (2). This is tied to mechanisms of resistance: ion homeostasis regulation, such
as increasing cytoplasmic concentration of K+ relative to Na+, will improve resistance to
added NaCl present in the growth medium. As described previously, this is coupled with
H+ transport, such that several trait markers provide ‘two for the price of one’ benefit to
the contaminants that harbor them: NhaA confers tolerance to NaCl and alkalinity, and
MdfA confers tolerance to NaCl and kanamycin (Table 5.3). Knowledge of such

109
overlapping adaptive mechanisms would inform more strategic selection of combinations
of additives that each require a separate adaption mechanism. I predict that selection of
additives requiring mutually exclusive adaptations would be the most effective in
suppressing contaminant growth, especially in oligotrophic media, where energy or
nutrient sources needed for synthesizing adaptive molecules may be in shorter supply.
5.4.2 Ecological models suggest ‘probiotic’ approach for long-term management of PBR
ecology.
In the field of ecology, a long-standing objective has been to develop model that
is able to explain, much less predict, both the identities and abundances of species in a
given niche. Theories including r/K strategies (260, 261), the Unified Neutral Theory
(262), and niche theory (255, 263) have undertaken quantitative predictions to explain
biodiversity across taxonomic domains, geographies, and scales, with preliminary data
able to test and support some but not all of the predictions of these various models (264),
due in part to difficulty of modeling these parameters experimentally.
One elaboration of neutral theory, termed the lottery hypothesis, predicts that the
structure of a community for a given niche is largely determined by whichever species
within an ecologically equivalent group has immigrated there first (265). This hypothesis
was supported by a study of two closely related coral reef goby fish (G. histrio and G.
erythrospilus): once one goby species inhabited a coral niche, it could not be displaced by
the other goby species (266).
Although the experimental design used was not intended to test such ecological
models, my findings were consistent with the theory of ecological equivalence. The
Lottery Hypothesis is also supported by the theory of ecological equivalence. It is

110
possible, therefore, that the PBR contaminome also conforms to the predictions of the
Lottery Hypothesis. If so, it would have implications for longer-term community
structure, namely that, like goby fish, contaminants that become abundant during initial
PBR start-up will likely be most abundant for longer experiments, such as repeated
‘runs’ or cultures within a single PBR. This raises the exciting possibility of proactively
“immunizing” a cultivation system with a beneficial or benign Consortia to establish a
healthy and productive niche microcosm, thereby reducing the ability of additional
detrimental heterotrophs from the environment to colonize feedstock cultures.
These results have shown that quantitative predictions yielding non-intuitive
insights can be generated using an artificial Consortia to simulate the bacterial PBR
contaminome under controlled lab conditions. To my knowledge, this is the first study
showing the effectiveness of artificial Consortia to study PBR contamination, and the
first study quantifying contribution of multiple interacting factors in suppressing PBR
contaminants. The value of quantitative prediction of contamination is highly valuable for
both ecological insight, and also for economic modeling of cost-to-benefit for synergistic
application of more costly antibiotic used with less expensive salt and alkalinity, and how
these variables influence biofuel yield.
I conclude that this study has been successful proof-of-concept showing the utility
of combining DNA sequence analysis, artificial consortia and statistical modeling in
generating quantitative and ecological insights into studying the PBR contaminome under
controlled lab conditions, which meets my goal for this project. This platform is modular
and versatile; it is readily compatible with experiments at larger scales and longer
durations, and applied to other contaminant Consortia such as cyanophage or eukaryotes.

111
Finally, I note that the ease of monitoring laurate production as a response variable, and
the natural tolerance to commonly-used additives for suppressing contaminants at
industrial scales, makes a laurate secreting strain like this Synechocystis mutant an ideal
candidate as a model organism for the study of the synthetic ecology of PBR
contamination under controlled conditions.

112
CHAPTER 6
SUMMARY, PERSPECTIVE, AND OUTLOOK
6.1 Research trajectory and decision checkpoints
This study was initiated on the strength of addressing two separate but related
knowledge gaps in the field of microbiology: one, an apparent dearth of studies in the
literature characterizing axenic phototroph biofilms, and two, the relevance of these
biofilms to the larger ongoing research initiative in producing biofuels from phototrophs.
Regarding the state of the literature, I originally (and naively) thought that the under-
developed state of axenic phototroph biofilm research relative to its scientific importance
was likely due to the “silo-ing” of medical microbiology and environmental microbiology
/ engineering into two different disciplines, each with a distinct set of methodologies. As
phototrophs belonged in the latter category, I reasoned, axenic biofilm studies, a
technique largely restricted to the former category, were not historically a priority. Thus,
I presumed (incorrectly) that applying familiar previously established methods from my
studies of heterotrophic bacteria to a model phototroph, Synechocystis, would enable a
substantive contribution to advancing the field of phototroph microbiology. This
presumption was initially bolstered by preliminary data collected within the first few
months of research showing axenic biofilm formation using the crystal violet assay.
However, I had great difficulty reproducing those preliminary results reliably in
subsequent years. Important clues (and key motivation not to abandon this project) came
from very thick and repeatedly occurring green biofilms growing in the roof-top
photobioreactor that replaced themselves with each reactor run and caused great
difficulty among PBR engineers for their continued removal and prevention (Figure 3.1).

113
Discovery that using softened water in the preparation of the growth medium abated
biofilm formation in the roof-top PBR provided an important avenue of investigation into
nutrient signals being required for Synechocystis to form biofilms. I recapitulated this
finding at lab scale when a humidification flask was inadvertently omitted from a crystal
violet assay experiment, causing starter culture evaporation that increased nutrient
strength, which was then decreased when cultures were resuspended in 1.0x BG11.
Thus, with additional screening of additional growth parameters such as illumination
levels, temperature, shaking, evaporation rate, and others for optimization of this
modified crystal violet assay, I was able to demonstrate with statistical significance that
exponentially growing Synechocystis forms axenic biofilms in response to changes in
nutrient status.
At this point there was some suggestive evidence that a new paradigm in biofilm
research had potentially been uncovered, since studies previously characterizing
heterotrophs describe their ability to form biofilms in nutrient replete media using this
assay, whereas Synechocystis cannot. If this Synechocystis phenotype also holds true for
other phototrophs, it could certainly be a major contributing factor to why so few studies
of axenic phototroph biofilms have been published: previous researchers, including
myself, had only assessed phototroph biofilms in nutrient replete media, leading to
negative (and unpublished) results. However, the crystal violet assay grows cultures in
batch mode, during which time, increase of heterotroph (and phototroph) culture densities
certainly drive nutrient limitation, along with many other stress signals typical of
stationary phase. One could argue that the difference may be in terms of degree: whereas
growing in batch mode would create condition of nutrient limitation gradually over the

114
course of the growth curve, rapid dilution of growth medium such as used in the adapted
crystal violet assay for Synechocystis may engender some sort of stress response driving
biofilm formation. Alternatively, perhaps the differences in metabolism between
phototrophs and heterotrophs resulted in different thresholds of sensitivity to nutrient
limitation during batch growth. Clearly, more information was needed.
Taking the advantage of Synechocystis cultivation in a defined growth medium
BG11, I then proceeded to screen individual nutrients (phosphate, divalent cation metals,
nitrogen, carbon) at various dilutions, which did seem to increase biofilm formation
compared to nutrient-replete condition, but not reproducibly enough to demonstrate
statistical significance (data not shown). Furthermore, confocal microscopy revealed that
Synechocystis biofilms were rarely more than a monolayer (similar to a few other model
organisms for heterotroph biofilm studies); the scarcity of cellular material generated by
the modified crystal violet assay limited the ability to biochemically characterize these
biofilms. Therefore, I developed an aggregation assay using nutrient limitation, and was
able to determine that aggregation, which, like biofilm formation, requires cell-cell
binding, could be induced by change in nutrient status, and was dependent on bioenergy.
However, I was still unable to identify the signals driving aggregation, whether nutrient
limitation, or salt or osmotic stress that accompanies changes in nutrient strength, or other
signal(s).
More information was needed to uncover the environmental conditions and
genetic regulation of these phenotypes; for example, how they related to conserved stress
responses that occur during nutrient limitation, such as stringent response. Additionally,
although my library of mutants with altered cell surface structures demonstrated that the

115
requirement for pili and S-layer for biofilm formation was conserved across heterotrophic
and phototrophic species, I was unable to detect the presence of a hypothesized aggregant
that enabled cell-cell binding through preliminary measurements of outer membrane
proteins and treatment with cellulase. I elected to perform an RNA seq transcriptome
experiment in order to be able to correlate internal regulatory changes with the incidence
of aggregation, to better understand how Synechocystis was interpreting and responding
to its environment.
The results of this RNA seq experiment provided strong preliminary evidence
that aggregation was occurring in the context of stringent response (SR), based primarily
on comparison of stringent response RNA seq data from a related cyanobacterium,
Synechococcus elongatus. Interestingly, S. elongatus undergoes SR upon shift to
darkness (without aggregation), whereas Synechocystis aggregation is dependent on light.
While these RNA seq data would need to be confirmed with additional lines of evidence
such as measurements of (p)ppGpp levels and assessment of deletion mutant SR and
aggregation phenotypes, the results are consistent with SR being linked to nutrient
limitation and aggregation in heterotrophic bacteria, and suggests than in bacteria with a
phototrophic metabolism such as S. elongatus and Synechocystis, light limitation is
analogous to nutrient limitation in heterotrophs. This is logical because in heterotrophs,
certain nutrients such as carbohydrates are also the cell’s energy supply; thus SR
response across all metabolic profiles could be under the umbrella of energy limitation.
Indeed, one of the hallmarks of SR is down-regulation of translation, because synthesis of
ribosomes is a very energy-intensive process, comprising 30-50% of cellular energy.

116
In addition to providing an important clue linking aggregation, SR and
nutrient/light limitation, this study was also very useful for suggesting that in
cyanobacteria, while aggregation occurs with SR (in the light), SR does not necessarily
engender aggregation (in the dark), demonstrating that aggregation is regulated separately
from SR. While I did not identify the specific environmental signal responsible for either
aggregation or SR due to change in nutrient status, results suggest that I did make
progress by determining that there are two distinctly regulated (though obviously related)
signals and pathways between aggregation and SR, which helped to guide proposed
experiments to elucidate these pathways in the Conclusion of Chapter 4.
The final area of investigation returned to the starting point of Chapter 3, namely
the Synechocystis cell surface and how it related to the productivity of the roof-top PBR.
I investigated whether my library of mutants with missing cell surface structures, in
addition to having benefits related to a non-biofouling phenotype, might also lend a
genetic means of enhancing laurate yield by contributing less fixed carbon and nitrogen
for consumption by contaminants in the supernatant, compared to parent strains that shed
these cell surface structures into the growth medium. I additionally screened for the
effectiveness of salt, antibiotic and alkalinity in suppressing the growth of laurate-
consuming heterotrophic bacteria. While these mutants did not provide any detected
benefit regarding growth of contaminants, this study did demonstrate the effectiveness of
combining statistical modeling and artificial contaminant consortia to model the PBR
contaminome in the lab, and generate quantitative and qualitative predictions. These
findings suggested improving strategies for mitigating contamination in the roof-top PBR
117
by choosing combinations of additives or conditions informed by molecular mechanisms
of tolerance of tolerance and/or growth by contaminants (discussed in more detail below).
6.2 Interpretation of findings in the context of current paradigms of heterotrophic
bacterial biofilm formation
At the conclusion of this research topic, I revisited my original speculation about
the dearth of studies of axenic phototrophic biofilms. Was this truly a “low-hanging fruit”
on the tree of microbiology research, that is easy to study but had simply been neglected
previously, or is the paucity of publications an indication that phototrophs engender a
new paradigm in bacterial biofilm formation, and thus a more challenging topic to
“harvest”? One of the more interesting findings in my studies of axenic Synechocystis
aggregation was that the mutant wza, which makes only 25% of the cell-bound EPS of
WT cells under nutrient replete conditions (121), has a super-binding phenotype when
shifted to reduced nutrient strength. Furthermore, unlike WT, wza mutants settle out of
solution in standing nutrient-replete cultures.
In the Chapter 3 Conclusion, I described a model of cell-cell binding in
Synechocystis that is regulated by two different mechanisms depending on whether
nutrient status was replete or not, and that the role of Wza-dependent EPS in
Synechocystis under nutrient-replete conditions seemed to be related to keeping the cells
in suspension (cell-cell repulsion). This represented a new (and opposite) role for Wza-
dependent EPS, which previously had only been described as contributing to increased
cell binding in heterotrophs. Additionally, this new feature would explain why, unlike the
heterotrophs I and others had previously studied with the crystal violet assay,
Synechocystis required a shift to nutrient deplete conditions, which might have led many

118
researchers to conclude from preliminary data in nutrient replete conditions that
phototrophs cannot form biofilms by themselves. The fact that diverse species of
cyanobacteria have EPS that share the common feature of being negatively charged due
to presence of uronic acids and sulfate groups uncommon in other bacteria (110, 111,
115) suggest that the role of EPS in keeping cyanobacteria dispersed under nutrient
replete conditions may be widely conserved, and indeed represent a new paradigm that
distinguishes phototrophs from heterotrophs in how they use EPS, and thus the
requirement of nutrient limitation to shift to a cell-binding phenotype. Furthermore, it
may explain why Synechocystis only forms a monolayer or so during biofilm formation,
similar to C. crescentus, which cannot bind to itself due to special surface properties, and
only forms a monolayer (though a very strong one), on glass coverslips. If this reasoning
is correct, it would suggest that the different role of S-layer in biofilm formation
(essential) vs aggregation (not essential but does contribute) may be due to different
mechanisms of adhesion between these two phenotypes. Using the modified crystal violet
assay to screen additional phototrophic bacteria is necessary to address these questions.
6.3 Follow-up studies to extend the most significant findings of this research
How do I put these phenotypic differences in the context of the divergent
lifestyles and metabolisms of these bacteria, and what do these differences tell us about
the evolution of biofilm formation and its role in bacterial pathogenesis? An exciting
recent discovery that could be used to study these questions was the identification of a
non-photosynthetic group of bacteria, termed Melainabacteria, assigned to the
Cyanobacteria phylum based on genome sequence (41). This discovery is in line with all
other phyla known to contain phototrophs also containing non-phototrophic members;

119
related studies in this area recommend cyanobacteria be assigned a new class termed
Oxyphotobacteria. Although this bacterium cannot yet be cultured axenically in the lab, it
could provide an important missing link in comparative biology studies of the function
and evolution of biofilm formation between cyanobacteria and heterotrophs. For
example, if a feature was found that was conserved between Melainabacteria and
Synechocystis biofilm formation but not found in the much more recently evolved E. coli,
it may enable identification of novel molecular targets for therapeutic treatment of
infections that would not be identified when comparing biofilm mechanisms between
closely related bacterial pathogens such as S. enterica and E. coli. Additionally,
Melainabacteria is a heterotrophic fermenter, and fermentation metabolism predates the
evolution of photosynthesis. This could provide the tools needed to study how the
evolution of metabolism and the evolution of biofilm formation interacted, a potentially
rich and under-studied area related to basic science and applied bioremediation.
Another area for future development relates to the crystal violet assay. Perhaps
because of its cell-cell repulsion phenotype, Synechocystis did not form very thick or
extensive biofilms using the adapted crystal violet assay, which is different from the
results of this assay with heterotrophs. Thus, it may be necessary to develop additional
formats for harvesting larger amounts of biofilm for biochemical and transcriptome
analysis, instead of relying on the related aggregation assay. The glass tube format of the
roof-top PBR worked very well for growing thick green biofilms, which could be due to
the much larger culture volume, and/or the semi-chemostatic mode of operation. A
bench-top-scale version of similar glass-tube format compatible with microscopy may be
beneficial for studying biofilm structure over time. The company Biosurface Technology

120
Corporation has previously made customized, autoclavable reactors for the study of
epilithic mixed species phototrophic biofilms, and would be a good resource for
developing a customized reactor for planktonic format axenic phototrophic biofilms
(267). This would be beneficial both for biofilm PBR applications, and developing the
basic biology of phototrophic biofilms. Because heterotrophic bacteria get their energy
from nutrients (inside the reactor), whereas phototrophs get their energy from light
(outside the reactor), the available designs for off-the-shelf biofilm reactors are not ideal
for phototrophs. Based on the information presented in this dissertation, some form of
customized biofilm reactor will likely be essential for the development of Synechocystis
or similar bacterium as a model organism for axenic phototrophic biofilm formation to
reach its full potential, in line with heterotrophic biofilm research. These methods should
be developed in parallel with study of biofilm formation by other phototrophs, such as
nitrogen-fixing cyanobacteria.
Finally, I return to the topic of synthetic ecology of the PBR contaminome. The
challenge of managing PBR ecology is perhaps the most daunting and significant
challenge in large-scale production of microbial biofuels, and likely requires a
multivariate approach combining anti-contamination strategies wih more “probiotic”
approaches of engineered polycultures for a total ecology management system (268).
Engineering the niche of the PBR for healthy and productive feedstock cultures means
developing multiple mutually compatible approaches fundamentally different than
industrial microbiology historically using sterilization and antibiotics to maintain pure
cultures, but provides opportunities to substitute environmentally sound approaches to
replace intensive use of antibiotics. These studies highlighted the importance of

121
developing contaminant-management strategies that are informed by understanding the
molecular mechanisms and genetic regulation of heterotroph physiology.
A promising idea attempted in my lab previously is the use of nutritional
immunity to selectively enrich Synechocystis growth at the expense of contaminants.
Nutritional immunity comes from the field of medical microbiology and describes the
strategy of the host to sequester essential nutrients (often metals) to limit the growth of
pathogens; pathogens have also been shown to use the same strategy to out-compete
other microbes in the host microbiome (reviewed in (269-271). The utility of this
approach in managing contamination of microbial biofuel cultures has been recently
reported in several strains (272), such as engineering E. coli to use melamine as a sole
nitrogen source, or yeast to use phosphite as a source of phosphorous, both of which are
metabolic capabilities not widely found in nature. This has the added advantage of
providing a method of biocontainment of engineered feedstocks, as sources of melamine
and phosphite are rare in the environment.
Future studies should be conducted to combine the techniques of nutritional
immunity, along with engineered probiotic consortia and strategic combinations of
additives. This project would require several stages, including development of a
nutritional immunity system for Synechocystis based on an essential nutrient that is not
released in appreciable quantities into the supernatants of growing cultures, or whose
uptake by contaminants can be repressed in some controlled way. Next, a group of
genetically tractable heterotrophs that are beneficial or at least benign when grown in co-
culture with Synechocystis would need to be identified. Such a probiotic consortia may
benefit culture health in a number of ways, including increased stability of the PBR

122
ecosystem against environmental perturbations, potentially including the ability to resist
colonization by additional heterotrophs, as well as providing Synechocystis with CO2
from heterotroph respiration. These probiotic strains could then be engineered to have
reduced SMPs, such as with a wzc mutation that was shown in Synechocystis to have
reduced production of RPS. Finally, these probiotic candidates would be engineered to
have a similar nutritional immunity and additive tolerance profile as Synechocystis, but
without competing with Synechocystis for other limiting nutrients.
With this example, I have returned to the opening theme of nature-inspired
design, and the overlap in human endeavors of microbiology between topics of medicine
and of sustainability, derived from the remarkable capacity of bacteria to encompass a
huge diversity of metabolisms while reusing the structural format of a single cell; and so
conclude this dissertation.

123
WORKS CITED
1. Newton RJ, Jones SE, Eiler A, McMahon KD, Bertilsson S. 2011. A guide to
the natural history of freshwater lake bacteria. Microbiol Mol Biol Rev 75:14-49.
2. Hagemann M. 2011. Molecular biology of cyanobacterial salt acclimation.
FEMS Microbiol Rev 35:87-123.
3. Padan E, Bibi E, Ito M, Krulwich TA. 2005. Alkaline pH homeostasis in
bacteria: new insights. Biochim Biophys Acta 1717:67-88.
4. Swartz TH, Ikewada S, Ishikawa O, Ito M, Krulwich TA. 2005. The Mrp
system: a giant among monovalent cation/proton antiporters? Extremophiles
9:345-354.
5. Nyanga-Koumou AP, Ouoba LI, Kobawila SC, Louembe D. 2012. Response
mechanisms of lactic acid bacteria to alkaline environments: a review. Crit Rev
Microbiol 38:185-190.
6. Woegerbauer M, Zeinzinger J, Springer B, Hufnagl P, Indra A, Korschineck
I, Hofrichter J, Kopacka I, Fuchs R, Steinwider J, Fuchs K, Nielsen KM,
Allerberger F. 2014. Prevalence of the aminoglycoside phosphotransferase genes
aph(3')-IIIa and aph(3')-IIa in Escherichia coli, Enterococcus faecalis,
Enterococcus faecium, Pseudomonas aeruginosa, Salmonella enterica subsp.
enterica and Staphylococcus aureus isolates in Austria. J Med Microbiol 63:210-
217.
7. Rosenberg EY, Ma D, Nikaido H. 2000. AcrD of Escherichia coli is an
aminoglycoside efflux pump. J Bacteriol 182:1754-1756.
8. Masuda N, Sakagawa E, Ohya S, Gotoh N, Tsujimoto H, Nishino T. 2000.
Contribution of the MexX-MexY-oprM efflux system to intrinsic resistance in
Pseudomonas aeruginosa. Antimicrob Agents Chemother 44:2242-2246.
9. Brock TD, Freeze H. 1969. Thermus aquaticus gen. n. and sp. n., a
Nonsporulating Extreme Thermophile. J Bacteriol 98:289-297.
10. Ishino S, Ishino Y. 2014. DNA polymerases as useful reagents for biotechnology
– the history of developmental research in the field. Front Microbiol 5:465.
11. Coker JA. 2016. Extremophiles and biotechnology: current uses and prospects.
F1000Research 5:F1000 Faculty Rev-1396.
12. Rittmann BE. 2008. Opportunities for renewable bioenergy using
microorganisms. Biotechnol Bioeng 100:203-212.

124
13. 2016, posting date. Energy Information Administration. U.S. Department of
Energy. [Online.]
14. Song Y, Peng R, Hensley DK, Bonnesen PV, Liang L, Wu Z, Meyer HM, Chi
M, Ma C, Sumpter BG, Rondinone AJ. 2016. High-Selectivity Electrochemical
Conversion of CO2 to Ethanol using a Copper Nanoparticle/N-Doped Graphene
Electrode. ChemistrySelect.
15. Brasier MD, Antcliffe J, Saunders M, Wacey D. 2015. Changing the picture of
Earth's earliest fossils (3.5-1.9 Ga) with new approaches and new discoveries.
Proc Natl Acad Sci U S A 112:4859-4864.
16. Rittmann BE. 2008. Opportunities for renewable bioenergy using
microorganisms. Biotechnol Bioeng 100:203-212.
17. Rippka R, Coursin T, Hess W, Lichtle C, Scanlan DJ, Palinska KA, Iteman I,
Partensky F, Houmard J, Herdman M. 2000. Prochlorococcus marinus
Chisholm et al. 1992 subsp. pastoris subsp. nov. strain PCC 9511, the first axenic
chlorophyll a2/b2-containing cyanobacterium (Oxyphotobacteria). Int J Syst Evol
Microbiol 50 Pt 5:1833-1847.
18. Pagani I, Liolios K, Jansson J, Chen IM, Smirnova T, Nosrat B, Markowitz
VM, Kyrpides NC. 2012. The Genomes OnLine Database (GOLD) v.4: status of
genomic and metagenomic projects and their associated metadata. Nucleic Acids
Res 40:D571-579.
19. Liu X, Fallon S, Sheng J, Curtiss R, 3rd. 2011. CO2-limitation-inducible Green
Recovery of fatty acids from cyanobacterial biomass. Proc Natl Acad Sci U S A
108:6905-6908.
20. Liu X, Sheng J, Curtiss R, 3rd. 2011. Fatty acid production in genetically
modified cyanobacteria. Proc Natl Acad Sci U S A 108:6899-6904.
21. 2011. Microbiology by numbers. Nat Rev Micro 9:628-628.
22. Davey ME, O'Toole GA. 2000. Microbial Biofilms: from Ecology to Molecular
Genetics. Microbiology and Molecular Biology Reviews 64:847-867.
23. Roeselers G. 2007. Microbial Ecology of Phototrophic Biofilms: Roeselers, G.,
Doctoral Thesis, Delft University of Technology. Guus Roeselers.
24. Charpy L, Palinska KA, Casareto B, Langlade MJ, Suzuki Y, Abed RM,
Golubic S. 2010. Dinitrogen-fixing cyanobacteria in microbial mats of two
shallow coral reef ecosystems. Microb Ecol 59:174-186.
25. Battin TJ, Besemer K, Bengtsson MM, Romani AM, Packmann AI. 2016.
The ecology and biogeochemistry of stream biofilms. Nat Rev Micro 14:251-263.

125
26. Lu H, Yang L, Zhang S, Wu Y. 2014. The behavior of organic phosphorus
under non-point source wastewater in the presence of phototrophic periphyton.
PLoS One 9:e85910.
27. Overmann J, van Gemerden H. 2000. Microbial interactions involving sulfur
bacteria: implications for the ecology and evolution of bacterial communities.
FEMS Microbiol Rev 24:591-599.
28. Swingley WD, Meyer-Dombard DR, Shock EL, Alsop EB, Falenski HD,
Havig JR, Raymond J. 2012. Coordinating environmental genomics and
geochemistry reveals metabolic transitions in a hot spring ecosystem. PLoS One
7:e38108.
29. Daniel H. Buckley JMM, Michael T. Madigan, Kelly S. Bender, David A.
Stahl, Thomas Brock. 2014. Brock Biology of Microorganisms, 14th edition ed.
Pearson.
30. Bryant DA, Frigaard N-U. 2006. Prokaryotic photosynthesis and phototrophy
illuminated. Trends Microbiol 14:488-496.
31. Bryant DA, Costas AM, Maresca JA, Chew AG, Klatt CG, Bateson MM,
Tallon LJ, Hostetler J, Nelson WC, Heidelberg JF, Ward DM. 2007.
Candidatus Chloracidobacterium thermophilum: an aerobic phototrophic
Acidobacterium. Science 317:523-526.
32. D'Amelio ED, Cohen Y, Des Marais DJ. 1987. Association of a new type of
gliding, filamentous, purple phototrophic bacterium inside bundles of
Microcoleus chthonoplastes in hypersaline cyanobacterial mats. Arch Microbiol
147:213-220.
33. Jungblut AD, Hawes I, Mackey TJ, Krusor M, Doran PT, Sumner DY, Eisen
JA, Hillman C, Goroncy AK. 2016. Microbial Mat Communities along an
Oxygen Gradient in a Perennially Ice-Covered Antarctic Lake. Appl Environ
Microbiol 82:620-630.
34. Bryantseva IA, Gorlenko VM, Kompantseva EI, Achenbach LA, Madigan
MT. 1999. Heliorestis daurensis, gen. nov. Sp. Nov., An alkaliphilic rod-to-
coiled-shaped phototrophic heliobacterium from a siberian soda lake. Arch
Microbiol 172:167-174.
35. Pages A, Grice K, Vacher M, Welsh DT, Teasdale PR, Bennett WW,
Greenwood P. 2014. Characterizing microbial communities and processes in a
modern stromatolite (Shark Bay) using lipid biomarkers and two-dimensional
distributions of porewater solutes. Environ Microbiol 16:2458-2474.
36. Bebout BM, Garcia-Pichel F. 1995. UV B-Induced Vertical Migrations of
Cyanobacteria in a Microbial Mat. Appl Environ Microbiol 61:4215-4222.

126
37. Suosaari EP, Reid RP, Playford PE, Foster JS, Stolz JF, Casaburi G, Hagan
PD, Chirayath V, Macintyre IG, Planavsky NJ, Eberli GP. 2016. New multi-
scale perspectives on the stromatolites of Shark Bay, Western Australia. Sci Rep
6:20557-20563.
38. Knoll AH. 2015. Paleobiological Perspectives on Early Microbial Evolution.
Cold Spring Harb Perspect Biol 7:a018093.
39. Dupraz C, Visscher PT. 2005. Microbial lithification in marine stromatolites and
hypersaline mats. Trends Microbiol 13:429-438.
40. Hamilton TL, Bryant DA, Macalady JL. 2016. The role of biology in planetary
evolution: cyanobacterial primary production in low-oxygen Proterozoic oceans.
Environ Microbiol 18:325-340.
41. Shih PM, Hemp J, Ward LM, Matzke NJ, Fischer WW. 2016. Crown group
Oxyphotobacteria postdate the rise of oxygen. Geobiology.
42. Albarracin VH, Gartner W, Farias ME. 2016. Forged Under the Sun: Life and
Art of Extremophiles from Andean Lakes. Photochem Photobiol 92:14-28.
43. Pringault O, Garcia-Pichel F. 2004. Hydrotaxis of cyanobacteria in desert
crusts. Microb Ecol 47:366-373.
44. Vitek P, Camara-Gallego B, Edwards HGM, Jehlicka J, Ascaso C,
Wierzchos J. 2013. Phototrophic Community in Gypsum Crust from the Atacama
Desert Studied by Raman Spectroscopy and Microscopic Imaging.
Geomicrobiology Journal 30:399-410.
45. Beraldi-Campesi H, Garcia-Pichel F. 2011. The biogenicity of modern
terrestrial roll-up structures and its significance for ancient life on land.
Geobiology 9:10-23.
46. Baqué M, de Vera J-P, Rettberg P, Billi D. 2013. The BOSS and BIOMEX
space experiments on the EXPOSE-R2 mission: Endurance of the desert
cyanobacterium Chroococcidiopsis under simulated space vacuum, Martian
atmosphere, UVC radiation and temperature extremes. Acta Astronautica 91:180-
186.
47. de Vera JP, Dulai S, Kereszturi A, Koncz L, Lorek A, Mohlmann D,
Marschall M, Pocs T. 2014. Results on the survival of cryptobiotic cyanobacteria
samples after exposure to Mars-like environmental conditions. International
Journal of Astrobiology 13:35-44.
48. Janchen J, Feyh N, Szewzyk U, de Vera JPP. 2016. Provision of water by halite
deliquescence for Nostoc commune biofilms under Mars relevant surface
conditions. International Journal of Astrobiology 15:107-118.

127
49. Syed MA, Henshaw PF. 2003. Effect of tube size on performance of a fixed-film
tubular bioreactor for conversion of hydrogen sulfide to elemental sulfur. Water
Res 37:1932-1938.
50. Tian X, Liao Q, Zhu X, Li J, Wang H. 2010. Characteristics of a biofilm
photobioreactor as applied to photo-hydrogen production. Bioresour Technol
101:977-983.
51. Wigglesworth-Cooksey B, Cooksey KE. 2005. Use of fluorophore-conjugated
lectins to study cell-cell interactions in model marine biofilms. Appl Environ
Microbiol 71:428-435.
52. Lardon L, Helias A, Sialve B, Steyer J, O B. 2009. Life-cycle Assessment of
biodiesel production from microalgae. Environmental Science and Technology
43:7.
53. Yang WF, Zhao WW, Liu YP, Hu HY, Pei XW, Wu Y, Zhou F. 2016. The
effect of wetting property on anti-fouling/foul-release performance under quasi-
static/hydrodynamic conditions. Progress in Organic Coatings 95:64-71.
54. Garcia M, Stupak M, Perez M, Blustein G. 2015. Transitioning to nontoxic
antifouling paints. Pigment & Resin Technology 44:116-121.
55. Fay F, Carteau D, Linossier I, Delbury M, Vallee-Rehel K. 2013. Joint-action
of antifouling substances in copper-free paints. Colloids and Surfaces B-
Biointerfaces 102:569-577.
56. Dafforn KA, Lewis JA, Johnston EL. 2011. Antifouling strategies: History and
regulation, ecological impacts and mitigation. Marine Pollution Bulletin 62:453-
465.
57. Roeselers G, Zippel B, Staal M, van Loosdrecht M, Muyzer G. 2006. On the
reproducibility of microcosm experiments - different community composition in
parallel phototrophic biofilm microcosms. FEMS Microbiol Ecol 58:169-178.
58. Gosse JL, Chinn MS, Grunden AM, Bernal OI, Jenkins JS, Yeager C,
Kosourov S, Seibert M, Flickinger MC. 2012. A versatile method for
preparation of hydrated microbial-latex biocatalytic coatings for gas absorption
and gas evolution. J Ind Microbiol Biotechnol 39:1269-1278.
59. Wang YZ, Liao Q, Zhu X, Tian X, Zhang C. 2010. Characteristics of hydrogen
production and substrate consumption of Rhodopseudomonas palustris CQK 01 in
an immobilized-cell photobioreactor. Bioresour Technol 101:4034-4041.
60. Behrendt L, Schrameyer V, Qvortrup K, Lundin L, Sorensen SJ, Larkum
AW, Kuhl M. 2012. Biofilm growth and near-infrared radiation-driven

128
photosynthesis of the chlorophyll d-containing cyanobacterium Acaryochloris
marina. Appl Environ Microbiol 78:3896-3904.
61. Dickson DJ, Ely RL. 2013. Silica sol-gel encapsulation of cyanobacteria: lessons
for academic and applied research. Appl Microbiol Biotechnol 97:1809-1819.
62. Masse A, Pringault O, De Wit R. 2002. Experimental study of interactions
between purple and green sulfur bacteria in sandy sediments exposed to
illumination deprived of near-infrared wavelengths. Appl Environ Microbiol
68:2972-2981.
63. Cairns LS, Hobley L, Stanley-Wall NR. 2014. Biofilm formation by Bacillus
subtilis: new insights into regulatory strategies and assembly mechanisms. Mol
Microbiol 93:587-598.
64. Hermans K, Roberfroid S, Thijs IM, Kint G, De Coster D, Marchal K,
Vanderleyden J, De Keersmaecker SC, Steenackers HP. 2016. FabR regulates
Salmonella biofilm formation via its direct target FabB. BMC Genomics 17:253-
267.
65. Wright DJ, Smith SC, Joardar V, Scherer S, Jervis J, Warren A, Helm RF,
Potts M. 2005. UV irradiation and desiccation modulate the three-dimensional
extracellular matrix of Nostoc commune (Cyanobacteria). J Biol Chem
280:40271-40281.
66. Sharif DI, Gallon J, Smith CJ, Dudley E. 2008. Quorum sensing in
Cyanobacteria: N-octanoyl-homoserine lactone release and response, by the
epilithic colonial cyanobacterium Gloeothece PCC6909. ISME J 2:1171-1182.
67. Mikkelsen H, Duck Z, Lilley KS, Welch M. 2007. Interrelationships between
colonies, biofilms, and planktonic cells of Pseudomonas aeruginosa. J Bacteriol
189:2411-2416.
68. Mohamed HE, van de Meene AM, Roberson RW, Vermaas WF. 2005.
Myxoxanthophyll is required for normal cell wall structure and thylakoid
organization in the cyanobacterium Synechocystis sp. strain PCC 6803. J
Bacteriol 187:6883-6892.
69. Fisher ML, Allen R, Luo Y, Curtiss R, 3rd. 2013. Export of extracellular
polysaccharides modulates adherence of the Cyanobacterium synechocystis. PLoS
One 8:e74514.
70. Jiang GH, Ohtaguchi K. 2006. Kinetics of biofilm formation of a
cyanobacterium on bioreactor surfaces. Journal of Chemical Engineering of Japan
39:453-460.

129
71. Schatz D, Nagar E, Sendersky E, Parnasa R, Zilberman S, Carmeli S, Mastai
Y, Shimoni E, Klein E, Yeger O, Reich Z, Schwarz R. 2013. Self-suppression
of biofilm formation in the cyanobacterium Synechococcus elongatus. Environ
Microbiol 15:1786-1794.
72. Kawano Y, Saotome T, Ochiai Y, Katayama M, Narikawa R, Ikeuchi M.
2011. Cellulose accumulation and a cellulose synthase gene are responsible for
cell aggregation in the cyanobacterium Thermosynechococcus vulcanus RKN.
Plant Cell Physiol 52:957-966.
73. Karatan E, Watnick P. 2009. Signals, regulatory networks, and materials that
build and break bacterial biofilms. Microbiol Mol Biol Rev 73:310-347.
74. Berne C, Ducret A, Hardy GG, Brun YV. 2015. Adhesins Involved in
Attachment to Abiotic Surfaces by Gram-Negative Bacteria. Microbiol Spectr 3.
75. Vogeleer P, Tremblay YD, Mafu AA, Jacques M, Harel J. 2014. Life on the
outside: role of biofilms in environmental persistence of Shiga-toxin producing
Escherichia coli. Front Microbiol 5:317.
76. Diez-Garcia M, Capita R, Alonso-Calleja C. 2012. Influence of serotype on the
growth kinetics and the ability to form biofilms of Salmonella isolates from
poultry. Food Microbiol 31:173-180.
77. Laverty G, Gorman SP, Gilmore BF. 2014. Biomolecular Mechanisms of
Pseudomonas aeruginosa and Escherichia coli Biofilm Formation. Pathogens
3:596-632.
78. Heindl JE, Wang Y, Heckel BC, Mohari B, Feirer N, Fuqua C. 2014.
Mechanisms and regulation of surface interactions and biofilm formation in
Agrobacterium. Front Plant Sci 5:176.
79. Hoffman MD, Zucker LI, Brown PJ, Kysela DT, Brun YV, Jacobson SC.
2015. Timescales and Frequencies of Reversible and Irreversible Adhesion Events
of Single Bacterial Cells. Anal Chem 87:12032-12039.
80. Sauer K. 2003. The genomics and proteomics of biofilm formation. Genome Biol
4:219.
81. Gerstel U, Romling U. 2001. Oxygen tension and nutrient starvation are major
signals that regulate agfD promoter activity and expression of the multicellular
morphotype in Salmonella typhimurium. Environ Microbiol 3:638-648.
82. Teschler JK, Zamorano-Sánchez D, Utada AS, Warner CJA, Wong GCL,
Linington RG, Yildiz FH. 2015. Living in the matrix: assembly and control of
Vibrio cholerae biofilms. Nature reviews. Microbiology 13:255-268.

130
83. O'Toole GA, Kolter R. 1998. Initiation of biofilm formation in Pseudomonas
fluorescens WCS365 proceeds via multiple, convergent signalling pathways: a
genetic analysis. Mol Microbiol 28:449-461.
84. Romling U, Sierralta WD, Eriksson K, Normark S. 1998. Multicellular and
aggregative behaviour of Salmonella typhimurium strains is controlled by
mutations in the agfD promoter. Mol Microbiol 28:249-264.
85. Sutrina SL, Griffith MS, Lafeuillee C. 2016. 2-Deoxy-d-glucose is a potent
inhibitor of biofilm growth in Escherichia coli. Microbiology 162:1037-1046.
86. Kuttler C, Hense BA. 2008. Interplay of two quorum sensing regulation systems
of Vibrio fischeri. J Theor Biol 251:167-180.
87. Leao PN, Engene N, Antunes A, Gerwick WH, Vasconcelos V. 2012. The
chemical ecology of cyanobacteria. Nat Prod Rep 29:372-391.
88. Romero M, Diggle SP, Heeb S, Camara M, Otero A. 2008. Quorum quenching
activity in Anabaena sp. PCC 7120: identification of AiiC, a novel AHL-acylase.
FEMS Microbiol Lett 280:73-80.
89. Valentini M, Filloux A. 2016. Biofilms and Cyclic di-GMP (c-di-GMP)
Signaling: Lessons from Pseudomonas aeruginosa and Other Bacteria. J Biol
Chem 291:12547-12555.
90. Toyofuku M, Inaba T, Kiyokawa T, Obana N, Yawata Y, Nomura N. 2015.
Environmental factors that shape biofilm formation. Biosci Biotechnol Biochem
80:7-12.
91. Bodenmiller D, Toh E, Brun YV. 2004. Development of surface adhesion in
Caulobacter crescentus. J Bacteriol 186:1438-1447.
92. Barnhart MM, Chapman MR. 2006. Curli biogenesis and function. Annu Rev
Microbiol 60:131-147.
93. Krasowska A, Sigler K. 2014. How microorganisms use hydrophobicity and
what does this mean for human needs? Frontiers in Cellular and Infection
Microbiology 4:112.
94. Montagud A, Gamermann D, Fernandez de Cordoba P, Urchueguia JF.
2015. Synechocystis sp. PCC6803 metabolic models for the enhanced production
of hydrogen. Crit Rev Biotechnol 35:184-198.
95. Yu Y, You L, Liu D, Hollinshead W, Tang YJ, Zhang F. 2013. Development
of Synechocystis sp. PCC 6803 as a phototrophic cell factory. Mar Drugs
11:2894-2916.

131
96. Bolhuis H, Cretoiu MS, Stal LJ. 2014. Molecular ecology of microbial mats.
FEMS Microbiol Ecol 90:335-350.
97. Cole JK, Hutchison JR, Renslow RS, Kim YM, Chrisler WB, Engelmann
HE, Dohnalkova AC, Hu D, Metz TO, Fredrickson JK, Lindemann SR. 2014.
Phototrophic biofilm assembly in microbial-mat-derived unicyanobacterial
consortia: model systems for the study of autotroph-heterotroph interactions.
Front Microbiol 5:109.
98. Sakiyama T, Ueno H, Homma H, Numata O, Kuwabara T. 2006. Purification
and characterization of a hemolysin-like protein, Sll1951, a nontoxic member of
the RTX protein family from the Cyanobacterium Synechocystis sp. strain PCC
6803. J Bacteriol 188:3535-3542.
99. Trautner C, Vermaas WF. 2013. The sll1951 gene encodes the surface layer
protein of Synechocystis sp. strain PCC 6803. J Bacteriol 195:5370-5380.
100. Auger S, Ramarao N, Faille C, Fouet A, Aymerich S, Gohar M. 2009. Biofilm
formation and cell surface properties among pathogenic and nonpathogenic
strains of the Bacillus cereus group. Appl Environ Microbiol 75:6616-6618.
101. Yoshihara S, Geng X, Okamoto S, Yura K, Murata T, Go M, Ohmori M,
Ikeuchi M. 2001. Mutational analysis of genes involved in pilus structure,
motility and transformation competency in the unicellular motile cyanobacterium
Synechocystis sp. PCC 6803. Plant Cell Physiol 42:63-73.
102. Kim YH, Kim JY, Kim SY, Lee JH, Lee JS, Chung YH, Yoo JS, Park YM.
2009. Alteration in the glycan pattern of pilin in a nonmotile mutant of
Synechocystis sp. PCC 6803. Proteomics 9:1075-1086.
103. Hultgren SJ, Normark S, Abraham SN. 1991. Chaperone-assisted assembly
and molecular architecture of adhesive pili. Annu Rev Microbiol 45:383-415.
104. Bhaya D, Bianco NR, Bryant D, Grossman A. 2000. Type IV pilus biogenesis
and motility in the cyanobacterium Synechocystis sp. PCC6803. Mol Microbiol
37:941-951.
105. Pratt LA, Kolter R. 1998. Genetic analysis of Escherichia coli biofilm
formation: roles of flagella, motility, chemotaxis and type I pili. Mol Microbiol
30:285-293.
106. Burriesci M, Bhaya D. 2008. Tracking phototactic responses and modeling
motility of Synechocystis sp. strain PCC6803. J Photochem Photobiol B 91:77-
86.

132
107. Hoiczyk E, Baumeister W. 1997. Oscillin, an extracellular, Ca2+-binding
glycoprotein essential for the gliding motility of cyanobacteria. Mol Microbiol
26:699-708.
108. Hoiczyk E, Baumeister W. 1998. The junctional pore complex, a prokaryotic
secretion organelle, is the molecular motor underlying gliding motility in
cyanobacteria. Curr Biol 8:1161-1168.
109. De Philippis R, Vincenzini M. 1998. Exocellular polysaccharides from
cyanobacteria and their possible applications. FEMS Microbiol Rev 22:151-175.
110. Pereira S, Zille A, Micheletti E, Moradas-Ferreira P, De Philippis R,
Tamagnini P. 2009. Complexity of cyanobacterial exopolysaccharides:
composition, structures, inducing factors and putative genes involved in their
biosynthesis and assembly. FEMS Microbiol Rev 33:917-941.
111. Panoff JM, Priem B, Morvan H, Joset F. 1988. Sulfated exopolysaccharides
produced by 2 unicellular strains of cyanobacteria, Synechocystis PCC-6803 and
PCC-6714. Arch Microbiol 150:558-563.
112. Whitfield C. 2006. Biosynthesis and assembly of capsular polysaccharides in
Escherichia coli. Annu Rev Biochem 75:39-68.
113. Camacho C, Coulouris G, Avagyan V, Ma N, Papadopoulos J, Bealer K,
Madden TL. 2009. BLAST+: architecture and applications. BMC Bioinformatics
10:421.
114. Temel DB, Dutta K, Alphonse S, Nourikyan J, Grangeasse C, Ghose R. 2013.
Regulatory interactions between a bacterial tyrosine kinase and its cognate
phosphatase. J Biol Chem 288:15212-15228.
115. Pereira SB, Mota R, Vieira CP, Vieira J, Tamagnini P. 2015. Phylum-wide
analysis of genes/proteins related to the last steps of assembly and export of
extracellular polymeric substances (EPS) in cyanobacteria. Sci Rep 5:14835.
116. Huang F, Hedman E, Funk C, Kieselbach T, Schroder WP, Norling B. 2004.
Isolation of outer membrane of Synechocystis sp. PCC 6803 and its proteomic
characterization. Mol Cell Proteomics 3:586-595.
117. Dong C, Beis K, Nesper J, Brunkan-Lamontagne AL, Clarke BR, Whitfield
C, Naismith JH. 2006. Wza the translocon for E. coli capsular polysaccharides
defines a new class of membrane protein. Nature 444:226-229.
118. Li YZ, Tang JL, Tang DJ, Ma QS. 2001. Pathogenicity of EPS-deficient
mutants (gumB(-), gumD(-) and gumE(-)) of Xanthomonas campestris pv.
campestris. Progress in Natural Science 11:871-875.

133
119. Smith CS, Hinz A, Bodenmiller D, Larson DE, Brun YV. 2003. Identification
of genes required for synthesis of the adhesive holdfast in Caulobacter crescentus.
J Bacteriol 185:1432-1442.
120. Rigano LA, Siciliano F, Enrique R, Sendin L, Filippone P, Torres PS, Questa
J, Dow JM, Castagnaro AP, Vojnov AA, Marano MR. 2007. Biofilm
formation, epiphytic fitness, and canker development in Xanthomonas axonopodis
pv. citri. Mol Plant Microbe Interact 20:1222-1230.
121. Jittawuttipoka T, Planchon M, Spalla O, Benzerara K, Guyot F, Cassier-
Chauvat C, Chauvat F. 2013. Multidisciplinary evidences that Synechocystis
PCC6803 exopolysaccharides operate in cell sedimentation and protection against
salt and metal stresses. PLoS One 8:e55564.
122. Cuthbertson L, Powers J, Whitfield C. 2005. The C-terminal domain of the
nucleotide-binding domain protein Wzt determines substrate specificity in the
ATP-binding cassette transporter for the lipopolysaccharide O-antigens in
Escherichia coli serotypes O8 and O9a. J Biol Chem 280:30310-30319.
123. Majdalani N, Heck M, Stout V, Gottesman S. 2005. Role of RcsF in signaling
to the Rcs phosphorelay pathway in Escherichia coli. J Bacteriol 187:6770-6778.
124. Altschul SF, Madden TL, Schaffer AA, Zhang J, Zhang Z, Miller W, Lipman
DJ. 1997. Gapped BLAST and PSI-BLAST: a new generation of protein database
search programs. Nucleic Acids Res 25:3389-3402.
125. White AP, Gibson DL, Collinson SK, Banser PA, Kay WW. 2003.
Extracellular polysaccharides associated with thin aggregative fimbriae of
Salmonella enterica serovar enteritidis. J Bacteriol 185:5398-5407.
126. Zhao C, Li Z, Li T, Zhang Y, Bryant DA, Zhao J. 2015. High-yield production
of extracellular type-I cellulose by the cyanobacterium Synechococcus sp. PCC
7002. Cell Discovery 1:15004.
127. Nobles DR, Romanovicz DK, Brown RM, Jr. 2001. Cellulose in cyanobacteria.
Origin of vascular plant cellulose synthase? Plant Physiol 127:529-542.
128. Enomoto G, Nomura R, Shimada T, Ni Ni W, Narikawa R, Ikeuchi M. 2014.
Cyanobacteriochrome SesA Is a Diguanylate Cyclase That Induces Cell
Aggregation in Thermosynechococcus. Journal of Biological Chemistry
289:24801-24809.
129. Wong HC, Fear AL, Calhoon RD, Eichinger GH, Mayer R, Amikam D,
Benziman M, Gelfand DH, Meade JH, Emerick AW, et al. 1990. Genetic
organization of the cellulose synthase operon in Acetobacter xylinum. Proc Natl
Acad Sci U S A 87:8130-8134.

134
130. Jenal U. 2004. Cyclic di-guanosine-monophosphate comes of age: a novel
secondary messenger involved in modulating cell surface structures in bacteria?
Curr Opin Microbiol 7:185-191.
131. Agostoni M, Koestler BJ, Waters CM, Williams BL, Montgomery BL. 2013.
Occurrence of cyclic di-GMP-modulating output domains in cyanobacteria: an
illuminating perspective. MBio 4.
132. Agostoni M, Waters CM, Montgomery BL. 2016. Regulation of biofilm
formation and cellular buoyancy through modulating intracellular cyclic di-GMP
levels in engineered cyanobacteria. Biotechnol Bioeng 113:311-319.
133. Scott M, McCollum C, Vasil'ev S, Crozier C, Espie GS, Krol M, Huner NP,
Bruce D. 2006. Mechanism of the down regulation of photosynthesis by blue
light in the Cyanobacterium synechocystis sp. PCC 6803. Biochemistry 45:8952-
8958.
134. Kariisa AT, Grube A, Tamayo R. 2015. Two nucleotide second messengers
regulate the production of the Vibrio cholerae colonization factor GbpA. BMC
Microbiol 15:166.
135. Rippka R DJ, Waterbury JB, Herdman M, Stanier RY 1979. Generic
assignments, strain histories and properties of pure cultures cyanobacteria. J Gen
Microbiol 111.
136. Zevin AS, Nam T, Rittmann B, Krajmalnik-Brown R. 2015. Effects of
phosphate limitation on soluble microbial products and microbial community
structure in semi-continuous Synechocystis-based photobioreactors. Biotechnol
Bioeng 112:1761-1769.
137. James G. 2010. Universal Bacterial Identification by PCR and DNA Sequencing
of 16S rRNA Gene, p. 209-214. In Schuller M, Sloots TP, James GS, Halliday
CL, Carter IWJ (ed.), PCR for Clinical Microbiology. Springer Netherlands.
138. Sambrook J, E. F. Fritsch, and T. Maniatis. . 1989. Molecular cloning: a
laboratory manual, 2nd edition. . Cold Spring Harbor Laboratory, Cold Spring
Harbor, New York.
139. Lagarde D, Beuf L, Vermaas W. 2000. Increased Production of Zeaxanthin and
Other Pigments by Application of Genetic Engineering Techniques to
Synechocystis sp. Strain PCC 6803. Appl Environ Microbiol 66:64-72.
140. Mitschke J, Georg J, Scholz I, Sharma CM, Dienst D, Bantscheff J, Voss B,
Steglich C, Wilde A, Vogel J, Hess WR. 2011. An experimentally anchored map
of transcriptional start sites in the model cyanobacterium Synechocystis sp.
PCC6803. Proc Natl Acad Sci U S A 108:2124-2129.
135
141. Ludwig A, Heimbucher T, Gregor W, Czerny T, Schmetterer G. 2008.
Transformation and gene replacement in the facultatively chemoheterotrophic,
unicellular cyanobacterium Synechocystis sp. PCC6714 by electroporation. Appl
Microbiol Biotechnol 78:729-735.
142. Kufryk GI, Sachet M, Schmetterer G, Vermaas WF. 2002. Transformation of
the cyanobacterium Synechocystis sp. PCC 6803 as a tool for genetic mapping:
optimization of efficiency. FEMS Microbiol Lett 206:215-219.
143. Cao Y, Johnson HM, Bazemore-Walker CR. 2012. Improved enrichment and
proteomic identification of outer membrane proteins from a Gram-negative
bacterium: focus on Caulobacter crescentus. Proteomics 12:251-262.
144. Wang Q, Nomura CT. 2010. Monitoring differences in gene expression levels
and polyhydroxyalkanoate (PHA) production in Pseudomonas putida KT2440
grown on different carbon sources. J Biosci Bioeng 110:653-659.
145. Klausen M, Gjermansen M, Kreft JU, Tolker-Nielsen T. 2006. Dynamics of
development and dispersal in sessile microbial communities: examples from
Pseudomonas aeruginosa and Pseudomonas putida model biofilms. FEMS
Microbiol Lett 261:1-11.
146. Oliveira C, Rubio J. 2012. A short overview of the formation of aerated flocs
and their applications in solid/liquid separation by flotation. Minerals Engineering
39:124-132.
147. Liu XW, Yu HQ, Ni BJ, Sheng GP. 2009. Characterization, modeling and
application of aerobic granular sludge for wastewater treatment. Adv Biochem
Eng Biotechnol 113:275-303.
148. Allakhverdiev SI, Nishiyama Y, Takahashi S, Miyairi S, Suzuki I, Murata N.
2005. Systematic analysis of the relation of electron transport and ATP synthesis
to the photodamage and repair of photosystem II in Synechocystis. Plant Physiol
137:263-273.
149. Bottomley PJ, Stewart WD. 1976. ATP pools and transients in the blue-green
alga, Anabaena cylindrica. Arch Microbiol 108:249-258.
150. Kim HW, Vannela R, Zhou C, Harto C, Rittmann BE. 2010. Photoautotrophic
nutrient utilization and limitation during semi-continuous growth of
Synechocystis sp. PCC6803. Biotechnology and Bioengineering 106:553-563.
151. Paithoonrangsarid K, Shoumskaya MA, Kanesaki Y, Satoh S, Tabata S, Los
DA, Zinchenko VV, Hayashi H, Tanticharoen M, Suzuki I, Murata N. 2004.
Five histidine kinases perceive osmotic stress and regulate distinct sets of genes in
Synechocystis. J Biol Chem 279:53078-53086.

136
152. Shoumskaya MA, Paithoonrangsarid K, Kanesaki Y, Los DA, Zinchenko
VV, Tanticharoen M, Suzuki I, Murata N. 2005. Identical Hik-Rre systems are
involved in perception and transduction of salt signals and hyperosmotic signals
but regulate the expression of individual genes to different extents in
synechocystis. J Biol Chem 280:21531-21538.
153. Juntarajumnong W, Eaton-Rye JJ, Incharoensakdi A. 2007. Two-component
signal transduction in Synechocystis sp. PCC 6803 under phosphate limitation:
role of acetyl phosphate. J Biochem Mol Biol 40:708-714.
154. Suzuki S, Ferjani A, Suzuki I, Murata N. 2004. The SphS-SphR two
component system is the exclusive sensor for the induction of gene expression in
response to phosphate limitation in synechocystis. J Biol Chem 279:13234-13240.
155. Carson JL, Brown RM. 1978. Studies of Hawaiian freshwater and soil algae II.
Algal colonjization and succession on a dated volcanic substrate. Journal of
Phycology 14:171-178.
156. Boutte CC, Crosson S. 2013. Bacterial lifestyle shapes stringent response
activation. Trends Microbiol 21:174-180.
157. Magnusson LU, Farewell A, Nystrom T. 2005. ppGpp: a global regulator in
Escherichia coli. Trends Microbiol 13:236-242.
158. Gaca AO, Colomer-Winter C, Lemos JA. 2015. Many means to a common end:
the intricacies of (p)ppGpp metabolism and its control of bacterial homeostasis. J
Bacteriol 197:1146-1156.
159. Potrykus K, Cashel M. 2008. (p)ppGpp: still magical? Annu Rev Microbiol
62:35-51.
160. Natori Y, Tagami K, Murakami K, Yoshida S, Tanigawa O, Moh Y, Masuda
K, Wada T, Suzuki S, Nanamiya H, Tozawa Y, Kawamura F. 2009.
Transcription activity of individual rrn operons in Bacillus subtilis mutants
deficient in (p)ppGpp synthetase genes, relA, yjbM, and ywaC. J Bacteriol
191:4555-4561.
161. Miao X, Liu H, Ning D. 2011. [Characterization of the Rela/SpoT homologue
slr1325 (syn-rsh) of the cyanobacterium Synechocystis sp. PCC6803]. Wei Sheng
Wu Xue Bao 51:898-905.
162. Atkinson GC, Tenson T, Hauryliuk V. 2011. The RelA/SpoT homolog (RSH)
superfamily: distribution and functional evolution of ppGpp synthetases and
hydrolases across the tree of life. PLoS One 6:e23479.

137
163. English BP, Hauryliuk V, Sanamrad A, Tankov S, Dekker NH, Elf J. 2011.
Single-molecule investigations of the stringent response machinery in living
bacterial cells. Proc Natl Acad Sci U S A 108:E365-373.
164. Hauryliuk V, Atkinson GC, Murakami KS, Tenson T, Gerdes K. 2015.
Recent functional insights into the role of (p)ppGpp in bacterial physiology. Nat
Rev Microbiol 13:298-309.
165. Nomura Y, Izumi A, Fukunaga Y, Kusumi K, Iba K, Watanabe S, Nakahira
Y, Weber AP, Nozawa A, Tozawa Y. 2014. Diversity in guanosine 3',5'-
bisdiphosphate (ppGpp) sensitivity among guanylate kinases of bacteria and
plants. J Biol Chem 289:15631-15641.
166. Kvint K, Hosbond C, Farewell A, Nybroe O, Nystrom T. 2000. Emergency
derepression: stringency allows RNA polymerase to override negative control by
an active repressor. Mol Microbiol 35:435-443.
167. Godfrey HP, Bugrysheva JV, Cabello FC. 2002. The role of the stringent
response in the pathogenesis of bacterial infections. Trends Microbiol 10:349-
351.
168. Germain E, Roghanian M, Gerdes K, Maisonneuve E. 2015. Stochastic
induction of persister cells by HipA through (p)ppGpp-mediated activation of
mRNA endonucleases. Proc Natl Acad Sci U S A 112:5171-5176.
169. Magnusson LU, Nystrom T, Farewell A. 2003. Underproduction of sigma 70
mimics a stringent response. A proteome approach. J Biol Chem 278:968-973.
170. Moreira RN, Domingues S, Viegas SC, Amblar M, Arraiano CM. 2012.
Synergies between RNA degradation and trans-translation in Streptococcus
pneumoniae: cross regulation and co-transcription of RNase R and SmpB. BMC
Microbiol 12:268.
171. Bridger WA, Paranchych W. 1978. relA Gene control of bacterial glycogen
synthesis. Can J Biochem 56:403-406.
172. Potrykus K, Wegrzyn G, Hernandez VJ. 2004. Direct stimulation of the
lambdapaQ promoter by the transcription effector guanosine-3',5'-
(bis)pyrophosphate in a defined in vitro system. J Biol Chem 279:19860-19866.
173. Kanjee U, Ogata K, Houry WA. 2012. Direct binding targets of the stringent
response alarmone (p)ppGpp. Mol Microbiol 85:1029-1043.
174. Nystrom T. 2004. Stationary-phase physiology. Annu Rev Microbiol 58:161-
181.

138
175. Kanjee U, Ogata K, Houry WA. 2012. Direct binding targets of the stringent
response alarmone (p)ppGpp. Mol Microbiol 85:1029-1043.
176. Boutte CC, Crosson S. 2011. The complex logic of stringent response regulation
in Caulobacter crescentus: starvation signalling in an oligotrophic environment.
Mol Microbiol 80:695-714.
177. Acosta R, Lueking DR. 1987. Stringency in the absence of ppGpp accumulation
in Rhodobacter sphaeroides. J Bacteriol 169:908-912.
178. Hood RD, Higgins SA, Flamholz A, Nichols RJ, Savage DF. 2016. The
stringent response regulates adaptation to darkness in the cyanobacterium
Synechococcus elongatus. Proc Natl Acad Sci U S A 113:E4867-4876.
179. Braeken K, Moris M, Daniels R, Vanderleyden J, Michiels J. 2006. New
horizons for (p)ppGpp in bacterial and plant physiology. Trends Microbiol 14:45-
54.
180. Balzer GJ, McLean RJ. 2002. The stringent response genes relA and spoT are
important for Escherichia coil biofilms under slow-growth conditions. Can J
Microbiol 48:675-680.
181. Nakanishi N, Abe H, Ogura Y, Hayashi T, Tashiro K, Kuhara S, Sugimoto
N, Tobe T. 2006. ppGpp with DksA controls gene expression in the locus of
enterocyte effacement (LEE) pathogenicity island of enterohaemorrhagic
Escherichia coli through activation of two virulence regulatory genes. Mol
Microbiol 61:194-205.
182. Taylor CM, Beresford M, Epton HA, Sigee DC, Shama G, Andrew PW,
Roberts IS. 2002. Listeria monocytogenes relA and hpt mutants are impaired in
surface-attached growth and virulence. J Bacteriol 184:621-628.
183. Boutte CC, Henry JT, Crosson S. 2012. ppGpp and polyphosphate modulate
cell cycle progression in Caulobacter crescentus. J Bacteriol 194:28-35.
184. Crawford EW, Jr., Shimkets LJ. 2000. The stringent response in Myxococcus
xanthus is regulated by SocE and the CsgA C-signaling protein. Genes Dev
14:483-492.
185. Ning D, Qian Y, Miao X, Wen C. 2011. Role of the all1549 (ana-rsh) gene, a
relA/spoT homolog, of the Cyanobacterium Anabaena sp. PCC7120. Curr
Microbiol 62:1767-1773.
186. Cohen SE, Golden SS. 2015. Circadian Rhythms in Cyanobacteria. Microbiol
Mol Biol Rev 79:373-385.

139
187. Shultzaberger RK, Boyd JS, Diamond S, Greenspan RJ, Golden SS. 2015.
Giving Time Purpose: The Synechococcus elongatus Clock in a Broader Network
Context. Annu Rev Genet 49:485-505.
188. Browse J, Roughan PG, Slack CR. 1981. Light control of fatty acid synthesis
and diurnal fluctuations of fatty acid composition in leaves. Biochem J 196:347-
354.
189. Kleinig H, Liedvogel B. 1979. On the energy requirements of fatty acid synthesis
in spinach chloroplasts in the light and in the dark. FEBS Lett 101:339-342.
190. Singer RA, Doolittle WF. 1975. Control of gene expression in blue-green algae.
Nature 253:650-651.
191. Aken BL, Ayling S, Barrell D, Clarke L, Curwen V, Fairley S, Fernandez
Banet J, Billis K, García Girón C, Hourlier T, Howe K, Kähäri A,
Kokocinski F, Martin FJ, Murphy DN, Nag R, Ruffier M, Schuster M, Tang
YA, Vogel J-H, White S, Zadissa A, Flicek P, Searle SMJ. 2016. The Ensembl
gene annotation system. Database 2016.
192. Kanesaki Y, Shiwa Y, Tajima N, Suzuki M, Watanabe S, Sato N, Ikeuchi M,
Yoshikawa H. 2012. Identification of substrain-specific mutations by massively
parallel whole-genome resequencing of Synechocystis sp. PCC 6803. DNA Res
19:67-79.
193. DeLuca DS, Levin JZ, Sivachenko A, Fennell T, Nazaire M-D, Williams C,
Reich M, Winckler W, Getz G. 2012. RNA-SeQC: RNA-seq metrics for quality
control and process optimization. Bioinformatics 28:1530-1532.
194. Trapnell C, Pachter L, Salzberg SL. 2009. TopHat: discovering splice junctions
with RNA-Seq. Bioinformatics 25:1105-1111.
195. Trapnell C, Hendrickson DG, Sauvageau M, Goff L, Rinn JL, Pachter L.
2013. Differential analysis of gene regulation at transcript resolution with RNA-
seq. Nat Biotech 31:46-53.
196. Robinson MD, McCarthy DJ, Smyth GK. 2010. edgeR: a Bioconductor
package for differential expression analysis of digital gene expression data.
Bioinformatics 26:139-140.
197. Huang da W, Sherman BT, Lempicki RA. 2009. Systematic and integrative
analysis of large gene lists using DAVID bioinformatics resources. Nat Protoc
4:44-57.
198. Huang da W, Sherman BT, Lempicki RA. 2009. Bioinformatics enrichment
tools: paths toward the comprehensive functional analysis of large gene lists.
Nucleic Acids Res 37:1-13.

140
199. Ashburner M, Ball CA, Blake JA, Botstein D, Butler H, Cherry JM, Davis
AP, Dolinski K, Dwight SS, Eppig JT, Harris MA, Hill DP, Issel-Tarver L,
Kasarskis A, Lewis S, Matese JC, Richardson JE, Ringwald M, Rubin GM,
Sherlock G. 2000. Gene ontology: tool for the unification of biology. The Gene
Ontology Consortium. Nat Genet 25:25-29.
200. Wada A, Mikkola R, Kurland CG, Ishihama A. 2000. Growth phase-coupled
changes of the ribosome profile in natural isolates and laboratory strains of
Escherichia coli. J Bacteriol 182:2893-2899.
201. Tagami K, Nanamiya H, Kazo Y, Maehashi M, Suzuki S, Namba E, Hoshiya
M, Hanai R, Tozawa Y, Morimoto T, Ogasawara N, Kageyama Y, Ara K,
Ozaki K, Yoshida M, Kuroiwa H, Kuroiwa T, Ohashi Y, Kawamura F. 2012.
Expression of a small (p)ppGpp synthetase, YwaC, in the (p)ppGpp(0) mutant of
Bacillus subtilis triggers YvyD-dependent dimerization of ribosome.
Microbiologyopen 1:115-134.
202. Kvint K, Nachin L, Diez A, Nystrom T. 2003. The bacterial universal stress
protein: function and regulation. Curr Opin Microbiol 6:140-145.
203. Diez A, Gustavsson N, Nystrom T. 2000. The universal stress protein A of
Escherichia coli is required for resistance to DNA damaging agents and is
regulated by a RecA/FtsK-dependent regulatory pathway. Mol Microbiol
36:1494-1503.
204. Kadowaki T, Nishiyama Y, Hisabori T, Hihara Y. 2015. Identification of
OmpR-family response regulators interacting with thioredoxin in the
Cyanobacterium Synechocystis sp. PCC 6803. PLoS One 10:e0119107.
205. Tamoi M, Miyazaki T, Fukamizo T, Shigeoka S. 2005. The Calvin cycle in
cyanobacteria is regulated by CP12 via the NAD(H)/NADP(H) ratio under
light/dark conditions. Plant J 42:504-513.
206. Garcia-Dominguez M, Reyes JC, Florencio FJ. 1999. Glutamine synthetase
inactivation by protein-protein interaction. Proc Natl Acad Sci U S A 96:7161-
7166.
207. Muro-Pastor MI, Reyes JC, Florencio FJ. 2001. Cyanobacteria perceive
nitrogen status by sensing intracellular 2-oxoglutarate levels. J Biol Chem
276:38320-38328.
208. Himeno H, Kurita D, Muto A. 2014. tmRNA-mediated trans-translation as the
major ribosome rescue system in a bacterial cell. Front Genet 5:66.
209. Milon P, Tischenko E, Tomsic J, Caserta E, Folkers G, La Teana A, Rodnina
MV, Pon CL, Boelens R, Gualerzi CO. 2006. The nucleotide-binding site of

141
bacterial translation initiation factor 2 (IF2) as a metabolic sensor. Proc Natl Acad
Sci U S A 103:13962-13967.
210. Corrigan RM, Bellows LE, Wood A, Grundling A. 2016. ppGpp negatively
impacts ribosome assembly affecting growth and antimicrobial tolerance in
Gram-positive bacteria. Proc Natl Acad Sci U S A 113:E1710-1719.
211. McGinn PJ, Price GD, Maleszka R, Badger MR. 2003. Inorganic carbon
limitation and light control the expression of transcripts related to the CO2-
concentrating mechanism in the cyanobacterium Synechocystis sp. strain
PCC6803. Plant Physiol 132:218-229.
212. Takano S, Tomita J, Sonoike K, Iwasaki H. 2015. The initiation of nocturnal
dormancy in Synechococcus as an active process. BMC Biol 13:36.
213. Saha R, Liu D, Hoynes-O’Connor A, Liberton M, Yu J, Bhattacharyya-
Pakrasi M, Balassy A, Zhang F, Moon TS, Maranas CD, Pakrasi HB. 2016.
Diurnal Regulation of Cellular Processes in the Cyanobacterium Synechocystis
sp. Strain PCC 6803: Insights from Transcriptomic, Fluxomic, and Physiological
Analyses. MBio 7:e00464-00416.
214. Herranen M, Aro EM, Tyystjarvi T. 2001. Two distinct mechanisms regulate
the transcription of photosystem II genes in Synechocystis sp. PCC 6803. Physiol
Plant 112:531-539.
215. Mohamed A, Eriksson J, Osiewacz HD, Jansson C. 1993. Differential
expression of the psbA genes in the cyanobacterium Synechocystis 6803. Mol
Gen Genet 238:161-168.
216. Vernotte C, Picaud M, Kirilovsky D, Olive J, Ajlani G, Astier C. 1992.
Changes in the photosynthetic apparatus in the cyanobacterium Synechocystis sp.
PCC 6714 following light-to-dark and dark-to-light transitions. Photosynth Res
32:45-57.
217. Smart LB, McIntosh L. 1991. Expression of photosynthesis genes in the
cyanobacterium Synechocystis sp. PCC 6803: psaA-psaB and psbA transcripts
accumulate in dark-grown cells. Plant Mol Biol 17:959-971.
218. Gaca AO, Kajfasz JK, Miller JH, Liu K, Wang JD, Abranches J, Lemos JA.
2013. Basal levels of (p)ppGpp in Enterococcus faecalis: the magic beyond the
stringent response. MBio 4:e00646-00613.
219. Tan X. 2012. Physiological and ecological characteristics in the life cycle of
bloom-forming cyanobacteria. Journal of Food Agriculture & Environment
10:929-934.

142
220. Deng W, Monks L, Neuer S. 2015. Effects of clay minerals on the aggregation
and subsequent settling of marine Synechococcus. Limnology and Oceanography
60:805-816.
221. da Silva TL, Gouveia L, Reis A. 2014. Integrated microbial processes for
biofuels and high value-added products: the way to improve the cost effectiveness
of biofuel production. Appl Microbiol Biotechnol 98:1043-1053.
222. Misra N, Panda PK, Parida BK. 2013. Agrigenomics for microalgal biofuel
production: an overview of various bioinformatics resources and recent studies to
link OMICS to bioenergy and bioeconomy. Omics 17:537-549.
223. Pires JC, Alvim-Ferraz MC, Martins FG, Simoes M. 2013. Wastewater
treatment to enhance the economic viability of microalgae culture. Environ Sci
Pollut Res Int 20:5096-5105.
224. Elena Kazamia DCA, Alison G. Smith. Synthetic ecology – A way forward for
sustainable algal biofuel production? Journal of Biotechnology 162:163–169.
225. Levenbach S. 2009. Grazing intensity influences the strength of an associational
refuge on temperate reefs. Oecologia 159:181-190.
226. Shurin JB, Abbott RL, Deal MS, Kwan GT, Litchman E, McBride RC,
Mandal S, Smith VH. 2013. Industrial-strength ecology: trade-offs and
opportunities in algal biofuel production. Ecol Lett 16:1393-1404.
227. Venturelli OS, Egbert RG, Arkin AP. 2016. Towards Engineering Biological
Systems in a Broader Context. J Mol Biol 428:928-944.
228. Stenuit B, Agathos SN. 2015. Deciphering microbial community robustness
through synthetic ecology and molecular systems synecology. Curr Opin
Biotechnol 33:305-317.
229. Song H, Ding MZ, Jia XQ, Ma Q, Yuan YJ. 2014. Synthetic microbial
consortia: from systematic analysis to construction and applications. Chem Soc
Rev 43:6954-6981.
230. Xiong W, Abraham PE, Li Z, Pan C, Hettich RL. 2015. Microbial
metaproteomics for characterizing the range of metabolic functions and activities
of human gut microbiota. Proteomics 15:3424-3438.
231. Gangl D, Zedler JA, Rajakumar PD, Martinez EM, Riseley A, Wlodarczyk
A, Purton S, Sakuragi Y, Howe CJ, Jensen PE, Robinson C. 2015.
Biotechnological exploitation of microalgae. J Exp Bot 66:6975-6990.

143
232. Cheney SaT, David W. . 2011. Comprehensive economic model of industrial-
scale production of fatty-acid derived J8 jet fuel from genetically modified
Synechocystis. Diversified Energy, Gilbert, Arizona.
233. Rittmann B, Vermaas W., Nielsen, D. c2016, posting date. "ARPA-E
Cyanobacteria Designed for Solar-Powered Highly Efficient Production of
Biofuels". Elsevier. [Online.]
234. Langille MGI, Zaneveld J, Caporaso JG, McDonald D, Knights D, Reyes JA,
Clemente JC, Burkepile DE, Vega Thurber RL, Knight R, Beiko RG,
Huttenhower C. 2013. Predictive functional profiling of microbial communities
using 16S rRNA marker gene sequences. Nat Biotech 31:814-821.
235. Barry M. 2014. Overcoming the Impacts of Extreme Weather and Dissolved
Organic Matter on the Treatability of Water using Ozone Dissertation. Arizona
State University.
236. Zhang Z, Schwartz S, Wagner L, Miller W. 2000. A greedy algorithm for
aligning DNA sequences. J Comput Biol 7:203-214.
237. Gilbert J, Jansson, Janet K and Knight, R. The Earth Microbiome project:
successes and aspirations. BMC Biol. 12.
238. Youssef N, Sheik CS, Krumholz LR, Najar FZ, Roe BA, Elshahed MS. 2009.
Comparison of species richness estimates obtained using nearly complete
fragments and simulated pyrosequencing-generated fragments in 16S rRNA gene-
based environmental surveys. Appl Environ Microbiol 75:5227-5236.
239. Edgar RC. 2010. Search and clustering orders of magnitude faster than BLAST.
Bioinformatics 26:2460-2461.
240. Wang Q.. Garrity G.M. TJ, Cole J.R. 2007. Naïve Bayesian Classifier for
Rapid Assignment of rRNA Sequences into the New Bacterial Taxonomy Appl
Environ Microbiol 73:5261–5267.
241. Daniel McDonald MNP, Julia Goodrich, Eric P Nawrocki, Todd Z DeSantis,
Alexander Probst, Gary L Andersen, Rob Knight, Philip Hugenholtz. 2012.
An improved Greengenes taxonomy with explicit ranks for ecological and
evolutionary analyses of bacteria and archaea. ISME J 6:610–618.
242. Caporaso JG, Bittinger K, Bushman FD, DeSantis TZ, Andersen GL, Knight
R. 2010. PyNAST: a flexible tool for aligning sequences to a template alignment.
Bioinformatics 26:266-267.
243. Price MN, Dehal PS, Arkin AP. 2009. FastTree: computing large minimum
evolution trees with profiles instead of a distance matrix. Mol Biol Evol 26:1641-
1650.

144
244. Haas BJ, Gevers D, Earl AM, Feldgarden M, Ward DV, Giannoukos G,
Ciulla D, Tabbaa D, Highlander SK, Sodergren E, Methe B, DeSantis TZ,
Petrosino JF, Knight R, Birren BW. 2011. Chimeric 16S rRNA sequence
formation and detection in Sanger and 454-pyrosequenced PCR amplicons.
Genome Res 21:494-504.
245. Heidorn T, Camsund D, Huang H-H, Lindberg P, Oliveira P, Stensjö K,
Lindblad P. 2011. Chapter Twenty-Four - Synthetic Biology in Cyanobacteria:
Engineering and Analyzing Novel Functions, p. 539-579. In Chris V (ed.),
Methods in Enzymology, vol. Volume 497. Academic Press.
246. 2010. Minitab Statistical Software, 17 ed. Minitab, Inc., State College, PA.
247. Montgomery DC. 2006. Design and Analysis of Experiments. John Wiley &
Sons.
248. 1989-2007. JMP® Pro, 12 ed. SAS Institute Inc., Cary, NC.
249. Szklarczyk D, Franceschini A, Wyder S, Forslund K, Heller D, Huerta-Cepas
J, Simonovic M, Roth A, Santos A, Tsafou KP, Kuhn M, Bork P, Jensen LJ,
von Mering C. 2015. STRING v10: protein-protein interaction networks,
integrated over the tree of life. Nucleic Acids Res 43:D447-452.
250. Kanehisa M, Sato Y, Kawashima M, Furumichi M, Tanabe M. 2016. KEGG
as a reference resource for gene and protein annotation. Nucleic Acids Res
44:D457-462.
251. Eiler A, Bertilsson S. 2007. Flavobacteria blooms in four eutrophic lakes: linking
population dynamics of freshwater bacterioplankton to resource availability. Appl
Environ Microbiol 73:3511-3518.
252. Hunte C, Screpanti E, Venturi M, Rimon A, Padan E, Michel H. 2005.
Structure of a Na+/H+ antiporter and insights into mechanism of action and
regulation by pH. Nature 435:1197-1202.
253. Rius N, Sole M, Francia A, Loren JG. 1995. Buffering capacity and H+
membrane conductance of gram-negative bacteria. FEMS Microbiol Lett
130:103-110.
254. Dumbrell AJ, Nelson M, Helgason T, Dytham C, Fitter AH. 2010. Relative
roles of niche and neutral processes in structuring a soil microbial community.
ISME J 4:337-345.
255. Yang H, Schmitt-Wagner D, Stingl U, Brune A. 2005. Niche heterogeneity
determines bacterial community structure in the termite gut (Reticulitermes
santonensis). Environ Microbiol 7:916-932.

145
256. Inaba M, Sakamoto A, Murata N. 2001. Functional expression in Escherichia
coli of low-affinity and high-affinity Na(+)(Li(+))/H(+) antiporters of
Synechocystis. J Bacteriol 183:1376-1384.
257. Burke C, Steinberg P, Rusch D, Kjelleberg S, Thomas T. 2011. Bacterial
community assembly based on functional genes rather than species. Proc Natl
Acad Sci U S A 108:14288-14293.
258. Morris JJ, Lenski RE, Zinser ER. 2012. The Black Queen Hypothesis:
evolution of dependencies through adaptive gene loss. MBio 3.
259. Foster KR, Bell T. 2012. Competition, not cooperation, dominates interactions
among culturable microbial species. Curr Biol 22:1845-1850.
260. Macarthur RH, Wilson EO. 1967. The Theory of Island Biogeography, REV -
Revised ed. Princeton University Press.
261. Freilich S, Kreimer A, Meilijson I, Gophna U, Sharan R, Ruppin E. 2010.
The large-scale organization of the bacterial network of ecological co-occurrence
interactions. Nucleic Acids Res 38:3857-3868.
262. Hubbell S. 2001. The Unified Neutral Theory of Biodiversity and Biogeography.
Princeton University Press.
263. MacArthur RH. 1958. Population ecology of some warblers of northeastern
coniferous forests. Ecology 39:599–619.
264. Woodcock S, van der Gast CJ, Bell T, Lunn M, Curtis TP, Head IM, Sloan
WT. 2007. Neutral assembly of bacterial communities. FEMS Microbiol Ecol
62:171-180.
265. Sale PM. Coexistence of coral reef fishes — a lottery for living space.
Environmental Biology of Fishes 3: 85-102.
266. Munday PL. 2004. Competitive coexistence of coral-dwelling fishes: The lottery
hypothesis revisited. Ecology 85:6.
267. Villa F, Pitts B, Lauchnor E, Cappitelli F, Stewart PS. 2015. Development of a
Laboratory Model of a Phototroph-Heterotroph Mixed-Species Biofilm at the
Stone/Air Interface. Front Microbiol 6:1251.
268. Rittmann BE, Krajmalnik-Brown R, Halden RU. 2008. Pre-genomic, genomic
and post-genomic study of microbial communities involved in bioenergy. Nat Rev
Microbiol 6:604-612.

146
269. Crawford A, Wilson D. 2015. Essential metals at the host-pathogen interface:
nutritional immunity and micronutrient assimilation by human fungal pathogens.
FEMS Yeast Res 15.
270. Kelliher JL, Kehl-Fie TE. 2016. Competition for Manganese at the Host-
Pathogen Interface. Prog Mol Biol Transl Sci 142:1-25.
271. Soares MP, Weiss G. 2015. The Iron age of host-microbe interactions. EMBO
Rep 16:1482-1500.
272. Shaw AJ, Lam FH, Hamilton M, Consiglio A, MacEwen K, Brevnova EE,
Greenhagen E, LaTouf WG, South CR, van Dijken H, Stephanopoulos G. 2016. Metabolic engineering of microbial competitive advantage for industrial
fermentation processes. Science 353:583-586.

147
APPENDIX A
TABLES OF GENE EXPRESSION DATA FOR CHAPTER 3

148
Table A.1: Differentially expressed genes grouped by categories of gene function.
Entry Gene logFC a PValue Homology Function
Category 1: Hypotheticals
1 slr0272 5.0142 0.0002 conserved
hypothetical
unknown
2 ssr2843 4.9496 0.0147 conserved
hypothetical
Tryptophan-rich conserved hypothetical
3 slr0443 4.6126 0.0004 conserved
hypothetical
unknown
4 sll0944 4.2472 0.0052 conserved
hypothetical
conserved domain of unknown function
5 sll0376 3.7784 0.0023 conserved
hypothetical
unknown
6 sll0442 3.5440 0.0051 conserved
hypothetical
unknown
7 sll1338 2.6673 0.0201 conserved
hypothetical
unknown
8 sll0676 2.5492 0.0377 conserved
hypothetical
GxWxG domain conserved hypothetical
9 slr0587 2.4653 0.0306 conserved
hypothetical
possible hydrolase conserved domain
10 sll0481 2.4377 0.0451 conserved
hypothetical unknown

149
Table A.1: Differentially expressed genes grouped by categories of gene function.
Entry Gene logFC a PValue Homology Function
Category 1: Hypotheticals
11 ssr1528 5.0142 0.0543 conserved
hypothetical
conserved hypothetical
12 slr0668 4.9496 0.0467 conserved
hypothetical
conserved hypothetical
13 slr0971 4.6126 0.0465 conserved
hypothetical
conserved hypothetical
14 sll0181 4.2472 0.0360 conserved
hypothetical
conserved hypothetical
15 sll1698 3.7784 0.0321 conserved
hypothetical
conserved hypothetical
16 sll1240 3.5440 0.0302 conserved
hypothetical
conserved hypothetical
17 sll1606 2.6673 0.0190 conserved
hypothetical
conserved hypothetical
18 slr1907 2.5492 0.0179 conserved
hypothetical
conserved hypothetical
19 slr0921 2.4653 0.0162 conserved
hypothetical
conserved hypothetical
20 ssr2009 2.4377 0.0340 conserved
hypothetical conserved hypothetical

150
Table A.1: Differentially expressed genes grouped by categories of gene function.
Entry Gene logFC a PValue Homology Function
Category 1: Hypotheticals
21 slr0325 -3.6984 0.0031 conserved
hypothetical
MEKHLA domain.
22 sll0364 -4.0065 0.0090 conserved
hypothetical
conserved domain of unknown function
23 ssl3829 -4.5098 0.0032 conserved
hypothetical
conserved domain of unknown function
24 sll1236 -4.9288 0.0001 conserved
hypothetical
unknown
25 sll1853 -4.9809 0.0004 conserved
hypothetical
conserved domain of unknown function
26 ssl3446 -5.4443 0.0004 conserved
hypothetical
conserved domain of unknown function
27 ssr2551 -6.7090 0.0004 conserved
hypothetical
conserved domain of unknown function
Category 2: Transposases (transposon motility)
28 ssr2227 5.7731 0.0000 ssr2227 putative transposase
29 sll1791 3.6889 0.0158 ISY802a putative transposase [ISY802a: 852462 -
853369]

151
Table A.1: Differentially expressed genes grouped by categories of gene function.
Entry Gene logFC a PValue Homology Function
Category 2: Transposases (transposon motility)
30 ssr2227 5.7731 0.0000 ssr2227 putative transposase [ISY523o(partial copy):
2225804 - 2226597]
31 sll1791 3.6889 0.0158 ISY802a putative transposase [ISY120f(partial copy):
664387 - 664775]
32 sll1861 -2.4027 0.0413 ISY523o putative transposase [ISY352a(partial copy):
572672 - 572905]
33 sll0986 -3.7133 0.0025 ISY120f putative transposase [ISY120b: 1385747 -
1386548]
34 ssr3452 -3.7356 0.0028 ISY352a putative transposase [ISY523c: 1513158 -
1514023]
Category 3: Nutrient Transport / Uptake
35 cysT 3.2375 0.0160 cysT sulfate transport system permease protein
36 mntA 2.9193 0.0138 mntA manganese transport system ATP-binding
protein MntA
37 ccmL 2.7228 0.0221 ccmL carbon dioxide concentrating mechanism
protein Ccm
38 mgtC 2.6197 0.0244 mgtC Mg2+ transport ATPase

152
Table A.1: Differentially expressed genes grouped by categories of gene function.
Entry Gene logFC a PValue Homology Function
Category 3: Nutrient Transport / Uptake
39 slr1492 2.6099 0.0307 fecB iron(III) dicitrate transport system substrate-
binding protein
40 sll0409 2.4756 0.0354 menC similar to O-succinylbenzoate-CoA synthase
41 slr1261 2.3976 0.0356 Rhodanese-related sulfurtransferase
[Inorganic ion transport and metabolism]
42 glcP 2.3647 0.0393 glcP, gtr, tgr glucose transport protein
43 amt1 2.2570 0.0458 amt1, amt ammonium/methylammonium permease.
44 natD -2.2678 0.0469 natD
Integral membrane protein of the ABC-type
Nat permease for uptake of neutral amino
acids NatD
45 slr1978 -2.8267 0.0155 Cobalt transport protein
46 sll1734 -2.9221 0.0117 cupA, chpY,
sll1734
protein involved in low CO2-inducible, high
affinity CO2 uptake
47 cysA -3.5954 0.0028 cysA sulfate transport system ATP-binding protein
48 sll0732 -2.7804 0.0213 Carbonic anydrase converts CO2 to
bicarbonate.

153
Table A.1: Differentially expressed genes grouped by categories of gene function.
Entry Gene logFC a PValue Homology Function
Category 4: Salt / osmotic / pH / redox stress response; nutrient limitation tolerance and/or adaptation
49 sll0594 3.9714 0.0018 signal transduction: regulatory subunit of
cAMP-dependent protein kinase.
50 slr0623 2.4172 0.0347 trxA thioredoxin regulates redox status during
transition to or from acive phoosynhesis.
51 cysH -2.3242 0.0409 cysH phosphoadenosine phosphosulfate reductase
52 ssr1558 -2.3643 0.0424 UPF0016 superfamily conserved
hypothetical. Putative Ca2+/H+ antiporter.
53 hisB -2.6099 0.0307 hisB two-component response regulator OmpR
subfamily
54 slr2010 -2.9301 0.0145 mrpE Na+/H+ sodium exporter in alkalophilic
Bacillus
55 slr0530 -4.1689 0.0033 ggtC glucosylglycerol transport system permease
protein
56 sll0685 -6.1098 0.0013 Thiol-disulfide isomerase or thioredoxin
[Posttranslational modification, s]
57 sll1318 -7.5408 0.0001 Putative Ca2+/H+ antiporter,
TMEM165/GDT1 family
58 smtB -5.5004 0.0003 ziaR Represses zinc sequestration.

154
Table A.1: Differentially expressed genes grouped by categories of gene function.
Entry Gene logFC a PValue Homology Function
Category 5: Biomolecule export
59 slr1046 2.4887 0.0313 pilA3 putative TatA protein
60 pilA4 -2.3662 0.0425 gspG Group 4 pilin-like protein, or general secretion
pathway protein G
61 slr1819 -3.5321 0.0031 rfrM Uncharacterized protein YjbI
62 slr0516 -4.7106 0.0168 rfrD Secreted effector protein PipB2
Category 6: Glycosyltransferase and methyltransferase and N-acetyltransferase
63 sll1173 2.3455 0.0543 methyltransferase, FkbM family
64 slr1537 2.1863 0.0527 Glycosyltransferase family A.
65 sll1664 -2.2384 0.0479 Glycosyltransferase, GT2 family.
66 slr1039 -2.5300 0.0310 S-adenosylmethionine-dependent
methyltransferases.
67 crtE -2.5575 0.0254 crtE solanesyl diphosphate synthase

155
Table A.1: Differentially expressed genes grouped by categories of gene function.
Entry Gene logFC a PValue Homology Function
Category 6: Glycosyltransferase and methyltransferase and N-acetyltransferase
68 icsA -2.6996 0.0272 icsA probable glycosyltransferase
69 slr0491 -5.1802 0.0007 Uncharacterized conserved protein YtfP,
gamma-glutamylcyclotransferase
70 sll0786 -7.4170 0.0001 putative N-acetyltransferase, MSMEG_0567
N-terminal domain family (GNAT family)
Category 7: ABC Transporters
71 ycf16 -2.3710 0.0364 sufC ABC transporter ATP-binding protein
72 slr0610 -2.4308 0.0379 evrC ABC-type uncharacterized transport system,
permease component
73 sll1623 -3.0594 0.0117 ndhM ABC transporter ATP-binding protein
Category 8: Sigma factors and signal transduction and transcription regulators
74 sll1169 3.5048 0.0120 signal transduction: cAMP-binding domain
of CRP
75 sll0241 2.7168 0.0200 Periplasmic ligand-binding sensor domain
[Signal transduction mechanisms).

156
Table A.1: Differentially expressed genes grouped by categories of gene function.
Entry Gene logFC a PValue Homology Function
Category 9: Energy / transport (ATP, NAD(P)H, cytochromes, ferrodoxin, chlororespiration
76 chlL 3.4196 0.0039 chlL light-independent protochlorophyllide
reductase iron protein subunit ChlL
77 gdhA 3.1509 0.0080 gdhA glutamate dehydrogenase (NADP+)
78 chlN 3.1434 0.0073 chlN light-independent protochlorophyllide
reductase subunit ChlN
79 sll0572 3.1169 0.0083
80 purK 3.0109 0.0100 purK phosphoribosylaminoimidazole carboxylase
ATPase subunit
81 petF 2.7699 0.0163 petF ferredoxin, petF-like protein
82 sll1308 2.6806 0.0346 short-chain dehydrogenase/reductase with
NADP binding site
83 petL 2.5553 0.0271 petL cytochrome b6f.
84 sll1504 -2.2519 0.0475 HAS domain
85 glcF -2.3702 0.0381 glcF glycolate oxidase subunit, (Fe-S)protein

157
Table A.1: Differentially expressed genes grouped by categories of gene function.
Entry Gene logFC a PValue Homology Function
Category 9: Energy / transport (ATP, NAD(P)H, cytochromes, ferrodoxin, chlororespiration
86 mrpC -2.5675 0.0252 mrpC hypothetical protein
87 sll0088 -2.6089 0.0229 sufR hypothetical protein. iron-sulfur cluster
biosynthesis transcriptional regulator SufR
88 petM -2.7065 0.0456 petM cytochrome b6-f complex subunit PetM
89 slr0091 -2.9776 0.0108 NAD(P) binding site
90 nadD -3.1327 0.0089 nadD hypothetical protein
91 sll0509 -4.3323 0.0006 ATP adenylyltransferase [Nucleotide
transport and metabolism]
92 ssl3451 -5.7963 0.0024 sipA chlororespiratory reduction
Category 10: Transcription and translation machinery
93 trnY 6.6955 0.0004 amino-acyl tRNA biosynthesis for tyrosine
94 rpl29 3.1827 0.0075 rpmC 50S ribosomal protein L29

158
Table A.1: Differentially expressed genes grouped by categories of gene function.
Entry Gene logFC a PValue Homology Function
Category 10: Transcription and translation machinery
95 slr0033 3.9511 0.0013 slr0033 glutamyl-tRNA(Gln) amidotransferase
subunit C
96 ssl2781 3.6345 0.0058
97 purN 2.9396 0.0123 purN phosphoribosylglycinamide
formyltransferase
98 pyrH 2.8953 0.0130 pyrH uridine monophosphate kinase
99 purL 2.7011 0.0210 purL phosphoribosyl formylglycinamidine
synthase
100 sll0546 2.6015 0.0240 putative rRNA binding site [nucleotide
binding]; translation initiation factor
101 lrtA 2.5755 0.0308 hpf light repressed protein A homolog
102 thrC -2.2346 0.0485 thrC threonine synthase
103 trpF -2.2871 0.0504 trpF N-(5-phosphoribosyl)anthranilate isomerase.
Anthraniline is an amino acid.
104 nifS -2.3512 0.0381 sufS cysteine desulfurase

159
Table A.1: Differentially expressed genes grouped by categories of gene function.
Entry Gene logFC a PValue Homology Function
Category 10: Transcription and translation machinery
105 tyrS -5.5486 0.0039 tyrS similar to tyrosyl tRNA synthetase
106 trnL -6.4674 0.0006 amino-acyl tRNA synthesis, leucine
107 exsB -2.7403 0.0284 exsB homolog of an alternative nucleoside tRNA
that promostes translation continuity.
Category 11: Phage stress response, toxin-antitoxin defense, other stress response
108 slr0725 5.4645 0.0004 toxin from toxin-antitoxin system
109 slr0244 4.3097 0.0007 UspA putative USP-like, Usp: Universal stress protein
family.
110 comB 3.4894 0.0041 2-phosphosulfolactate phosphatase.
111 slr1912 2.1914 0.0520 anti-sigmaF factor. SigmaF is group 3 stress
response.
112 smpB -2.2706 0.0453 smpB SsrA-binding protein. Trans-translation for
stalled ribosome recovery mechanism.
113 sll0162 -2.3695 0.0387 phage shock protein A (IM30), suppresses
sigma54-dependent transcription

160
Table A.1: Differentially expressed genes grouped by categories of gene function.
Entry Gene logFC a PValue Homology Function
Category 10: Transcription and translation machinery
114 ssr0336 -2.5542 0.0261 Predicted nuclease of the RNAse H fold,
HicB family [Defense mechanisms]
115 sll0687 -2.8049 0.0227 sigI. Group 3 sigma factor related to stress
response
116 slr2100 -2.8078 0.0162 rre20 two-component response regulator of UV-B
sress response
117 hsp17 -3.2950 0.0052 hspA heat shock protein known to be highly
expressed in the dark.
118 ssr2067 -3.3355 0.0058 Predicted RNAse H [Defense mechanisms]
119 sll1400 -3.7070 0.0032 Predicted nuclease, contains PIN domain,
potential toxin-antitoxin system component
120 vapB -3.9668 0.0051 vapB virulence-associated protein
121 vapC -7.1379 0.0001 vapC. High expression levels under heat stress and
in the absence of light
122 cbiC -8.0565 0.0000 cobH cobalt-dependent transcriptional regulator.
Shown to confer tolerance to ethanol.

161
Table A.1: Differentially expressed genes grouped by categories of gene function.
Entry Gene logFC a PValue Homology Function
Category 12: Phototrophy
123 psaD 3.0203 0.0094 psaD photosystem I subunit II
124 apcB 2.9054 0.0121 apcB allophycocyanin beta subunit
125 slr0146 2.8666 0.0132
126 psaL 2.4379 0.0319 psaL photosystem I subunit XI
127 apcE 2.3336 0.0392 apcE phycobilisome core-membrane linker
polypeptide
128 apcA 2.3205 0.0403 allophycocyanin.
129 slr1870 -2.6937 0.0219 Uncharacterized conserved protein,
LabA/DUF88 family
Category 13: Cell wall modification; appendage biogenesis
130 sll0501 -2.2736 0.0443 Bactoprenol Glucosyl transferase. Cell wall
biogenesis.
131 slr0769 -2.5971 0.0235 Lipoprotein-anchoring transpeptidase ErfK
[Cell wall/membrane/envelope biogenesis]

162
Table A.1: Differentially expressed genes grouped by categories of gene function.
Entry Gene logFC a PValue Homology Function
Category 13: Cell wall modification; appendage biogenesis
132 sll1834 -2.6540 0.0244 flagellar basal body-associated protein FliL
133 ssl0331 -2.8704 0.0164 Haemolytic domain. membrane protein
insertion efficiency factor YidD
134 sll0886 -3.8177 0.0017 Uncharacterized membrane protein YozV
135 slr0061 -3.8938 0.0020 protein-protein interaction motif
tetratricopeptide repeat
Category 14: central carbon metabolism
136 sucC 2.8476 0.0139 sucC succinyl-CoA synthetase beta chain
137 sll0445 2.4920 0.0286 ppsA, pps phosphoenolpyruvate synthase
138 slr0553 -2.2098 0.0523 Dephospho-CoA kinase [Coenzyme transport
and metabolism]
139 pgk -4.0513 0.0009 pgk the first ATP-generating step of the
glycolytic pathway

163
Table A.1: Differentially expressed genes grouped by categories of gene function.
Entry Gene logFC a PValue Homology Function
Category 15: Secondary metabolism: vitamin B, terpenes, others.
140 moaE 3.4136 0.0249 moaE molybdopterin (MPT) converting factor,
subunit 2
141 pdxH 2.6007 0.0263 pdxH pyridoxamine 5-phosphate oxidase
142 pyrF 2.5354 0.0298 pyrF orotidine 5 monophosphate decarboxylase,
nucleoside intermediate
143 slr0596 2.4296 0.0343 creatinine amidohydrolase involved in
riboflavin and F420 biosynthesis
144 entC -2.2936 0.0460 menF salicylate biosynthesis isochorismate
synthase
145 degT -2.5339 0.0279 degT pleiotropic regulatory protein homolog
146 sll0787 -2.9869 0.0110 AIR synthase-related protein, sll0787.
147 sll0403 -4.8204 0.0005 Catalytic NodB homology domain of the
carbohydrate esterase 4 superfamily.
148 cbiM -6.6336 0.0000 cbiM cobalamin biosynthesis protein M
149 slr0953 -2.5231 0.0294 spsB sucrose-phosphate phosphatase

164
Table A.1: Differentially expressed genes grouped by categories of gene function.
Entry Gene logFC a PValue Homology Function
Category 15: Secondary metabolism: vitamin B, terpenes, others.
150 ipk -2.7161 0.0200 ipk isopentenyl monophosphate kinase, biosynthesis of
terpenes and terpenoids.
Category 16: DNA replication, recombination, repair
151 ssl2789 5.3312 0.0001 similar to resolvase
152 sll0544 -2.5270 0.0278
153 phr -2.7315 0.0200 phrA DNA photolyase. Light-dependent DNA repair
154 ruvB -7.5349 0.0001 ruvB Holliday junction DNA helicase RuvB
Category 17: Cell division / cell cycle control
155 slr1478 2.4736 0.0367 SpoIIM Uncharacterized membrane protein [Cell cycle
control, cell division, chromosome partitioning]

165
Table A.1: Differentially expressed genes grouped by categories of gene function.
Entry Gene logFC a PValue Homology Function
Category 18: Proteases, hydrolases, nucleases
156 slr0287 2.6075 0.0257 Predicted RNA-binding protein YlqC
157 slr0709 2.3286 0.0472 reactive intermediate/imine deaminase.
Endoribonuclease.
158 slr0241 2.2467 0.0484 Zn-dependent protease with chaperone
function
159 sll0914 -2.4124 0.0354 GDSL-like Lipase/Acylhydrolase
160 slr1636 -2.6501 0.0391 Predicted metal-dependent hydrolase
161 sll0639 -2.8266 0.0146 nanoRNase/pAp phosphatase, hydrolyzes c-
di-AMP and oligoRNAs.
162 slr1827 -2.9925 0.0128 hydrolase, alpha/beta fold family protein
163 xthA -4.8263 0.0016 xthA exodeoxyribonuclease III
164 nth -6.5196 0.0005 nth endonuclease III
165 mutT -7.2019 0.0001 mutT mutator MutT protein
a LogFC is the log10 fold change of the fragments per kilobase of exon per million fragments mapped (FPKM).

166
Table A.2: All Synechocystis genes predicted to be up-regulated during stringent response.
Entry Gene logFC a PValue Homology Function
1 6.6955 0.0004 trnY amino-acyl tRNA biosynthesis for tyrosine
2 slr0244 4.3097 0.0007 UspA putative USP-like, Usp: Universal stress protein.
3 slr1492 2.6099 0.0307 fecB iron(III) dicitrate transport system substrate-
binding protein
4 lrtA 2.5755 0.0308 hpf light repressed protein A homolog; ribosome
hibernation promotion factor
5 sll0445 2.4920 0.0286 ppsA, pps phosphoenolpyruvate synthase
6 slr0623 2.4172 0.0347 trxA protein disulfide oxidoreductase activity
7 slr0009 1.5936 0.1495 rbcL ribulose bisphosphate carboxylase large
subunit
8 slr1106 1.1892 0.2780 phb prohibitin
9 sll1898 1.1383 0.2970 ggtA salt tolerance
10 ctaB 1.0907 0.3177 sll1899 cytochrome c oxidase folding protein
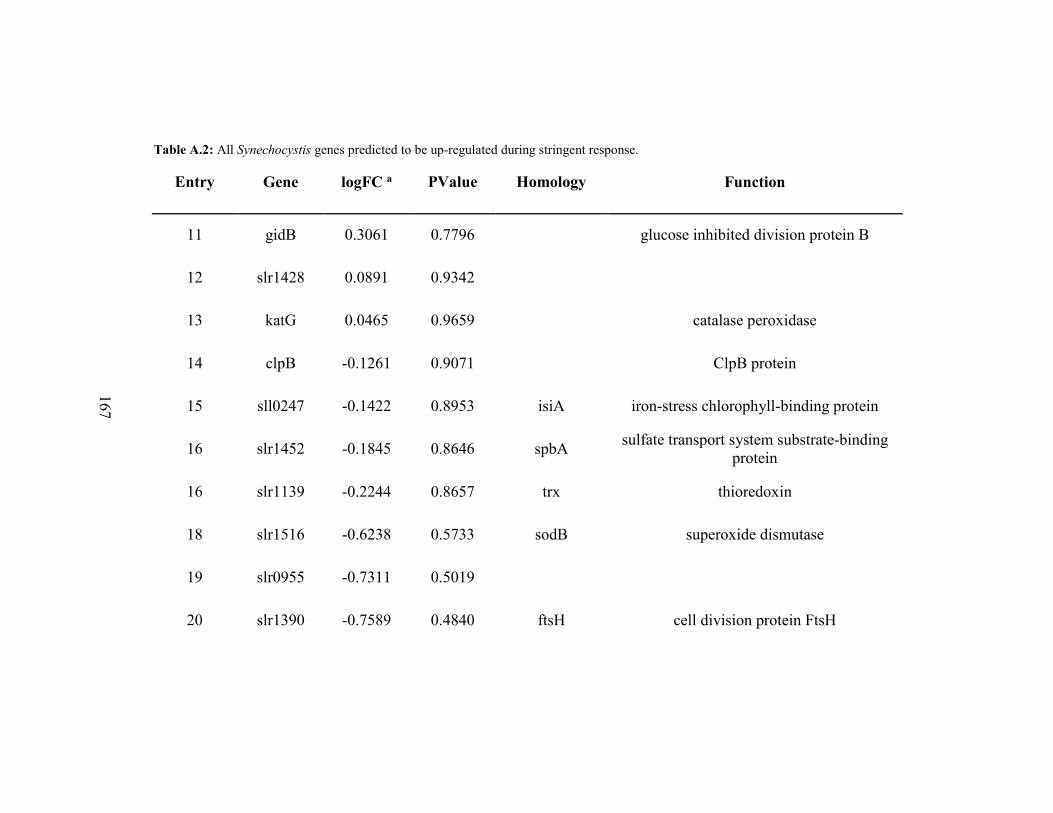
167
Table A.2: All Synechocystis genes predicted to be up-regulated during stringent response.
Entry Gene logFC a PValue Homology Function
11 gidB 0.3061 0.7796 glucose inhibited division protein B
12 slr1428 0.0891 0.9342
13 katG 0.0465 0.9659 catalase peroxidase
14 clpB -0.1261 0.9071 ClpB protein
15 sll0247 -0.1422 0.8953 isiA iron-stress chlorophyll-binding protein
16 slr1452 -0.1845 0.8646 spbA sulfate transport system substrate-binding
protein
16 slr1139 -0.2244 0.8657 trx thioredoxin
18 slr1516 -0.6238 0.5733 sodB superoxide dismutase
19 slr0955 -0.7311 0.5019
20 slr1390 -0.7589 0.4840 ftsH cell division protein FtsH

168
Table A.2: All Synechocystis genes predicted to be up-regulated during stringent response.
Entry Gene logFC a PValue Homology Function
21 slr0955 -0.9185 0.3997 probable tRNA/rRNA methyltransferase
22 slr1739 -0.9711 0.3725 psbW photosystem II 13 kDa protein homolog
23 ssl1633 -1.5338 0.1664 hliC high light-inducible polypeptide HliC
24 sll1911 -1.8061 0.1040 elongation factor EF-G
25 slr1184 -1.9940 0.0746 atpG ATP synthase subunit b
26 slr1639 -2.0594 0.0662 smpB
27 pilA4 -2.1053 0.0769
28 petM -2.2706 0.0453
29 ssl1911 -2.5905 0.1040 gifA glutamine synthetase inactivating factor IF7
30 sll1514 -3.2950 0.0052 hspA 16.6 kDa small heat shock protein, molecular
chaperone

169
Table A.3: All Synechocystis genes predicted to be down-regulated during stringent response.
Entry Gene logFC a PValue Homology Function
Category 2: Genes predicted to be down-regulated during stringent response
1 ssl3436 3.1827 0.0075 rpl29 50S ribosomal protein L29
2 slr1986 2.9054 0.0121 apcB allophycocyanin beta subunit
3 slr0146 2.8666 0.0132 phycobillisome
4 sll1198 2.4669 0.0312 trmD tRNA (guanine-N1)-methyltransferase
5 sll1452 1.3017 0.2370 nrtC nitrate/nitrite transport system ATP-binding
protein
6 sll0070 0.6038 0.5776 purU phosphoribosylglycinamide
formyltransferase
7 slr1348 0.1380 0.8986 cysE serine acetyltransferase
8 slr1512 0.1042 0.9239 sbtA sodium-dependent bicarbonate transporter
9 sll1112 0.0518 0.9618 aroQ 3-dehydroquinate dehydratase
10 -0.0609 0.9563 ribG putative riboflavin-specific deaminase

170
Table A.3: All Synechocystis genes predicted to be down-regulated during stringent response.
Entry Gene logFC a PValue Homology Function
11 slr1842 -0.0975 0.9282 cysK cysteine synthase
12 slr1512 -0.1028 0.9241 slr1512 sodium-dependent bicarbonate transporter
13 slr1653 -0.4094 0.7059 ama N-acyl-L-amino acid amidohydrolase
14 -0.8506 0.4439 trmB tRNA methyltransferase
15 sll1509 -1.3493 0.2223 ycf20 hypothetical protein YCF20
16 slr0041 -1.5888 0.1514 cmpB bicarbonate transport system permease
protein
17 slr1197 -2.0134 0.0759 slr1197 SMF protein
18 slr2007 -2.0398 0.0710 ndhD5 NADH dehydrogenase subunit 4
a LogFC is the log10 fold change of the fragments per kilobase of exon per million fragments mapped (FPKM).

171
APPENDIX B
SUPPLEMENTARY FIGURES

172
Figure B.1. Genes for S-layer, Wza are not required for phototactic motility.
The pilC mutant is a negative control, known to be impaired for pili-dependent twitching motility of
phototaxis.
WT s-layer pilC wza
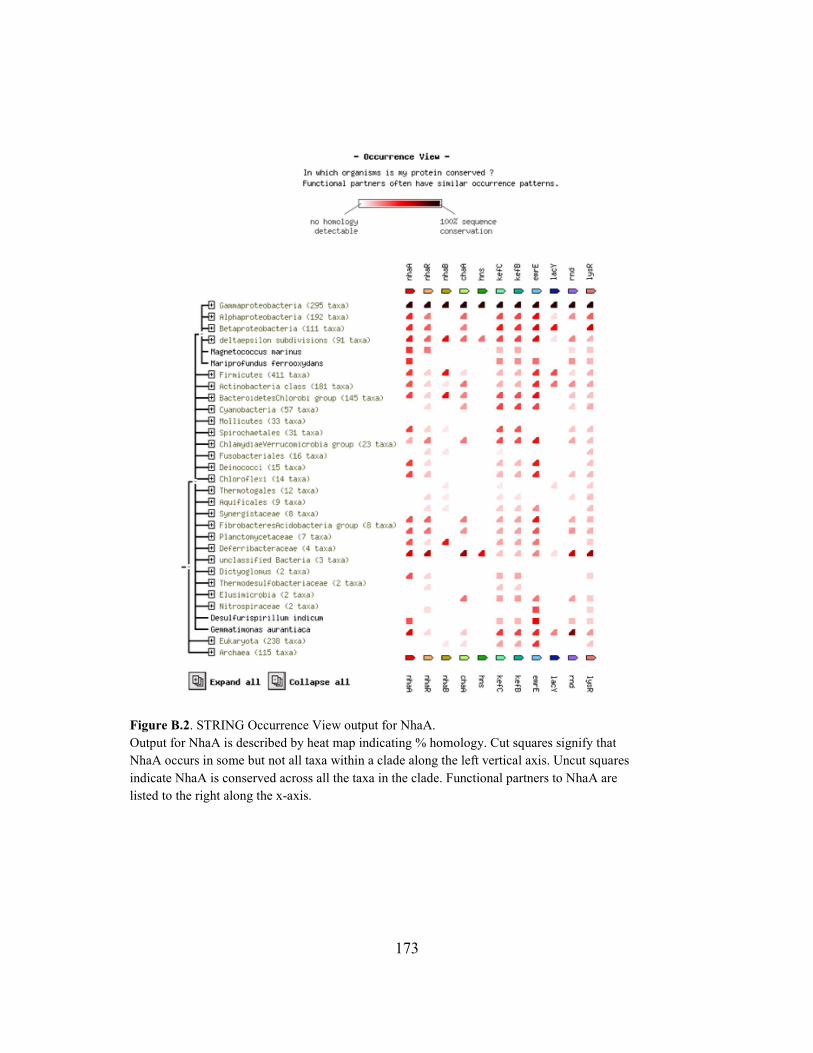
173
Figure B.2. STRING Occurrence View output for NhaA.
Output for NhaA is described by heat map indicating % homology. Cut squares signify that
NhaA occurs in some but not all taxa within a clade along the left vertical axis. Uncut squares
indicate NhaA is conserved across all the taxa in the clade. Functional partners to NhaA are
listed to the right along the x-axis.

174
Figure B.3. Weighted average number of KEGG markers per growth condition.
Contribution of total number of markers was weighted by relative abundance of its phylotype in all
samples. These weighed numbers were then binned into either the treatment or control condition to
calculate the average number of markers per condition, weighted by relative abundance of marker-
bearing phylotypes in that condition.