from hammer to flashlight - data quality campaign · from hammer to flashlight: ... to build an...
TRANSCRIPT

From Hammer to Flashlight
January 2017
A Decade of Data in Education

The Data Quality Campaign is a nonprofit policy and advocacy organization leading the effort to bring every part of the education community together to empower educators, families, and policymakers with quality information to make decisions that ensure that students excel. For more information, go to www.dataqualitycampaign.org and follow us on Facebook and Twitter (@EdDataCampaign).

From Hammer to Flashlight
A Decade of Data in Education
CONTENTS
A Letter from Aimee 1
1. Making a Difference with Data 2
2. Becoming a Data-Driven Sector 4
3. Policy Leadership Made It Happen 8
4. Challenges 11
5. Lessons and Recommendations 12
Appendix A: Information-Gathering Process to Inform Development of This Paper 16
Appendix B: Expanded History of Building an Education Data Infrastructure 17
Appendix C: Original DQC Managing and Endorsing Partners 21
Appendix D: DQC’s Policy Recommendations for States from 2005 to Today 22
Appendix E: Acknowledgments 27

From Hammer to Flashlight: A Decade of Data in Education 1
A Letter from AimeeUsing data effectively is at the core of every successful institution—whether it be corporate, nonprofit, or public. The world’s best companies have long used the wealth of information made possible through advancing technology to refine their marketing, supply chain, and management strategies. And it is not just big corporations using data for improvement. Individuals are using data in many ways, from health devices that help tailor diet and exercise routines to personal finance software that aggregates data across accounts and lines of credit. Yet public sectors have been slow to embrace the power of information to inform decisionmaking, tailor government services to meet people’s needs, and guide the allocation of scarce resources into approaches that work.
People are beginning to recognize that government must use data to improve how it serves citizens. In 2015, Congress created the Commission on Evidence-Based Policymaking to study how the federal government can support the use of data throughout government operations. As the commission, policymakers, and thought leaders at all levels focus on how to build a culture that values and uses data, the education sector provides a worthy case study. Over the past decade, every state has built a longitudinal education data system, and most are now taking steps to ensure that data is used to improve student achievement and system performance.
Indeed, the education sector has made great progress toward having a universal evidence-based culture that serves all students, and this paper chronicles the journey it took to get here. From key events to challenges to recommendations, we aim to provide insights for the field moving forward—because this work is not done. Progress notwithstanding, education has not yet fully become an evidence-based sector. In our conversations with the field, the word that most often comes up to describe the education sector’s use of data is nascent. Our hope is that this retrospective will not merely capture the past but help inform future efforts in education and other public sectors alike.
The Data Quality Campaign’s partners used to joke that our informal goal was to “make data sexy”—shorthand for getting people other than specialists to become passionate champions for the power of data to transform education into a personalized, results-focused endeavor. As it turns out, that idea is one of the critical drivers identified in this analysis. But I will not give away all the “ahas”—you will have to read the entire paper for that!
With best wishes for our collective efforts to build the culture of evidence our kids deserve,
Aimee Rogstad GuideraFounder, President, and CEO, Data Quality Campaign

Data Quality Campaign2
CHAPTER 1
Making a Difference with DataWhile the corporate world has long been using data to streamline practices and meet business goals, the majority of public sectors have lagged far behind in becoming evidence-based fields. Education is an exception. For years the public education sector has been building data systems and developing a culture of data use to better inform and reach its goals. Although much work remains before education becomes a truly evidence-based field, its incredible progress offers many lessons. This paper seeks to highlight the successes and illuminate the challenges that have accompanied this progress, both for other sectors to learn from and for the education field to examine as it continues to build the culture, capacity, and conditions to use data to improve education for all students.
All states now have robust longitudinal education data systems to provide information that is richer than ever to stakeholders across the nation. This data infrastructure has made it possible to shift education from a one-size-fits-all system built to meet the demands of yesterday’s industrial economy to a model that can provide every child a personalized learning experience that is geared toward meeting the demands of today’s knowledge economy.
This data infrastructure provides evidence to help answer critical policy and practice questions to improve education. How many high school graduates take remedial courses in college? How many ninth graders end up maintaining continuous enrollment and completing their high school requirements on time? Which teacher preparation programs produce teachers whose students have the strongest academic growth? Before we had the infrastructure capable of collecting and analyzing the relevant data, these questions and so many more went unanswered and unaddressed. States must have a clear picture of where their students are and the factors that shape their performance to truly meet the needs of all students—and having the right data is critical to fulfilling this responsibility.
As a result of this infrastructure growth, many states are now able to take the following actions:
� understand how each class of high school graduates fares in postsecondary, like Hawaii does with its high school feedback reports
� identify and support students who may be falling off track to high school graduation before it is too late, like Massachusetts does with its early warning indicator system
� analyze the effectiveness of teacher preparation programs throughout the state, like Tennessee does with its teacher preparation report card
And those are just a few examples. Thanks to the development of data infrastructure in education, leaders at all levels can better serve students, educators, and the public:
� States can support teachers to personalize learning for every child by equipping teachers with tools to meet the needs of all their students, even those who may require more specialized instruction. Georgia combined local data with state-level resources to help its teachers easily view their students’ individual progress over time in various subjects and create personalized learning activities that build on strengths and fill gaps.
� School and system leaders can ensure that resources are being allocated to support learning and the success of every child. Chicago Public Schools has successfully used data to keep high school freshmen on track by providing every high school educator a set of on-track indicators, including chronic absence, about their students. Between 2007 and 2014, the rate of students on track to graduate in Chicago rose from 57 to 84 percent, which represents 7,000 additional students on track to graduate each year. The district could not have achieved these results without key resources to identify academic pathways and effective interventions tailored to specific student needs.
� Policymakers can provide stronger accountability to assure families and taxpayers that dollars are being spent to prepare students for success beyond high school and build trust by investing in richer, easier to understand public report cards. Washington’s Education Research and Data Center is a state-legislated, state-funded effort that provides publicly available data and reports on its website to answer questions about the health of the state education system such as, “What percentage of high school graduates enrolled in postsecondary education in the year after graduation?” and “Are Washington students earning a postsecondary credential by age 26?”
The relatively new data infrastructure in education is not perfect, but states have come a long way since 2005. With the benefit of hindsight, the education sector has learned that becoming a data-driven sector means not just building data systems but also focusing on people. Leaders must engage stakeholders to understand their needs and earn their trust, prioritize using data as a critical tool in reaching education

From Hammer to Flashlight: A Decade of Data in Education 3
goals, and ensure that people have access to the data they need and know how to use it.
Data itself does not improve teaching and learning. Too often in education data is seen as a hammer—a tool of accountability to ensure that targets are being met. While accountability is important, blame and shame often follow when results fall short. Shifting this paradigm and moving beyond accountability opens the door to a vast array of opportunities to use data as a flashlight, shining a light on what is working and fueling continuous improvement. The culture of education is beginning to embrace the true potential of data—not just to comply with requirements but also to inform decisions and drive improvement. This transformation has been the result of shared, and often coordinated, policy leadership at the federal and state levels, with sustained support from philanthropic and advocacy organizations.
The data infrastructure largely exists, but more work remains to build the capacity, conditions, and culture to use data to
truly support success. Nowhere is data being used to its fullest potential to illuminate challenges and identify solutions for all students. Building data infrastructure and transforming culture are difficult undertakings, but taking these steps has never been more urgent to empower with information all those invested in student success.
Though work still remains, the education sector has become a leader in using data to drive results. Other public sectors can learn from its successes and challenges along the way. Based on insights from leaders across the education field, this paper provides a brief history and substantive analysis of the education sector’s journey of building data infrastructure and beginning to develop a culture that values evidence for improving decisionmaking, system performance, and individual student success. (See Appendix A for a description of the research process.) Recommendations are also provided on how to build an evidence-based culture in any public sector based on lessons from the education field.

Data Quality Campaign4
CHAPTER 2
Becoming a Data-Driven SectorTo understand how education has transformed into an emerging data-driven sector, one must look to the key events and actors driving the change. State and federal policymakers, advocacy leaders, and others have played critical roles, and progress has been animated by events from the publishing of A Nation at Risk in 1983 to the enactment of the Every Student Succeeds Act (ESSA) in 2015. This section provides a summary of the major historical factors driving education toward effective data use. (For a more detailed chronology, see Appendix B.)
1980–2004: States Take the Lead in EducationThe quarter century from 1980 to 2004 was transformational for the education sector, as state and federal leaders assumed new roles and responsibilities in improving student outcomes. A Nation at Risk: The Imperative for Educational Reform sounded an alarm that American schools were failing, putting the nation’s economic future at risk. The report is notable not only for its candid discussion of an “emerging national sense of frustration” about how “more and more young people emerge from high school ready neither for college nor for work” but also for its use of data to support its argument—from analyses of SAT scores over time to results from a survey of teacher preparation institutions.
For state and federal leaders, the charge was clear: ensure that America’s schools deliver a globally competitive education to its
students. States like Kentucky and Massachusetts began taking responsibility for improving student outcomes and passed laws expanding the state role in education. Southern states like Texas looked to the private sector as a model and began collecting and using data to improve student performance. Building on state momentum, the federal No Child Left Behind Act (NCLB) was enacted in 2002, requiring states to annually test students, disaggregate data by student subgroups, and publicly report the results, attaching high-stakes accountability to data. This shift refocused federal education priorities onto states to use data to track goals and spur improvements in education outcomes. These events set the stage for a period of exponential growth in the development and use of data in education.
2005–11: Policymakers, Philanthropy, and Advocacy Organizations Prioritize Data Use Across the NationFrom 2005 to 2011 state and federal policymakers came together with advocacy and philanthropic organizations to define a shared vision for effective data use. The vision rested on the premise that states were best positioned to take the lead in developing and using high-quality data systems to answer critical policy and practice questions. For example, in 2005 all 50 state governors signed the National Governors Association (NGA) Graduation Rate Compact, agreeing to implement a common formula for calculating high school graduation rates in their states. This agreement has allowed for a more accurate comparison of graduation rates across states and for a consistent calculation of a national high school graduation rate, which has been increasing each year and reached an all-time high for the class of 2014–15.
During this time period, the federal government began supporting states’ development and use of high-quality data through a number of efforts:
� Since 2005 the congressionally created Statewide Longitudinal Data Systems (SLDS) Grant Program has helped states build, improve, and use their data systems. By September 2016, 47 states, the District of Columbia, Puerto Rico, the US Virgin Islands, and American Samoa had
successfully secured more than $500 million in grants for their data efforts.
� Federal regulations in 2008 and 2011 clarifying NCLB and the Family Educational Rights and Privacy Act (FERPA) allowed states to continue to securely develop their data infrastructure to provide meaningful and useful data. One NCLB regulation built off of states’ Graduation Rate Compact work and required states to submit a longitudinal
“ That’s where data comes in. Some places are keeping electronic records of how a student does from one year to the next and how a class does in any given year. This helps students, parents, teachers, principals, and school boards know what’s working and what’s not in the classroom. You know, basketball coaches have a game tape for the team to see what they did right and what they did wrong after a tough series—teachers and principals should have a way of doing the same.”
— President Barack Obama, announcing the Race to the Top competition in 2009
From Hammer to Flashlight: A Decade of Data in Education 5
statistic for the first time ever: the four-year adjusted cohort graduation rate.
� The American Recovery and Reinvestment Act of 2009 (ARRA) established three separate funding mechanisms for states to use in their efforts to build and use their SLDS. This act included the Obama administration’s signature education program, Race to the Top, which challenged states to think differently about how they would leverage their SLDS in support of teaching and learning. The program also elevated the conversation about data systems and use beyond state education agency officials to governors and state legislatures.
To provide states support for building their data infrastructure and effectively using data, the philanthropic community (e.g.,
the Bill & Melinda Gates Foundation, the Eli and Edythe Broad Foundation, and the Michael and Susan Dell Foundation) invested in education policy and advocacy organizations, including the Data Quality Campaign (DQC), to prioritize data and support evidence-based decisionmaking at all levels (see sidebar on DQC’s role in the rise of data in education).
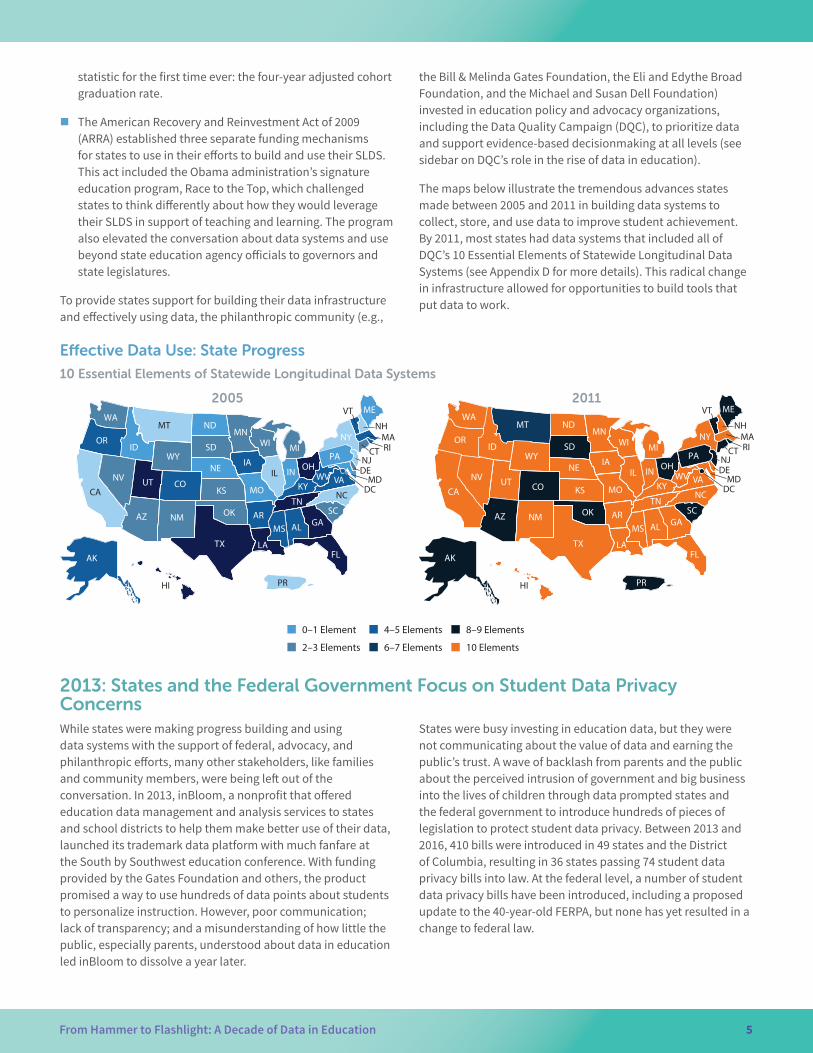
The maps below illustrate the tremendous advances states made between 2005 and 2011 in building data systems to collect, store, and use data to improve student achievement. By 2011, most states had data systems that included all of DQC’s 10 Essential Elements of Statewide Longitudinal Data Systems (see Appendix D for more details). This radical change in infrastructure allowed for opportunities to build tools that put data to work.
Effective Data Use: State Progress
10 Essential Elements of Statewide Longitudinal Data Systems
2–3 0–1 4–5 6–7 8–9 10
WA
OR
AK
NV
MT
NMAZ
UT
TX
OK
KS MO
IANE
WY
INIL
WIMN
ND
SD
OH PA
NY
VT
HI
MDDENJ
NHMARICT
LA
MSGA
FL
SC
NC TN
AR
KYWV VA
ME
MI
DC
PR
ID
AL
CACO
WA
OR
AK
NV
MT
CO
NMAZ
UT
TX
OK
KS MO
IANE
WY
IN IL
WIMN
ND
SD
OH PA
NY
VT
HI
MDDENJ
NHMARICT
LA
MSGA
FL
SC
NC TN
AR
KYWV VA
ME
MI
2–3 Elements
0–1 Element 4–5 Elements
6–7 Elements
8–9 Elements
10 Elements
DC
PR
ID
AL
CA
WA
OR
AK
NV
MT
CO
NMAZ
UT
TX
OK
KS MO
IANE
WY
IN IL
WIMN
ND
SD
OH PA
NY
VT
HI
MDDENJ
NHMARICT
LA
MSGA
FL
SC
NC TN
AR
KYWV VA
ME
MI
2–3 Elements
0–1 Element 4–5 Elements
6–7 Elements
8–9 Elements
10 Elements
DC
PR
ID
AL
CA
2013: States and the Federal Government Focus on Student Data Privacy ConcernsWhile states were making progress building and using data systems with the support of federal, advocacy, and philanthropic efforts, many other stakeholders, like families and community members, were being left out of the conversation. In 2013, inBloom, a nonprofit that offered education data management and analysis services to states and school districts to help them make better use of their data, launched its trademark data platform with much fanfare at the South by Southwest education conference. With funding provided by the Gates Foundation and others, the product promised a way to use hundreds of data points about students to personalize instruction. However, poor communication; lack of transparency; and a misunderstanding of how little the public, especially parents, understood about data in education led inBloom to dissolve a year later.
States were busy investing in education data, but they were not communicating about the value of data and earning the public’s trust. A wave of backlash from parents and the public about the perceived intrusion of government and big business into the lives of children through data prompted states and the federal government to introduce hundreds of pieces of legislation to protect student data privacy. Between 2013 and 2016, 410 bills were introduced in 49 states and the District of Columbia, resulting in 36 states passing 74 student data privacy bills into law. At the federal level, a number of student data privacy bills have been introduced, including a proposed update to the 40-year-old FERPA, but none has yet resulted in a change to federal law.
2005 2011

Data Quality Campaign6
2015: New Federal Law Shines a More Powerful Light on Data UseOne federal education effort that did pass was ESSA in 2015. ESSA represents a change in federal education policy that gives states greater flexibility—and greater responsibility—to make decisions about policies and practices to support all students’ success and close achievement gaps. ESSA maintains the commitment of its predecessor, NCLB, to using data to examine what is working for students—and what is not—to meet states’ education goals.
While powerful systems have been built and policies have been created to protect data and guide its use, the education field has not yet fully become an evidence-based sector. Infrastructure has improved, but data systems will always need maintenance to keep up with changes in technology and people’s information needs. Equally important, the field is just starting to address the conditions, capacity, and culture needed
to use the new information created by these data systems. As the education sector now launches into the even harder work of making data work for all students, the events outlined in this chapter can provide insights that may inform other sectors looking to make this transformation.
The Data Quality Campaign’s Role in the Rise of Data in Education
The Data Quality Campaign (DQC) was launched in 2005 by 14 advocacy and constituency organizations that recognized the need for a national, collaborative effort to encourage and support the use of high-quality, accessible data in education. With the support of their funders, these founding partners (see Appendix C) put aside their sometimes conflicting policy agendas to align around the priority of increasing the availability and use of data in education. To ensure that the effort was truly collaborative, DQC was not started as a separate nonprofit but rather was housed at the National Center for Educational Achievement and managed and run by the partner organizations.
Since its launch, DQC has been working to create a sectorwide culture in which high-quality data is not only collected but also used to inform action and improve student achievement. DQC has used roadmaps for state policy like the 10 Essential Elements of Statewide Longitudinal Data Systems and 10 State Actions to Ensure Effective Data Use to measure and celebrate state progress. DQC became a fully independent nonprofit organization in 2011 and has continued to work with a growing network of more than 100 partners to produce resources, messages, and forums that will nurture the nascent culture of evidence in the education sector.
The following strategies have guided DQC’s advocacy efforts over the past decade and are a potential roadmap for other sectors looking to build an evidence-based culture.
✔ Create a National Forum
Before DQC launched in 2005, there was no national voice or advocate focused on education data policy and practice. People were using data, but the culture of data use in education was underdeveloped. Few states had quality longitudinal data, much less effective or thoughtful policies and practices for using the data. States were still adjusting to the No Child Left Behind Act’s data requirements, and few state policymakers knew what longitudinal data systems were or how critical they were to informing and improving student success. Yet leading states were already seeking opportunities to build data systems and recognized the need for data infrastructure as the federal government was mandating and incentivizing improved data collection.
In this environment, DQC was launched as a national forum to highlight those emerging practices and provide a place for interested partners to convene, learn from one another, and share information with the field. DQC’s founding partners recognized the need for a full-time advocate that could lead the way by thinking about education data full time. Together these partners led efforts to build consensus and collaboration as states developed their longitudinal data systems. When concerns from the public around the privacy and security of data increased in 2013, having a national forum to gather, listen, learn, and address these legitimate issues proved invaluable to the efforts to create effective and trusted use of data to improve student achievement.
“It is not every day that the National Education Association, the American Federation of Teachers and the nation’s governors agree on such important education policy. I urge you to take advantage of this, state by state, while you can. Maybe it will help to put education on the front burner and politics on the back burner in our schools.”
—Senator Lamar Alexander (R-TN)
From Hammer to Flashlight: A Decade of Data in Education 7
✔ Create Evidence-Based Roadmaps and Tools
DQC’s 10 Essential Elements of Statewide Longitudinal Data Systems and 10 State Actions to Ensure Effective Data Use provided a common language around education data that was not technical or related to information technology (IT). The purpose of these tools was to help states use data for continuous improvement rather than compliance. State policymakers now had clear, measurable policy roadmaps that provided actions to take to build data systems and ensure conditions and capacity for data use. DQC measured and celebrated state progress on the Elements and Actions and highlighted best practices in implementation. The lessons learned were then distilled so states could build on and improve their data infrastructures as they worked to become leading states. By 2011, 36 states had all 10 Essential Elements in place. By 2014, the final year DQC surveyed states on their progress toward the 10 State Actions, three states had implemented all of them: Arkansas, Delaware, and Kentucky.
✔ Advocate For and Support Changes in Policy and Practice to Ensure That Data Effectively and Securely Follows and Serves the Individual
Changing the role of data in a sector depends not only on effective IT strategy and practice but also on policy leadership. Policymakers—especially state policymakers—have been DQC’s target audience since day one. Effective data systems and their use are essentially about meeting people’s information needs—from parents to educators to policymakers. When DQC launched, its 14 partners surveyed their members for the questions they (governors, chief state school officers, legislators, state board members)
most needed to answer; DQC released the 10 Essential Elements not as a standalone list of to-dos, but as actions that were necessary to take so that policymakers could get the answers to the very questions that most states found impossible to answer for their stakeholders. This approach has been a constant for the past 12 years: data as an end in and of itself is useless, but when used as a means to empower decisionmaking and fuel improvement, data gets results. The critical components of building an effective and user-friendly data system depend on state policy leadership:
� P–20/workforce governance systems that ensure data can follow the individual across systems, sectors, and states
� policy and practices that build transparency and privacy, security, and trust
� capacity building to ensure that those using data have the ability and training to do so
DQC has created momentum over the past decade that has spurred states to continuously use data. In the next generation of work, states will continue to develop their data infrastructures so that data can be shared more effectively across systems, sectors, and even states. Moving forward, DQC will continue to advocate that states build the capacity and culture needed to ensure that data is used in service of student learning. To do so, states must focus on people. When students, parents, educators, and policymakers have the right information to make decisions, students excel. Now that more quality information is available than ever before, DQC will emphasize individuals as the key users and beneficiaries of data by focusing more on storytelling and building public understanding of the value of using education data in service of student learning.

Data Quality Campaign8
CHAPTER 3
Policy Leadership Made It HappenThe previous chapter discussed key actors and events driving education to become an evidence-based sector. This section will take a closer look at that transformation, exploring what made it possible in a relatively short period to build a robust data infrastructure in every state and begin developing an education culture that values evidence to make decisions. How did the education sector make this tremendous progress? The short answer is that policy leaders at all levels made data a priority.
Champions across the spectrum—including federal, state, and local leaders and those working with policy leaders, such as advocates, constituencies, and philanthropies—were actively engaged in making this work a priority despite a long list of competing demands. State leaders began to harness the power of data in meeting education goals, and they increased state efforts to effectively use data to improve teaching and learning. In response, the federal government provided funding and set policy to support, promote, and incentivize state action. Advocates, with philanthropic investments, provided a national forum to communicate and share ideas, created resources and tools for policymakers, and advocated continuously for investments in data.
None of these changes happened in isolation, but policymakers took the lead by embracing a focus on improving outcomes for students—which required comprehensive, high-quality data to measure. This focus on outcomes took data beyond the information technology (IT) department and into board room conversations for the first time.
Leading policymakers began making the case that data was, in fact, integral to policy success and should not be an afterthought to policy decisions, which it had been before.
Reflecting on the strategies that policymakers used to transform education into a data-driven sector reveals three major conclusions: policies incentivize effective data use, coordinated advocacy supports change, and money matters.
Policies Incentivize Effective Data UsePolicies (legislation or agency initiatives) can focus not only on supporting data systems but also on creating the conditions necessary to support data use. At the federal level, NCLB and ESSA created the framework for data collection and moved the education sector forward by requiring data to be used for accountability. However, the Race to the Top competitive grant program marked the first time that federal policy called specifically for using data for continuous improvement (e.g., delivering student growth data to teachers) rather than for building systems and using data for accountability (e.g., measuring annual yearly progress toward academic proficiency) and reporting (e.g., high school graduation rate).
This critical innovation provided an opportunity for state policymakers to think strategically about empowering people with data, shifting the conversation from building data systems to fostering data use.
Other federal programs contributed to the growth of data infrastructure by acknowledging the importance of evidence. For example, the Reading First program put evidence-based methods of early reading instruction into classrooms. The program provided states and districts support to apply scientifically based reading research to teaching, including proven instructional and assessment tools consistent with the research.
“Longitudinal data is not just a K–12 issue; it requires gubernatorial commitment because all of our systems—from early childhood, to K–12 education, to colleges and universities, to workforce development, to employment databases—must work together to make data collection possible. And we need to do more to make the data useful because even the best data collection system is worthless if it does not change what goes on in the classroom.”
—Ed Rendell, former governor of Pennsylvania, 2009
“It is our hope that states and districts will take a serious and thoughtful approach about how they can use this data to help improve student learning.”
— Rep. George Miller (D-CA), then-chairman of the House Education and Labor Committee, on Race to the Top
From Hammer to Flashlight: A Decade of Data in Education 9
Spurred by new data capacity and a focus on continuous improvement and evidence, states began to roll out innovative uses of data driven not by IT departments but by policy priorities:
� Arkansas provided one of the first direct student benefits by using its state data system to determine student eligibility for the Arkansas Challenge Scholarship.
� Colorado garnered widespread praise with its student growth model, introducing it to the nation with a data visualization tool that helped nonstatisticians understand the value of a complex data model at a glance.
� Delaware required every school to have 90 minutes of weekly collaborative planning time so teachers could have data-informed conversations about how to best support every student.
� Prompted by state legislation, Illinois redesigned the Illinois School Report Card with new indicators, including school characteristics, curriculum, student outcomes and predictors, and school environment, as well as methods of data display (e.g., comparisons to similar schools) to meet the information needs of families and communities.
� Kentucky linked its K–12 and postsecondary data to provide better information about how students fared in postsecondary institutions.
State policymakers spurred progress by expecting data use to be embedded directly into policy and practice at every level.
Coordinated Advocacy Supports ChangeWhile policymakers worked to make data a policy priority, they could not have done it alone. Policy leaders collaborated with and benefitted from the support of philanthropy, constituency, and advocacy organizations. Critical to this effort were both broad-based constituency organizations (like the Council of Chief State School Officers, National Association of State Boards of Education, National Conference of State Legislatures, and NGA) and advocacy organizations (like the Alliance for Excellent Education, The Education Trust, and Achieve). Funding from foundations (like the Bill & Melinda Gates Foundation, the Eli and Edythe Broad Foundation, and the Michael and Susan Dell Foundation) helped these organizations set aside their often competing agendas to unite around the one issue they could all agree on—high-quality data. To kick this effort off, policymakers and thought leaders came together to create DQC (see Appendix C for a list of DQC’s original managing partners).
Coordinated advocacy efforts supported state policymakers in their efforts to incentivize effective data use by holding state policymakers accountable for progress, providing encouragement, highlighting success, identifying challenges and opportunities, and convening policymakers to learn from each other. Advocates amplified policy voices by creating a shared vision, language, and forum for discussion. State and federal policymakers relied on advocacy, constituency, and philanthropic organizations as key resources in their efforts to secure funding from all sources and to better understand how to maximize these dollars.
DQC and its partner organizations produced evidence-based roadmaps and tools, including the 10 Essential Elements of Statewide Longitudinal Data Systems and the 10 State Actions to Ensure Effective Data Use, to provide guidance and a shared vision in the broader effort toward an evidence-based sector. Critical to both the supply and demand for funding was the effort to measure state progress and highlight best practices. The sector’s ability to demonstrate success ensured sustainable funding at all levels.
Advocates framed the need for data systems and use in terms of policy benefits, allowing them to meet policymakers where they were rather than trying to engage in a technical discussion. For example, one of the thorniest issues policymakers faced was linking data across systems, specifically linking K–12 with postsecondary data. Approaching a state school chief with a strategy to support the state’s goal of increasing postsecondary enrollment is much easier than starting a conversation about unique identifiers and interoperable systems. Advocacy efforts demonstrated the value of linking K–12 and postsecondary data by providing use cases, proof points, and stories of success, and they built the political will to break down data silos between K–12 and postsecondary. This effort helped policymakers at the federal and state levels understand their individual roles and responsibilities in each of these areas, and today, almost every state has linked its K–12 and postsecondary data systems.
“ In Idaho, we now will have current, accurate data to make better informed decisions at all levels and to give classroom teachers the data they need to guide instruction every day.”
— Tom Luna, former Idaho superintendent of public instruction (elected-R)
Data Quality Campaign10
Money MattersSystem building and data use require investments to pay for people, technology, training, and maintenance. Before an evidence-based culture existed in the sector, states had difficulty securing funding for data systems and data use for purposes other than compliance reporting. The infusion of federal dollars from the SLDS Grant Program was critical to securing state policymakers’ interest, helping them move their systems from emerging tools to robust sources of information. States responded to this “seed funding” by increasing their own investments to ensure long-term sustainability. While just a handful of states were funding their systems in 2009 when the bulk of the federal grant funds were distributed, 41 states were funding their data systems by 2014.
As a part of the federal stimulus bill (ARRA), every state received money from the State Fiscal Stabilization Fund program. While no funds were allocated directly toward building data systems, states were required to commit to building an SLDS and using it to report a series of new indicators. Every state had to report on the percentage of high school graduates enrolling in an institution of higher education for the first time. More than 40 states are still reporting this indicator publicly five years after the requirement expired.

From Hammer to Flashlight: A Decade of Data in Education 11
CHAPTER 4
ChallengesBecoming a data-driven sector has not been an easy process, and the education field still has work ahead to fully reach its goal of effective data use to improve outcomes for all students. Even with the leadership, policies, funding, and advocacy in place, progress at times has been halting and beset by challenges. This section will explore those challenges, both to provide insights to other public sectors and to caution the education field against repeating past mistakes.
Data Was Used As a Hammer Instead of a FlashlightPolicy, both federal and state, can be a double-edged sword. Before there was demand for data at the local level, federal involvement was a key policy driver, start-up funder, and demand builder. However, NCLB, while a critical groundbreaker for education to become a more data-driven sector, helped perpetuate a static view of data as a tool for accountability before people like teachers and school leaders really got value from the data. Under NCLB, state data systems were initially built to satisfy federal data reporting requirements. In turn, both federal and state governments used data primarily as a hammer for school accountability. At the state level, for
example, data was used to evaluate teachers based on student performance, a requirement for states receiving federal Race to the Top funds. Without state and local leadership pushing to expand the role of education data beyond compliance, embracing the power of data as a sector seemed impossible. Teacher evaluations based on student test scores led teachers to become wary of the very assessments that could potentially help them gauge impact and pinpoint areas requiring additional focus. When their livelihoods were at stake based on data, the greatest potential champions of data were steered into a position of opposition and defense.
People’s Needs Were Not at the ForefrontWhile leaders at the state and federal levels were working to develop data systems with the support of advocacy and philanthropy organizations, many stakeholders were excluded from the conversation. Teachers were not asked what data they needed—and in what format—to differentiate instruction, increase student achievement, and reflect on their own practice. Teachers did not have access to data to help them improve teaching and learning, yet it was being used to evaluate their performance in the classroom.
Parents were also left out. States and the federal government were not transparent about their efforts to build and use data systems, including how students’ privacy was being protected
and students’ data kept safe. Families were not engaged with tangible proof points, useful tools, or compelling use cases to reinforce the value of data. Indeed, many parents still rely on a single paper report card at the end of the school year to understand their child’s progress in school. And parents in most states are not provided tools or resources that put together data over time to provide a rich history of their child’s learning, information that could help them provide better support, make better decisions, and be better advocates for their children. Because of this information vacuum, many parents have grown distrustful of data in education and concerned for their children’s privacy.
People Were Not Provided the Conditions, Capacity, and Support to Use DataWhile state and federal policies incentivized data use, the focus was initially on building systems for compliance and accountability. To truly achieve an evidence-based culture, leaders need to understand the value of data beyond compliance, and they need to have the skills to analyze and act on data when they get it. Too often school and district administrators do not know how to properly use data to drive results. Until recently, teachers, counselors, and others who
work with students did not have data tools that could help them to do their jobs. Those who could benefit the most from data use at the local levels have not been trained to understand and use data to its fullest potential to support all students. This lack of training has generated frustration and misunderstanding among educators, which in turn has led to fears of data misuse among parents and communities.

Data Quality Campaign12
CHAPTER 5
Lessons and RecommendationsEducation’s progress toward becoming a data-driven sector was not the result of any one actor or action, but instead the convergence of critical drivers. Based on what DQC has learned from the education field’s successes and challenges, the following lessons and recommendations are a guide for other public sectors as well as the education sector. Leaders from every public sector can benefit from these insights as they seek to build an evidenced-based culture to harness the power of data to inform decisionmaking, meet individuals’ needs, and provide a measurable return on taxpayer investment. The education sector can also benefit from reflecting on these lessons as it pivots from building data infrastructure to ensuring that data is meeting people’s needs.
Leadership MattersData as a goal in and of itself does not inspire anyone (except maybe self-proclaimed “data geeks”). But when leaders talk about data as a crucial element for greater transparency, empowered citizens, better decisionmaking, and improved outcomes, it becomes central to everyone’s agenda.
National leaders made data use a priority, and now the foundation has been laid for an education culture that values and uses evidence to fuel improvement. When leaders prioritize data use, people receive the support they need to spend the time, resources, and energy required to make data work for people.
Recommendations
✔ Encourage leaders to use their political capital to champion data.
✔ Support leaders with tools, evidence, roadmaps, proof points, and messaging points to make the case for the effective use of data as a primary strategy to achieve policy goals.
✔ Celebrate success stories to inspire other leaders and build a movement.
✔ Reinforce the critical role of chief information officers as part of leadership teams in agencies to ensure that data is not an end in itself but a source of information to meet people’s needs.
It Is All about the PeopleBuilders of data systems who once believed in the “Field of Dreams” approach—“If you build it, they will come”—have learned the hard way that is not true. People will not use data that they do not find valuable. Creating a rich data infrastructure must be continuously grounded in the service of individuals who need information.
Effective data systems answer people’s questions. In education it was hard, if not impossible, before data systems were developed to answer questions about the success of high school graduates, what education programs were the most effective for which students, or what indicators could alert teachers that a student was falling off track. Data kept in silos cannot meet people’s needs. State agencies and other responsible entities need to rethink their understanding of data systems as solely an IT project and instead focus on the needs of the people they are aiming to serve. Basing every data
conversation on people’s information needs also helps limit data collection to only what is required and useful to answer key questions.
Recommendations
✔ Build data systems to serve people’s information needs.
✔ Prioritize policies to create a culture that supports people using data for improvement and build the conditions and capacity to sustain that culture.
✔ Link key data across systems and sectors that serve students, including early childhood, K–12, postsecondary, workforce, and other sectors, like child welfare, to ensure that data follows individuals and can be shared to support students throughout their education journey.

From Hammer to Flashlight: A Decade of Data in Education 13
Earn TrustPeople who need the data—in education, everyone from parents and teachers to policymakers—have to understand why specific data is being collected, who has access to it, and how it is used and protected. This level of transparency and understanding is critical to building trust. Stakeholders need to be part of the development and constant review of policies around data access, use, and protection. As the education sector has learned from the implosion of inBloom, data is more likely to be useful and used if those who need it have a say in the information delivery process.
Recommendations
✔ Be transparent and communicate clearly and continually about what data is collected, why it is beneficial to individual users, and how it is protected.
✔ Ensure that everyone with a stake in the collection and use of the sector’s data is engaged in the development and constant refinement of data systems so that the infrastructure is built to meet the needs of the end user.
✔ Provide the time and space for people to use data to improve, rather than just examine data and put it on a shelf.
No One Can Do This AloneEveryone has a role in making sure data is used in the service of people. Ensuring that everyone with a stake in education saw how quality information helped them meet their goals was a critical part of creating an evidence-based sector. Policymakers, philanthropy, and advocacy groups worked together to ensure that infrastructure was built and stakeholder needs were met. State and federal government played a central role in providing financial support, enacting policies, and using policymaker leadership to incentivize the building of state data infrastructure across the country. However, without the critical actions of advocacy and membership organizations (made possible by philanthropic support), the creation of longitudinal data systems in every state likely would have taken longer and resulted in more compliance-oriented, lower quality, and less widespread systems.
Coordinated advocacy made building and using data systems a priority in policymaking, provided roadmaps, highlighted and celebrated emerging best practices and success stories, and responded to public concerns. These efforts ensured that data was an integral part of the broader education agenda of the
past decade. A leading advocacy organization (as DQC has been in the education sector) is instrumental in helping coordinate, convene, share knowledge among, and continuously expand the network of data champions.
Recommendations
✔ Build effective collaboration across government, advocates, and constituency and membership groups to ensure that everyone is pulling in the same direction to build and use data systems to meet stakeholder needs.
✔ Create and support an advocacy organization working on behalf of the field that is completely focused on building the value proposition and public understanding of the need for better data in the sector.
✔ Allocate adequate financial support to build and regularly upgrade data infrastructure and improve people’s capacity to use information to drive results. Both government and philanthropy can provide funding to build this capacity.
Governance Is CriticalDeveloping high-quality data systems and processes is not a one-time project. The work is never done, as systems need to be continually maintained and updated and be flexible enough to meet changing information needs. To make informed policy decisions across agencies (e.g., state education agencies and early childhood, higher education, and workforce agencies), cross-agency data governance is needed. Data governance is more than an IT issue. States can think broadly about data governance as a base on which to build the relationships and trust needed to securely share data across agencies to answer questions such as, “How well do state higher education institutions’ educational programs and capacity align with the state’s workforce needs?” States can use a forward-looking data governance body to lead proactive thinking about data, rather than just reacting to compliance requirements.
Recommendations
✔ Establish a sustainable, multi-tiered cross-agency data governance committee that establishes the vision and mission of the cross-sector data governance work, sets policy, and ensures that the policy and data work are carried out.
✔ Empower the cross-agency data governance committee and hold it responsible for developing and implementing processes for data access, protection, and use.
Data Quality Campaign14
Build Data LiteracyPotential users of the information produced by these enhanced data systems need the capacity and conditions to use data effectively to make decisions. Thoughtful policies and practices should be implemented to ensure that everyone expected to use data is able to do so. This includes ensuring that organizations and institutions on the ground (e.g., districts and schools in the education sector) have the flexibility and people, time, tools, money, and technology to use data to inform action and improve outcomes. Making sure that every potential user of data is “data literate” is critical to creating a culture that values evidence. Data literacy is not just a buzzword; it can be transformational to conversations, decisions, behaviors, and actions to get results.
Recommendations
✔ Provide timely data and analyses in a format that people can use to take action.
✔ Provide people the necessary training to use data continuously, effectively, and ethically.
✔ Provide a forum for people to learn from each other, transfer knowledge, and share best practices.
These lessons are useful to any sector or organization interested in using data as a tool for improvement. The education sector, for all of its progress over the past decade, has only just begun its journey to develop a culture that values and uses data. Building the infrastructure was the easy part. The more difficult part remains—truly making data work for students.
In moving from using data solely as a hammer—a tool of compliance and accountability—to using data as a flashlight—a tool to shine a light on what is working and what is not—the education sector has learned something. While the hammer can get the field moving, the flashlight is needed over the long term. Mandates from the federal government pushed the education field to start becoming an evidence-based sector, but sustaining a culture of data use that works for people will take more than federal mandates.
Efforts going forward must focus on demonstrating the value of data and helping the people closest to students effectively use data for continuous improvement. The flashlight will provide transparency about how well the education system, from policymakers to teachers, is serving students and how to improve. This transparency, in turn, will increase demand for data and push the sector closer to an evidence-based culture that better helps students succeed.
Data in education must be used to create opportunities for all students—ensuring that no child is lost on his or her education journey. And in every public sector, the focus must always be on using data to meet people’s needs. When people have the right information to make decisions, everyone succeeds.

From Hammer to Flashlight: A Decade of Data in Education 15
Continuing to Build an Evidence-Based Culture in Education
The education sector is at a unique moment with a lot of promise. The new Every Student Succeeds Act has shifted power back to states, which have made tremendous progress over the past decade in building longitudinal data systems. Today every state has the technical capacity to empower people with information. High-quality data is more available and transparent than ever before, but information is often hard to find, access, and understand. Now it is time for the education sector to pivot from a focus on building data systems to using data in service of students’ lifelong learning at all levels and across sectors, from early childhood through K–12, postsecondary, and the workforce.
The Data Quality Campaign collaborated with leaders from across the education field to develop a set of recommendations to help states enact policies that are critical to ensuring that data is used to support student learning. The following Four Policy Priorities to Make Data Work for Students build upon the lessons learned that are detailed in this paper and will help guide the education sector as it continues to become more evidence based.
1. Measure What Matters
Be clear about what students must achieve and have the data to ensure that all students are on track to succeed. Currently data has a bad reputation and often is not useful to educators and families. Data systems were built within states and within sectors, which makes it difficult to create data linkages and allow data to follow individuals as they move from school to school. This recommendation is not about collecting more data. It is about meeting people’s needs. Aligning data systems and indicators to critical policy and practice questions makes data relevant and valuable to everyone with a stake in education. Linking and governing data across all agencies critical to student success, from early childhood and K–12 to postsecondary and the workforce, ensures that systems are built to serve the individual and clarifies the roles and responsibilities of everyone involved to institutionalize the commitment to data quality and use.
2. Make Data Use Possible
Provide teachers and leaders the flexibility, training, and support they need to answer their questions and take action. Few teachers support the current uses of data because they are rarely given the tools and training to make data work for them and their students. Instead, data use is seen as a mandate from administrators and policymakers, who themselves are not supported in turning data into useful information to make decisions. The path from data to evidence is complex and requires sharing and linking data, using data to create evidence, and using evidence to inform policymaking. Data is not useful without strong analytics and research capacity. Leaders must use the bully pulpit and allocate resources to prioritize using data to inform decisionmaking at the state level.
3. Be Transparent and Earn Trust
Ensure that every community understands how its schools and students are doing, why data is valuable, and how it is protected and used. The existing culture of compliance in education has stifled data use for transparency, support, and empowerment. No one will use data if they do not trust it and find it useful. Citizens must be empowered with quality information to act in their communities and ensure that all students’ needs are met—and to hold policymakers and public agencies accountable for results. The public also deserves to know what data is collected, how it is used to support students, and how it is protected. Clear, steady communication about data will foster public understanding and trust in the state as a good steward of student information.
4. Guarantee Access and Protect Privacy
Provide teachers and parents timely information about their students and make sure it is kept safe. Currently those closest to students—especially parents—are not getting enough value from the student data that is collected. Students will not be successful unless the individuals closest to them have timely, tailored access to information that answers their questions. States must ensure that people who need access to data have it—and that those with no business seeing confidential personal information are kept away from it.
Data has the power to transform education into a personalized enterprise that meets the needs of individuals and ensures that no student is lost along the way. But for this transformation to happen, the focus needs to pivot from collecting data to prioritizing the effective use of data at all levels. The Four Policy Priorities focus on people—meeting their information
needs, providing them the conditions to use data, providing them greater transparency, and guaranteeing that they will have access to data that is also kept safe. Without these pieces in place, the power of data to support student learning and the success of every student will never be realized, and the education sector cannot become truly evidence based.

Data Quality Campaign16
APPENDIX A
Information-Gathering Process to Inform the Development of This PaperThe contents of this paper (key events, analysis of progress, and challenges and recommendations) were based on institutional knowledge and informed by feedback and ideas from hundreds of voices from both within and outside of the education sector. The Data Quality Campaign (DQC) began this reflection through its strategic planning process in 2015, during which the organization collaborated with education leaders to produce a vision for the field and Four Policy Priorities to Make Data Work for Students. Specific to this data retrospective project, DQC conducted additional outreach beginning in March 2016 and collected information in the following ways. A list of participating individuals can be found in Appendix E.
1. Working Meeting with Other Sectors: On March 15, 2016, DQC hosted a small working group meeting with leaders from sectors other than education such as health, housing, and the workforce. The meeting helped shape this project to ensure maximum value to multiple stakeholders. For example, participants were asked what they would like to know or better understand about the development of education data infrastructure.
2. Conference Session with Education Researchers: On April 7, 2016, DQC led a conference session of leading education researchers at the third meeting of the National Science Foundation Network on the Use of Administrative Data for Education Research and Practice. Participants discussed the progress made in education thus far and the remaining challenges for transforming education into a sector that truly values and uses evidence.
3. Survey of the Education Field: In June 2016, DQC conducted an anonymous survey of approximately 190 people who have been critical players in the data movement of the past decade. The survey, which had a 30 percent response rate, included both open- and closed-ended questions about the changes, challenges, and opportunities surrounding the development and use of quality data in education.
4. One-on-One Interviews: In summer 2016, DQC conducted one-on-one interviews with a select group of critical players in the data movement to delve deeper into the survey questions.
5. Data Conference Gathering: On July 13, 2016, DQC hosted a gathering following the US Department of Education’s 2016 National Center for Education Statistics’ STATS-DC Data Conference. Attendees at the conference included data managers, chief information officers, and policy and thought leaders. Those who attended the reception were given anonymous comment cards that included three of the questions from the June survey about how they would describe the current data culture and what challenges and promising outcomes they foresee.
6. DQC Original Managing Partners Dinner: On July 18, 2016, DQC hosted a dinner for former managing partners who founded DQC to reflect on the past decade of building a data infrastructure. Attendees discussed the most important drivers of that progress, what should have been done differently, and what should be done in the future to leverage the progress to date.
7. Working Meeting with Key Education Leaders: On October 3, 2016, DQC hosted a small working meeting with a select group of education leaders and partners representative of key voices in the field, most of whom had not yet been involved in the project, to hear their feedback on the initial analysis and draft of the paper and suggestions for improving its messages and dissemination.

From Hammer to Flashlight: A Decade of Data in Education 17
APPENDIX B
Expanded History of Building an Education Data Infrastructure1980 to 2004
1980s–1990s: States Take the Lead and Focus on Student Outcomes
Following the 1983 release of A Nation at Risk: The Imperative for Educational Reform and the 1989 convening of the nation’s governors for an education summit in Charlottesville, VA, states demonstrated a remarkable shift in their approach to education. Policies had traditionally been the sole purview of local officials, but governors and legislators began to set policy focusing on improving student outcomes and rejected the notion that their role should be limited to compliance and focused on inputs. For example, the Kentucky Education Reform Act of 1990 (KERA, House Bill 940) expanded the state role in education by mandating financial, curricular, and governance reforms, and the Education Reform Act of 1993 in Massachusetts created state aid for schools, established higher standards, and required more accountability from all levels of education.
Southern states were brought together by the Southern Regional Education Board (SREB) to develop policies and share best practices as they sought to increase their standing among peers to attract employers to their states. SREB was created by regional state policymakers and chaired during this pivotal time by governors who were prioritizing data use. Aided by new technologies, these states in particular homed in on an emerging practice in the private and health care sectors—the use of data to rapidly improve performance. Texas Governor George W. Bush was an early pioneer of this strategy (by 2005 Texas had 9 of the Data Quality Campaign’s [DQC] 10 Essential Elements in place), which would become a hallmark of his presidency. He prioritized the investment of dollars into collecting student-level data and linking it longitudinally to better understand if his education policies were having the desired impact on outcomes. Texas was joined by states such as Tennessee, Louisiana, Georgia, and Florida, which all led the nation by implementing 8 or more of the 10 Essential Elements. Education policymakers from around the nation, as well as those sitting in Washington, DC, took note of this impressive innovation.
2001: Congress Requires States to Use Data for Accountability
The No Child Left Behind Act of 2001 (NCLB) required states to annually test students nationwide, disaggregate data by subgroups, and publicly report the results through state report cards. With a federal framework that attached high-stakes decisions to data, states were highly motivated to ensure that they had high-quality data. However, at the time, districts used varying data definitions and different numerators/denominators in their calculations. If schools were going to be compared and judged, states could not rely solely on district-reported aggregate data. As a result, leaders turned toward student-level data collections as a solution. By the time the accountability provisions took effect a few years later, states were prepared to leverage these new collections to meet the reporting requirements of the law.
2003: The US Department of Education Looks to Data to Manage for Results
With the passage of NCLB came the need for the US Department of Education (USED) to better manage and use the data it was required to collect from states—and to move away from gathering state data using paper forms that would sit in drawers. The Performance Based Data Management Initiative (PBDMI) was a large-scale effort within USED to leverage technology and combine more than a dozen separate data collections into a single system. PBDMI established a process for states to electronically submit elementary and secondary education data from the state, district, and school levels to USED. The goal of PBDMI was to improve the use of data by USED and focus the information it requested from states by eliminating duplication, conflicting definitions, and information that was not useful for the evaluation of its programs. The initiative was also a large-scale undertaking for state education agencies, which volunteered to help develop uniform data and test the new data collection system. PBDMI evolved into EDFacts, a USED initiative to put performance data at the center of policy, management, and budget decisions for all K–12 educational programs. EDFacts centralizes aggregate K–12 performance data supplied by states with other data, such as financial grant information, within USED to enable better analysis and use in policymaking.

Data Quality Campaign18
2005 to 2008
2005: Governors Sign the National Governors Association Graduation Rate Compact In 2005, all 50 state governors signed the National Governors Association (NGA) Graduation Rate Compact, agreeing to implement a common formula for calculating high school graduation rates in their states. This agreement was significant in that it was the first time the nation’s leaders agreed on a comparable statistic across states. The key commitments of the compact included improving data capacity and reporting annual progress. At the time of signing, 34 states were collecting outcome data at the student level, but just 14 had the necessary infrastructure in place to actually calculate the rate as promised that day.
2005: Congress and USED Support States with Grant Funding
That same year, the Institute of Education Sciences, the statistics, research, and evaluation entity for USED, awarded grants to 14 states to build or improve their statewide longitudinal data system (SLDS). This congressionally created grant program encouraged states to generate and use “accurate and timely data to meet reporting requirements; support decision-making at State, district, school, and classroom levels; and facilitate research needed to eliminate achievement gaps and improve learning of all students.” The federal government did not invent state data systems, but it did support and incentivize their development by following the lead of states that had demonstrated implementation success (e.g., Florida, Texas, Tennessee) and a desire to build (e.g., the NGA Graduation Rate Compact). As of September 2016, 47 states, the District of Columbia, Puerto Rico, the US Virgin Islands, and American Samoa had successfully secured at least one grant from the SLDS Grant Program, totaling more than $500 million.
2005: Philanthropic Organizations Provide Investments to Prioritize and Coordinate Advocacy Efforts
When the SLDS Grant Program began, “data-driven decisionmaking” was still technical jargon to most educators and policymakers, and little consensus existed as to what it would look like in education. To address this issue, the philanthropic community (e.g., the Bill & Melinda Gates Foundation, the Eli and Edythe Broad Foundation, and the Michael and Susan Dell Foundation) invested in education policy and advocacy organizations (e.g., Council of Chief State School Officers, DQC, The Education Trust, and American Federation of Teachers) to prioritize data and support evidence-based decisionmaking at all levels. These investments served to expedite and fuel states’ progress as they built their data infrastructures and began the shift from compliance to service.
2005: DQC Launches to Change the Data Conversation from Hammer to Flashlight
DQC was launched in 2005 by 14 national partners (see Appendix C) that formed a coalition of advocacy and membership-based organizations to advocate for policies in support of effective data use (for more information, see page 6). Rejecting the idea that data was simply for compliance and was, therefore, an information technology (IT) project, DQC chose to focus the conversation around 28 crucial education policy questions that state policymakers could not answer because they had not built the systems to answer them. To that end, DQC identified the 10 Essential Elements of Statewide Longitudinal Data Systems (for more information, see Appendix D), highlighted promising practices in implementation, convened partners and states to support advocacy efforts, and measured (and celebrated) state progress. The importance of these organizations coming together around a shared vision cannot be overstated. These partners often represented conflicting policy agendas, but all believed that their constituencies and networks needed better information regardless of policy positions.
2006: The National Center for Analysis of Longitudinal Data in Education Research Puts Longitudinal Data to Work
The National Center for Analysis of Longitudinal Data in Education Research (CALDER) is one of the National Research and Development Centers funded by the federal government and private foundations. CALDER is a joint effort of American Institutes for Research and scholars at Duke University, Stanford University, the University of Florida, the University of Missouri, the University of Texas at Dallas, the University of Virginia, and the University of Washington. In partnership with states, CALDER uses individual-level longitudinal student and teacher data to examine the effects of real policies and practices on the learning gains of students in a district or state over a number of years. CALDER pays particular attention to how outcomes differ for different subgroups of students. CALDER was among the first organizations to use longitudinal data sets to conduct research and demonstrate the value of data systems in education.
2008: USED Regulations Clarify the Value of SLDS
US Secretary of Education Margaret Spellings announced regulations in 2008 focused on strengthening and clarifying certain provisions of NCLB. One regulation required states to submit a longitudinal statistic for the first time ever—the four-year adjusted cohort graduation rate. That same year, based on requests for clarification by the states, USED also issued

From Hammer to Flashlight: A Decade of Data in Education 19
regulations on the Family Educational Rights and Privacy Act (FERPA). Among other things, the regulations specifically clarified that states could share data on behalf of school districts without violating the prohibition against redisclosure.
With this clarification and a more powerful statistic in their toolbox, states were poised to deliver real value (e.g., tools, research, and analytics) to schools on the data they were already collecting.
2009 to 2012
2009: DQC Changes the Conversation from Systems to Policies with a New Set of Recommendations
DQC released the 10 State Actions to Ensure Effective Data Use to provide a set of clear, measurable steps for state policymakers to take as they began to use their new longitudinal data systems. DQC’s 2009 report, The Next Step: Using Longitudinal Data Systems to Improve Student Success, outlined three bold imperatives that states must embrace if they were going to successfully move from data for compliance to data for action. Specifically, states were encouraged to prioritize linking their K–12 systems to early education, postsecondary education, and the workforce, along with other state social service systems, to create richer pictures of student pathways and success, provide access to appropriate individuals and the public, and build the capacity of those using data to use it well.
2009: The American Recovery and Reinvestment Act Provides Unprecedented Funding to Build and Use SLDS
The American Recovery and Reinvestment Act of 2009 (ARRA) established three separate funding mechanisms for states to use in their efforts to build and use their SLDS. In addition to the incredible funding opportunity, ARRA’s emphasis on data systems and use brought to the conversation many new stakeholders and audiences who had, to date, largely been absent.
� State Fiscal Stabilization Fund: USED awarded $48.6 billion to states that committed to specific education reforms, including the implementation of SLDS. While none of the funding was to be used to build data systems, the mere inclusion of the requirement was a strong signal of the importance of data use as a strategy for improving student outcomes.
� SLDS Grant Program: Twenty states (Arkansas, Colorado, Florida, Illinois, Kansas, Maine, Massachusetts, Michigan, Minnesota, Mississippi, New York, Ohio, Oregon, Pennsylvania, South Carolina, Texas, Utah, Virginia, Washington, and Wisconsin) won grants totaling $250 million and ranging from $5.1 million to $19.7 million each to build their SLDS with the 12 Required Elements of a P–16 Education Data System listed in the America COMPETES Act (ACA). (The 12 ACA elements align closely with DQC’s 10 Essential Elements. For more information about DQC’s 10
Essential Elements, see Appendix D.) This round of grants marked the first time the program required these elements to secure funding and brought the total number of states with SLDS grants to 41. (Forty-one states and the District of Columbia had received at least one SLDS grant since 2005.)
� Race to the Top: The administration launched an ambitious competitive grant program to incentivize states to tackle complex education challenges that rarely find their way to the top of state priorities. Part of this new program asked states to think differently about how they would leverage their SLDS in support of teaching and learning. The program also served to elevate the conversation about data systems and use to governors and state legislatures; these systems were no longer simply the purview of state education agency officials. After three rounds, grants ranging from $17 million to $700 million had been awarded to 18 states and the District of Columbia in support of effective data use.
ARRA’s provisions helped reinforce that data systems and use are critical for states and are far from just an IT project.
2009: The Call for Common Education Data Standards Spreads
As state education agencies continued building SLDS, states, national organizations, and federal offices began to call for common education data standards to help states improve data quality. Supported by the National Center for Education Statistics, the Common Education Data Standards (CEDS) project is a national collaborative effort to develop voluntary, common data standards for a key set of education data elements to streamline the exchange, comparison, and understanding of data within and across early learning, K–12, postsecondary, and workforce (P–20W) institutions and sectors. Versions 1 through 5 of the standards were developed by a combination of a CEDS stakeholder group (including representatives from across the P–20W field) and open meetings and conversations. Starting with Version 6, CEDS is developed and maintained by an open community that allows anyone to participate. According to DQC’s Data for Action 2014 state survey, only six states reported not implementing CEDS. Other states are at different levels of implementation, from making a formal decision to adopt CEDS to operationally sharing data using CEDS.
Data Quality Campaign20
2013 to 2016The incredible progress of the prior decade brought increasing numbers of new stakeholders to the conversation, including those voicing concerns that transparency had been lost in the name of progress.
The general public was largely absent from a data conversation that had been mostly taking place in state capitols. This situation changed overnight in winter 2013 when inBloom launched, touting its ability to aggregate and make available vast amounts of student data to inform tools and dashboards for educators. The arrival of inBloom exposed the lack of attention policy leaders, advocates, and educators had paid to ensuring that the public, and parents in particular, understood the value of data and the means by which it was collected, used, and kept private. The absence of basic facts about data collection, use, and protection from the webpages of prominent champions of education data use—and states and districts themselves—was a glaring oversight that gave rise to myths and fed into the rising concerns that privacy had been an afterthought in the desire to use data. After more than a year of negative publicity and successful moves by grassroots activists to force school districts and states to abandon using inBloom, the company closed its doors in June 2014 due to a lack of customers, but its effect on the education landscape was just beginning to be understood.
The growing chorus of opposition to data use practices was heard in state legislatures, and in 2014, 36 states introduced 110 bills resulting in 27 new laws addressing student data privacy; the prior year saw just one state action in this area. Legislators primarily focused on limiting the scope of district and state data collection and use in 2014. However, in 2015 privacy concerns evolved to include third-party data sharing, particularly with online service providers (47 states introduced 188 bills resulting in 28 new laws addressing student data privacy). By the 2016 legislative session the number of new laws passed decreased (112 bills resulted in 19 new laws in 15 states) as states began to implement the privacy protections passed in recent years and began to grapple with implementing the new federal K–12 education law, the Every Student Succeeds Act (ESSA). At the conclusion of three years of legislating, the legal landscape around student data privacy had significantly changed with all states but Vermont introducing at least one bill and 36 states putting new laws in place.
Frustrated by an outdated 40-year-old federal privacy law (FERPA), members of Congress responded to student privacy concerns by holding hearings and introducing several new bills in 2015. The most significant attempts to legislate were bipartisan and far reaching in scope. Senators Edward Markey (D-MA) and Orrin Hatch (R-UT) were first (in 2014) with a bill to amend FERPA, followed quickly by Representatives Luke Messer (R-IN) and Jared Polis (D-CO) introducing the Student Digital Privacy and Parental Rights Act (SDPPRA). While the fate of SDPPRA is unknown (as of this publication date), the bill was supported by a broad coalition of organizations. In public statements, supporters applauded legislative provisions that would protect student privacy while ensuring that educators and families could still use data and education technology to improve outcomes. On the importance of this balance, Representative Polis stated: “Our bipartisan bill is a much-needed first step in providing a framework that can address these concerns of parents and educators while at the same time allowing for the promise of education technology to transform our schools.” At the same time, Senators Richard Blumenthal (D-CT) and Steve Daines (R-MT) introduced the SAFE KIDS Act with similar provisions to the bill introduced by Representatives Polis and Messer, and Representatives Marcia Fudge (D-OH) and Todd Rokita (R-IN) introduced an amendment to FERPA to essentially rewrite the law to reflect the data realities of the 21st century. To date, none of these attempts have resulted in changes to federal law. There were some attempts to include privacy provisions in ESSA; however, all but one (the inclusion of privacy training as an allowable use of Title II funding) failed in conference.
2015: Congress Reauthorizes NCLB and Shines a More Powerful Light on Data Use
ESSA preserves what was widely reported as the biggest success of its predecessor, NCLB—the collection and public reporting of disaggregated student performance data. In fact, Congress went further by adding new levels of disaggregation (e.g., foster and military youth), new types of information to be collected and reported (e.g., chronic absence and school funding), and new indicators of success including postsecondary enrollment statistics. ESSA’s ultimate impact on data use is unclear; however, the new law makes a strong statement that data use is here to stay in education.

From Hammer to Flashlight: A Decade of Data in Education 21
APPENDIX C
Original DQC Managing and Endorsing PartnersThe Data Quality Campaign (DQC) was launched in 2005 by 14 advocacy and constituency organizations that recognized the need for a national, collaborative effort to encourage and support the use of high-quality, accessible data in education. With the support of their funders, these founding partners put aside their sometimes conflicting policy agendas to align
around the priority of increasing the availability and use of data in education. To ensure that the effort was truly collaborative, DQC was not started as a separate nonprofit but rather was housed at the National Center for Educational Achievement and managed and run by the partner organizations, all of which are listed below.
Managing Partners
� Achieve
� Alliance for Excellent Education
� Council of Chief State School Officers
� Education Commission of the States
� The Education Trust
� National Association of State Boards of Education
� National Association of System Heads
� National Center for Educational Achievement
� National Center for Higher Education Management Systems
� National Conference of State Legislatures
� National Governors Association Center for Best Practices
� Schools Interoperability Framework Association
� State Educational Technology Directors Association
� State Higher Education Executive Officers

Data Quality Campaign22
APPENDIX D
DQC’s Policy Recommendations for States from 2005 to Today28 Policy QuestionsCentral to the 2005 launch of the Data Quality Campaign (DQC) was highlighting a list of 28 policy questions that could not be answered without a statewide longitudinal data system (SLDS) consisting of 10 Essential Elements (see page 24 for the 10 Essential Elements). These questions framed the need for SLDS by showing state policymakers that they were not able to
answer the priority questions that they had identified as being most important to meeting their education goals. Investing in high-quality longitudinal data helps policymakers, educators, researchers, community leaders, and others have the data to answer critical questions, inform pressing policy discussions, and make practical decisions to support student success.
TOPIC QUESTIONS
Predicting Success in Later Grade Levels
1. What is the impact of preschool on later academic achievement (e.g., third-grade test results)?
2. Do the effects of our early interventions “fade out” later?
3. Are students academically prepared for high school?
4. Which elementary and middle schools in the state are consistently highest performing in preparing different student populations for high school?
5. Which elementary and middle schools produce the strongest academic growth among initially poorly prepared students and among initially well-prepared students?
Academic Growth 6. How many students are achieving at least one year’s academic growth every year?
7. How many of the students who started out below grade level are achieving more than a year’s growth?
Achievement Levels in Early Grades As Indicators of Later Success
8. What achievement levels in grades three though seven indicate that a student is “on track” for later success?
Impact of Grade-Level Retention
9. What effect does early grade retention have on the later academic success of students who were retained in the early grades?
Course Rigor 10. What eighth-grade achievement levels indicate that a student is well prepared to succeed in challenging courses in high school?
11. Have students taken the coursework to prepare them for college and work—both in years of study and rigor of content?
12. What evidence exists that students who take and pass the courses have learned the course content?
Sustaining Enrollment in Early Grades
13. What students are being lost in transition between middle and high school?
14. What proportion of the students who enter elementary school maintain continuous enrollment and complete eighth grade in a timely manner?
Consistently High-Performing Schools
15. Which elementary and middle schools in the state are consistently highest performing in preparing different student populations for high school?
College Preparation 16. Are students academically prepared to graduate from high school and enter college?
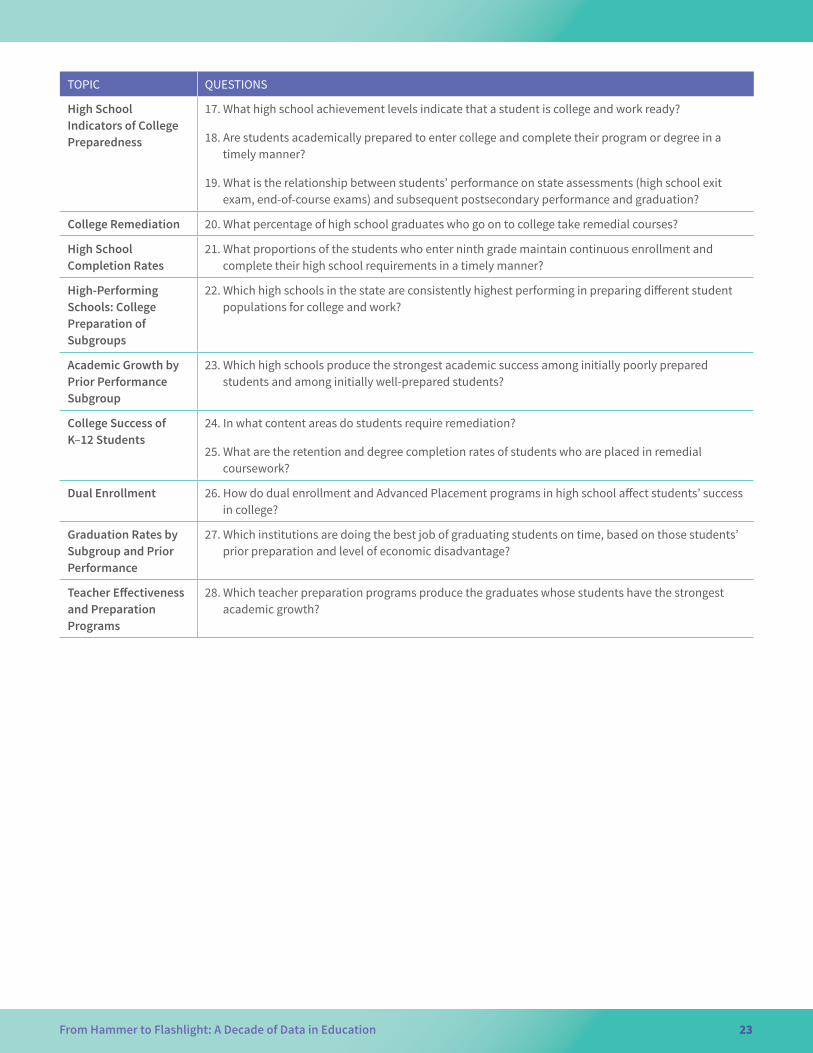
From Hammer to Flashlight: A Decade of Data in Education 23
TOPIC QUESTIONS
High School Indicators of College Preparedness
17. What high school achievement levels indicate that a student is college and work ready?
18. Are students academically prepared to enter college and complete their program or degree in a timely manner?
19. What is the relationship between students’ performance on state assessments (high school exit exam, end-of-course exams) and subsequent postsecondary performance and graduation?
College Remediation 20. What percentage of high school graduates who go on to college take remedial courses?
High School Completion Rates
21. What proportions of the students who enter ninth grade maintain continuous enrollment and complete their high school requirements in a timely manner?
High-Performing Schools: College Preparation of Subgroups
22. Which high schools in the state are consistently highest performing in preparing different student populations for college and work?
Academic Growth by Prior Performance Subgroup
23. Which high schools produce the strongest academic success among initially poorly prepared students and among initially well-prepared students?
College Success of K–12 Students
24. In what content areas do students require remediation?
25. What are the retention and degree completion rates of students who are placed in remedial coursework?
Dual Enrollment 26. How do dual enrollment and Advanced Placement programs in high school affect students’ success in college?
Graduation Rates by Subgroup and Prior Performance
27. Which institutions are doing the best job of graduating students on time, based on those students’ prior preparation and level of economic disadvantage?
Teacher Effectiveness and Preparation Programs
28. Which teacher preparation programs produce the graduates whose students have the strongest academic growth?

Data Quality Campaign24
10 Essential Elements of Statewide Longitudinal Data SystemsIn 2005 DQC identified the 10 Essential Elements of Statewide Longitudinal Data Systems. The 10 Essential Elements, listed below, provided a roadmap for states as they built statewide longitudinal data systems to collect, store, and use longitudinal data to improve student achievement.
1. A unique student identifier. A single, unduplicated number assigned to an individual student that remains with that student from kindergarten through high school and connects student data across key databases across years.
2. Student-level enrollment, demographic, and program participation information including information such as attendance, special education status, gifted and talented education status, career and technical education participation, and free or reduced-price lunch status.
3. The ability to match individual students’ test records from year to year to measure academic growth and the
ability to disaggregate the results by individual test item and objective.
4. Information on untested students and the reasons why they were not tested.
5. A teacher identifier system with the ability to match teachers to students by classroom and subject.
6. Student-level transcript data, including information on courses completed and grades earned from middle and high school.
7. Student-level college readiness test scores such as scores on SAT, SAT II, ACT, Advanced Placement, and International Baccalaureate exams.
8. Student-level graduation and dropout data.
9. The ability to match student records between the P–12 and postsecondary systems.
10. A state data audit system assessing data quality, validity, and reliability.
To read the report creating the 10 Essential Elements of Statewide Longitudinal Data Systems, visit http://dataqualitycampaign.org/resource/creating-a-longitudinal-data-system/.
2–3 0–1 4–5 6–7 8–9 10
WA
OR
AK
NV
MT
NMAZ
UT
TX
OK
KS MO
IANE
WY
INIL
WIMN
ND
SD
OH PA
NY
VT
HI
MDDENJ
NHMARICT
LA
MSGA
FL
SC
NC TN
AR
KYWV VA
ME
MI
DC
PR
ID
AL
CACO
WA
OR
AK
NV
MT
CO
NMAZ
UT
TX
OK
KS MO
IANE
WY
IN IL
WIMN
ND
SD
OH PA
NY
VT
HI
MDDENJ
NHMARICT
LA
MSGA
FL
SC
NC TN
AR
KYWV VA
ME
MI
2–3 Elements
0–1 Element 4–5 Elements
6–7 Elements
8–9 Elements
10 Elements
DC
PR
ID
AL
CA
WA
OR
AK
NV
MT
CO
NMAZ
UT
TX
OK
KS MO
IANE
WY
IN IL
WIMN
ND
SD
OH PA
NY
VT
HI
MDDENJ
NHMARICT
LA
MSGA
FL
SC
NC TN
AR
KYWV VA
ME
MI
2–3 Elements
0–1 Element 4–5 Elements
6–7 Elements
8–9 Elements
10 Elements
DC
PR
ID
AL
CA
2005 2011

From Hammer to Flashlight: A Decade of Data in Education 25
10 State Actions to Ensure Effective Data UseIn 2009 DQC released its 10 State Actions to Ensure Effective Data Use. The 10 Actions called for states to move from only collecting data for compliance and accountability purposes to using data to answer critical policy questions, inform continuous improvement, and ultimately support students on their paths to success.
1. Link state K–12 data systems with early learning, postsecondary, workforce, and other critical state agency data systems.
2. Create stable, sustained support for longitudinal data systems.
3. Develop governance structures to guide data collection and use.
4. Build state data repositories.
5. Provide timely, role-based access to data.
6. Create progress reports with student-level data for educators, students, and parents.
7. Create reports with longitudinal statistics to guide system-level change.
8. Develop a purposeful research agenda.
9. Implement policies and promote practices to build educators’ capacity to use data.
10. Promote strategies to raise awareness of available data.
Note: The maps do not show results from 2009, the first year DQC surveyed states on the 10 Actions, because the criteria for one Action were changed for the 2011 survey. Therefore, results from 2009 and 2014 cannot be compared.
To read the report creating the 10 State Actions to Ensure Effective Data Use, visit http://dataqualitycampaign.org/resource/next-step-using-longitudinal-data-systems-improve-student-success/.
WA
OR
AK
NV
MT
CO
NMAZ
UT
TX
OK
KS MO
IANE
WY
IN IL
WIMN
ND
SD
OH PA
NY
VT
HI
MDDENJ
NHMARICT
LA
MSGA
FL
SC
NC TN
AR
KYWV VA
ME
MI
DC
ID
AL
CA
1–3 Actions
0 Actions 4–5 Actions
6–7 Actions
8–9 Actions
10 Actions
WA
OR
AK
MT
CO
NM
UT
TX
OK
KS MO
IANEWY
IN IL
WIMN
ND
SD
OH PA
NY
VT
HI
MDDENJ
NHMARICT
LA
MSGA
FL
SC
NC TN
AR
KYWV VA
ME
MI
1–3 Actions
0 Actions 4–5 Actions
6–7 Actions
8–9 Actions
10 Actions
DC
ID
AL
CA
Did not participate
NV
AZ
WA
OR
AK
NV
MT
CO
NMAZ
UT
TX
OK
KS MO
IANE
WY
IN IL
WIMN
ND
SD
OH PA
NY
VT
HI
MDDENJ
NHMARICT
LA
MSGA
FL
SC
NC TN
AR
KYWV VA
ME
MI
DC
ID
AL
CA
1–3 Actions
0 Actions 4–5 Actions
6–7 Actions
8–9 Actions
10 Actions
2011 2014
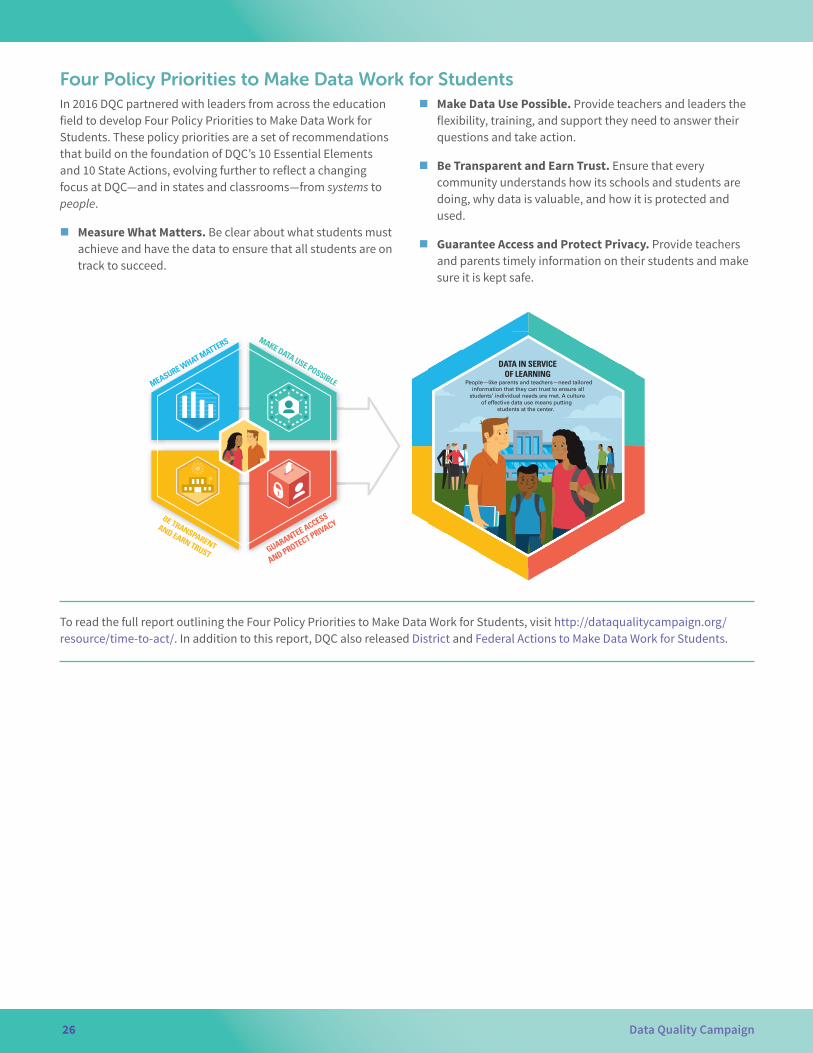
Data Quality Campaign26
Four Policy Priorities to Make Data Work for Students In 2016 DQC partnered with leaders from across the education field to develop Four Policy Priorities to Make Data Work for Students. These policy priorities are a set of recommendations that build on the foundation of DQC’s 10 Essential Elements and 10 State Actions, evolving further to reflect a changing focus at DQC—and in states and classrooms—from systems to people.
� Measure What Matters. Be clear about what students must achieve and have the data to ensure that all students are on track to succeed.
� Make Data Use Possible. Provide teachers and leaders the flexibility, training, and support they need to answer their questions and take action.
� Be Transparent and Earn Trust. Ensure that every community understands how its schools and students are doing, why data is valuable, and how it is protected and used.
� Guarantee Access and Protect Privacy. Provide teachers and parents timely information on their students and make sure it is kept safe.
To read the full report outlining the Four Policy Priorities to Make Data Work for Students, visit http://dataqualitycampaign.org/resource/time-to-act/. In addition to this report, DQC also released District and Federal Actions to Make Data Work for Students.
SCHOOL
People—like parents and teachers—need tailored information that they can trust to ensure all
students’ individual needs are met. A culture of effective data use means putting
students at the center.
DATA IN SERVICEOF LEARNING
MEASURE WHAT MATTERS MAKE DATA USE POSSIBLE
BE TRANSPARENT
AND EARN TRUST GUARANTEE ACCESS
AND PROTECT PRIVACY
MEASURE WHAT MATTERS MAKE DATA USE POSSIBLE
BE TRANSPARENT
AND EARN TRUST GUARANTEE ACCESS
AND PROTECT PRIVACY
From Hammer to Flashlight: A Decade of Data in Education 27
APPENDIX E
AcknowledgmentsThe Data Quality Campaign (DQC) thanks the Laura & John Arnold Foundation for funding and supporting this project.
DQC also thanks the following people and organizations that provided expert advice and guidance during the research process and writing of this paper. See Appendix A for more details on these information-gathering sessions.
Working Meeting with Other Sectors March 15, 2016, Washington, DC
� Amanda Cash, US Department of Health and Human Services
� Emmalie Dropkin, National Head Start Association
� Robin Ghertner, US Department of Health and Human Services
� Cynthia A. Guy, PhD, Annie E. Casey Foundation
� Natalie Evans Harris, Office of Science and Technology Policy
� Brian Harris-Kojetin, National Academies of Sciences, Engineering, and Medicine
� Carter Hewgley, Johns Hopkins University
� Matthew Hill, University of Pennsylvania
� Sallie Keller, Biocomplexity Institute of Virginia Tech
� Therese Leung, MDRC
� Shelley Metzenbaum, Volcker Alliance
� Paul Perez, IBM
� Erika Poethig, The Urban Institute
� Rachel Rosen, MDRC
� George Schoeffel, National Academies of Sciences, Engineering, and Medicine
� Robert Shea, Grant Thornton LLP
� Stephanie Shipp, Biocomplexity Institute of Virginia Tech
� Jack Smalligan, Office of Management and Budget
� Lauren Supplee, Administration for Children and Families
� Jennifer Thornton, The Pew Charitable Trusts
� Anna White, National Head Start Association
� Rachel Zinn, Workforce Data Quality Campaign
Conference Session with Education Researchers April 7, 2016, National Science Foundation Network on the Use of Administrative Data for Education Research and Practice, Washington, DC
� Organizers: Kenneth Dodge, Duke University, and David Figlio, Institute for Policy Research, Northwestern University
� Atila Abdulkadiroglu, Duke University
� Emma Adam, Northwestern University
� Elaine Allensworth, University of Chicago
� Peter Arcidiacono, Duke University
� Tony Bennett, Strategos
� Thomas Brock, US Department of Education
� Carycruz Bueno, Georgia State University
� Jennifer Carinci, Johns Hopkins University
� Chelsea Clinton, Oregon Department of Education
� Carrie Conaway, Massachusetts Department of Elementary and Secondary Education
� Thurston Domina, The University of North Carolina at Chapel Hill
� Greg Duncan, University of California, Irvine
� Susan Dynarski, University of Michigan
� KC Elander, North Carolina Department of Public Instruction
� Emerson Elliott, Council for the Accreditation of Educator Preparation
Data Quality Campaign28
� Sebastian Gallegos, University of Chicago
� Neal Gibson, Arkansas Research Center
� Christina Gibson-Davis, Duke University
� Dan Goldhaber, American Institutes for Research
� Edith Gummer, Ewing Marion Kauffman Foundation
� Jonathan Guryan, Northwestern University
� Jane Hannaway, National Center for Analysis of Longitudinal Data in Education Research, American Institutes for Research
� Rick Hanushek, Stanford University
� Tracy Hunt-White, US Department of Education
� Clement Jackson, Northwestern University
� Ariel Kalil, University of Chicago
� Venessa Keesler, Michigan Department of Education
� Helen Ladd, Duke University
� Joy Lesnick, US Department of Education
� Susanna Loeb, Stanford University
� Hugh Macartney, Duke University
� Joseph Martineau, National Center for the Improvement of Educational Assessment
� Joel McFarland, US Department of Education
� Clara Muschkin, Duke University
� Chelsea Owens, US Department of Education
� Andrew Penner, University of California, Irvine
� Emily Penner, Stanford University
� Karl Pond, North Carolina Department of Public Instruction
� Sam Rauschenberg, Georgia Governor’s Office of Student Achievement
� Margaret Raymond, Center for Research on Education Outcomes at Stanford University
� Allen Ruby, US Department of Education
� Janelle Sands, US Department of Education
� Ross Santy, US Department of Education
� Tim Sass, Georgia State University
� Diane Schanzenbach, Northwestern University
� Elizabeth Setren, Massachusetts Institute of Technology
� Nancy Sharkey, US Department of Education
� John Singleton, Duke University
� Tony Smith, Illinois Superintendent of Education
� Lucy Sorenson, Duke University
� Kathy Stack, Laura & John Arnold Foundation
� Russ Whitehurst, Brookings Institution
� Governor Bob Wise, Alliance for Excellent Education
DQC Original Managing Partners Dinner July 18, 2016, Washington, DC
� Matt Gandal, Education Strategy Group
� Daria Hall, The Education Trust
� Richard Laine, formerly National Governors Association
� Scott Palmer, Education Counsel
� Ryan Reyna, Education Strategy Group
� Stefanie Sanford, College Board
� Ross Santy, US Department of Education
� Amy Starzynski, Foresight Law & Policy
� David Wakelyn, Union Square Learning
� Maureen Wentworth, Council of Chief State School Officers

From Hammer to Flashlight: A Decade of Data in Education 29
Working Meeting with Key Education Leaders October 3, 2016, Washington, DC
� John Bailey, consultant, formerly Foundation for Excellence in Education
� Jennifer Engle, Bill & Melinda Gates Foundation
� Kathy Gosa, SLDS State Support Team, National Center for Education Statistics
� Jane Hannaway, National Center for Analysis of Longitudinal Data in Education Research, American Institutes for Research
� Bethany Little, Education Counsel
� Michael J. Petrilli, Thomas B. Fordham Institute
� Kathy Stack, Laura & John Arnold Foundation
� Bob Swiggum, Georgia Department of Education
� Bill Tucker, Bill & Melinda Gates Foundation
� Jeffrey Wayman, Wayman Services, LLC
� Martin West, Harvard Graduate School of Education, Education Policy and Governance
� Rachel Zinn, Workforce Data Quality Campaign
DQC also thanks the many individuals from states and organizations willing to take the time to complete the survey, participate in a one-on-one interview, or attend the data conference gathering.
DQC thanks our funders; in particular we thank the Laura & John Arnold Foundation for their support in the yearlong effort to develop this report. Our work is made possible by philanthropic grants and contributions from the Annie E. Casey Foundation, Bill & Melinda Gates Foundation, Carnegie Corporation of New York, Charles Stewart Mott Foundation, Ewing Marion Kauffman Foundation, ExxonMobil, Laura & John Arnold Foundation, Michael and Susan Dell Foundation, and the Walton Family Foundation.

www.dataqualitycampaign.org