from heterogeneous to homogeneous nucleation for...
TRANSCRIPT
1
FROM HETEROGENEOUS TO HOMOGENEOUS NUCLEATION FOR PRECIPITATION IN AUSTENITE OF MICROALLOYED STEELS S.F. Medina National Centre for Metallurgical Research (CENIM-CSIC) Av. Gregorio del Amo 8; 28040-Madrid, Spain [email protected] Tf. 34-91-5538900
Abstract
This paper studies the influence of strain on precipitate nucleation in austenite for three
microalloyed steels with different microalloying element (Nb, V) contents. Precipitation
start-time-temperature (PSTT) diagrams have been determined by means of hot torsion
tests and nucleation periods have been measured at strains of 0.20 and 0.35,
respectively. The increase in the dislocation density caused by the strain has been
calculated for both strains, and the driving forces for precipitation have also been
calculated. The results show that the influence of the strain on the nucleation time (t0.05)
is dependent not only on the strain magnitude but also on the driving force for
precipitation. When the driving force is high, or low in absolute terms, the influence of
the strain, i.e. the increase in the dislocation density, gives rise to a notable reduction in
the t0.05 value due to heterogeneous nucleation on the dislocation nodes. In contrast,
when the driving force is low, or high in absolute terms, the influence of the strain on
t0.05 decreases considerably and the nucleation of precipitates becomes preponderantly
homogeneous. Therefore, the driving force value is responsible for the transition from
heterogeneous nucleation to homogenous nucleation.
Keywords: Microalloyed steels; Precipitation; Heterogeneous/homogeneous nucleation; driving forces.
2
1. Introduction
The most widely used method to achieve grain refinement by the thermomechanical
controlled processing (TMCP) of steels is to maximize the number density of nucleation
sites in unrecrystallised austenite in order to produce a fine ferrite grain size after phase
transformation [1]. It is well known that the static recrystallisation of austenite in
microalloyed steels is different before and after strain-induced precipitation. Before, all
the elements are in solution and recrystallisation kinetics occur in the same way as in
low alloy steels, whereby the various alloying elements contribute to delaying
recrystallisation to a greater or lesser degree [2-4]. As the temperature drops, a critical
temperature is reached, after which static recrystallisation is momentarily inhibited by
the effect of strain-induced precipitates. This momentary inhibition of recrystallisation
appears as a plateau on the recrystallised fraction versus time curves [5]. When the end
of the plateau is reached, recrystallisation recommences as the coarsening of precipitates
consequently reduces the pinning forces against driving forces. After the plateau, the
superiority of driving forces for recrystallisation over pinning forces is about two orders
of magnitude [6]. In Nb-microalloyed steels the Nb atoms/NbCN precipitates retard the
recrystallisation of deformed austenite [7-10]. However, V-microalloyed steels also
exhibit grain refinement through intragranular nucleation of ferrite on VN precipitates
partly due to low lattice mismatch of VN with ferrite [11,12]. The addition of N in V
microalloyed steel stimulates the precipitation of VN particles and increases their
volume fraction [13-16].
According to Dutta and Sellars [17] the density of preferential nucleation sites for
precipitation in deformed austenite is expected to be sensitive to the density and
arrangement of dislocations, and therefore to the conditions of the prior deformation
expressed in terms of the strain, strain rate and absolute temperature of deformation. In
3
addition to the dislocations, grain boundaries are sites known as classic sources of the
heterogeneous nucleation of precipitation [18]. The lattice parameter of the precipitate is
20-25% greater than that of the matrix, and a flux of vacancies to the precipitated
particles is required in order to accommodate the internal stresses arising from the
growth of these particles. Such vacancy fluxes are provided by hot deformation
processes, and the dislocation density is also increased, thereby providing an increased
number of nucleation sites [19]. Bhadeshia and Honeycombe have also pointed out that
grain boundaries and dislocations are highly preferred nucleation sites [20].
Most of the models that predict the nucleation time as a function of the different
variables intervening in hot deformation (temperature, strain, microalloying content,
strain rate) determine that the nucleation time is inversely proportional to the strain, and
give the exponent of the strain a fixed value [17, 21, 22]. Thus, the nucleation time
depends on the increase in the dislocation density resulting from the applied strain and
this relationship is not affected by other variables like the chemical composition. In
other words, for the aforementioned authors, when austenite is deformed, heterogeneous
nucleation on the dislocations is preponderant. The present work seeks to demonstrate
that strain induced precipitation in the austenite of microalloyed steels is transformed
from heterogeneous nucleation on dislocation nodes to homogenous nucleation as the
microalloying content rises.
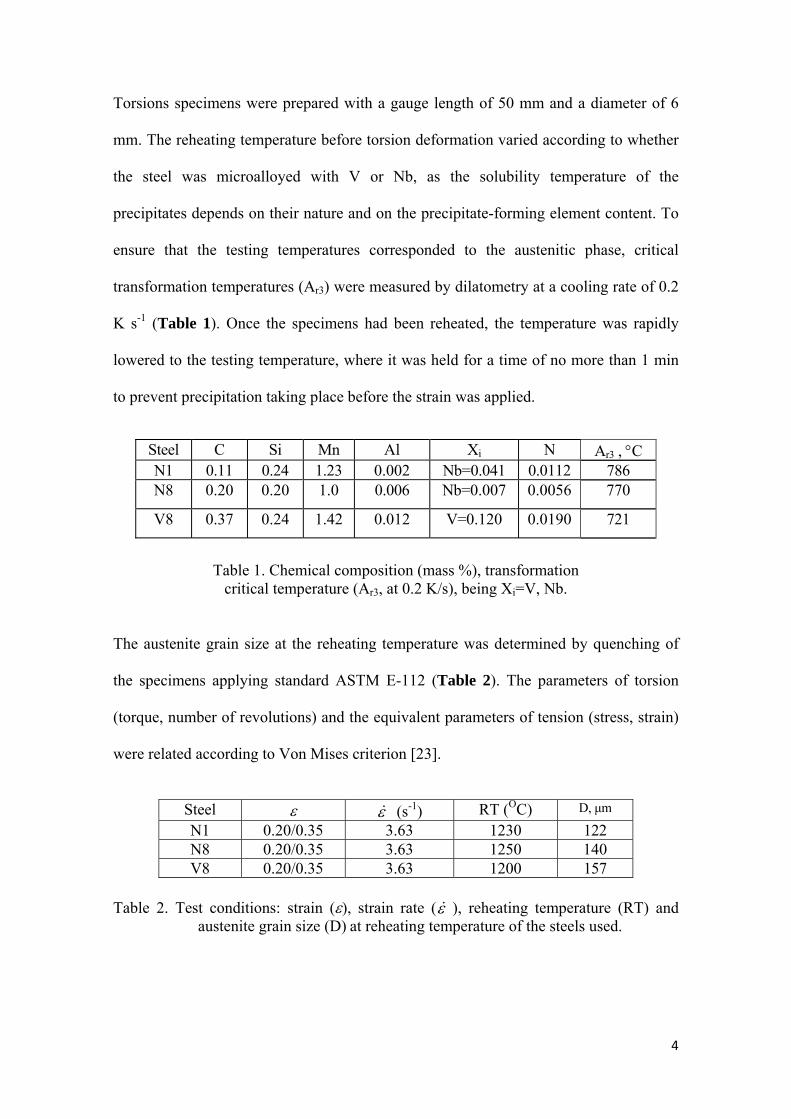
2. Materials and experimental procedure
Three steels were manufactured by Electroslag Remelting (ESR) in a laboratory unit
capable of producing 30 kg ingots. The three steels have been chosen from a larger
group of microalloyed steels on the basis of their low, medium and relatively high
microalloying content, either Nb (steels N1 and N8) or V (steel V8) (Table 1).
4
Torsions specimens were prepared with a gauge length of 50 mm and a diameter of 6
mm. The reheating temperature before torsion deformation varied according to whether
the steel was microalloyed with V or Nb, as the solubility temperature of the
precipitates depends on their nature and on the precipitate-forming element content. To
ensure that the testing temperatures corresponded to the austenitic phase, critical
transformation temperatures (Ar3) were measured by dilatometry at a cooling rate of 0.2
K s-1 (Table 1). Once the specimens had been reheated, the temperature was rapidly
lowered to the testing temperature, where it was held for a time of no more than 1 min
to prevent precipitation taking place before the strain was applied.
Steel C Si Mn Al Xi N Ar3 , C N1 0.11 0.24 1.23 0.002 Nb=0.041 0.0112 786 N8 0.20 0.20 1.0 0.006 Nb=0.007 0.0056 770
V8 0.37 0.24 1.42 0.012 V=0.120 0.0190 721
Table 1. Chemical composition (mass %), transformation
critical temperature (Ar3, at 0.2 K/s), being Xi=V, Nb.
The austenite grain size at the reheating temperature was determined by quenching of
the specimens applying standard ASTM E-112 (Table 2). The parameters of torsion
(torque, number of revolutions) and the equivalent parameters of tension (stress, strain)
were related according to Von Mises criterion [23].
Steel (s-1) RT (OC) D, μm
N1 0.20/0.35 3.63 1230 122 N8 0.20/0.35 3.63 1250 140 V8 0.20/0.35 3.63 1200 157
Table 2. Test conditions: strain (), strain rate ( ), reheating temperature (RT) and
austenite grain size (D) at reheating temperature of the steels used.
5
The testing temperatures varied between 1100 and 800°C for the vanadium steel and
between 1150 and 850°C for the niobium steels. In all cases the testing temperatures
were set as the recrystallised fraction was determined and the recrystallised fraction
curves were drawn, so that the curves finally obtained would include curves where
strain-induced precipitation had taken place and curves where it had not, as is discussed
below. The applied strains were 0.20 and 0.35, which were insufficient to promote
dynamic recrystallisation [24] and the strain rate was always 3.63 s-1 (Table 2). The
recrystallised fraction (Xa) was determined using the "back extrapolation" method
[25,26]. The study of precipitates was carried out using transmission electron
microscopy (TEM).
3. Precipitate nucleation
The nucleation rate is obtained from the classic theory of nucleation modified by
Zeldovich, Kampamann and Wagner [27-29] as:
tkT
GZN
dt
dN expexp'0 (1)
where, N0 represents the number of available sites for heterogeneous nucleation, Z is de
Zeldovich non-equilibrium factor, k is the Boltzman constant, ß’ is the rate at which the
atoms are being added to the critical nucleus or atomic impingement rate, T is the
absolute temperature, is the incubation time and G is the Gibbs energy of formation
of a critical spherical nucleus of radius Rc.
The integration of equation (1) would give the number of precipitates (N) per unit of
volume. Some authors have proposed new expressions based on this expression which
can be applied to deformation induced precipitation in microalloyed steels. The most
important reference to predict strain induced precipitation nucleation as a function of
hot deformation variables (strain, strain rate, temperature) is perhaps the expression
6
given by Dutta and Sellars [30] for a time corresponding to 5% of the precipitated
volume (t0.05), which in practical terms can be taken as the nucleation time for
precipitation. These authors state that the density of preferential nucleation sites in
deformed austenite is expected to be sensitive to the density and arrangement of
dislocations, and therefore to the conditions of the prior deformation expressed in terms
of the aforementioned variables. Dutta and Sellars's model was applied to Nb-
microalloyed steels and takes into account the Nb-content, strain (), strain rate )( and
temperature (T), and the expression is as follows:
23
5.01105.0
lnexp
270000exp)(
skT
B
RTZNbAt (2)
where, )exp(RT
QZ d is the Zener-Hollomon parameter. The good approximation of
the activation energy (Qd) to the energy for self-diffusion in Fe indicates that the
mechanism which governs the plastic flow of austenite is principally the climb of edge
dislocations, which depends in turn on the diffusion of vacancies [31]. Nb is the
percentage of this element, A and B are constants and ks is the supersaturation ratio
parameter.
A new model for strain induced precipitation based on expression (2) has recently been
published for any microalloyed steel and the following equation has been proposed
[32]:
2305.0ln
exp)exp(s
dsr
kT
B
RT
QDAt
(3)
Equation (3) has been proposed because the results showed that the exponent of the
strain () is not a constant and is not equal to 1 but is dependent on the chemical
composition, particularly on the microalloying element content. It was also seen that the
7
austenite grain size (D) influences the parameter t0.05. Furthermore, as will be seen
below, the determination of the supersaturation ratio parameter (ks) was not a constant,
and the mathematical expression found shows that it depends on the chemical
composition of the steel, in particular the microalloying type and content. The use of
nineteen steels with different Nb, V and Ti contents allowed values and expressions to
be found for the different parameters in equation (3) making it possible to predict with
good approximation the experimental values found for t0.05 in any microalloyed steel.
In both equations (2) and (3) the role of is to increase the dislocation density and thus the
number of nodes in the dislocation network, N0=0.51.5 included in equation (1), being
=(/0.2b)2 the variation in the dislocation density associated with the recrystallisation
front movement in the deformed zone at the start of precipitation [5], is the difference
between the flow stress and yield stress at the deformation temperature, b is the Burgers
vector and is the shear modulus. The exponent of the strain in equation (3) was
determined experimentally, having obtained the following expression [32]:
813.02 1
10994.3exp196.1w
x (4)
where, w is the microalloying element content (wt%).
Equation (4) means that the strain starts to influence the precipitation kinetics when the
microalloying element content is less than a certain amount, which in practical terms
could be approximately 0.5 (wt%). At the same time, the maximum value of ß should be
1.96 (wt%). Note that the parameter ß is a function of the microalloying content without
intervention of the N or C content. This is due to the fact that the diffusion coefficient of
Nb and V are several orders of magnitude smaller than those of N and C, and therefore
are those that govern precipitate formation [33].
8
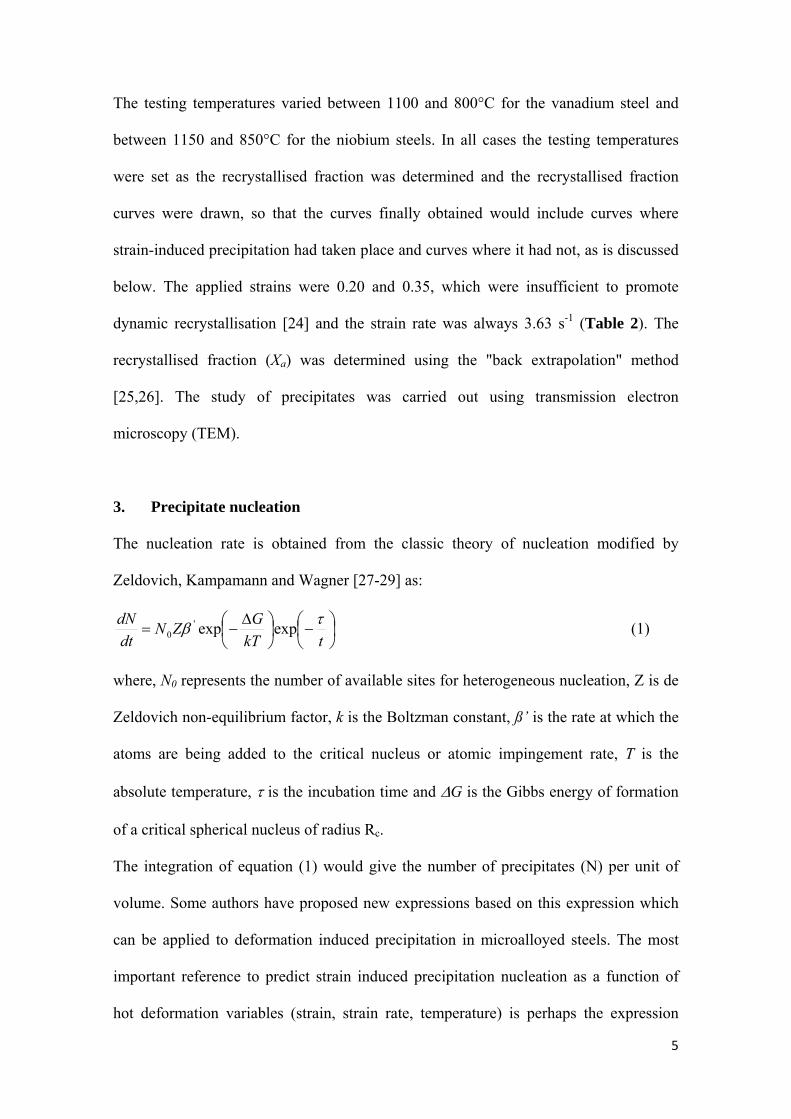
4. Experimental results
4.1. Precipitation start-time-temperature (PSTT) diagrams for two strains
The recrystallised fraction, determined by applying the back extrapolation method, was
drawn against time for each testing temperature. The shape of the recrystallised fraction
versus time curves were similar for the microalloyed steels used, it being observed that
some curves display a plateau caused by the formation of precipitates which
momentarily inhibit the progress of recrystallisation [34-37]. The plateau is caused by
strain-induced precipitation, as occurs in all microalloyed steels, and the start and end of
the plateau are identified approximately with the start and end of strain-induced
precipitation, respectively. While the start of the plateau seems to coincide with good
exactness with the start of strain-induced precipitation, the end of the plateau may
coincide with important growth in the average size of precipitates, which become
incapable of inhibiting recrystallisation [38]. The plateau is not unlimited, i.e.,
precipitation does not permanently inhibit recrystallisation, and recrystallisation again
progresses until is complete, following a graphic plot similar to that recorded before the
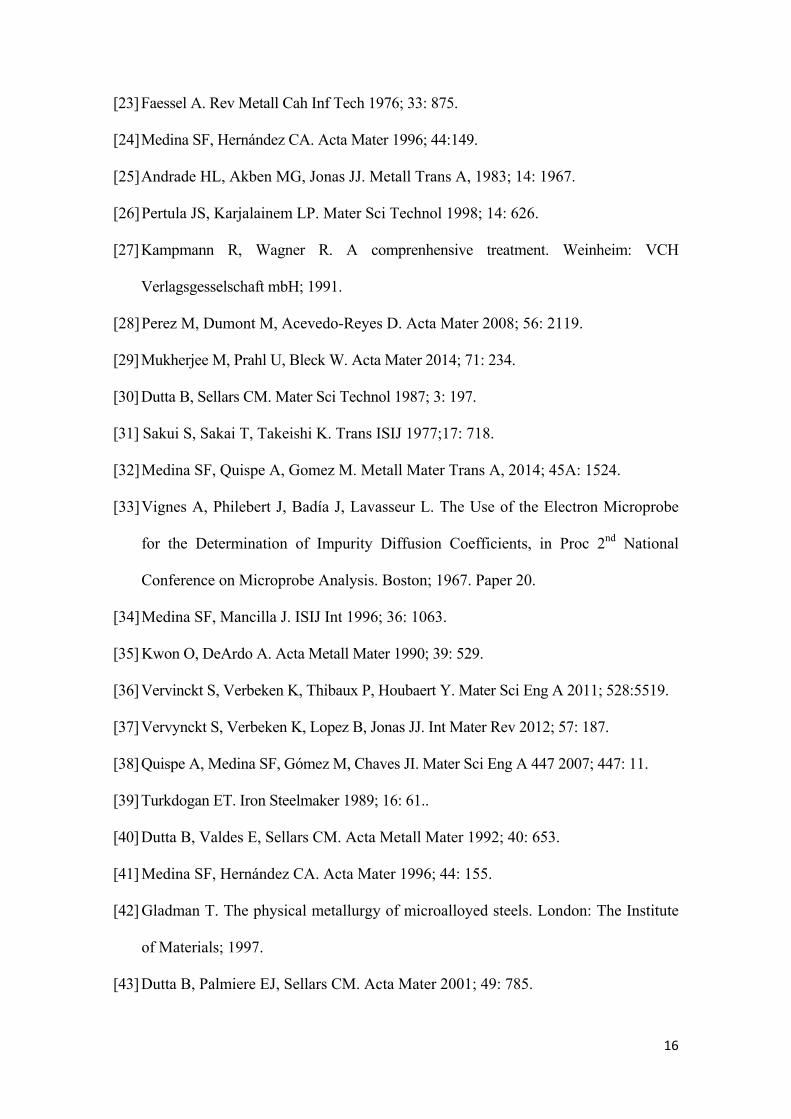
formation of the plateau. As an example, Fig. 1 shows the recrystallised fraction of the
steel N1 for a strain of 0.35.
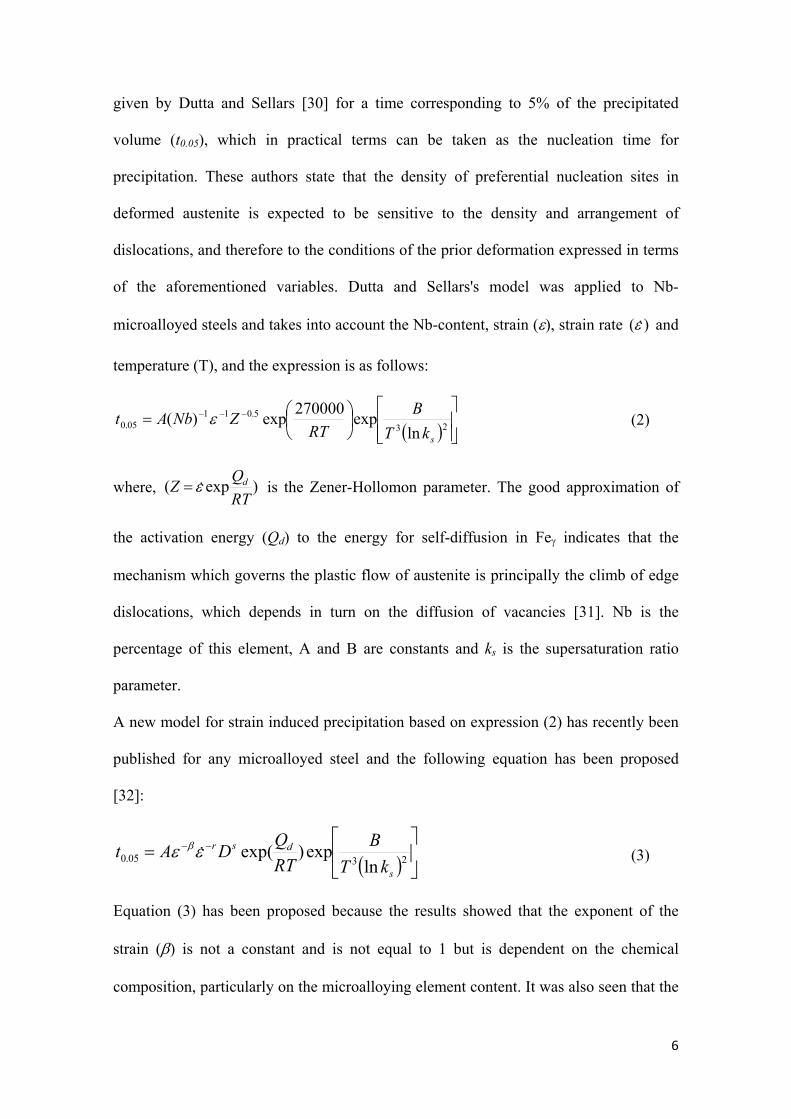
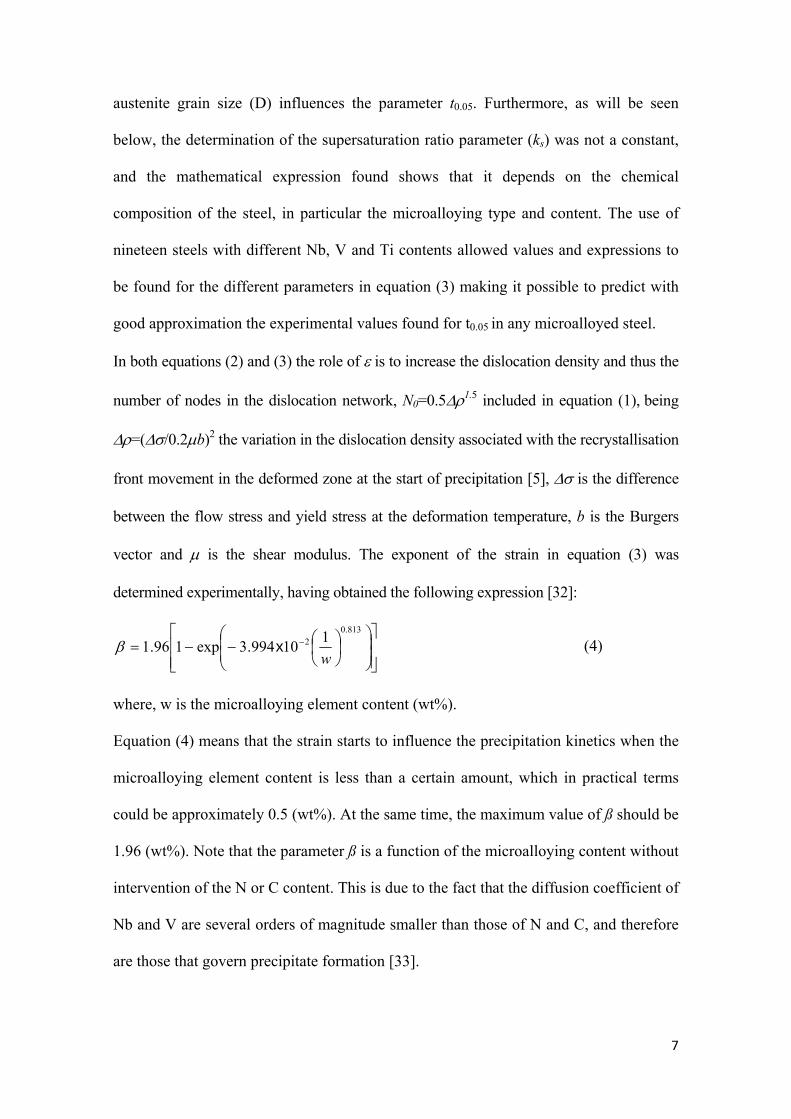
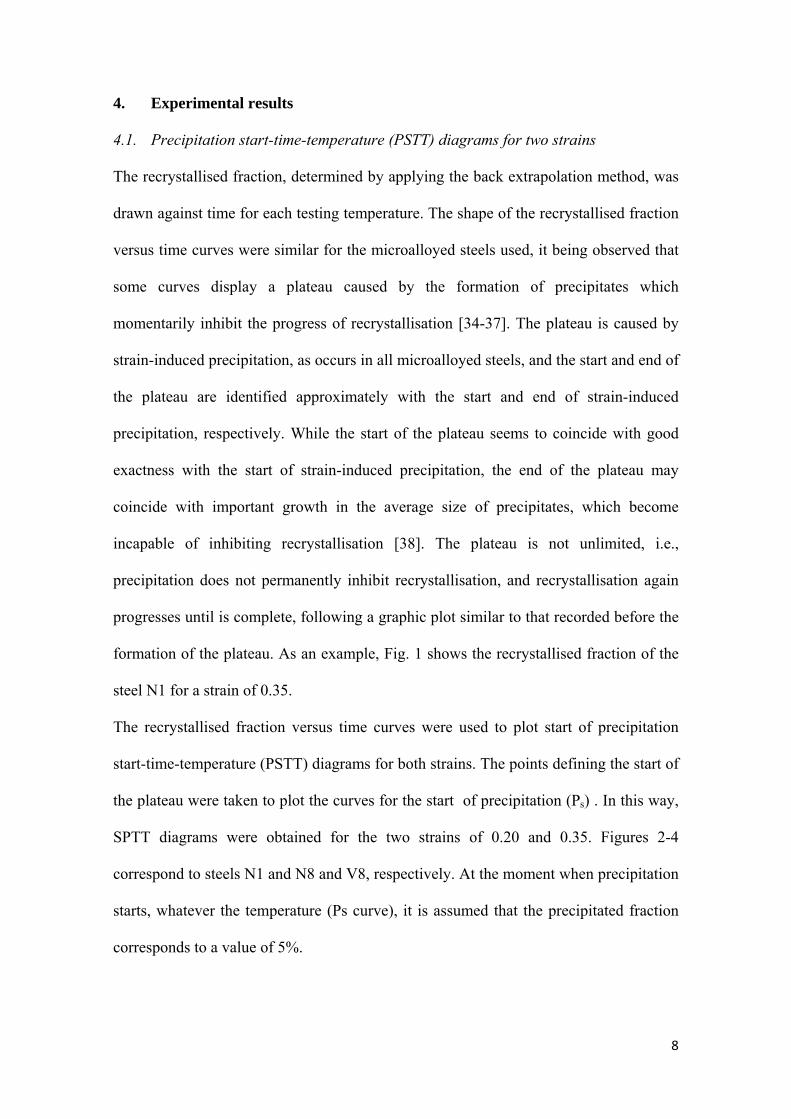
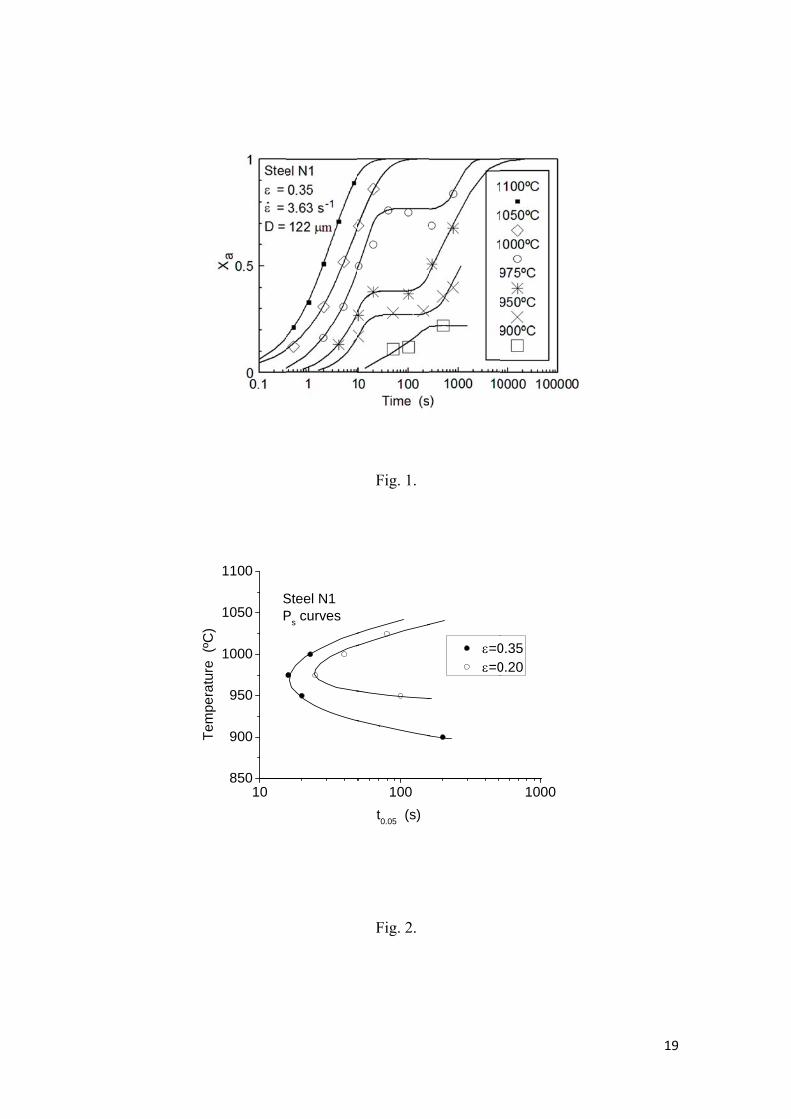
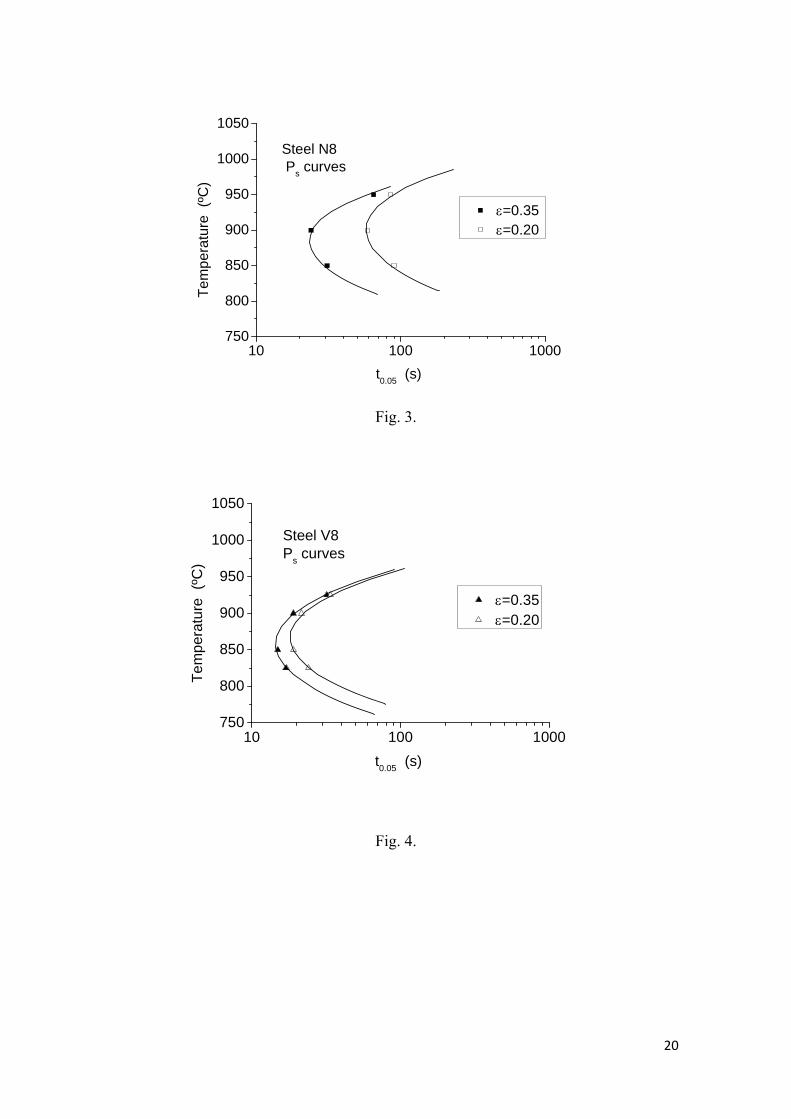
The recrystallised fraction versus time curves were used to plot start of precipitation
start-time-temperature (PSTT) diagrams for both strains. The points defining the start of
the plateau were taken to plot the curves for the start of precipitation (Ps) . In this way,
SPTT diagrams were obtained for the two strains of 0.20 and 0.35. Figures 2-4
correspond to steels N1 and N8 and V8, respectively. At the moment when precipitation
starts, whatever the temperature (Ps curve), it is assumed that the precipitated fraction
corresponds to a value of 5%.

9
The reheating temperature was 1230°C for steel N1, 1250ºC for steel N8 and 1200ºC for
steel V8. In the last case it was seen that VN type particles were precipitated, and
therefore the temperature of 1200°C was sufficient to place them in solution. In the two
steels containing Nb, the precipitated particles were carbonitride types, and for this
reason one of the prototypes with the highest probability of formation, NbC0.7N0.2, was
chosen, in agreement with Turkdogan [39].
Solubility temperatures (Ts) were calculated for the aforementioned precipitates and the
values of nose temperature (TN) and minimum incubation time (tN) corresponding to the
curve nose were measured from the PSTT diagrams and are set out in Table 3.
4.2. Influence of strain
Ps values corresponding to the nose of the curves were determined from the SPTT
diagrams, and both were seen to decrease as the microalloying element content or the
strain increased. According to expression (3), the time (t0.05) is related with the strain ()
in accordance with the following expression:
(5)
According to expression (5), and accepting that t0.05 and Ps may be assumed to be
approximately equal, the values of ß were determined. The value taken for t0.05
corresponding to each strain has been the minimum nucleation time (tN) corresponding
to the nose of the Ps curve (Table 3).
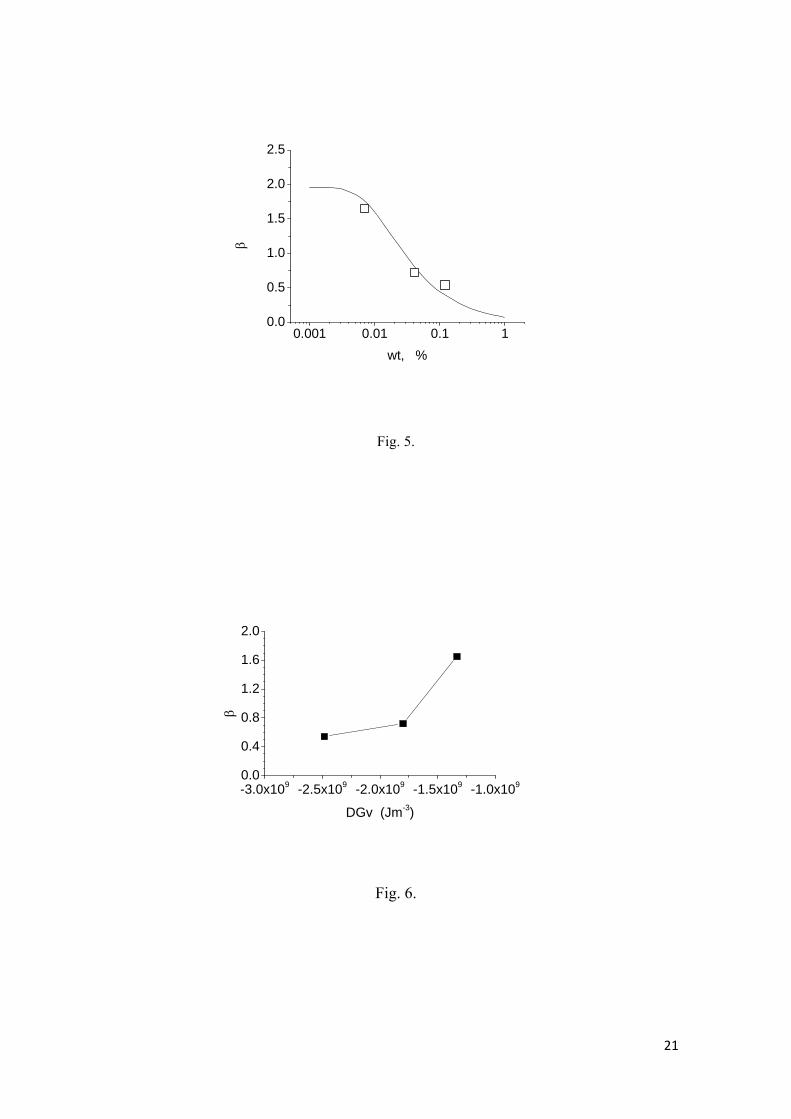
The graphic representation of ß in equation (4) and the values obtained for the three
steels used (Table 3) versus the microalloying element content clearly shows that this
parameter depends on the microalloying content and the influence of its nature can be
practically disregarded (Figure 5).
lnln 05.0 t

10
Steel ε Ts
(K) TN (K)
tN (s) ß
N1 0.20
1438.4 1252 24
0.72 0.35 16
N8 0.20
1309.9 1184 58
1.65 0.35 23
V8 0.20
1399.5 1151.5 19
0.54 0.35 14
Table 3. Solubility temperature (Ts) according to Turkdogan [12], experimental and predicted nose temperature (TN) and minimum incubation time tN. = 3.63 s-1.
The value of ß will indicate what type of nucleation will be preponderant. For high ß
values it is obvious that the preponderant nucleation will be heterogeneous nucleation
on dislocations produced by the deformation. At low ß values the nucleation should be
homogeneous due to the relatively high percentage of microalloying.
5. Calculation of dislocations density and number of nodes
In equation (1), N0=0.51.5 is the number of available sites (nodes) for heterogeneous
nucleation in the dislocation network, being =(/0.2b)2 the variation in the density of
dislocations associated with the recrystallisation front movement in the deformed zone at
the start of precipitation [40], is the difference between the flow stress and yield stress
at the deformation temperature, b is the Burgers vector (2.59 x 10⁻¹⁰ m) and is the shear
modulus (4x10⁴ MN/m2).
The flow stress increment ( ) has been calculated using the model reported by Medina
and Hernández [41] which facilitates the calculation of flow stress. The dislocation density
has been calculated at the nose temperature of the Ps curves corresponding to strains of
0.20 and 0.35, respectively. The calculated values of , and N0 are shown in Table 4.
The values are of the same order for the three steels and increase when the strain goes
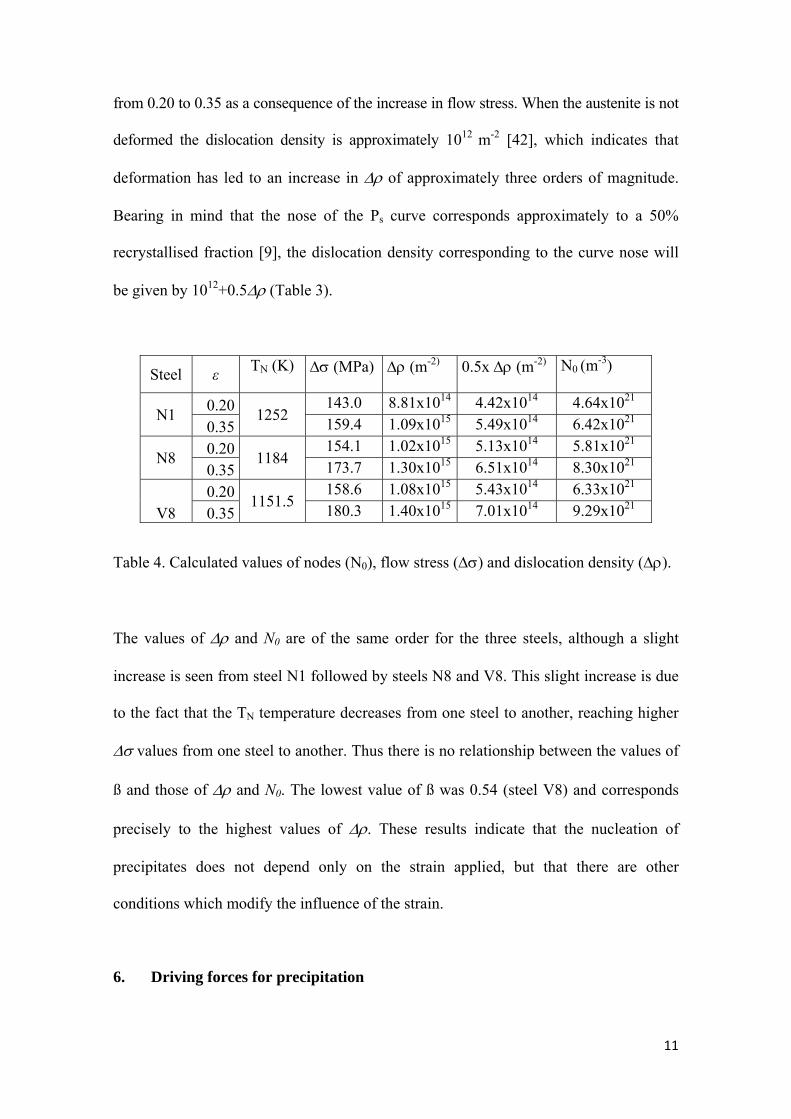
11
from 0.20 to 0.35 as a consequence of the increase in flow stress. When the austenite is not
deformed the dislocation density is approximately 1012 m-2 [42], which indicates that
deformation has led to an increase in of approximately three orders of magnitude.
Bearing in mind that the nose of the Ps curve corresponds approximately to a 50%
recrystallised fraction [9], the dislocation density corresponding to the curve nose will
be given by 1012+0.5 (Table 3).
Steel ε TN (K)
(MPa) (m-2) 0.5x (m-2) N0 (m
-3)
N1 0.20
1252 143.0 8.81x10¹⁴ 4.42x10¹⁴ 4.64x10²¹
0.35 159.4 1.09x10¹⁵ 5.49x10¹⁴ 6.42x10²¹
N8 0.20
1184 154.1 1.02x10¹⁵ 5.13x10¹⁴ 5.81x10²¹
0.35 173.7 1.30x10¹⁵ 6.51x10¹⁴ 8.30x10²¹
V8 0.20
1151.5 158.6 1.08x10¹⁵ 5.43x10¹⁴ 6.33x10²¹
0.35 180.3 1.40x10¹⁵ 7.01x10¹⁴ 9.29x10²¹
Table 4. Calculated values of nodes (N0), flow stress () and dislocation density ().
The values of and N0 are of the same order for the three steels, although a slight
increase is seen from steel N1 followed by steels N8 and V8. This slight increase is due
to the fact that the TN temperature decreases from one steel to another, reaching higher
values from one steel to another. Thus there is no relationship between the values of
ß and those of and N0. The lowest value of ß was 0.54 (steel V8) and corresponds
precisely to the highest values of . These results indicate that the nucleation of
precipitates does not depend only on the strain applied, but that there are other
conditions which modify the influence of the strain.
6. Driving forces for precipitation
12
The driving force for precipitation is defined as the free energy change that accompanies
the formation of a unit volume of precipitate from the supersaturated matrix and is given
by [43]:
ey
ex
yx
m
gv CC
CC
V
TRJmG ln3 (6)
where Cx and Cy are the instantaneous concentrations of V or Nb and N or/and C,
respectively, exC and e
yC are the equilibrium concentrations at the deformation temperature,
Vm is the molar volume of the precipitate species, Rg is the universal gas constant and T is
the deformation absolute temperature.
According to Turkdogan [39], the supersaturation ratio defined by ey
ex
yxs CC
CCK will be:
Nb-Steels:
T
s
NCNbK
945012.4
2.07.0
10
(7)
V-Steels:
T
s
NVK
770086.2
10
(8)
It has been considered that Nb forms carbonitrides and V forms nitrides with the
stoichiometry used by Turkdogan. In order to calculate expression (6), the values used
for Vm were 1.305x10⁻⁵ and 1.052x10⁻⁵ (m3/mol) for Nb-carbonitride and V-nitrides
precipitates, respectively [40]. In this way, G was calculated at the nose temperature
(TN) of the Ps curve. The values calculated of G are displayed in Table 5.
13
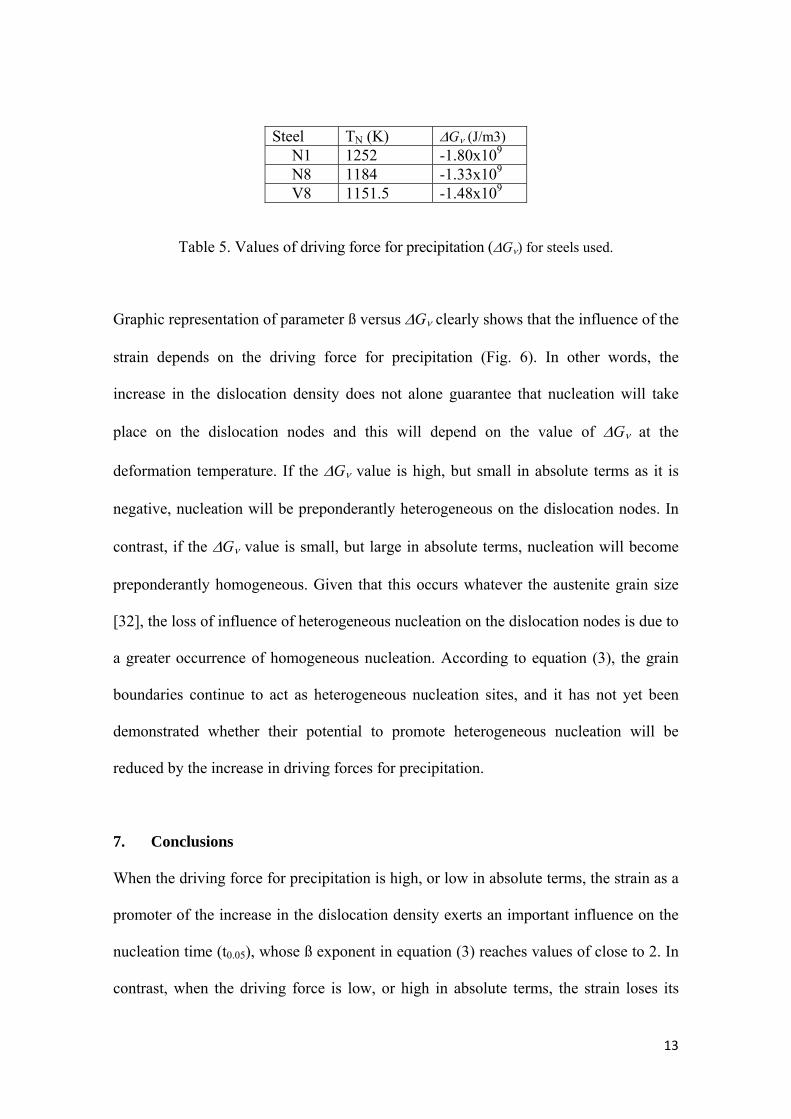
Steel TN (K) G (J/m3) N1 1252 -1.80x10⁹ N8 1184 -1.33x10⁹ V8 1151.5 -1.48x10⁹
Table 5. Values of driving force for precipitation (G) for steels used.
Graphic representation of parameter ß versus G clearly shows that the influence of the
strain depends on the driving force for precipitation (Fig. 6). In other words, the
increase in the dislocation density does not alone guarantee that nucleation will take
place on the dislocation nodes and this will depend on the value of G at the
deformation temperature. If the G value is high, but small in absolute terms as it is
negative, nucleation will be preponderantly heterogeneous on the dislocation nodes. In
contrast, if the G value is small, but large in absolute terms, nucleation will become
preponderantly homogeneous. Given that this occurs whatever the austenite grain size
[32], the loss of influence of heterogeneous nucleation on the dislocation nodes is due to
a greater occurrence of homogeneous nucleation. According to equation (3), the grain
boundaries continue to act as heterogeneous nucleation sites, and it has not yet been
demonstrated whether their potential to promote heterogeneous nucleation will be
reduced by the increase in driving forces for precipitation.
7. Conclusions
When the driving force for precipitation is high, or low in absolute terms, the strain as a
promoter of the increase in the dislocation density exerts an important influence on the
nucleation time (t0.05), whose ß exponent in equation (3) reaches values of close to 2. In
contrast, when the driving force is low, or high in absolute terms, the strain loses its

14
influence on the nucleation time and homogenous nucleation is preponderant over
heterogeneous nucleation. In this case the value of the ß exponent decreases
considerably as the microalloying content (Nb, V) increases.
15
References
[1] Sun L, Muszka K, Wynne BP, Palmiere EJ. Acta Mater 2014; 66: 132.
[2] Andrade HL, Akben MG, Jonas JJ. Metall Trans A 1983; 14: 1967.
[3] Kwon O. ISIJ Int 1992; 32: 350.
[4] Medina SF, Mancilla JE. ISIJ Int 1996; 36: 1063.
[5] Luton MJ, Dorvel R, Petkovic RA. Metall Trans A 1980; 11: 411.
[6] Gómez M, Rancel L, Medina SF. Mater Sci Eng A 2009; 506: 165.
[7] Vervynckt S, Verbeken K, Lopez B, Jonas JJ. Int Mater Rev 2012; 57:187.
[8] Hu J, Du LX, Wang JJ, Xie H, Gao CR, Misra RDK. Mater Sci Eng A 2013; 585:197.
[9] Medina SF, Quispe A. ISIJ Int 2001; 41: 774.
[10] Medina SF, Quispe A, Gómez M. Mater Sci Technol 2003; 19: 99.
[11] Pereloma EV, Kostryzhev AG, AlShahrani A, Zhu C, Cairney JM, Killmore CR,
Ringer SP. Scripta Mater 2014; 75: 74.
[12] Hu J, Du LX, Wang JJ. Scripta Mater 2013; 68: 953.
[13] Medina SF, Gómez M, Rancel L. Scripta Mater 2008; 58: 1110.
[14] Ishikawa F,Takahashi T. ISIJ Int 1995; 35: 1128.
[15] Zajac S, Siwecki T, Hutchinson WB, Lagneborg R. ISIJ Int 1998; 38: 1130.
[16] Quispe A, Medina SF, Valles P. ISIJ Int 1997; 37: 783.
[17] Dutta B, Sellars CM. Mater Sci Technol 1987; 3: 197.
[18] DeArdo AJ. Int Mater Rev 2003; 48: 371.
[19] Ardell J. Acta Metall 1972; 20: 61.
[20] Bhadeshia H K D H, Honeycombe RWK. Steels Microstructure and Properties.
London: Elsevier; 1981.
[21] Park SH, Yue S, Jonas JJ. Metall Trans A 1992; 23A: 1641.
[22] Liu WJ. Metall Trans A 1995; 26A: 1641.
16
[23] Faessel A. Rev Metall Cah Inf Tech 1976; 33: 875.
[24] Medina SF, Hernández CA. Acta Mater 1996; 44:149.
[25] Andrade HL, Akben MG, Jonas JJ. Metall Trans A, 1983; 14: 1967.
[26] Pertula JS, Karjalainem LP. Mater Sci Technol 1998; 14: 626.
[27] Kampmann R, Wagner R. A comprenhensive treatment. Weinheim: VCH
Verlagsgesselschaft mbH; 1991.
[28] Perez M, Dumont M, Acevedo-Reyes D. Acta Mater 2008; 56: 2119.
[29] Mukherjee M, Prahl U, Bleck W. Acta Mater 2014; 71: 234.
[30] Dutta B, Sellars CM. Mater Sci Technol 1987; 3: 197.
[31] Sakui S, Sakai T, Takeishi K. Trans ISIJ 1977;17: 718.
[32] Medina SF, Quispe A, Gomez M. Metall Mater Trans A, 2014; 45A: 1524.
[33] Vignes A, Philebert J, Badía J, Lavasseur L. The Use of the Electron Microprobe
for the Determination of Impurity Diffusion Coefficients, in Proc 2nd National
Conference on Microprobe Analysis. Boston; 1967. Paper 20.
[34] Medina SF, Mancilla J. ISIJ Int 1996; 36: 1063.
[35] Kwon O, DeArdo A. Acta Metall Mater 1990; 39: 529.
[36] Vervinckt S, Verbeken K, Thibaux P, Houbaert Y. Mater Sci Eng A 2011; 528:5519.
[37] Vervynckt S, Verbeken K, Lopez B, Jonas JJ. Int Mater Rev 2012; 57: 187.
[38] Quispe A, Medina SF, Gómez M, Chaves JI. Mater Sci Eng A 447 2007; 447: 11.
[39] Turkdogan ET. Iron Steelmaker 1989; 16: 61..
[40] Dutta B, Valdes E, Sellars CM. Acta Metall Mater 1992; 40: 653.
[41] Medina SF, Hernández CA. Acta Mater 1996; 44: 155.
[42] Gladman T. The physical metallurgy of microalloyed steels. London: The Institute
of Materials; 1997.
[43] Dutta B, Palmiere EJ, Sellars CM. Acta Mater 2001; 49: 785.

17

18
CAPTIONS OF FIGURES
Fig. 1. Variation of the recrystallised fraction (Xa) with the time for steel N1. Austenite
grain size (D)=122 mm;
Fig. 2. Ps curves for steel N1 at strain of 0.20 and 0.35, respectively.
Fig. 3. Ps curves for steel N8 at strain of 0.20 and 0.35, respectively.
Fig. 4. Ps curves for steel V8 at strain of 0.20 and 0.35, respectively.
Fig. 5. Plot of ß against the total microalloying element content (wt %).
Fig. 6. Parameter ß against driving force for precipitation for the steels used.
26/05/2014 13:29:59
Tem
pera
ture
(º
C)
10850
900
950
1000
1050
1100
p(
)
SPSteel N1P
s curves
Fig. 1.
100
t0.05
(s)
Fig. 2.
=0=0
1000
0.350.20
19
20
10 100 1000750
800
850
900
950
1000
1050
=0.35=0.20
Te
mp
era
ture
(ºC
)
t0.05
(s)
Steel N8 P
s curves
Fig. 3.
10 100 1000750
800
850
900
950
1000
1050
=0.35=0.20
Te
mp
erat
ure
(ºC
)
t0.05
(s)
Steel V8P
s curves
Fig. 4.
21
0.001 0.01 0.1 10.0
0.5
1.0
1.5
2.0
2.5
wt, %
Fig. 5.
-3.0x10⁹ -2.5x10⁹ -2.0x10⁹ -1.5x10⁹ -1.0x1090.0
0.4
0.8
1.2
1.6
2.0
DGv (Jm-3)
Fig. 6.