from mott insulator to overdoped superconductor:...
TRANSCRIPT

Journal of Electron Spectroscopy and Related Phenomena 117–118 (2001) 165–187www.elsevier.nl / locate /elspec
From Mott insulator to overdoped superconductor:evolution of the electronic structure of cuprates studied by ARPES
*A. Damascelli , D.H. Lu, Z.-X. ShenDepartment of Physics, Applied Physics and Stanford Synchrotron Radiation Laboratory,
Stanford University, Stanford, CA 94305, USA
Abstract
We review our angle-resolved photoemission spectroscopy (ARPES) results on different layered oxide superconductors,and on their insulating parent compounds. The low energy excitations are discussed with emphasis on some of the mostrecent issues, such as the Fermi surface and remnant Fermi surface, the pseudogap and d-wave-like dispersion, and lastly thesignatures in the ARPES spectra of multiple electronic components, many body effects, and the superfluid density. We willfocus on systematic changes in the electronic structure which may be relevant to the development of a comprehensive picturefor the evolution from Mott insulators to overdoped superconductors. 2001 Elsevier Science B.V. All rights reserved.
Keywords: Photoemission; ARPES; Electronic structure; Cuprates; Mott insulators; High temperature superconductors
1. Introduction semiconductors (like Cu and Si, respectively) but hasproven to be inadequate for strongly correlated
Following their remarkable discovery in 1986 electron systems. The failure of the single-particle[1,2], high-temperature superconductors (HTSCs) picture and the main conceptual issues involved inhave attracted great interest due to their scientific the study of HTSCs can be best illustrated startingsignificance and enormous potential for applications. from the phenomenological phase diagram of n andThe latter is obviously related to the high transition p-type HTSCs (represented by Nd Ce CuO22x x 4
temperature shown by these compounds (T can be (NCCO) and La Sr CuO (LSCO), respectively,c 22x x 4
as high as 134 K in HgBa Ca Cu O at atmos- in Fig. 1).2 2 3 82d2pheric pressure [3]). Their scientific importance The T dependence of the resistivity observed in
stems from the fact that the HTSCs highlight a major the overdoped metallic regime is taken as evidenceintellectual crisis in the quantum-theory of solids for Fermi liquid (FL) behavior. On the other hand,which, in the form of one-electron band theory, has the applicability of FL theory (which describesbeen very successful in describing good metals and electronic excitations in terms of a weakly interact-
ing gas of quasiparticles) to the ‘normal’ metallicstate of HTSCs is questionable, because many prop-erties do not follow canonical FL behavior. Mostdramatic becomes the breakdown of FL theory and*Corresponding author. Tel.: 11-650-723-5583; fax: 11-650-of the single particle picture upon approaching the725-5457.
E-mail address: [email protected] (A. Damascelli). undoped line of the phase diagram (x 5 0), where we
0368-2048/01/$ – see front matter 2001 Elsevier Science B.V. All rights reserved.PI I : S0368-2048( 01 )00264-X

166 A. Damascelli et al. / Journal of Electron Spectroscopy and Related Phenomena 117 –118 (2001) 165 –187
[12] results from the fact that, when nn spins areantiparallel to each other, the electrons gain kineticenergy by undergoing virtual hopping to the neigh-boring sites (because of the Pauli principle hoppingis forbidden for parallel spins). By projecting out thedoubly occupied states at large U [13], the low-lyingexcitations of the 1/2-filled Hubbard model are
2described by the t–J Hamiltonian (J | t /U ). Awayfrom half filling, the t–J model describes the so-called ‘doped AF’, i.e. a system of interacting spinsand mobile holes. The latter acquire a ‘magneticdressing’ because they are perturbing the correlationsof the spin background that they move through.Fig. 1. Phase diagram of n and p-type superconductors.
The challenge in the investigation of the electronicfind the antiferromagnetic (AF) Mott insulator. properties of the cuprates is to sort out the basicMott–Hubbard insulators, because of the odd num- phenomenology that can test the relevance of many-ber of electrons per unit cell, are systems erroneously body models in describing the low lying excitations,predicted by band theory to be paramagnetic metals in both the insulator and the doped metal. At the(with a partially filled d-band in the case of transition same time, it is also prudent to consider the influencemetal oxides) [4–8]. The reason for this failure lies of other degrees of freedom on the physical prop-in the on-site electron–electron repulsion U which is erties of these complex materials. For instance,much larger than the bandwidth W. As a conse- phonon modes and lattice distortion can play a veryquence, charge fluctuations are suppressed and these important role, in particular when they couple tocompounds are rather good insulators at all tempera- potential instabilities of the charge and/or spintures, with an optical gap U of a few eV between the degrees of freedom. Nevertheless, in order to addresslower and upper Hubbard bands (LHB and UHB). the scope of the current approach in the quantumAs a matter of fact, in the cuprates the Cu–O theory of solids and the validity of the proposedcharge-transfer energy D is smaller than the on-site models, a detailed comparison with experiments thatCoulomb repulsion U (see Fig. 7a), which character- probe the electronic properties and the nature of theizes these compounds more precisely as charge- elementary excitations is required. In this context,transfer insulators [9]. However, because the first ARPES has played a major role because it is theelectron-removal state corresponds to the O-derived most direct method of studying the electronic struc-Zhang–Rice singlet band (ZRB), the cuprates are ture of solids [14].thought to be equivalent to an effective Mott–Hub- In this paper, we review our recent ARPES resultsbard system with the ZRB playing the role of the on the cuprates. As the doping evolution allows aLHB, and an in-plane Cu-derived band as the UHB critical comparison between theory and experiment,[10]. These states are separated by an effective Mott we will discuss ARPES data on the HTSCs and theirgap |D. insulating parent compounds, focusing on systematic
Therefore, many aspects of the physics of the changes in the electronic structure that may becuprates are believed to be captured by the single- relevant to the development of a comprehensiveband Hubbard model [11]. This contains a kinetic- picture for the evolution from Mott insulators toenergy term proportional to the nearest neighbor (nn) overdoped superconductors.hopping amplitude t, and an ad hoc Hubbard U termwhich accounts for electronic correlations: largeCoulomb repulsion U favors electron localization 2. State-of-the-art ARPESand results in ‘frustration’ of the kinetic energy. Inthe strong coupling limit (U 4 t) at half filling In the early stages of the HTSC field, ARPES(x 5 0, i.e. one electron per Cu site), the AF state proved to be very successful in measuring the normal

A. Damascelli et al. / Journal of Electron Spectroscopy and Related Phenomena 117 –118 (2001) 165 –187 167
state Fermi surface (FS), the superconducting gap,and the symmetry of the order parameter [14].During the past decade, a great deal of effort hasbeen invested in further improving this techniquewhich now allows for energy and momentum res-olution of, respectively, a few meV and |1% of thetypical Brillouin zone (BZ) of HTSCs, thus usheringin a new era in electron spectroscopy and allowing avery detailed comparison between theory and experi-ment. To illustrate the capability of state-of-the-artARPES, the novel superconductor Sr RuO is a2 4
particularly good example because of its complexelectronic structure and especially because con-troversy has plagued the investigation of its FStopology. In addition, contrary to the cuprate HTSCs,this material can also be investigated with othertechniques, like de Haas–van Alphen (dHvA) experi-ments, thus providing a direct comparison with theARPES results.
Whereas dHvA experiments [15,16], in agreementwith LDA band-structure calculations [17,18], indi-cate two electron-like FSs b and g centered at the G
point, and a hole pocket a at the X point (as sketchedFig. 2. ARPES spectra from Sr RuO along the high symmetry2 4in 1 /4 of the projected zone in Fig. 2), early ARPESlines G–M, M–X, and G–X, as shown in the sketch depicting 1/4
measurements suggested a different picture: one of the 2D projected zone. Data from Refs. [22,23].electron-like FS at the G point and two hole pocketsat the X point [19,20]. The difference comes fromthe detection by ARPES of an intense, weakly was initially associated with a hole-like sheet of FSdispersive feature at the M point just below E , that centered at X [19,20].F
was interpreted as an extended van Hove singularity A Fermi energy intensity map can be obtained by(evHs). Although the evHs was questioned in a later integrating the EDCs over a narrow energy windowARPES study [21], in which the feature detected at about E (610 meV). As the spectral functionF
the M point was suggested to be a surface state (SS), multiplied by the Fermi function reaches its maxi-a conclusive picture and a final agreement between mum at E when a band crosses the Fermi energy,F
ARPES data, and dHvA and LDA results was the FS is identified by the local maxima of thereached only with the ‘new-generation’ of high- intensity map. Following this method, the a, b, andresolution photoemission data. g sheets of FS are clearly resolved, and are marked
Fig. 2 presents energy distribution curves (EDCs), by white lines in Fig. 3b. In addition, we find somealong the high-symmetry directions of Sr RuO , unexpected features: weak, yet well defined profiles2 4
recently reported by Damascelli et al. [22,23]. Owing marked by black lines. They can be recognized as ato the high momentum and energy resolution (1.5% replica of the primary FS, and are related to the weakof the BZ and 14 meV), we can now clearly identify ‘shadow bands’ (SB) which show dispersion oppo-several dispersive features crossing E precisely site to the primary peaks along G–M and G–X (seeF
where the a, b, and g sheets of the FS are expected Fig. 2). The origin of the shadow bands as well as ofon the basis of LDA calculations and dHvA experi- the SS, can be identified with the intrinsic instabilityments (all detected features in Fig. 2 are labeled of the cleaved surface of Sr RuO : inspection with2 4
following their assignment). Around the M point we LEED reveals superlattice reflections corresponding] ]Œ Œcan also observe the sharp peak (labeled SS) that to a 2 3 2 surface reconstruction (Fig. 3a), which

168 A. Damascelli et al. / Journal of Electron Spectroscopy and Related Phenomena 117 –118 (2001) 165 –187
Fig. 3. (a) LEED pattern obtained with 450 eV electrons [22,23].] ]Œ ŒThe arrows indicate superlattice reflections due to the 2 3 2
surface reconstruction. (b) E intensity map [22,23]. Primary a, bFFig. 4. Valence band dispersion for SCOC measured from the topand g sheets of FS are marked by white lines, and replica due toof the band. Experimental data are taken from Refs. [25] (opensurface reconstruction by black lines.circles), [26] (open triangles) and [27] (open squares). Dashed line,results from the t–J model [25]. Solid circles, self-consistent Bornapproximation (SCBA) for the t–t9–t0–J model (t 5 0.35 eV,is responsible for the folding of the primary elec-t9 5 2 0.12 eV, t0 5 0.08 eV and J50.14 eV); solid lines are
tronic structure with respect to the M–M direction obtained by fitting the SCBA data [39,40]. The dotted line along[22–24]. In light of these findings, the bulk FS the (p, 0)–(0, p) direction represents the spinon dispersion given
in Ref. [41].determined by ARPES is consistent with the LDAand dHvA results. In addition, ARPES providesessential information on the detailed shape of the a,b, and g sheets of FS [22,23]. identified in the ARPES spectra. The dispersion
along the (0, 0)–(p, p) direction is characterized bya bandwidth W . 0.3 eV. As pointed out in the first
3. The Mott insulator ARPES investigation on this compound [25], thisresult is in very good agreement with t–J model
The t–J model, briefly discussed in the Intro- calculations [28] which show that, independent ofduction, is of particular relevance to the low-energy the value of t, the dressing of the hole moving in thefeatures detected in ARPES on the cuprates. In fact, AF background reduces the QP bandwidth from 8tin ARPES experiments performed on the insulating (|3 eV for a free hole) to 2.2J (with J . 125 meV inparent compounds of the HTSCs, one photo-hole is SCOC, as independently deduced from neutroninjected in the CuO plane as a result of the scattering studies [29]). On the other hand, the t–J2
photoemission process. Therefore, this experiment is model also predicts a relatively flat dispersion [28]the practical realization of a ‘single hole’ in the AF along the (p, 0)–(0, p) direction (dashed line in Fig.insulator, and the comparison of ARPES data and 4), in contradiction to the more isotropic dispersioncalculations based on the t–J model is particularly observed in ARPES around (p /2, p /2), with W .meaningful because the single-hole calculation is 0.3 eV independent of the direction. Also the poorlyfree from complications such as charge ordering, defined lineshape and the spectral weight suppressionwhich is difficult for small-cluster calculations to observed at (p, 0), which indicate the lack ofdeal with. integrity of the QP at those momenta, cannot be
Experimental data taken from Refs. [25–27] for reproduced within the simple t–J model [27].the energy dispersion of the quasiparticle (QP) peak Better agreement between the experimental disper-in insulating Sr CuO Cl (SCOC) are shown in Fig. sion and the calculations (solid circles and solid line2 2 2
4 (open symbols). Note that in the course of the in Fig. 4) is obtained by adding second and third nnpaper we will use terms like QP in a loose sense for hopping (t9 and t0, respectively) to the t–J Hamilto-convenience, even though in most cases FL theory nian [27,30–40]. In fact, as t9 and t0 describedoes not apply and well defined QP peaks cannot be hopping within the same magnetic sublattice, they do

A. Damascelli et al. / Journal of Electron Spectroscopy and Related Phenomena 117 –118 (2001) 165 –187 169
not alter the AF properties of the model at half physics of high-T superconductivity must be thec
filling; at the same time, they are not strongly inclusion of the essential physics of the doped AF:renormalized by the AF correlations but contribute the competition between AF and Coulomb interac-directly to the coherent motion of the hole and, tions (which induce localization), and zero pointtherefore, have a substantial impact on the QP kinetic energy (which favors delocalization). Alongdispersion. The inclusion of these terms also helps in this direction, the most radical models seem to bereproducing the suppression, as compared to (p /2, those based on: (i) the RVB state and the relatedp /2), of the QP peak observed in ARPES at (p, 0). spin-charge separation picture [11,41–47,49–54], (ii)However, nothing can be said about the line shape stripes [55–66], and (iii) quantum criticality [67–because the broadening is artificially introduced in 74]. Independent of their details, these differentthe theory, which is a major limitation of this kind of theoretical approaches have one important commonapproach. Most importantly, it can be shown that the denominator: superconductivity is not simply causedsuppression of the QP peak at (p, 0) reflects a by the pairing of two QPs, as in the BCS case, ratherreduction of AF spin correlations: the additional it is the process in which the QP itself forms.hopping possibilities represented by t9 and t0 induce Furthermore, in the first two cases the drivinga spin-liquid state around the photo-hole with mechanism for the superconducting phase transitionmomentum (p, 0) [39,40]. As a consequence, one is identified with the gain in kinetic energy, contrarymay expect to find in the ARPES results some to the standard theories of solids where any phasesignatures of spin-charge separation [11]. Within this transition into a long-range ordered state is driven bycontext, it is interesting to note that the full QP the gain in potential energy. In the stripe or RVBdispersion observed for SCOC can be very well models the hopping of pairs of holes perturbs the AFreproduced also by the spinon dispersion given in spin background less than individual holes. However,Ref. [41] (the dotted line in Fig. 4 shows the result it is only when charge fluctuations become phasealong (p, 0)–(0, p)). In this case Laughlin argues in coherent that the frustration of the kinetic energy isfavor of the decay of the photo-hole injected in the released, and superconductivity sets in.2D AF CuO plane into a spinon–holon pair [41],2
which is reminiscent of the flux phase physics [42– 3.1. Remnant FS and d-wave-like dispersion47], an extension of the early resonating valencebond (RVB) conjecture [11]. We mentioned above that both the relatively
The discussion of the ARPES result on insulating isotropic dispersion at (p /2, p /2), and the suppres-SCOC emphasizes a fundamental problem in the sion of QP weight at (p, 0), observed from ARPEStheoretical description of the doped 2D AF: the on SCOC and Ca CuO Cl (CCOC, similar in many2 2 2
Heisenberg model is so strongly perturbed by the respects to SCOC [75]), cannot be explained with theaddition of mobile holes that, above a certain doping nn hopping t–J model. Better agreement with thelevel, some form of spin liquid may be a better experiment is obtained by including longer range
´ansatz than the long range ordered Neel state. This hopping terms in the model. In this way, it ispoint is centrally important to high-T superconduc- possible to also reproduce the doping dependence ofc
tivity because HTSCs, which are poor conductors in the QP band structure and, in particular, of the (p, 0)the normal state, may be better regarded as doped ARPES spectra [34]. These are shown for optimallyAFs, whose behavior differs fundamentally from the doped Bi Sr CaCu O (Bi2212), Dy-Bi2212 and2 2 2 8
FL paradigm. For this reason, the Bardeen–Cooper– CCOC [75] in Fig. 5b. Note that for CCOC the zeroSchrieffer (BCS) theory [48] which was developed in energy does not correspond to E but to the peakF
for Fermi-liquid metals (i.e. weak electron correla- position at (p /2, p /2) which, because of the Motttions), and has been so successful in describing gap, is located |700 meV below the chemicalconventional superconductors, does not have the potential and corresponds to the top of the valenceappropriate foundation for HTSCs. A new approach band. In underdoped samples the QP peak at (p, 0)may therefore be needed, and a necessary require- loses coherence and shifts to higher BE, while atment for any theory aiming to capture the essential (p /2, p /2) spectral weight still reaches the Fermi
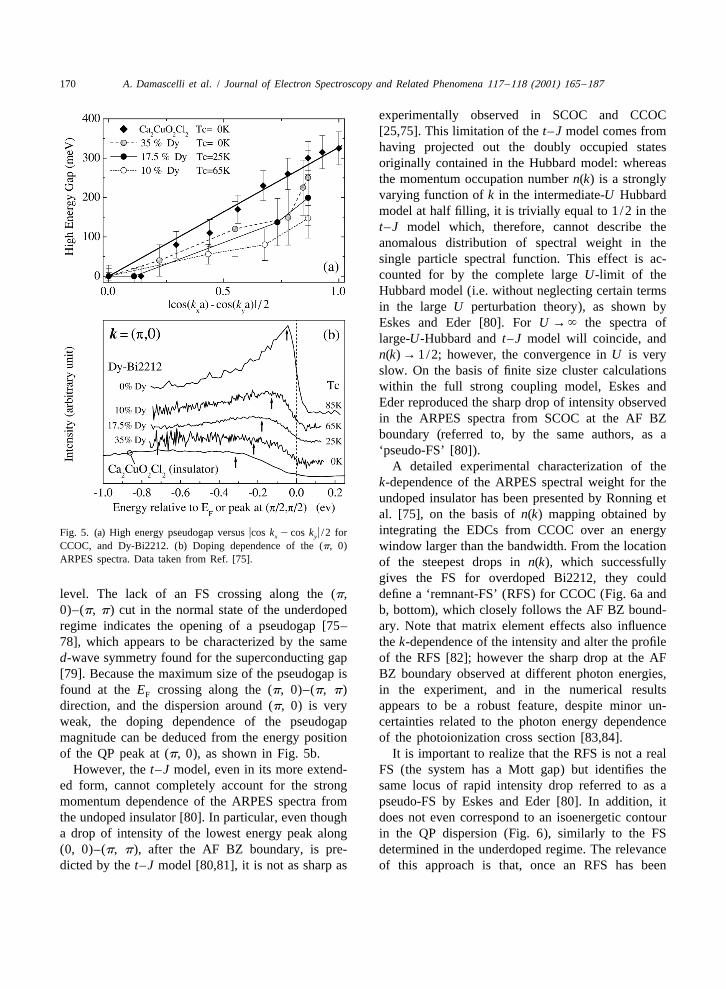
170 A. Damascelli et al. / Journal of Electron Spectroscopy and Related Phenomena 117 –118 (2001) 165 –187
experimentally observed in SCOC and CCOC[25,75]. This limitation of the t–J model comes fromhaving projected out the doubly occupied statesoriginally contained in the Hubbard model: whereasthe momentum occupation number n(k) is a stronglyvarying function of k in the intermediate-U Hubbardmodel at half filling, it is trivially equal to 1 /2 in thet–J model which, therefore, cannot describe theanomalous distribution of spectral weight in thesingle particle spectral function. This effect is ac-counted for by the complete large U-limit of theHubbard model (i.e. without neglecting certain termsin the large U perturbation theory), as shown byEskes and Eder [80]. For U → ` the spectra oflarge-U-Hubbard and t–J model will coincide, andn(k) → 1/2; however, the convergence in U is veryslow. On the basis of finite size cluster calculationswithin the full strong coupling model, Eskes andEder reproduced the sharp drop of intensity observedin the ARPES spectra from SCOC at the AF BZboundary (referred to, by the same authors, as a‘pseudo-FS’ [80]).
A detailed experimental characterization of thek-dependence of the ARPES spectral weight for theundoped insulator has been presented by Ronning etal. [75], on the basis of n(k) mapping obtained byintegrating the EDCs from CCOC over an energyFig. 5. (a) High energy pseudogap versus ucos k 2 cos k u /2 forx y
CCOC, and Dy-Bi2212. (b) Doping dependence of the (p, 0) window larger than the bandwidth. From the locationARPES spectra. Data taken from Ref. [75]. of the steepest drops in n(k), which successfully
gives the FS for overdoped Bi2212, they couldlevel. The lack of an FS crossing along the (p, define a ‘remnant-FS’ (RFS) for CCOC (Fig. 6a and0)–(p, p) cut in the normal state of the underdoped b, bottom), which closely follows the AF BZ bound-regime indicates the opening of a pseudogap [75– ary. Note that matrix element effects also influence78], which appears to be characterized by the same the k-dependence of the intensity and alter the profiled-wave symmetry found for the superconducting gap of the RFS [82]; however the sharp drop at the AF[79]. Because the maximum size of the pseudogap is BZ boundary observed at different photon energies,found at the E crossing along the (p, 0)–(p, p) in the experiment, and in the numerical resultsF
direction, and the dispersion around (p, 0) is very appears to be a robust feature, despite minor un-weak, the doping dependence of the pseudogap certainties related to the photon energy dependencemagnitude can be deduced from the energy position of the photoionization cross section [83,84].of the QP peak at (p, 0), as shown in Fig. 5b. It is important to realize that the RFS is not a real
However, the t–J model, even in its more extend- FS (the system has a Mott gap) but identifies theed form, cannot completely account for the strong same locus of rapid intensity drop referred to as amomentum dependence of the ARPES spectra from pseudo-FS by Eskes and Eder [80]. In addition, itthe undoped insulator [80]. In particular, even though does not even correspond to an isoenergetic contoura drop of intensity of the lowest energy peak along in the QP dispersion (Fig. 6), similarly to the FS(0, 0)–(p, p), after the AF BZ boundary, is pre- determined in the underdoped regime. The relevancedicted by the t–J model [80,81], it is not as sharp as of this approach is that, once an RFS has been

A. Damascelli et al. / Journal of Electron Spectroscopy and Related Phenomena 117 –118 (2001) 165 –187 171
the same nontrivial d-wave form, suggesting acommon origin [85]. This is consistent with the ideaof one underlying symmetry principle (i.e. SO(5))that unifies the AF insulating state and the d-wavesuperconducting state [86].
4. Evolution of the electronic structure
The work on the undoped insulator provides astarting point to understand the doping evolution ofthe electronic structure of the cuprates. Upon dopingthe system, AF correlations are reduced and ametallic state appears. Eventually (i.e. in the op-timum and overdoped regime), the AF state isdestroyed and a large LDA-like FS appears [14],with a volume which scales as (1 2 x), countingelectrons (x is the concentration of doped holes forp-type HTSCs), as expected within the FL approach.In this context, the first important question to answerconcerns the way the low energy states emerge in theunderdoped regime. For x < 1, two alternativescenarios have been proposed (see Fig. 7 or holedoping): (i) the chemical potential m is pinned inside
Fig. 6. FS and RFS (bottom) defined by the analysis of n(k) forthe charge-transfer gap D, as ‘in-gap states’ areoverdoped Bi2212, and insulating CCOC. Note that while the FScreated [87] (Fig. 7b); (ii) the chemical potentialin Bi2212 is the isoenergetic contour located at E , the RFS isF
away from E (because of the presence of the Mott gap), and a moves downwards into the top of the valence bandF
large d-wave-like dispersion (300 meV) is found along its contour. and states are transferred from the UHB to the LHBThe latter defines a d-wave ‘gap’ for the insulator (top left),similar to the d-wave pseudo gap observed in the underdopedregime (top right), and due to strong correlations which deformthe isoenergetic FS of the overdoped metal (from Ref. [75]).
determined, it is also possible to identify a ‘gap’along its contour (in addition to the Mott gap), andtry to compare it to the high energy pseudogap of theunderdoped systems. As reported by Ronning et al.[75], the ‘high energy’ pseudogap (given by theposition of the broad peak indicated by arrows inFig. 5b) shows d-wave symmetry not only in theunderdoped systems but also in the undoped in-sulator. This is shown in Fig. 5a where the dispersionof the high energy pseudogap along the FS (RFS forCCOC) is plotted against the d-wave functional form
Fig. 7. Doping of a charge-transfer insulator (a): m is pinned(a fit for CCOC is also shown, whereas the otherinside the charge-transfer gap and states move towards the
lines are only guides to the eye). Although their sizes chemical potential (b); alternatively, m shifts to the top of thevary, the superconducting gap, the pseudogap of the valence band and spectral weight is transferred because ofunderdoped system, and the gap of the insulator have correlations (c). Figure taken from Ref. [88].
172 A. Damascelli et al. / Journal of Electron Spectroscopy and Related Phenomena 117 –118 (2001) 165 –187
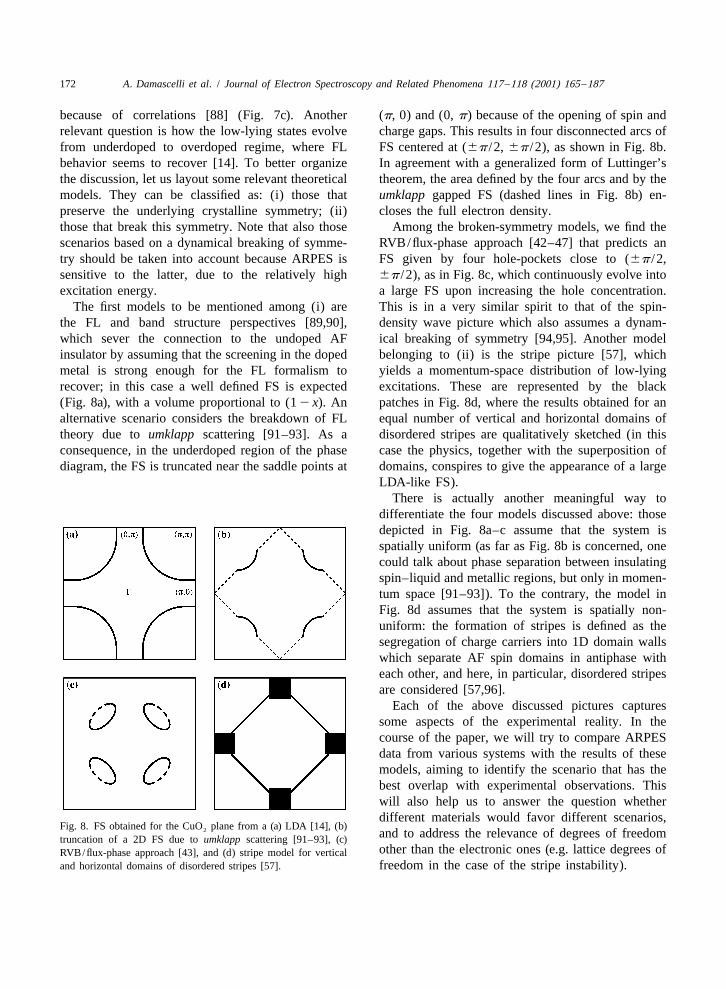
because of correlations [88] (Fig. 7c). Another (p, 0) and (0, p) because of the opening of spin andrelevant question is how the low-lying states evolve charge gaps. This results in four disconnected arcs offrom underdoped to overdoped regime, where FL FS centered at (6p /2, 6p /2), as shown in Fig. 8b.behavior seems to recover [14]. To better organize In agreement with a generalized form of Luttinger’sthe discussion, let us layout some relevant theoretical theorem, the area defined by the four arcs and by themodels. They can be classified as: (i) those that umklapp gapped FS (dashed lines in Fig. 8b) en-preserve the underlying crystalline symmetry; (ii) closes the full electron density.those that break this symmetry. Note that also those Among the broken-symmetry models, we find thescenarios based on a dynamical breaking of symme- RVB/flux-phase approach [42–47] that predicts antry should be taken into account because ARPES is FS given by four hole-pockets close to (6p /2,sensitive to the latter, due to the relatively high 6p /2), as in Fig. 8c, which continuously evolve intoexcitation energy. a large FS upon increasing the hole concentration.
The first models to be mentioned among (i) are This is in a very similar spirit to that of the spin-the FL and band structure perspectives [89,90], density wave picture which also assumes a dynam-which sever the connection to the undoped AF ical breaking of symmetry [94,95]. Another modelinsulator by assuming that the screening in the doped belonging to (ii) is the stripe picture [57], whichmetal is strong enough for the FL formalism to yields a momentum-space distribution of low-lyingrecover; in this case a well defined FS is expected excitations. These are represented by the black(Fig. 8a), with a volume proportional to (1 2 x). An patches in Fig. 8d, where the results obtained for analternative scenario considers the breakdown of FL equal number of vertical and horizontal domains oftheory due to umklapp scattering [91–93]. As a disordered stripes are qualitatively sketched (in thisconsequence, in the underdoped region of the phase case the physics, together with the superposition ofdiagram, the FS is truncated near the saddle points at domains, conspires to give the appearance of a large
LDA-like FS).There is actually another meaningful way to
differentiate the four models discussed above: thosedepicted in Fig. 8a–c assume that the system isspatially uniform (as far as Fig. 8b is concerned, onecould talk about phase separation between insulatingspin–liquid and metallic regions, but only in momen-tum space [91–93]). To the contrary, the model inFig. 8d assumes that the system is spatially non-uniform: the formation of stripes is defined as thesegregation of charge carriers into 1D domain wallswhich separate AF spin domains in antiphase witheach other, and here, in particular, disordered stripesare considered [57,96].
Each of the above discussed pictures capturessome aspects of the experimental reality. In thecourse of the paper, we will try to compare ARPESdata from various systems with the results of thesemodels, aiming to identify the scenario that has thebest overlap with experimental observations. Thiswill also help us to answer the question whetherdifferent materials would favor different scenarios,
Fig. 8. FS obtained for the CuO plane from a (a) LDA [14], (b)2 and to address the relevance of degrees of freedomtruncation of a 2D FS due to umklapp scattering [91–93], (c)other than the electronic ones (e.g. lattice degrees ofRVB/flux-phase approach [43], and (d) stripe model for vertical
and horizontal domains of disordered stripes [57]. freedom in the case of the stripe instability).

A. Damascelli et al. / Journal of Electron Spectroscopy and Related Phenomena 117 –118 (2001) 165 –187 173
4.1. La Sr CuO reminiscent of the ZR singlet band of the AF22x x 4
insulator, a second shoulder is observable close toIn order to study the doping evolution of the E . Upon further doping the system with holes, aF
low-energy electronic properties over the full doping systematic transfer of spectral weight from the high-range, in particular in the vicinity of the metal– BE to the low-BE feature takes place, and a well-insulator transition (MIT), the most suitable system defined QP peak develops near optimal doping. Onis LSCO. The hole concentration in the CuO plane the other hand, the results obtained at (p /2, p /2) are2
can be controlled and determined by the Sr content x, very different: first of all, the data shows an overallfrom the undoped insulator (x 5 0) to the heavily suppression of weight as compared to (p, 0) (theoverdoped metal (x | 0.35). In addition, LSCO has a EDCs plotted in Fig. 9 for (p /2, p /2) have beensimple crystal structure with a single CuO layer, multiplied by a factor of 2); secondly, in the nodal2
and no complications due to superstructure and region (i.e. along (0, 0)–(p, p)), a QP peak isshadow bands, as in the case of Bi2212 [14]. observable only for x $ 0.15 [98]. As we will discussAnother interesting aspect is the suppression of T at later, with different experimental geometries morec
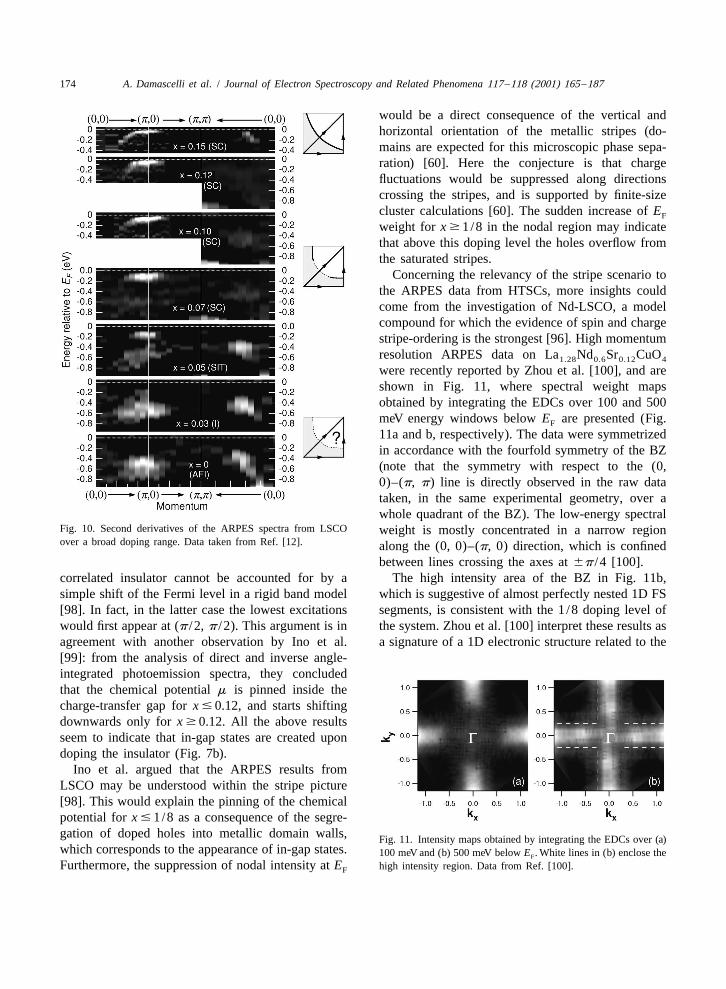
x 5 1/8 which, together with the incommensurate spectral weight is detected in the nodal region, butAF long-range order observed in inelastic neutron the overall trend of the doping dependence of thescattering [97], has been discussed as evidence for electronic structure is robust.fluctuating stripes in LSCO (similar AF order The overall dispersion of the spectral features seenaccompanied by charge ordering has been interpre- in LSCO and their doping dependence is summarizedted as a realization of ‘static stripes’ in by the plot of the second derivative (taken withLa Nd Sr CuO [96]). respect to the energy) of the ARPES spectra pre-1.48 0.4 0.12 4
Let us start from the low doping region, near the sented in Fig. 10. Upon increasing the doping level,MIT boundary. Fig. 9 presents the ARPES spectra at we can clearly observe the building of near-EF
(p, 0) and (p /2, p /2) as a function of doping, weight first at (p, 0), and then at (p /2, p /2).reported by Ino et al. [98]. The data were recorded Furthermore, the second derivative emphasizes theunder identical experimental geometry so that the presence of the high-BE feature in the heavilyphotoionization matrix elements are the same. For underdoped samples (coexisting with the low BEthe insulating samples (x # 0.03), the data are char- one, at least for x 5 0.05), which has an | 200 meVacterized by a high binding energy (BE) feature lower BE at (p /2, p /2) than at (p, 0), in agreement(|0.5 eV at (p /2, p /2), and |0.7 eV at (p, 0)), and is with what is observed on the undoped insulatorconsistent with what we have discussed in the last SCOC [25]. The ARPES results from LSCO, insection for insulating SCOC [25,27], albeit the particular the presence of two electronic componentsfeatures are now broader. The remarkable result is and the fact that the low BE feature emerges first atthat for x 5 0.05 two features can be identified in the (p, 0) and then at (p /2, p /2), suggest that theEDC at (p, 0): in addition to the high BE one, effects of doping on the electronic structure of the
Fig. 9. Doping dependence of the ARPES spectra from LSCO at (p, 0) and (p /2, p /2). EDCs were normalized to the integrated intensity ofthe valence bands (E.20.9 eV), and for (p /2, p /2) were multiplied by a factor of two. Data taken from Ref. [98].
174 A. Damascelli et al. / Journal of Electron Spectroscopy and Related Phenomena 117 –118 (2001) 165 –187
would be a direct consequence of the vertical andhorizontal orientation of the metallic stripes (do-mains are expected for this microscopic phase sepa-ration) [60]. Here the conjecture is that chargefluctuations would be suppressed along directionscrossing the stripes, and is supported by finite-sizecluster calculations [60]. The sudden increase of EF
weight for x $ 1/8 in the nodal region may indicatethat above this doping level the holes overflow fromthe saturated stripes.
Concerning the relevancy of the stripe scenario tothe ARPES data from HTSCs, more insights couldcome from the investigation of Nd-LSCO, a modelcompound for which the evidence of spin and chargestripe-ordering is the strongest [96]. High momentumresolution ARPES data on La Nd Sr CuO1.28 0.6 0.12 4
were recently reported by Zhou et al. [100], and areshown in Fig. 11, where spectral weight mapsobtained by integrating the EDCs over 100 and 500meV energy windows below E are presented (Fig.F
11a and b, respectively). The data were symmetrizedin accordance with the fourfold symmetry of the BZ(note that the symmetry with respect to the (0,0)–(p, p) line is directly observed in the raw datataken, in the same experimental geometry, over awhole quadrant of the BZ). The low-energy spectral
Fig. 10. Second derivatives of the ARPES spectra from LSCO weight is mostly concentrated in a narrow regionover a broad doping range. Data taken from Ref. [12]. along the (0, 0)–(p, 0) direction, which is confined
between lines crossing the axes at 6p /4 [100].correlated insulator cannot be accounted for by a The high intensity area of the BZ in Fig. 11b,simple shift of the Fermi level in a rigid band model which is suggestive of almost perfectly nested 1D FS[98]. In fact, in the latter case the lowest excitations segments, is consistent with the 1/8 doping level ofwould first appear at (p /2, p /2). This argument is in the system. Zhou et al. [100] interpret these results asagreement with another observation by Ino et al. a signature of a 1D electronic structure related to the[99]: from the analysis of direct and inverse angle-integrated photoemission spectra, they concludedthat the chemical potential m is pinned inside thecharge-transfer gap for x # 0.12, and starts shiftingdownwards only for x $ 0.12. All the above resultsseem to indicate that in-gap states are created upondoping the insulator (Fig. 7b).
Ino et al. argued that the ARPES results fromLSCO may be understood within the stripe picture[98]. This would explain the pinning of the chemicalpotential for x # 1/8 as a consequence of the segre-gation of doped holes into metallic domain walls, Fig. 11. Intensity maps obtained by integrating the EDCs over (a)which corresponds to the appearance of in-gap states. 100 meV and (b) 500 meV below E . White lines in (b) enclose theF
Furthermore, the suppression of nodal intensity at E high intensity region. Data from Ref. [100].F

A. Damascelli et al. / Journal of Electron Spectroscopy and Related Phenomena 117 –118 (2001) 165 –187 175
presence of static stripes. As indicated by neutron pushed to high BE because of the Mott gap, whereasand X-ray experiments [96], at 1 /8 doping the 1/4- the charge stripes would be responsible for thefilled charge stripes are separated by AF domains component near E . In this sense, the stripe interpre-F
with a periodicity of 4a (Fig. 12) where a is the tation is rather appealing. On the other hand, thelattice parameter. This picture is also consistent with picture discussed in Ref. [100] is based on thevarious theoretical calculations [59,62,64]. In par- assumption of an extreme charge disproportionationticular, the preponderance of low lying excitations at which is usually not found in charge ordering(p, 0), which is observable in Fig. 11a, is consistent transitions, even in lower symmetry systems such aswith calculations for disordered stripes like, e.g. ladders [101,102]. Nevertheless, the qualitative pic-those summarized in Fig. 8d [57,65]. Concerning the ture presented in Fig. 12 may capture the relevantmacroscopic orientation of the stripes, two orthogon- physics even for a less extreme case of chargeal domains are expected, as shown in Fig. 12a and b. disproportionation.For each domain the FS consists of straight lines There are also some results which cannot beperpendicular to the direction of the charge stripe satisfactorily explained within the framework ofitself, and intersecting the axes of the BZ at 6p /4 static stripes. For example, in both LSCO (Fig. 10)(Fig. 12c and d). The intensity distribution observed and Nd-LSCO [100], the QP band along the (0,in Fig. 11b, would then result from the superposition 0)–(p, 0) direction is characterized by a considerablyof two perpendicular FSs reflecting the presence of fast dispersion, contrary to what is expected for anorthogonal domains. ideal 1D system which typically does not exhibit any
The above interpretation of the ARPES data on dispersion perpendicularly to its main axis. Further-Nd-LSCO would also provide a possible explanation more, matrix element effects have to be cautiouslyfor the origin of the two components seen in the considered when interpreting ARPES data, especiallyARPES spectra of LSCO near the MIT boundary in dealing with the integrated spectral weight. In fact,(Fig. 9). In the static picture discussed above, the although the integration of the EDCs over a largesignal from the AF insulating regions would be energy window gives an estimate for the momentum-
dependent occupation number n(k) 5 e A(k, v)f(v)dv, the latter quantity is weighted by the photoioni-zation cross section and thus may contain extrinsicartifacts [103]. In order to gain more insight into thisissue, in particular in relation to the straight seg-ments of FS observed in Nd-LSCO and to thesuppression of the nodal state, Zhou et al. [104]extended the measurements to the second zone, andvaried polarization and orientation of the incomingelectric field to enhance the spectral intensity in the(p /2,p /2) region. As a result, the presence of thenested segments of FS near (p, 0) and (0, p) wasconfirmed. On the other hand, appreciable spectralweight at the Fermi level was found in the nodalregion [104], which appears to become more intenseupon increasing the Sr concentration in both Nd-LSCO and LSCO, and is stronger in Nd-free LSCOfor a given Sr content [104]. A possible way ofunderstanding these results within the stripe context,as suggested by Zhou et al. [104], is that the nodalstate and the dispersion along (0, 0)–(p, 0) mayFig. 12. (a) Horizontal and (b) vertical static stripes, and theirarise from disorder or fluctuation of the stripes,corresponding FS expected to be defined by the lines (c) uk u 5 p /x
4 and (d) uk u 5 p /4, respectively (from Ref. [100]). where the holes leak into the AF regions [57]. As ay
176 A. Damascelli et al. / Journal of Electron Spectroscopy and Related Phenomena 117 –118 (2001) 165 –187
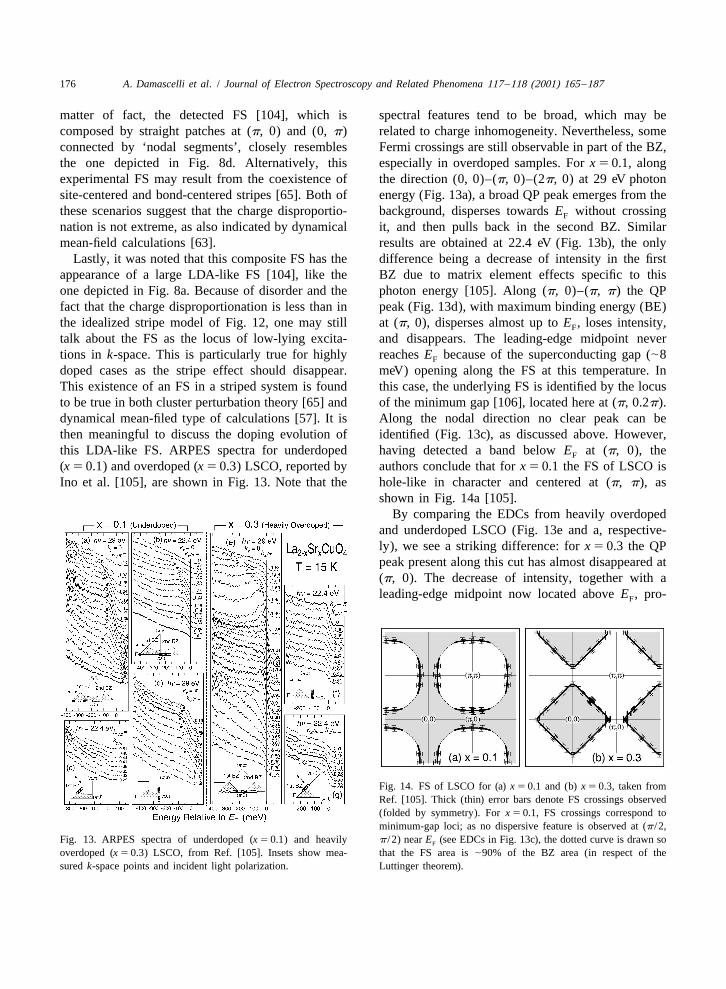
matter of fact, the detected FS [104], which is spectral features tend to be broad, which may becomposed by straight patches at (p, 0) and (0, p) related to charge inhomogeneity. Nevertheless, someconnected by ‘nodal segments’, closely resembles Fermi crossings are still observable in part of the BZ,the one depicted in Fig. 8d. Alternatively, this especially in overdoped samples. For x 5 0.1, alongexperimental FS may result from the coexistence of the direction (0, 0)–(p, 0)–(2p, 0) at 29 eV photonsite-centered and bond-centered stripes [65]. Both of energy (Fig. 13a), a broad QP peak emerges from thethese scenarios suggest that the charge disproportio- background, disperses towards E without crossingF
nation is not extreme, as also indicated by dynamical it, and then pulls back in the second BZ. Similarmean-field calculations [63]. results are obtained at 22.4 eV (Fig. 13b), the only
Lastly, it was noted that this composite FS has the difference being a decrease of intensity in the firstappearance of a large LDA-like FS [104], like the BZ due to matrix element effects specific to thisone depicted in Fig. 8a. Because of disorder and the photon energy [105]. Along (p, 0)–(p, p) the QPfact that the charge disproportionation is less than in peak (Fig. 13d), with maximum binding energy (BE)the idealized stripe model of Fig. 12, one may still at (p, 0), disperses almost up to E , loses intensity,F
talk about the FS as the locus of low-lying excita- and disappears. The leading-edge midpoint nevertions in k-space. This is particularly true for highly reaches E because of the superconducting gap (|8F
doped cases as the stripe effect should disappear. meV) opening along the FS at this temperature. InThis existence of an FS in a striped system is found this case, the underlying FS is identified by the locusto be true in both cluster perturbation theory [65] and of the minimum gap [106], located here at (p, 0.2p).dynamical mean-filed type of calculations [57]. It is Along the nodal direction no clear peak can bethen meaningful to discuss the doping evolution of identified (Fig. 13c), as discussed above. However,this LDA-like FS. ARPES spectra for underdoped having detected a band below E at (p, 0), theF
(x 5 0.1) and overdoped (x 5 0.3) LSCO, reported by authors conclude that for x 5 0.1 the FS of LSCO isIno et al. [105], are shown in Fig. 13. Note that the hole-like in character and centered at (p, p), as
shown in Fig. 14a [105].By comparing the EDCs from heavily overdoped
and underdoped LSCO (Fig. 13e and a, respective-ly), we see a striking difference: for x 5 0.3 the QPpeak present along this cut has almost disappeared at(p, 0). The decrease of intensity, together with aleading-edge midpoint now located above E , pro-F
Fig. 14. FS of LSCO for (a) x 5 0.1 and (b) x 5 0.3, taken fromRef. [105]. Thick (thin) error bars denote FS crossings observed(folded by symmetry). For x 5 0.1, FS crossings correspond tominimum-gap loci; as no dispersive feature is observed at (p /2,
Fig. 13. ARPES spectra of underdoped (x 5 0.1) and heavily p /2) near E (see EDCs in Fig. 13c), the dotted curve is drawn soF
overdoped (x 5 0.3) LSCO, from Ref. [105]. Insets show mea- that the FS area is |90% of the BZ area (in respect of thesured k-space points and incident light polarization. Luttinger theorem).

A. Damascelli et al. / Journal of Electron Spectroscopy and Related Phenomena 117 –118 (2001) 165 –187 177
vides evidence for the QP peak crossing E just superposition of 2D AF and 1D metallic behavior. InF
before (p, 0). The FS thus determined for heavily particular, the dispersion observed in ARPES per-overdoped LSCO (Fig. 14b) is electron-like in pendicular to the stripe direction would stem fromcharacter and is centered at (0, 0). Furthermore, the AF domains [63,65].careful investigations by Ino et al. [107] and Zhou etal. [104] show that the FS changes from hole-like to 4.2. Bi Sr CaCu O2 2 2 81d
electron-like for x . 0.15–0.2.In summary, what has emerged from the study of In proceeding with the comparative study of the
the LSCO system is a very complex and intriguing cuprates, let us now turn our attention to Bi2212picture, characterized by some contrasting aspects: which is the HTSC system most intensively investi-neither a simple stripe model, nor any of the other gated by ARPES (thanks to the presence of a naturalmodels proposed in Fig. 8 can provide a satisfactory cleavage plane between the BiO layers). Due toexplanation for the complete body of available data. sample quality issues, most of the Bi2212 experi-As we have discussed, the stripe picture, when ments were carried out near optimal doping, anddisorder /fluctuations and more realistic charge dis- there is almost no information on the electronicproportion are considered, has the advantage of structure near the MIT boundary. Here we concen-qualitatively explaining the data over the entire trate on cases with a doping of 10% or higher.doping range, including the presence of two elec- Therefore, we cannot answer the question whethertronic components, the straight FS segments, and the the two-component electronic structure observed inlack of a chemical potential shift in the very under- the LSCO system with a doping of 5–7% is alsodoped regime. On the other hand, on a more present in Bi2212 cases. It is still an open questionquantitative level, there are still many open ques- as to how the metallic state emerges in this system.tions. On the experimental side, two issues should be Bi2212 can also be considered as the most debatedcarefully considered. The first one is the role of HTSC system as far as ARPES is concerned, be-matrix element effects. In fact, ab initio calculations cause of the complexity of the electronic structureof matrix elements are still unavailable for LSCO, near (p, 0). These complications arise from theand the tight binding fits do not reproduce the results detection of additional features besides those relatedto a satisfactory degree. Therefore, the most robust to the primary electronic structure: ‘shadow bands’information at present may come from the analysis (possibly reflecting AF correlations [108] or theof the systematic changes observed in data recorded presence of two formula units per unit cell [14]), andunder identical experimental conditions (e.g. as the ‘umklapp bands’ (due to the diffraction of thedoping dependence studies discussed in this section). photoelectrons from the superstructure present in theSecondly, the system may consist of metallic stripes BiO layers [109]). As a result, around (p, 0) twoaligned along both [1, 0] and [1, 1], and character- main bands, two shadow bands, and four umklappized by smaller and larger charge disproportionation, bands cross the Fermi level. One additional problemrespectively. If, on the one hand, this scenario might with Bi2212 is that there are no reliable bandexplain the photoemission data, on the other hand the calculations: all theoretical results predicted a BiOcoexistence of two phases is observed only near 5% FS that has never been observed [14]. In the follow-doping. On the theoretical side, it is unclear how the ing, we will discuss the current understanding ofquasi-1D electronic structure of the stripe phase can these and other more recent issues of the inves-be smoothly connected to the 2D electronic behavior tigation of Bi2212 and its electronic properties.of the overdoped regime. Although more effort hasto be invested in the study of the electronic prop- 4.2.1. Fermi surfaceerties of charge-ordered systems and, in particular, in After an initial debate, a consensus has beeninvestigating the role of the electron–lattice inter- reached concerning the absence of the BiO pocket,action, encouraging numerical studies were recently which was predicted for Bi2212 by band structurereported [63,65], which suggest that the spectral calculations. Furthermore, the general consensus is inproperties of this material show a non-trivial favor of a hole-like FS centered at (p, p), with a

178 A. Damascelli et al. / Journal of Electron Spectroscopy and Related Phenomena 117 –118 (2001) 165 –187
volume consistent with the electron density in ac- the EDCs shows a Fermi crossing in going from (p,cordance with the Luttinger theorem [14,108,109]. In 0) to (p, p), although the band is very flat [110], andcontrast to an earlier study that suggested the pres- from (0, 0) to (p, p), in agreement with the pictureence of an electron-like FS due to bilayer splitting of a hole-like FS centered at (p, p). The latter is[110], it was argued that there is no conclusive observable in the E intensity map of Fig. 15aF
evidence for this effect [109]. For a period of time, together with the two ghost FSs due to the umklappthe hole-like FS was believed to be the only FS bands and located on each side of the primary FS. Infeature in Bi2212 [111–114] over the doping range Fig. 15a we can also observe a considerable amountgoing from underdoped to overdoped samples (T | of weight around (p, 0). Because of the complexityc
15 K and 67 K, respectively). These conclusions of the EDCs in this region and the absence of a clearseem to be in contrast with the case of LSCO, where drop in intensity along (0, 0)–(p, 0), one cannota crossover from a hole to electron-like FS is clearly make strong statements concerning an electron-likeevident near optimal doping [105,107]. Recently, FS.other reports questioned this picture, arguing that one In relation to a possible electron-like topology ofsimple hole-like FS may not be a complete charac- the Bi2212 FS in the overdoped regime, interestingterization of the low-lying excitations in Bi2212 results have been very recently reported by Bog-[115–117]. These studies suggested an electron-like danov et al. [123,124]. The authors performed aFS centered at the G-point [116,117] or, possibly, detailed study of the FS topology in slightly over-two co-existing electronic components, resulting in doped Pb–Bi2212 (T 582.5 K). The advantage ofc
electron and hole-like FSs [115]. These suggestions working on Pb-doped Bi2212 is that Pb substituteswere opposed by other groups which claimed that into the BiO planes, suppressing the superstructureonly one hole-like FS is supported by the ARPES and therefore the complications related to the um-data once the effects of the photon energy depen- klapp bands at (p, 0). As shown by the E mappingF
dence of the matrix elements in the (p, 0) region are presented in Fig. 15b [123], this system represents ataken into account [118–121]. strong case for an electron-like FS: in going from (0,
To better illustrate the problems discussed above, 0) to (p, 0), a decrease of intensity, corresponding towe show in Fig. 15a the FS of optimally doped a Fermi crossing, is now clearly observed near (p,Bi2212 determined by integrating over a 7 meV 0). However, as earlier data on the Pb-doped systemwindow about E the EDCs taken with unpolarized by Borisenko et al. [119] were interpreted as evi-F
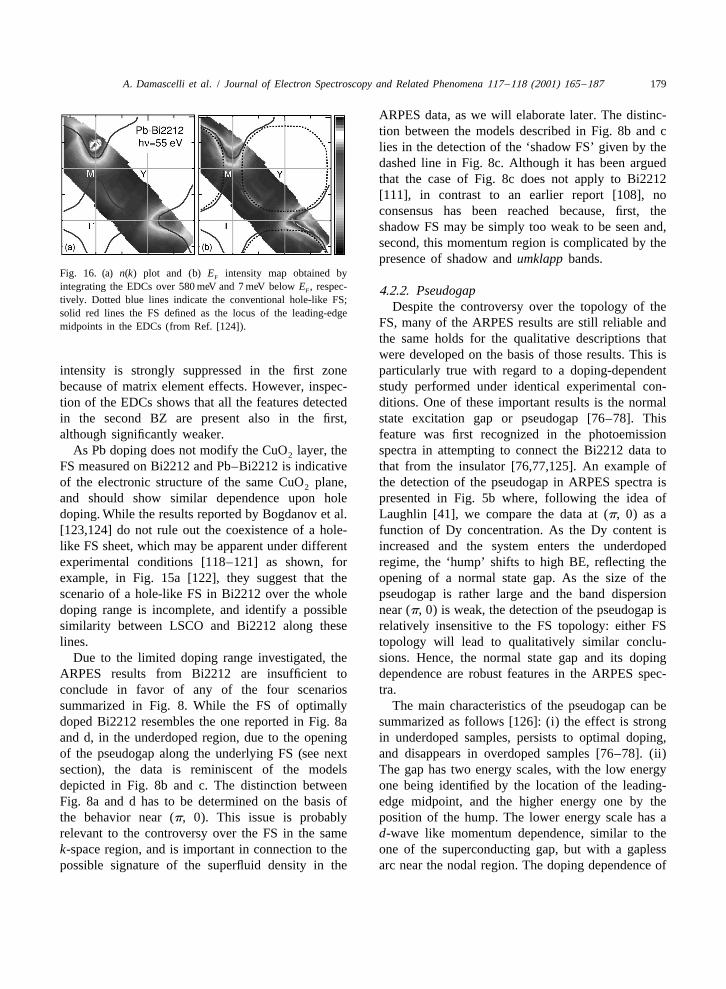
HeI radiation (from Ref. [122]). The data have been dence for a hole-like FS in Pb–Bi2212 also, and formeasured on a whole quadrant of the BZ to verify the universality of the hole-like FS topology inthe symmetry between (p, 0) and (0, p), and then Bi2212, one must examine these results in greaterhave been symmetrized with respect to the (0, 0)–(p, detail. Bogdanov et al. [124], used different methodsp) line to compensate for the different data sampling and photon energies to determine the FS in differentalong horizontal and vertical directions. Inspection of BZs (Fig. 16). More than 4000 EDC were collected
and normalized by the integrated intensity from a100 meV window above E (i.e. energy and k-F
independent background), to compensate for vari-ation of the photon flux and for the non-uniformresponse of the detector. The first indication for anelectron-like FS was obtained from the analysis ofthe leading-edge midpoint in the EDCs. The results(independent of the zone) are plotted as solid redlines in Fig. 16. This topology is confirmed by then(k) plot and E intensity map (Fig. 16a and b,F
respectively): both the maxima in the E map andF
the steepest intensity drops in the n(k) plot overlapFig. 15. FS given by the integrated weight at E for (a) optimallyF
and (b) Pb-doped Bi2212 (from Refs. [122,123]). with the EDC-derived FS (red lines). Note that the
A. Damascelli et al. / Journal of Electron Spectroscopy and Related Phenomena 117 –118 (2001) 165 –187 179
ARPES data, as we will elaborate later. The distinc-tion between the models described in Fig. 8b and clies in the detection of the ‘shadow FS’ given by thedashed line in Fig. 8c. Although it has been arguedthat the case of Fig. 8c does not apply to Bi2212[111], in contrast to an earlier report [108], noconsensus has been reached because, first, theshadow FS may be simply too weak to be seen and,second, this momentum region is complicated by thepresence of shadow and umklapp bands.
Fig. 16. (a) n(k) plot and (b) E intensity map obtained byF
integrating the EDCs over 580 meV and 7 meV below E , respec-F 4.2.2. Pseudogaptively. Dotted blue lines indicate the conventional hole-like FS;
Despite the controversy over the topology of thesolid red lines the FS defined as the locus of the leading-edgeFS, many of the ARPES results are still reliable andmidpoints in the EDCs (from Ref. [124]).the same holds for the qualitative descriptions thatwere developed on the basis of those results. This is
intensity is strongly suppressed in the first zone particularly true with regard to a doping-dependentbecause of matrix element effects. However, inspec- study performed under identical experimental con-tion of the EDCs shows that all the features detected ditions. One of these important results is the normalin the second BZ are present also in the first, state excitation gap or pseudogap [76–78]. Thisalthough significantly weaker. feature was first recognized in the photoemission
As Pb doping does not modify the CuO layer, the spectra in attempting to connect the Bi2212 data to2
FS measured on Bi2212 and Pb–Bi2212 is indicative that from the insulator [76,77,125]. An example ofof the electronic structure of the same CuO plane, the detection of the pseudogap in ARPES spectra is2
and should show similar dependence upon hole presented in Fig. 5b where, following the idea ofdoping. While the results reported by Bogdanov et al. Laughlin [41], we compare the data at (p, 0) as a[123,124] do not rule out the coexistence of a hole- function of Dy concentration. As the Dy content islike FS sheet, which may be apparent under different increased and the system enters the underdopedexperimental conditions [118–121] as shown, for regime, the ‘hump’ shifts to high BE, reflecting theexample, in Fig. 15a [122], they suggest that the opening of a normal state gap. As the size of thescenario of a hole-like FS in Bi2212 over the whole pseudogap is rather large and the band dispersiondoping range is incomplete, and identify a possible near (p, 0) is weak, the detection of the pseudogap issimilarity between LSCO and Bi2212 along these relatively insensitive to the FS topology: either FSlines. topology will lead to qualitatively similar conclu-
Due to the limited doping range investigated, the sions. Hence, the normal state gap and its dopingARPES results from Bi2212 are insufficient to dependence are robust features in the ARPES spec-conclude in favor of any of the four scenarios tra.summarized in Fig. 8. While the FS of optimally The main characteristics of the pseudogap can bedoped Bi2212 resembles the one reported in Fig. 8a summarized as follows [126]: (i) the effect is strongand d, in the underdoped region, due to the opening in underdoped samples, persists to optimal doping,of the pseudogap along the underlying FS (see next and disappears in overdoped samples [76–78]. (ii)section), the data is reminiscent of the models The gap has two energy scales, with the low energydepicted in Fig. 8b and c. The distinction between one being identified by the location of the leading-Fig. 8a and d has to be determined on the basis of edge midpoint, and the higher energy one by thethe behavior near (p, 0). This issue is probably position of the hump. The lower energy scale has arelevant to the controversy over the FS in the same d-wave like momentum dependence, similar to thek-space region, and is important in connection to the one of the superconducting gap, but with a gaplesspossible signature of the superfluid density in the arc near the nodal region. The doping dependence of

180 A. Damascelli et al. / Journal of Electron Spectroscopy and Related Phenomena 117 –118 (2001) 165 –187
the two energy scales track each other (thus labeled as OD84) are displayed, we can see the[77,112,113,127,128]. (iii) Upon decreasing the hole typical peak–dip–hump structure (open triangle,concentration, the size of the leading-edge pseudo- cross, closed triangle, in Fig. 17a). It becomes moregap increases, in contrast to the decreasing T . This pronounced upon reducing the temperature below Tc c
provides an important piece of evidence for non-BCS but it is still visible slightly above T , as shown inc
behavior of the superconducting transition in the the inset of Fig. 17a. The results obtained at lowunderdoped regime. temperatures (T < T ) for different doping levelsc
are displayed in Fig. 17b (UD for underdoped, OP4.2.3. Signature of superfluid density for optimally doped, and OD for overdoped). The
We will now turn our attention to the well-known peak, not observed in the very underdoped samples,peak–dip–hump feature [14,128–131] detected grows with doping and decreases again slightly afterbelow T in Bi2212, in the region around (p, 0). In optimal doping.c
particular, we will discuss the detailed investigation Feng et al. [132], through a phenomenologicalof doping and temperature dependence of this fea- fitting procedure, were able to quantify the evolutionture, which has been very recently reported by Feng of the peak intensity. In order to extract meaningfulet al. [132]. ARPES spectra from Bi2212 were and reliable information (i.e. independent of artifactscollected at many different temperatures in the due to k-dependence of matrix elements and/orregion around (p, 0), as sketched in Fig. 17a. Note different experimental conditions for the differentthat this average in momentum space, which results samples), the authors focused on the ratio betweenin a considerably improved signal-to-noise ratio, the relative intensity of the peak and the totaldoes not appreciably alter the k-information because spectrum intensity (integrated from 20.5 to 0.1 eV).the QP dispersion is weak in this region. In Fig. 17a, The temperature and doping dependence of thiswhere EDCs from overdoped Bi2212 with T 584 K quantity, referred to as the ‘superconducting peakc
ratio’ (SPR), are presented in Fig. 18a and d. Fromthe comparison (Fig. 18) with many superfluid-re-lated quantities measured in Bi2212, YBa Cu O ,2 3 72d
and LSCO, two major conclusions can be drawn: (i)the remarkable similarity of the data presented inFig. 18 strongly suggests a universality in thesuperconducting properties of the cuprates; (ii)ARPES, which mainly probes single-particle excita-tions of the condensate and therefore directly mea-sures the strength of the pairing (i.e. superconductinggap), can also provide information on the phasecoherence of the superconducting state (usuallyinferred from those techniques which directly probethe collective motion of the condensate). This latterpoint is shown, as a function of hole concentration,by the remarkable resemblance of the SPR to thesuperfluid density (n ) measured by mSR (Fig. 18b),s
the condensation energy U from the specific heat,and the jump in the specific heat coefficient (Fig.18c). In addition, upon increasing temperature the
Fig. 17. (a) T-dependent ARPES spectra from overdoped Bi2212 SPR decreases in a way similar to n , as measured bys(T 584 K). Data were collected around (p, 0) in momentumc microwave and mSR spectroscopy (Fig. 18d and e),space (shaded area in the sketch of 1 /4-BZ). Inset: enlarged view
with an abrupt drop near T (disappearance of thecof EDCs taken just above T . (b) Doping dependence of thecphase coherence), rather than at T* (opening of thesuperconducting-state (p, 0) spectra of Bi2212, for T < T . Fromc
Ref. [132] and references therein. pseudo-gap in the underdoped regime).

A. Damascelli et al. / Journal of Electron Spectroscopy and Related Phenomena 117 –118 (2001) 165 –187 181
tifies in the weight of the superconducting peak ameasure of the phase coherence established in the1D–2D crossover that, in the stripe picture, accom-panies the superconducting transition. Alternatively,the nonmonotonic doping dependence of the SPRcould be a manifestation of a composite QP withinthe RVB approach [11,41–47,49–54], or of compet-ing orders nearby a quantum critical point, where atT 5 0 a quantum phase transition occurs, driven byquantum rather than thermal fluctuations.
4.2.4. Quasiparticle self energyRecently, detailed ARPES studies of the single
particle self energy S(k, v) have been reported[142–149]. These investigations are extremely rel-evant because ARPES can measure both the real(renormalized QP energy) and imaginary (inverse
Fig. 18. Doping dependence, for T , T : (a) SPR of Bi2212, fromc QP lifetime) parts of S(k, v), providing informationthe spectra shown in Fig. 17b [132]; (b) mSR relaxation rate
on the many-body character of the electronic excita-(s~n ) [133,134]; (c) Bi2212 specific-heat coefficient jump Dg 5s c
tions [142–144]. In the following, we will in par-g(T ) 2 g(120K) [135], and YBCO condensation energy U [133].c
T-dependence: (d) SPR and peak-width of Bi2212 (sample OD84 ticular focus on the results obtained for Bi2212 in the2 2in Fig. 17a) [132]; (e) l (0) /l (T ) (~n ) [136–138], where lab ab s ab nodal region, where Valla et al. [145,146] found that
is the in-plane penetration depth; (f) intensity of the neutron (p, the QP peak width shows a linear T-dependencep) mode [139].
(independent of v, at small BE), and a linear v-dependence (independent of T, at large BE). No
As emphasized by Feng et al. [132], the sensitivity change in this behavior was found across T (as mayc
of ARPES as well as of neutron experiments to the be expected on the basis of DC resistivity), whichsuperconducting condensate fraction [140], and the x excludes scattering-mediated decay for the QP, con-dependence of the SPR and additional quantities in trary to the FL case. Valla et al. [145,146] argue thatFig. 18, provide direct evidence for the need of an the observed scaling behavior is suggestive of aapproach beyond FL and BCS theory. For instance, nearby quantum critical point.in treating the cuprates within the FL-BCS frame- However, evidence for an additional energy scalework, the coherence factor dictates that the QP in the QP self energy was later reported by two otherspectral weight depends on the magnitude of the groups [147–149]. In particular, from the analysis ofenergy-gap opened on the normal-state FS, and the energy and momentum distribution curves (MDCs),gap magnitude, as experimentally determined by Bogdanov et al. [147] found a kink at 50615 meV inARPES, scales as (1 2 x). To the contrary, the SPR the QP dispersion (Fig. 19), contrary to the lineargrows with x in the underdoped region, and only in dispersion predicted by LDA calculations. The kinkthe overdoped regime does the SPR scale as (1 2 x), appears to be at the same BE along all directions inpossibly indicating a crossover to a more convention- the BZ, and more pronounced at low temperaturesal FL behavior. (with only a weak residual effect above T ). Inc
As discussed by Feng et al. [132], there is no addition, a drop in the low-energy scattering rateunique interpretation for the observed phenomena. A (related to the kink) was found from the BE-depen-possible explanation for the x-dependence of the dence of the inverse QP lifetime. ExplanationsSPR can be provided by the stripe model, similarly proposed for this effect are electron–phonon cou-to what was discussed for LSCO. A calculation [141] pling, coupling to the neutron (p, p) mode, andwithin this approach well reproduces the observed stripes [147–150]. Among them the phonon scenario,T-dependence of the superfluid density, and iden- which is the most straightforward interpretation,

182 A. Damascelli et al. / Journal of Electron Spectroscopy and Related Phenomena 117 –118 (2001) 165 –187
thermal fluctuations) which can only perturb thedynamics of individual particles [50,154].
4.3. Nd Ce CuO22x x 4
As the final section of this discussion on thedoping evolution of the low energy electronic prop-erties of the cuprates, we will focus on the n-typesuperconductor NCCO. The relevance of a compara-tive study of n and p-type HTSCs is that of averification of the symmetry, or lack thereof, be-tween doping the AF insulator with electrons orholes. This issue has important theoretical implica-tions because most models which are thought tocapture the essence of high-T superconductivityc
implicitly assume electron-hole symmetry [155].High energy and momentum resolution ARPES
data on Nd Ce CuO has been recently reported1.85 0.15 4
by Armitage et al. [155,156]. EDCs measured onNCCO along the high symmetry lines in the BZ areshown in Fig. 20 (top panels) together with, forcomparison purposes, analogous spectra from single-plane slightly-overdoped Bi Pb Sr CuO (Pb–1.7 0.3 2 61d
Bi2201), whose behavior is generic to the p-typecompounds (bottom panels). Along the (0, 0)–(p, p)direction, both NCCO and Pb–Bi2201 show a dis-Fig. 19. (a) Intensity plot I(k, v) along (0, 0)–(p, p) from slightlypersion which is ubiquitous among the cuprates, withoverdoped Bi2212 (T 591 K), at 33 eV photon energy. MDCs andc
a QP peak dispersing quickly towards E andEDCs are shown in (c) and (d), respectively. (b) QP dispersion, Ffrom fits of MDCs (inset shows results for different photon crossing it at about (p /2, p /2). The exact crossingenergies). The dotted line is the LDA dispersion. Inset (b2) MDCs position varies with the band filling, as shown also(and correspondent fits) at 16 (black) and 55 (gray) meV BE. Data
by the data in Fig. 20a and d. Along (0, 0)–(p, 0),from Ref. [147].however, the two systems show a clear difference:while the low energy feature in Pb–Bi2201 dispersesclose to E and around (p, 0) forms a flat band justF
might also be the most plausible one. In fact, similar below E , in NCCO the flat band is located at aboutF
data have been obtained on systems characterized by 300 meV below E (Fig. 20b and e). Along (p,F
strong electron–phonon coupling [151–153]. 0)–(p, p), the peak disperses to E without the sameF
At this stage no consensus has been reached on the pronounced sharpening that occurs along the zoneabove results which have nonetheless opened a very diagonal. Moreover, in all spectra from momentumpromising direction in the study of HTSCs. The space points well above the FS, a relatively largeinformation one can gain from the study of the self non-dispersive background characterized by a broadenergy (in particular, the presence or absence of maximum near 300 meV is observed.extraneous energy scales in the electronic self In Fig. 21c, the E intensity map obtained byF
energy) is essential in addressing the recent claim integrating the EDCs in a 30 meV window about EF
that the HTSCs are the realization of a system where is shown [155,156]. The location of the intensitymany-body correlations are so strong that the elec- maxima defines a rounded piece of FS centered attronic properties are not affected by conventional (p, p), and characterized by a volume greater thansources of scattering (e.g. defects, impurities and 1/2 (counting electrons) which is consistent with

A. Damascelli et al. / Journal of Electron Spectroscopy and Related Phenomena 117 –118 (2001) 165 –187 183
Luttinger’s theorem. For NCCO there is no signatureof the Fermi ‘patches’ observed on the Bi-systems at(p, 0) which are related to the presence of the largeflat band very close to E (see, e.g., Fig. 15a which isF
representative for both the 2212 and 2201 systems).On the other hand, for NCCO distinct regions ofreduced intensity are identified along the FS contournear (0.65p, 0.35p) and (0.35p, 0.65p).
The EDCs from along the FS (with the back-ground defined as the signal at (p, p) subtracted)and their second derivative are presented in Fig. 21aand b, respectively [156]. These spectra cannot beadequately explained by a simple sharp peak at EF
along the entire FS contour. At first glance, theymight appear to be describable in terms of twoseparate features in the low energy electronic struc-ture (marked with ticks in Fig. 21a and arrows in Fig.21b). The feature at E at (p /2, p /2) appears to pullF
back towards higher binding energies as one movesaround the FS towards (p, 0.3p). As it moves tohigher energy it broadens becoming more incoherent.Closer to (p, 0.3p) a second feature seems to appearat low energy while the feature at high energy loses
Fig. 20. EDC along high symmetry lines for NCCO (top panels)spectral weight and disappears. The second deriva-and Pb–Bi2201 (bottom panels), from Ref. [155]. Data weretive of the EDCs (Fig. 21b) highlights a discontinuitycollected at 10 K with 10–15 meV energy resolution and momen-in intensity at those Fermi momenta where no sharptum resolution of 1% of the BZ, and 16.5 eV and 21.2 eV photons
for NCCO and Pb–Bi2201, respectively. QP peak is observed at E in the EDCs. Armitage etF
al. [156] concluded in favor of an alternative descrip-tion for the lineshape of the EDCs in Fig. 21a: asingle feature at E which becomes incoherent at theF
intermediate position. The spectral intensity is sup-pressed close to E because much of the spectralF
weight is pushed to higher energies [156]. Thiswould be the case, for instance, in the scenariodescribed in Fig. 8b, where the breakdown of FLtheory due to umklapp scattering is considered [91–93], with the difference that in the case of NCCO theFS touches the umklapp surface (dashed line in Fig.21a) at (0.65p, 0.35p) and (0.35p, 0.65p), insteadof (p, 0) and (0, p) as in Fig. 8b. This point of view
Fig. 21. (a) EDCs of NCCO along the k contour (with theF that the two features are part of a single spectralbackground defined as the signal at (p, p) subtracted), from (p /2,function is supported by the fact that only a singlep /2) to (p, 0.3p) and, (b) their second derivative. (c) FS of
NCCO obtained by integrating over 30 meV at E the EDCs from FS with the expected Luttinger’s volume is observed.F
1 /8 of the BZ. The map was symmetrized with respect to (0, The results obtained on NCCO by Armitage et al.0)–(p, p) after direct check of the symmetry along (p, 0)–(0, p). [155,156] seem to contrast with those from the p-The intensity modulation along the FS highlights the intersection,
type HTSCs. The differences found in the spectralat (0.65p, 0.35p) and (0.35p, 0.65p), between the FS and thefunction of the n and p-type materials seem toumklapp surface represented by the dashed line. Data taken from
Ref. [156]. indicate that the electron-hole symmetry usually
184 A. Damascelli et al. / Journal of Electron Spectroscopy and Related Phenomena 117 –118 (2001) 165 –187
assumed in the theoretical models describing the tronic structure would also indicate that the elec-low-energy properties of the CuO plane, might be tronic properties of a system in the stripe phase are2
an oversimplification. In particular, the local charac- different from those of a truly 1D-chain system, inter of the electronic states (doped electrons (holes) that the transverse motion is allowed in the stripeare thought to occupy Cu (O) sites) which are case but not in the 1D-chain case.eliminated by reducing the three bands of the CuO For the Bi2212 system, on the other hand, there is2
plane to one in the single-band Hubbard model, may no extensive and reliable data in the underdopedhave to be reconsidered. regime and, in particular, near the MIT boundary.
Therefore, those features which have been discussedas possible signatures of a charge ordered state in
5. Discussion and conclusions extremely underdoped LSCO, have not been con-firmed so far in the case of Bi2212. However, many
To date, the most complete ARPES studies are other features seen on Bi2212 are very similar tothose on LSCO and Bi2212, because these materials those of LSCO. These include the doping depen-can be investigated over a wide doping range. The dence of the (p, 0) pseudogap, with the leading-edgeLSCO system has been extensively interpreted in the gap being smaller in LSCO; possibly, the evolutionstripe scenario because it provides a possible expla- of the FS from hole-like to electron-like with dopingnation for many of the experimentally observed (although the results obtained around the morefeatures: (i) the two-component electronic structure complicated (p, 0) region are still controversial); theseen in the very underdoped regime that is sug- kink in the dispersion of the QP, which has recentlygestive of the creation of new electronic states inside been observed in LSCO and Nd-LSCO as well [104].the Mott gap; (ii) the lack of chemical potential shift In the case of Bi2212, it seems that all the modelsin the underdoped regime; (iii) the straight FS summarized in Fig. 8 are capable of providing asegments observed under certain experimental self-consistent, albeit not unique interpretation. Al-geometries that are indicative of 1D electronic though the normal state spectra of this material in thebehavior and cannot be reconciled with the band-like underdoped and optimally doped cases are veryFS (Fig. 8a). What is also interesting is that the broad, one can still define an FS that becomes betterLSCO results seem to suggest a ‘dual nature’ for the defined at higher doping levels (see Fig. 8a or b,low-lying electronic excitations [104]: on the one respectively, for optimally and underdoped regime).hand, the data shows the effect of charge ordering as On the other hand, the doping dependence of thementioned above. On the other hand, possibly as a superconducting peak near (p, 0), where the SPRconsequence of fluctuations, disorder, or incomplete scales as x contrary to what is expected within thecharge disproportionation, it exhibits features that FL approach, favors the models depicted in Fig. 8cdeviate from the simple rigid stripe picture, such as and d, which include the essential ingredients of thethe nodal QP weight and the QP dispersion along physics of the doped Mott insulator.directions perpendicular to the stripes. Furthermore, At this stage of the research in the HTSCs andthe FS becomes better defined upon increasing their undoped parent compounds, it does not seemdoping, and changes from hole-like to electron-like possible to firmly conclude in favor of one particularnear optimal doping. In Nd-LSCO for a given comprehensive theoretical model, in spite of thedoping, it also becomes better defined upon decreas- considerable progress made in recent years. Thising the Nd concentration whose main role is to pin situation is exemplified by the longstanding puzzlethe stripe fluctuation. All these observations seem to concerning a fundamental question, i.e. how does thesuggest that, as doping is increased, LSCO becomes doping of a Mott insulator take place (Fig. 7). On themore of a band-like system with an LDA-like FS, one hand, very recent experimental results [158,159]and the signatures of stripes weaken; near optimal favor a scenario based on the shift of the chemicaldoping, the distinction between the pictures reported potential to the top of the LHB (or to the bottom ofin Fig. 8a and d would become blurred. As shown the UHB for the n-type systems). This is in agree-recently by Mizokawa et al. [157], the dual elec- ment with the results from the t–t9–t0–J model for
A. Damascelli et al. / Journal of Electron Spectroscopy and Related Phenomena 117 –118 (2001) 165 –187 185
[5] N.F. Mott, Metal Insulator Transition, Taylor and Francis,SCOC, which reproduce the substantial deformationLondon, 1974.of the QP band structure upon doping, and suggest a
[6] J. Hubbard, Proc. R. Soc. Lond. A 277 (1964) 237.unifying point of view for both the undoped insulator
[7] J. Hubbard, Proc. R. Soc. Lond. A 281 (1964) 401.and the HTSC [34]. On the other hand, in the case of [8] P.W. Anderson, Phys. Rev. 115 (1959) 2.LSCO, the lack of chemical potential shift observed [9] J. Zaanen, G.A. Sawatzky, J.W. Allen, Phys. Rev. Lett. 55
(1985) 418.in the underdoped regime [99] and the detection of[10] F.C. Zhang, T.M. Rice, Phys. Rev. B 37 (1988) 3759.multiple electronic components [98] support the[11] P.W. Anderson, Science 235 (1987) 1196.formation of in-gap states upon doping the system[12] P.W. Anderson, Phys. Rev. 79 (1950) 350.
and, consequently, the need for a completely new [13] E. Dagotto, Rev. Mod. Phys. 66 (1994) 763.approach. In order to establish whether the evolution [14] Z.-X. Shen, D.S. Dessau, Phys. Rep. 253 (1995) 1.from the Mott insulator to the HTSC is truly [15] A.P. Mackenzie et al., Phys. Rev. Lett. 76 (1996) 3786.
[16] C. Bergemann et al., Phys. Rev. Lett. 84 (2000) 2662.accounted for by one of the existing models, or[17] T. Oguchi, Phys. Rev. B 51 (1995) 1385.whether a completely different approach is required,[18] D.J. Singh, Phys. Rev. B 52 (1995) 1358.these points need to be further clarified.[19] D.H. Lu et al., Phys. Rev. Lett. 76 (1996) 4845.
The results discussed in the course of this review [20] T. Yokoya et al., Phys. Rev. B 54 (1996) 13311.demonstrate that the cuprates are complex materials [21] A.V. Puchkov et al., Phys. Rev. B 58 (1998) R13322.characterized by many competing degrees of free- [22] A. Damascelli et al., Phys. Rev. Lett. 85 (2000) 5194.
[23] A. Damascelli et al., J. Electron Spectrosc. Relat. Phenom.dom, which lead to different peculiar physical prop-114–116 (2001) 641.erties coexisting with d-wave superconductivity. The
[24] R. Matzdorf et al., Science 289 (2000) 746.signatures of many-body effects seen in the behavior[25] B.O. Wells et al., Phys. Rev. Lett. 74 (1995) 964.
of the superconducting peak detected on Bi2212 at [26] S. LaRosa et al., Phys. Rev. B 56 (1997) R525.(p, 0), and the kink in the QP dispersion observed in [27] C. Kim et al., Phys. Rev. Lett. 80 (1998) 4245.
[28] Z. Liu, E. Manousakis, Phys. Rev. B 45 (1992) 2425.both Bi2212 and LSCO are providing new ex-[29] M. Greven et al., Phys. Rev. Lett. 72 (1994) 1096.perimental clues, whose theoretical importance will[30] A. Nazarenko et al., Phys. Rev. B 51 (1995) 8676.likely emerge in time to come.[31] B. Kyung, R.A. Ferrel, Phys. Rev. B 54 (1996) 10125.[32] T. Xiang, J.M. Wheatley, Phys. Rev. B 54 (1996) R12653.[33] V.I. Belinicher, A.L. Chernyshev, V.A. Shubin, Phys. Rev. B
54 (1996) 14914.Acknowledgements [34] R. Eder, Y. Otha, G.A. Sawatzky, Phys. Rev. B 55 (1997)
R3414.[35] T.K. Lee, C.T. Shih, Phys. Rev. B 55 (1997) 5983.We acknowledge N.P. Armitage, P. Bogdanov,[36] F. Lema, A.A. Aligia, Phys. Rev. B 55 (1997) 14092.D.L. Feng, Z. Hussain, S.A. Kellar, C. Kim, A.[37] P.W. Leung, B.O. Wells, R.J. Gooding, Phys. Rev. B 56
Lanzara, F. Ronning, K.M. Shen, T. Yoshida, and (1997) 6320.X.J. Zhou for discussions and many useful com- [38] O.P. Sushkov et al., Phys. Rev. B 56 (1997) 11769.
[39] T. Tohyama et al., J. Phys. Soc. Jpn. 69 (2000) 9.ments. SSRL is operated by the DOE office of Basic[40] T. Tohyama et al., Supercond. Sci. Tech. 13 (2000) R17.Energy Research, Division of Chemical Sciences.[41] R.B. Laughlin, Phys. Rev. Lett. 7 (1997) 1726.The office’s division of Material Science provided[42] I. Affleck, J.B. Marston, Phys. Rev. B 37 (1988) 3774.
support for this research. The Stanford work is also [43] X.-G. Wen, P.A. Lee, Phys. Rev. Lett. 76 (1996) 503.supported by NSF grant DMR9705210 and ONR [44] S. Chakravarty et al., Phys. Rev. B 63 (2001) 94503.
[45] S. Maekawa et al., Physica C 152 (1988) 133.grant N00014-98-1-0195.[46] Y. Suzumura, Y. Hasegawa, H. Fukuyama, J. Phys. Soc. Jpn.
57 (1988) 2768.[47] G. Kotliar, J. Liu, Phys. Rev. Lett. 61 (1988) 1784.[48] J. Bardeen, L.N. Cooper, J.R. Schrieffer, Phys. Rev. 108References
(1957) 1175.[49] L.B. Ioffe, A.J. Millis, Phys. Rev. B 54 (1996) 3645.
¨[1] J.G. Bednorz, K.A. Muller, Z. Phys. B 64 (1986) 189. [50] P.W. Anderson, Physica C 341 (2000) 9; Science 288 (2000)[2] M.K. Wu et al., Phys. Rev. Lett. 58 (1987) 908. 480.[3] A. Schilling et al., Nature 363 (1993) 56. [51] L. Balents, M.P.A. Fisher, C. Nayak, Int. J. Mod. Phys. B 12[4] N.F. Mott, Proc. Phys. Soc. Lond. A 62 (1949) 416. (1998) 1033.
186 A. Damascelli et al. / Journal of Electron Spectroscopy and Related Phenomena 117 –118 (2001) 165 –187
[52] L. Balents, M.P.A. Fisher, C. Nayak, Phys. Rev. B 60 (1999) [97] T. Suzuki et al., Phys. Rev. B 57 (1998) R3229.1654. [98] A. Ino et al., Phys. Rev. B 62 (2000) 4137.
[53] L. Balents, M.P.A. Fisher, C. Nayak, Phys. Rev. B 61 (2000) [99] A. Ino et al., Phys. Rev. Lett. 79 (1997) 2101.6307. [100] X.J. Zhou et al., Science 286 (1999) 268.
[54] D.-H. Lee, Phys. Rev. Lett. 84 (2000) 2694. [101] A. Damascelli et al., Phys. Rev. B 61 (2000) 2535.[55] J. Zaanen, Science 286 (1999) 251. [102] C. Presura et al., Phys. Rev. B 61 (2000) 15762.[56] V.J. Emery, S.A. Kivelson, J.M. Tranquada, Proc. Natl. ¨[103] S. Hufner, Photoelecron Spectroscopy, Springer-Verlag,
Acad. Sci. USA 96 (1999) 8814. Berlin, 1995.[57] M.I. Salkola, V.J. Emery, S.A. Kivelson, Phys. Rev. Lett. 77 [104] X. J. Zhou et al., cond-mat /0009002.
(1996) 155. [105] A. Ino et al., J. Phys. Soc. Jpn. 68 (1999) 1496.[58] A. Bianconi et al., Phys. Rev. Lett. 76 (1996) 3412. [106] J.C. Campuzano et al., Phys. Rev. B 53 (1996) R14737.[59] M. Ichioka, K. Machida, J Phys. Soc. Jpn. 68 (1999) 4020. [107] A. Ino et al., cond-mat /0005370.[60] T. Tohyama et al., Phys. Rev. Lett. 82 (1999) 4910. [108] P. Aebi et al., Phys. Rev. Lett. 72 (1994) 2757.[61] S.R. White, D.J. Scalapino, Phys. Rev. B 61 (2000) 6320. [109] H. Ding et al., Phys. Rev. Lett. 76 (1996) 1533.[62] R.S. Markiewicz, Phys. Rev. B 62 (2000) 1252. [110] D.S. Dessau et al., Phys. Rev. Lett. 71 (1993) 2781.[63] M. Fleck et al., Phys. Rev. Lett. 84 (2000) 4962. [111] H. Ding et al., Phys. Rev. Lett. 78 (1997) 2628.[64] A.L. Chernyshev, A.H.C. Neto, A.R. Bishop, Phys. Rev. [112] M.R. Norman et al., Nature 392 (1998) 157.
Lett. 84 (2000) 4922. [113] P.J. White et al., Phys. Rev. B 54 (1996) R15669.[65] M.G. Zacher et al., Phys. Rev. Lett. 85 (2000) 2585. [114] J. Ma et al., Phys. Rev. B 51 (1995) 9271.[66] J.H. Han, Q.-H. Wang, D.-H. Lee, cond-mat /0006046. [115] D.L. Feng et al., cond-mat /9908056.[67] S. Chakravarty, B.I. Halperin, D.R. Nelson, Phys. Rev. B 39 [116] Y.-D. Chuang et al., Phys. Rev. Lett. 83 (2000) 3717.
(1989) 2344. [117] A.D. Gromko et al., cond-mat /0003017.[68] S. Sachdev, J. Ye, Phys. Rev. Lett. 69 (1992) 2411. [118] H.M. Fretwell et al., Phys. Rev. Lett. 84 (2000) 4449.[69] A. Sokol, D. Pines, Phys. Rev. Lett. 71 (1993) 2813. [119] S.V. Borisenko et al., Phys. Rev. Lett. 84 (2000) 4453.[70] V.J. Emery, S.A. Kivelson, Phys. Rev. Lett. 71 (1993) 3701. [120] J. Mesot et al., cond-mat /9910430.[71] C. Castellani, C. Di Castro, M. Grilli, Phys. Rev. Lett. 75 [121] A. Bansil, M. Lindroos, Phys. Rev. Lett. 83 (1999) 5154.
(1995) 4650. [122] D.L. Feng et al., unpublished.[72] C.M. Varma et al., Phys. Rev. Lett. 63 (1989) 1996. [123] P.V. Bogdanov et al., unpublished.[73] P.B. Littlewood, C.M. Varma, J. Appl. Phys. 69 (1991) 4979. [124] P.V. Bogdanov et al., cond-mat /0005394.[74] C.M. Varma, Phys. Rev. B 55 (1997) 14554. [125] D.M. King et al., J. Phys. Chem. Solids 56 (1995) 1865.[75] F. Ronning et al., Science 282 (1998) 2067. [126] Z.X. Shen, J.M. Harris, A.G. Loeser, Hyperfine Interact.[76] A.G. Loeser et al., Science 273 (1996) 325. 105 (1997) 13.[77] D.S. Marshall et al., Phys. Rev. Lett. 76 (1996) 4841. [127] J.M. Harris et al., Phys. Rev. B 54 (1996) R15665.[78] H. Ding et al., Nature 382 (1996) 51. [128] J.C. Campuzano et al., Phys. Rev. Lett. 83 (1999) 3709.[79] Z.-X. Shen et al., Phys. Rev. Lett. 70 (1993) 1553. [129] D.S. Dessau et al., Phys. Rev. Lett. 66 (1991) 2160.[80] H. Eskes, R. Eder, Phys. Rev. B 54 (1996) R14226. [130] Y. Hwu et al., Phys. Rev. Lett. 67 (1991) 2573.[81] N. Bulut, D.J. Scalapino, S.R. White, Phys. Rev. Lett. 73 [131] M.R. Norman et al., Phys. Rev. Lett. 79 (1997) 3506.
(1994) 748. [132] D.L. Feng et al., Science 289 (2000) 277.[82] S. Haffner et al., cond-mat /0006366. [133] J.L. Tallon et al., Phys. Status Solidi B 215 (1999) 531.[83] F. Ronning et al., cond-mat /0007252. [134] Y.J. Uemura et al., Phys. Rev. Lett. 66 (1991) 2665.
¨[84] C. Durr et al., Phys. Rev. B 63 (2001) 14505. [135] J.L. Tallon, G.V.M. Williams, J.W. Loram, Physica C 338[85] M.G. Zacher et al., Phys. Rev. Lett. 85 (2000) 824. (2000) 9.[86] S.C. Zhang, Science 275 (1997) 1089. [136] T. Jacobs et al., Phys. Rev. Lett. 75 (1995) 4516.[87] J.W. Allen et al., Phys. Rev. Lett. 64 (1990) 595. [137] J.E. Sonier et al., Phys. Rev. Lett. 83 (1999) 4156.[88] M.A. van Veenendal, G.A. Sawatzky, W.A. Groen, Phys. [138] D.A. Bonn et al., Phys. Rev. B 50 (1994) 4051.
Rev. B 49 (1994) 1407. [139] H. He et al., Phys. Rev. Lett 86 (2001) 1610.`[89] D. Pines, P. Nozieres, in: The Theory of Quantum Fluids, [140] S. Chakravarty, H.-Y. Kee, Phys. Rev. B 61 (2000) 14821.
Vol. 1, Addison-Wesley, New York, 1966. [141] E.W. Carlson et al., Phys. Rev. Lett. 83 (1999) 612.[90] W.E. Pickett, Rev. Mod. Phys. 61 (1989) 433. [142] M.R. Norman et al., Phys. Rev. B 57 (1998) R11089.[91] N. Furukawa, T.M. Rice, M. Salmhofer, Phys. Rev. Lett. 81 [143] M.R. Norman et al., Phys. Rev. B 57 (1998) R11093.
(1998) 3195. [144] M.R. Norman et al., Phys. Rev. B 60 (1999) 7585.[92] N. Furukawa, T.M. Rice, J. Phys. Condens. Matter 10 (1998) [145] T. Valla et al., Science 285 (1999) 2110.
L381. [146] T. Valla et al., Phys. Rev. Lett. 85 (2000) 828.[93] C. Honerkamp et al., Phys. Rev. B 63 (2001) 035109. [147] P.V. Bogdanov et al., Phys. Rev. Lett. 85 (2000) 2581.[94] A. Kampf, J.R. Schrieffer, Phys. Rev. B 41 (1990) 6399. [148] A. Kaminski et al., Phys. Rev. Lett. 84 (2000) 1788.[95] A. Kampf, J.R. Schrieffer, Phys. Rev. B 42 (1990) 7967. [149] A. Kaminski et al., Phys. Rev. Lett. 86 (2001) 1070.[96] J.M. Tranquada et al., Nature 375 (1995) 561. [150] M.R. Norman et al., Phys. Rev. B 61 (2000) 14742.

A. Damascelli et al. / Journal of Electron Spectroscopy and Related Phenomena 117 –118 (2001) 165 –187 187
[151] M. Hengsberger et al., Phys. Rev. Lett. 83 (1999) 592. [155] N.P. Armitage et al., Physica C 341–348 (2000) 2083.[152] M. Hengsberger et al., Phys. Rev. B 60 (1999) 10796. [156] N.P. Armitage et al., Phys. Rev. Lett. 86 (2001) 1126.[153] T. Valla et al., Phys. Rev. Lett. 83 (1999) 2085. [157] T. Mizokawa et al., Phys. Rev. B 60 (1999) 12335.[154] R.B. Laughlin, D. Pines, Proc. Natl. Acad. Sci. USA 97 [158] G.A. Sawatzky, private communication.
(2000) 28. [159] F. Ronning, private communication.