from overview to facets and pivoting for interactive...
TRANSCRIPT
From Overview to Facets and Pivoting for Interactive Exploration of
Semantic Web Data
Josep Maria Brunetti1, Roberto García1, Sören Auer2 1Universitat de Lleida
Jaume II, 69. 25001 Lleida, Spain {josepmbrunetti, rgarcia}@diei.udl.cat
2AKSW, Computer Science University of Leipzig, Germany [email protected]
ABSTRACT The proliferation of Linked Open Data on the Web has increased the amount of data available for analysis and reuse. However, casual users find it difficult to explore and use Semantic Web Data due to the prevalence of specialised browsers that require complex queries to be formed and intimate knowledge on the structure of datasets. We address this problem in the Rhizomer tool by applying the data analysis mantra of overview, zoom and filter. These interaction patterns are implemented using information architecture components users are already familiar with but that are automatically generated from data and ontologies. This approach makes it possible to obtain an overview of the dataset being explored using techniques, such as navigation menus, treemaps or sitemaps, which are usually not available in text-based semantic web browsers. From there, users can interactively explore the data using facets. Moreover, facets also feature a pivoting operation, motivated during tests with lay users, that removes the main constraint of most faceted browsers, i.e. the inability to combine filters for differently faceted views to build complex queries. Keywords: Semantic Web, Linked Data, Human-Computer Interaction, Usability, Interaction, User Interface. 1. INTRODUCTION The amount semantic data available in the Web is rapidly increasing, for instance as part of the Linked Open Data cloud (Bizer, Heath & Berners-Lee, 2009). However, from the end-user perspective, the situation continues to be that the available datasets are monolithic and opaque files, which usually can just be explored using complex semantic queries or complex user interfaces. The objective is now to make this data more usable so that non Semantic Web experts can easily grasp what kind of entities are contained in a dataset, how they are interrelated, what are the main properties and values, etc. This will increase the awareness of the semantic data currently available on the Web and also facilitate the development of new and innovative applications on top of this data.

The common approach to make a dataset more usable to a wider range of users is to use some sort of Data Web publishing tool like Pubby1. Such tools usually provide at least an HTML rendering for each resource in the dataset. Each HTML page lists all the properties for the corresponding resource. Pages are interlinked based on the connections among resources and the user can follow HTML links. However, this feature is only useful if the user has some a priori knowledge about the dataset, especially the identifier for a resource of interest. There are very limited ways to obtain an overview of all the kinds of resources in the dataset. Additional tools like Semantic Web browsers can be used. However, as discussed in Section 2, most of them also lack mechanisms that make the dataset structure comprehensible for lay users or help them building complex queries without requiring advanced technical skills.
The proposal we make in this article is to draw from the experience accumulated in the Information Architecture (IA) domain (Morville & Rosenfeld, 2006) as well as to reuse and adapt existing IA components to provide browsing, exploration and visualisation guidance to users. Such IA components are well known to Web users, as they are present in most web pages: navigation bars, facets, sitemaps, breadcrumbs, etc. This approach is implemented in Rhizomer, a tool for publishing Semantic Web datasets while facilitating user awareness of the published content. It is also being evaluated with lay users as part of a User Centred Design development process. Iterative evaluations have motivated and guided the introduction of new features, like pivoting, and validated improvements in the context of a quality in use model (ISO/IEC-25010, 2011).
Evaluations with users show the usefulness of an approach based on interface components that provide an overview of the explored dataset and faceted navigation, especially when dealing with highly structured data like Semantic Web data. Moreover, due to its richness, it also shows that it is fundamental to provide a pivoting operation. Facets are sufficient when the data model is simple, comprising a main type of resources described with a set of attributes and relations that are used to generate the facets. Similarly, facets are suited when the data is explored in a fragmented way, without requiring the combination of constraints on facets for different types of resources, i.e. different faceted views.
However, if full power to explore the data is required, for example, to express complex queries such as “actors from Spain, which have acted in films directed by Woody Allen”, it is necessary to be able to pivot from the actors’ faceted view to the films view. The proposed approach and its implementation in Rhizomer, are among the few Semantic Web data exploration tools offering this functionality. Moreover, as our evaluation shows, Rhizomer provides the best user experience when compared to the two other main tools featuring pivoting.
The remainder of this paper is organised as follows. First, related work is presented in Section 2. Then, the proposed approach is detailed in Section 3 and the results of its evaluation with lay users are discussed in Section 4. Finally, conclusions and future work are presented in Section 5. 2. RELATED WORK Dadzie and Rowe (2011) present the most exhaustive and comprehensive survey to date of existing approaches to visualising and exploring Semantic Web data, particularly Linked Data. This survey is used to situate our contribution, implemented in a tool called Rhizomer and available online2. 1 Pubby – A Linked Data Frontend for SPARQL Endpoints, http://www4.wiwiss.fu-berlin.de/pubby/ 2 http://rhizomik.net/rhizomer/
First of all, Rhizomer can be classified mainly in the category of text-based visualisation tools, though it also includes graphical representations for dataset overviews. However, it is important to note that it is not intended as a Linked Data browser. It is geared towards publishing a dataset and generating the user interface to improve user interaction for that specific dataset. It is possible to follow links to external resources and browse their descriptions in a transparent way. However, the whole user interface is not generated for the datasets containing those descriptions. This can be pointed as one of the main drawbacks of Rhizomer, when compared to other text-based visualisation tools. This shortcoming is mitigated by the fact that Rhizomer is intended for dataset publishing and not for open Data Web browsing. Moreover, for multiple datasets published using Rhizomer, it is possible to navigate across them leveraging its user interface without this shortcoming. In any case, future work includes exploring to what extent it is possible to generate Rhizomer user interfaces on the fly, as users wander from dataset to dataset.
On the other hand, one of the main conclusions drawn from the Dadzie and Rowe survey is that just one of the analysed text-based tools, PiggyBank (Huynh, Mazzocchi, & Karger, 2007), is suited for lay users. However, PiggyBank does not provide an overview of the explored dataset beyond a list of classes and provides only limited exploration based on facets without pivoting. An evolution of PiggyBank is Parallax, which is analysed later and does feature pivoting. If tools with visual representations are also considered, most of them are only partially considered to be suitable for lay users.
Tools with visual representations fully targeting lay users are DBpedia Mobile (Becker & Bizer, 2009) and IsaViz (Pietriga, 2006), the former is just suited for the exploration of spatial resources and the later is based on graph representations, which are usually considered to be inconvenient from the user experience point of view (schraefel & Karger, 2006). Consequently, its end user suitability is one of the main features of Rhizomer since it is a tool that focuses on lay users and also has been evaluated with lay users.
Another significant contribution is that none of the text-based tools analysed in the survey provides a high level overview of the datasets being browsed. In this respect, Rhizomer provides, as detailed in Section 3, text-based and graphical overviews of the dataset classes and topics structure. When comparing Rhizomer with tools offering visual representation, just RelFinder (Heim, Hellmann, Lehmann, Lohmann, & Stegemann, 2009) provides a data overview just for the relations among a reduced set of resources.
Another contribution to be highlighted is that none of the analysed tools provides the pivoting operation as defined by Sacco and Tzitzikas (2009, p. 83) “a way to restart a search from the results of a first search”. This operation is particularly important in the context of interactive semantic data exploration. Filtering just at the level of one class, using for instance facets, is not sufficient for many uses. Users should be capable of building queries that mimic natural language relative sentences like “photos of buildings in the town, where the ICFCA conference took place in 2004”. In this case, the related classes are cities and conferences, the user must be able to filter both and relate them through a pivoting operation.
There are some tools outside the Semantic Web that provide pivot-like operations. They have been applied mainly in collaborative web sites (Millen, Feinberg & Kerr, 2006) (Zhou, Oostendorp, Hess & Resnick, 2008). Their main limitation is that they are tailored to specific application domains and data models. There are other tools that might seem to support this

operation, like Microsoft’s PivotViewer3. However, in this case, they use the term “pivot” to refer to changing the view on a particular set of resources using their facets, for instance from “show grouped by year” to “show grouped by country”.
Despite not being considered in Dadzie and Rowe survey, there are some tools that provide pivot-like operations. One of the first tools to offer this functionality was Parallax4. It is tied to Freebase but there is also a derived tool called Sparallax5 that can work on top of SPARQL endpoints. However, the latter’s performance is very limited and does not allow the exploration of really large-scale datasets. Moreover, it is not clear whether it is a tool suited for lay users. The first implementation of the pivoting operation in Rhizomer mimicked at the Parallax user interface and the user tests showed that the widget providing the pivot operation, a box with an arrow and links to related entities, is usually unnoticed by users who focus on the facets. They do not notice the pivoting box because it is on the opposite side of the screen. Those users that notice it, interpret it as a way to restart the exploration from a different entity. Finally, though Parallax and Sparallax provide pivoting, they do not provide an overview feature.
Another tool that provides pivoting but is based on a graphical representation is gFacet (Heim, Ziegler, & Lohmann, 2008). It is possible to filter one class and then pivot to a related class keeping those filters for the instances of the second class connected to the filtered instances in the first class. However, the use of a graphical representation makes the user interface difficult to manage, especially for lay users not aware of the underlying graph data model. This is due to the fact, that boxes and links easily fill the screen and there is not a contextualisation that helps users understand what they are asking through the user interface, i.e. the underlying query that has been built through their interaction. Another shortcoming is that there is not an initial overview that helps users understand the shape of the dataset they are interacting with and where they can start from.
Explorator (Araújo, Schwabe, & Barbosa, 2009) is also a tool that provides functionality similar to pivoting. However, this is even a more demanding tool with regard to the pre-requisite of Semantic Web knowledge. For instance, the tool uses concepts at the user interface such as RDF triples so the user can pose restrictions at the subject, predicate or object level. Moreover, in addition to facets, it is also possible to combine the sets of resources resulting from pivoting using set operations like union, intersection and difference. This makes it possible to build really complex queries using Explorator. However, the price is that the tool becomes too complex for lay users. Another shortcoming is that there is little feedback about the underlying dataset structure, just a list of classes or properties in the dataset.
Finally, another tool that provides functionality similar to pivoting is tFacet (Brunk & Heim, 2011). It is based on what the authors call hierarchical facets6. However, these are really subfacets, i.e. facets of the entities accessible through a facet are shown in a hierarchical way under the “superfacet”. Unfortunately, this becomes impractical when traversing many different classes as the tree of facets becomes difficult to manage. Consequently, this tool cannot be considered as suitable for lay users in its current state. Moreover, the tFacet approach constrains the kind of queries to be built more than pivoting. If the user starts from a class, the queries are 3 http://www.microsoft.com/silverlight/pivotviewer/ 4 http://www.freebase.com/labs/parallax/ 5 http://sparallax.deri.ie/ 6 Hierarchical facets as recognised in the literature are facets where the hierarchy is in the values of the facet, c.f. Flamenco (Hearst, 2006).

about retrieving resources of that class that satisfy the filters for direct properties or properties of the classes related to it. It is not possible to switch to a different class and retrieve its instances as query result.
3. APPROACH Our starting point is the fundamental set of tasks for data analysis proposed by Shneiderman (1996). In the following, we present each task associated with the chosen interaction pattern and Information Architecture component (Morville & Rosenfeld, 2006) to implement the pattern:
● Overview: obtain a full picture of the data set at hand. At this stage we propose to apply the Global Navigation interaction pattern7 or the Directory Navigation pattern8. In Information Architecture terms, the former can be implemented using navigation menus users are used to see at the top or on the left of web sites. The later sitemaps that can be represented using text or graphically, for instance using TreeMaps (Shneiderman, 1992).
● Zoom & Filter: zoom in on items of interest and filter out uninteresting items. Here the proposal is to employ some form of Faceted Navigation9. Once we have zoomed in by selecting the kind of things we are interested in from the navigation bar, facets are the Information Architecture components that help users to filter out those data items that are not interesting to them.
● Details: after zooming and filtering the user arrives at concrete resources of interest. At this point, the user can obtain details for those resources, which in the case of Semantic Web data means to retrieve properties for the resources plus those properties pointing to them. This is related to the Details on Demand10 interaction pattern and can be implemented via a simple list of properties and values of the resource of interest or through a specific visualisation tailored to the kind of resource at hand, e.g. a map for geo-located resources.
Our proposal is to elaborate these interaction patterns in the context of semantic data. We have chosen these patterns because they are simple and very common so users are very comfortable using them. They are part of the “culture” about how information is presented in the Web so they can be easily learned. However, though they look like the common ones, these ones should be capable of giving access to the richer semantic data they are built on top of.
The aim is to make it possible that lay users, not just Semantic Web technologies experts, can reach the Semantic Web. This does not necessarily mean that any user will directly use these interfaces; usually it is about making it easier for application developers to discover and reuse semantic data while developing innovative products that ultimately spread the benefits of semantic data through the Web. For instance, using the Personas approach (Garrett, 2010), we can illustrate the target audience as shown in Table 1.
Table 1. Personas illustrating the intended users
7 http://www.welie.com/patterns/showPattern.php?patternID=main-navigation 8 http://www.welie.com/patterns/showPattern.php?patternID=directory 9 http://www.welie.com/patterns/showPattern.php?patternID=faceted-navigation 10 http://www.welie.com/patterns/showPattern.php?patternID=details-on-demand

Christina Warren is a 23 years old journalist that has recently finished her studies and is currently in charge of the Films section of an online journal. She likes to write about curious facts like “who appears most in films where Woody Allen is both the director and an actor”. However, these kinds of things are really difficult to find out using resources like Wikipedia or IMDb. (Picture by flickr.com/photos/electricnerve)
Michael Harper is a 30 years old freelance developer that creates and commercialize mobile applications using online application stores. He works mainly in solo projects and without any financial support. He is currently developing a mobile application that supports bird watching and as a way to reduce development costs to a minimum he is trying to reuse as much as possible available data about bird species, habitats, etc.
We are currently testing all these interaction patterns in the semantic data-publishing tool
Rhizomer11. It features navigation menus and sitemaps that are automatically generated and maintained from analysing the underlying thesaurus and ontologies as well as the structuring and instantiation of the navigation bars. Navigation menus and treemaps are described in Section 3.1. A similar approach is followed for generating facets for each kind of entity in the data set. Facets are described in Section 3.2. Some facets, when they connect to other classes, also feature a “pivot” operation, detailed in Section 3.3. This section also presents the “breadcrumbs” that are generated to help contextualise the user. Fig. 1 shows all these information architecture components as they appear in Rhizomer.
11 http://rhizomik.net/rhizomer/

Fig. 1. Screenshoot of Rhizomer, at the top there is the navigation menu and on the left the generated facets, some of them featuring the pivot operation. Just above the details area there are the “breadcrumbs” 3.1 Overview Overview is the first user task when dealing with a dataset. The objective is that the user is capable of getting an idea about the overall structure of the dataset. In the case of Semantic Web and Linked Data dataset, this overview is usually helping to identify the main types of entities in the dataset, the most instantiated classes, and how they are structured, as well as their hierarchical structure. In addition to an overview from a class instantiation point of view, it is also possible to build an overview of how data is classified into topics coming from a thesaurus. In this case, we consider the “broader than” and “narrower than” relations among topics. To gain this overview, our proposal is to employ the Global Navigation or the Directory Navigation interaction pattern. The former is provided by navigation menus, detailed in Section 3.1.1., the later through graphical representations like treemaps, described in Section 3.1.2. 3.1.1 Navigation Menus Navigation menus, in the case of websites, let users navigate through different sections and pages of the site. They tend to be the only consistent navigation element, being present on every page of the site.
Traditionally, user-centred design techniques like Card Sorting (Spencer, 2009) are used to develop the navigation menus of web sites. This technique requires much time and effort from developers and most of this effort is wasted as soon as the structure of the menu is established and fixed in a menu that becomes something static. If new kinds of items are introduced or a part of the content becomes more relevant, the Card Sorting should be repeated, at least in part.
In the case of web sites build on top of semantic data we have the opportunity to automate part of the process of generation and maintenance of the navigation menus. This is possible because semantic data is structured by thesauri and ontologies, which hierarchically organise the kinds of things described in the dataset. They specify all the classes or concepts12 but also which entities belong to a certain class or are related to a certain concept.
Consequently, if there are fewer instances of a class or related concepts, or none not at all, the class or concept should be less relevant in the menu bar. On the contrary, those that do have many members should be shown prominently in the menu bar. To achieve this, we obtain the hierarchical structure of the classes or concepts instantiated or used in the dataset. For each class it is also computed the number of instances and for concepts how many times is referred as the subject for a resource. All this information is retrieved using the SPARQL.
Then, the hierarchy is flattened to the amount of levels required because this component can generate both global and local menus, i.e. a menu for the whole dataset or just for a subset of it. The site administrator can also configure some parameters: the number of levels in the menu, the number of items in each level, the order of items (alphabetically or by number of instances) and a list of classes or concepts to omit.
According to these parameters, this component generates the menu applying a recursive algorithm that mainly performs two operations:
12 SKOS Simple Knowledge Organization System, http://www.w3.org/2004/02/skos/

● Split the concepts or classes with an extensive number of members in their narrower related concepts or subclasses.
● Group those with few members into a broader concept or superclass. For instance, Fig. 2 illustrates how the seven slots defined for a submenu corresponding to the
DBpedia class “Species” are filled starting from the original class hierarchy and instantiation counts. At first, there are just three slots occupied, the direct subclasses of “Species”, so the most instantiated one, “Eukariote” is split and its direct subclasses become direct subclasses of “Species”. They occupy two additional slots, three are still free, so the most instantiated one of the four is split, i.e. “Animal”. It has more than four direct subclasses so now it is necessary to merge the less instantiated classes until there are just four direct subclasses. The class resulting from the merging is automatically labelled “Other Animal”. Fig. 3 shows the full navigation menu generated for DBpedia, with all the submenus expanded. Note that users will just see at most one submenu expanded at a time, i.e. the one they have hovered.
Eukariote143504
Species146082
Plant39528
Animal96534
Bacteria163
Archaea164
Fish11134
Insect36245
Bird12334
...
Bacteria163
Archaea164
Mollusca8677
Mammal8274
...
Fish11134
Insect36245
Bird12334
Plant39528
Other Animal32881
Species146082
Fig. 2. Generating a navigation submenu for DBpedia species with seven slots (left original, right result)

Fig. 3. The full navigation menu for DBpedia, with all submenus expanded This approach allows showing the navigation bar that best fits the data in the dataset at each
particular moment. For instance, if the dataset changes from containing mainly data about projects to mainly about publications, the menu would change accordingly to show the part of the dataset structure about publications more prominently. More details about the implementation of navigation menus are available from (García, Brunetti, López-Muzás, Gimeno & Gil, 2011). 3.1.2 Treemap Navigation menus are quite effective because lay users are comfortable with them, most website feature them and they are used to interacting with them. However, they just provide and overview of the most frequent classes, those more instantiated. In order to gain a more detailed overview, web sites usually apply the Directory Navigation pattern through different sorts of sitemaps.
However, such detailed overviews are difficult to generate with large heterogeneous semantic datasets, which is the typical case with Linked Data. A common approach to obtain an overview and support the exploration of large datasets is to structure them hierarchically (Elmqvist & Fekete, 2010). Hierarchies allow users to visualize different abstractions of the underlying data at different levels of detail. Visual representations of hierarchies allow creating simplified versions of the data while still maintaining the general overview.
There are several techniques for visualizing hierarchical structures. One approach to provide high-level overviews is Treemaps (Shneiderman, 1992). Treemaps use a rectangle to show the tree root and its children. Each child has a size proportional to the cumulative size of its descendants. They are a good method to display the size of each node in a hierarchy. However, since treemaps are not so effective if the user wants to perform an exhaustive exploration or if the item the user is looking for is a known one, we complement treemaps with more classical overview components like site map and site index (Goldberg & Helfman, 2005).
We have implemented a Treemap component using the Javascript InfoVis Toolkit library, as shown in Fig. 4. The Treemap shows an overview of the class hierarchy in the dataset and it is possible to interact with it. Users can zoom in and zoom out to go deep into the class hierarchy. This way, the Treemap visualization supports the overview and zoom tasks proposed by Shneiderman.
The starting point to generate the Treemap for a dataset is also, like for navigation menus, a data structure capturing how the classes instantiated by the dataset are hierarchically structured, plus how many direct instances does each class have. In this case, however, this structure is not flattened but reproduced as a Treemap with sizes proportional to the number of instances. Just classes too small to be represented in the Treemap are grouped and labelled “Others”.

Fig. 4: Treemap providing and overview of the DBPedia dataset an information about the size of each of the classes structuring this dataset (it is interactive so users can gain access to classes deeper in the hierarchy than the two first levels shown in the figure).
3.1.3 Site Map and Site Intex The navigation menus presented in Section 3.1.1 are quite effective because lay-users are comfortable with them, most website feature them and they are used to interacting with them. However, they just provide an overview of the most frequent classes, those more instantiated. Treemps provide a more detailed overview of the dataset, however they still require a lot of exploratory interaction from the user and, because they are less common, they are harder to use.
In order to gain a more detailed overview, many web sites usually apply the Directory Navigation pattern through different sorts of sitemaps. Site maps act as a navigation aid by providing an overview of the site's content at a single glance. Moreover, they are widely use so they are easier to use, though they do not provide the visual feedback about the significance of the different parts of the dataset that is provided by Treemps.
HTML site maps are designed to help users find content on the website. A site map is a web page that lists all the pages of a website, normally organized hierarchically. In the case of large sites, instead of containing links to all the pages, they can list the main pages (e.g. categories) of the site. When the site contains many levels in the structure and many elements on each level the site map functions as a navigation alternative to navigation menus.
We have implemented two different versions of the sitemap and users can switch between them. The first one reflects the original hierarchy of the dataset. It is showed as a tree with multiple levels and the users can expand it. The second one is related with the structure of navigation menus, which has been generated from the original hierarchy. It complements the main site navigation and users can find there options that were are not directly available from navigation bars, as shown in Fig. 5.

Fig. 5: Summarised sitemap for the DBPedia datasetTreemap for gaining overview on a dataset in Rhizomer.
In addition to site maps and Treemaps, evaluations with users show that there are tasks, like
known item searches, where they are more confortable with site indexes (Brunetti, 2013). A site index is a navigational and informational tool that lists all the pages or categories alphabetically. Sometimes users spend a lot of time looking through the site map. While a site map provides a general view of the overall site contents, an A-Z index provides access to particular content. An alphabetical list can better suit users' mental model when they are searching for a specific page. However, while site maps can give users context, site indexes provide no context. Non-related categories appear in the site index without giving users any additional information. Therefore, we have implemented the site index so that it provides also context information of each class. When the user moves the pointer over an element an overlay appears showing its parent and its subclasses, as shown in Fig. 6.

Fig. 6: Site index for the DBPedia dataset with A-Z entry points and popups that contextualises the classes in the underlying class hierarchy.
3.2 Facets Users do not always know exactly what they are looking for and, sometimes, they do not even know what its name is. Sometimes they are unfamiliar with the domain or they want to learn about a certain topic. This is particularly true when exploring Semantic Web datasets. In these cases, exploratory search is a strategy that allows users to refine their search by successive iterations. An exploratory interface such as faceted browsing allows users to find information without a priori knowledge of its schema.
With navigation menus or Treemaps we can make the user aware of the hierarchical structure of a dataset but, once they choose the class of things they are interested in, they face the barrier of not knowing how they are described. In other words, what are the main properties that describe them, which ones are the more relevant for that particular kind of things, the range of values they have in that particular case, etc.
Faceted navigation is an exploratory technique for navigating a collection of elements in multiple ways, rather than a single and pre-determined order. Facet browser interfaces provide a user-friendly way to navigate through a wide range of data collections. Traditional facet browsers relied on manual identification of the facets and on previous knowledge of the target domain.
When dealing with semantic data, it is possible to automate this process and a semantic faceted browser will be able to handle any RDF dataset without any configuration requirements. Since semantic data facilitates integrating data from different of sources, we cannot assume a single fixed schema for all data. Consequently, a semantic data faceted browser should be scalable and generic, not depending on a particular dataset structure.
To compute the facets, Rhizomer performs SPARQL queries that retrieve all the properties for each class, which will become the facets when exploring it, the frequency of each property for the given class and the number of different values that each property can have for the given class. The frequency and the number of different values are used to help decide if a property is worth including it as a facet for the corresponding class faceted view. For instance, a property that is used in 10% of the class instances descriptions, that has just one possible value or that has a different value for each instance is not very useful in the faceted view.
For datasets with many classes and properties, these queries become quite easily costly to compute and delay too much user interaction. Consequently, they are just calculated the first time Rhizomer is deployed on a dataset and stored in a data structure. They are then updated whenever the dataset is changed through Rhizomer in an incremental way.
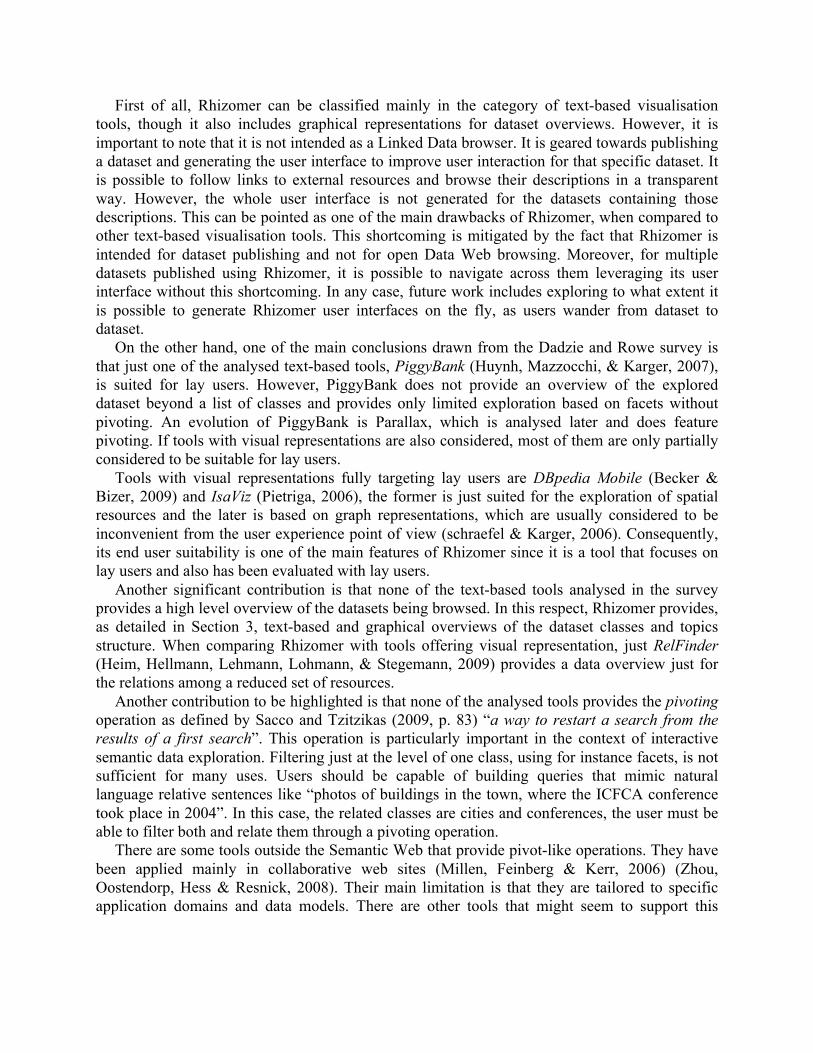
However, there are other queries that are generated while the user interacts through the facets. For instance, when the users asks for the most common values of a class facet. These common values are shown, in increments of 5 values, as part of the facet when the user clicks on “Common values” as shown in Fig. 7. This is not just the list of the most common values for that particular class and property. Other previous restrictions set by the user through other facets should be also taken into account. Consequently, these are the most common values for that facet for the set of resources currently selected.
Moreover, if the user sets further restrictions, all the lists of common values should be updated. This can delay a lot user interaction so this, in conjunction with the interferences set by previous filters, is the main reason to avoid pre-computing the list of common values and to do so at interaction time. In any case, to reduce the common values to be updated after each user interaction, all facets are initially shown with the list of common values collapsed. The are only expanded as a result of user interaction and just those that have been expanded are updated when the user sets constraints by checking facet values.
Fig. 7. Graphical representation of a facet in Rhizomer showing 5 common values and search box with autocomplete
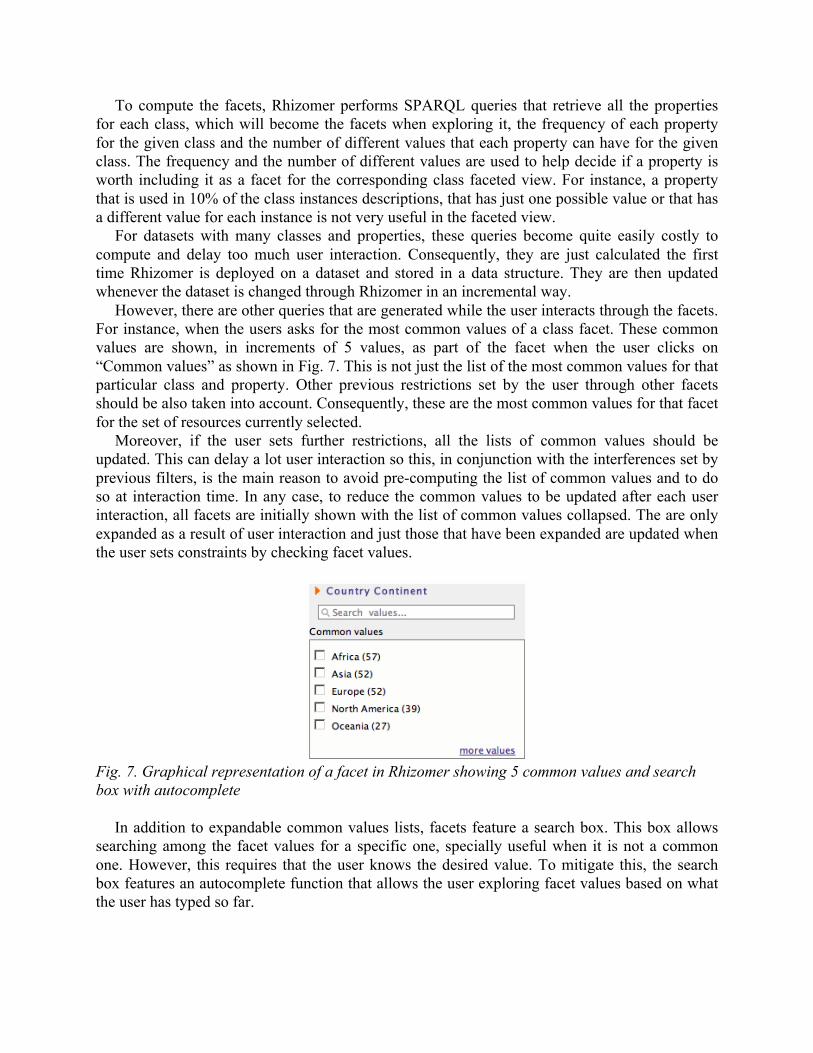
In addition to expandable common values lists, facets feature a search box. This box allows
searching among the facet values for a specific one, specially useful when it is not a common one. However, this requires that the user knows the desired value. To mitigate this, the search box features an autocomplete function that allows the user exploring facet values based on what the user has typed so far.
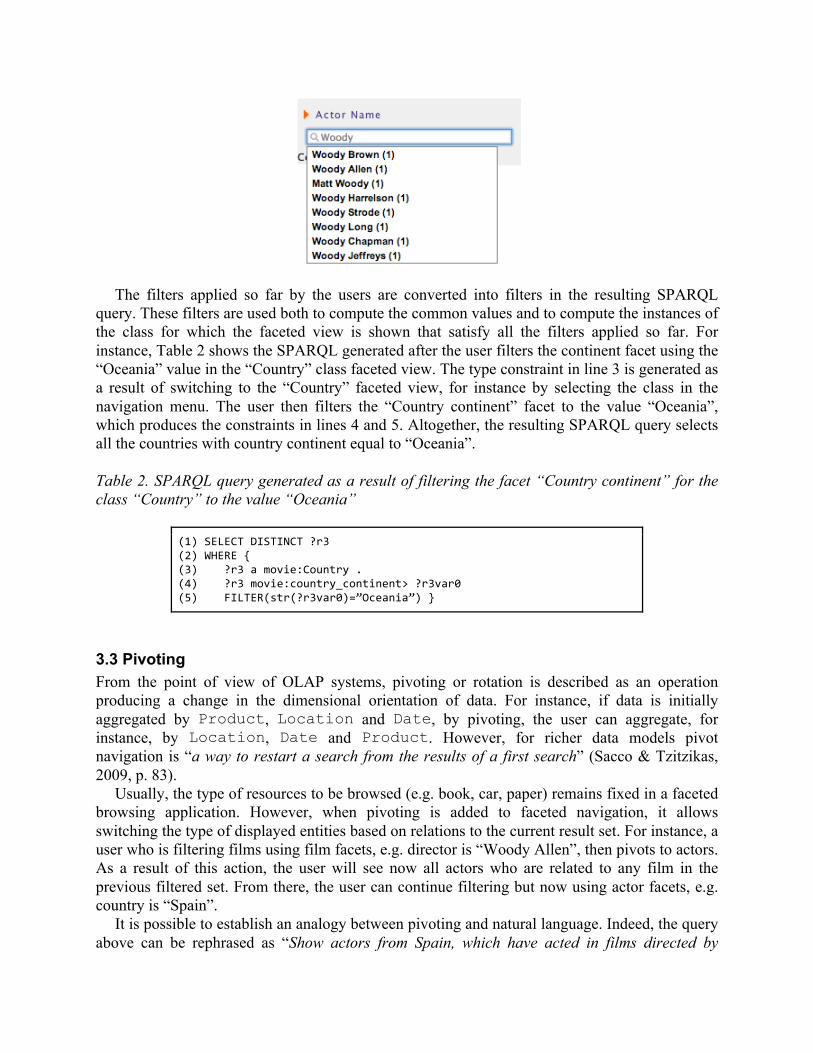
The filters applied so far by the users are converted into filters in the resulting SPARQL
query. These filters are used both to compute the common values and to compute the instances of the class for which the faceted view is shown that satisfy all the filters applied so far. For instance, Table 2 shows the SPARQL generated after the user filters the continent facet using the “Oceania” value in the “Country” class faceted view. The type constraint in line 3 is generated as a result of switching to the “Country” faceted view, for instance by selecting the class in the navigation menu. The user then filters the “Country continent” facet to the value “Oceania”, which produces the constraints in lines 4 and 5. Altogether, the resulting SPARQL query selects all the countries with country continent equal to “Oceania”. Table 2. SPARQL query generated as a result of filtering the facet “Country continent” for the class “Country” to the value “Oceania”
(1) SELECT DISTINCT ?r3 (2) WHERE { (3) ?r3 a movie:Country . (4) ?r3 movie:country_continent> ?r3var0 (5) FILTER(str(?r3var0)=”Oceania”) }
3.3 Pivoting From the point of view of OLAP systems, pivoting or rotation is described as an operation producing a change in the dimensional orientation of data. For instance, if data is initially aggregated by Product, Location and Date, by pivoting, the user can aggregate, for instance, by Location, Date and Product. However, for richer data models pivot navigation is “a way to restart a search from the results of a first search” (Sacco & Tzitzikas, 2009, p. 83).
Usually, the type of resources to be browsed (e.g. book, car, paper) remains fixed in a faceted browsing application. However, when pivoting is added to faceted navigation, it allows switching the type of displayed entities based on relations to the current result set. For instance, a user who is filtering films using film facets, e.g. director is “Woody Allen”, then pivots to actors. As a result of this action, the user will see now all actors who are related to any film in the previous filtered set. From there, the user can continue filtering but now using actor facets, e.g. country is “Spain”.
It is possible to establish an analogy between pivoting and natural language. Indeed, the query above can be rephrased as “Show actors from Spain, which have acted in films directed by
Woody Allen”. The idea of pivot is reflected by the fact that the set of “Spanish actors” in the main sentence also appears in the relative sentence as the relative pronoun “which”. The relative pronoun points to the facet to browse for a pivot, in this case “acted in”.
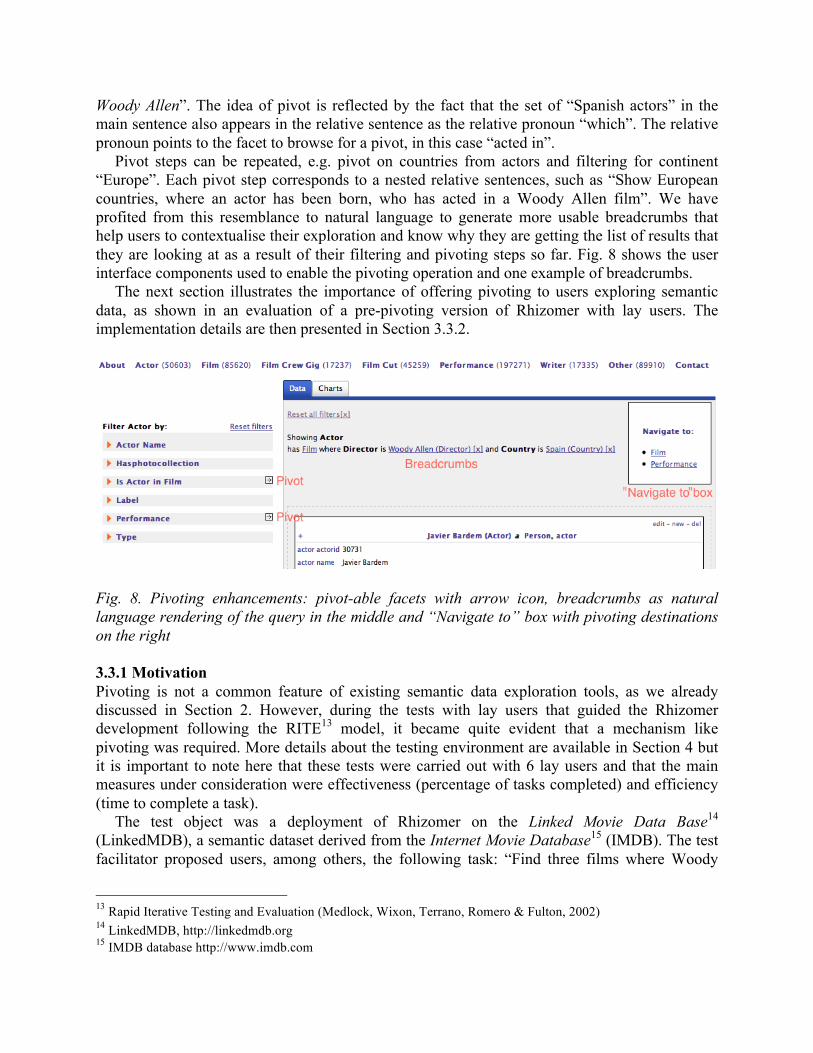
Pivot steps can be repeated, e.g. pivot on countries from actors and filtering for continent “Europe”. Each pivot step corresponds to a nested relative sentences, such as “Show European countries, where an actor has been born, who has acted in a Woody Allen film”. We have profited from this resemblance to natural language to generate more usable breadcrumbs that help users to contextualise their exploration and know why they are getting the list of results that they are looking at as a result of their filtering and pivoting steps so far. Fig. 8 shows the user interface components used to enable the pivoting operation and one example of breadcrumbs.
The next section illustrates the importance of offering pivoting to users exploring semantic data, as shown in an evaluation of a pre-pivoting version of Rhizomer with lay users. The implementation details are then presented in Section 3.3.2.
Fig. 8. Pivoting enhancements: pivot-able facets with arrow icon, breadcrumbs as natural language rendering of the query in the middle and “Navigate to” box with pivoting destinations on the right 3.3.1 Motivation Pivoting is not a common feature of existing semantic data exploration tools, as we already discussed in Section 2. However, during the tests with lay users that guided the Rhizomer development following the RITE13 model, it became quite evident that a mechanism like pivoting was required. More details about the testing environment are available in Section 4 but it is important to note here that these tests were carried out with 6 lay users and that the main measures under consideration were effectiveness (percentage of tasks completed) and efficiency (time to complete a task).
The test object was a deployment of Rhizomer on the Linked Movie Data Base14 (LinkedMDB), a semantic dataset derived from the Internet Movie Database15 (IMDB). The test facilitator proposed users, among others, the following task: “Find three films where Woody
13 Rapid Iterative Testing and Evaluation (Medlock, Wixon, Terrano, Romero & Fulton, 2002) 14 LinkedMDB, http://linkedmdb.org 15 IMDB database http://www.imdb.com

Allen is the director and also an actor”. The full findings derived from the test are available from (Brunetti & García, 2011), while the ones relevant to motivating the inclusion of the pivot operation can be summarised as follows:
● None of the test participants was able to complete the task on his own; all of them needed some guidance from the facilitator.
● Surprisingly, all participants began the navigation from actors instead of films (the directors were not so evident in the navigation menu, they appear in the second level because they are few compared to other classes).
When analysing the evaluation results, it became evident that the fact that users started from actors was the reason why they required assistance. They arrived at a dead-end after filtering actors by name to just “Woody Allen”. There was no way to “switch” to the set of films he has acted on and then filter it using the director facet.
The most direct solution to this problem is to add to each class faceted-view some derived facets, i.e. facets from other classes that are directly connected to the current one through a property. For instance, add the “directed by” facet to actors derived from the “director” facet of the films they have acted in. This is similar to the tFacet approach analysed in Section 2.
However, this approach does not scale well because the number of facets for each class gets easily unmanageable and derived facets quite easily lose their context and become confusing. For instance, how to distinguish between the “country” facet for author birthplace and a “country” facet derived from the country of the films the actors has participated in. This motivated the development of a pivot operation, which works as described in the previous section and is implemented as shown in the next section. 3.3.2 Implementation The first step to implement pivot-enabled facets is to determine which ones should provide pivot. Properties with literal values, for a given class, result in facets that do not provide pivoting. On the other hand, properties that connect to other resources allow pivoting. In this case, it should be determined to which class the facet links. The faceted view for that class will become the new view when pivoting is performed. Moreover, being able to show in the user interface where a facet does pivot to, helps users understand the nature of this conceptually more complex interaction.
This distinction is made by analysing the underlying dataset and ontologies. It results in an additional facet characteristic: its range. The procedure to determine a facet range is the following:
1. Check if, for the given class and property, there is a restriction at the ontology level that explicitly defines the property range. This range is selected as the facet range (can be either a class, a literal or a data type like integer or date).
2. If no restriction is found in the previous step, it is checked if the property has a defined range at the schema level, which becomes the property range.
3. Finally, if there is no property range, the dataset is analysed and the 5 most common values for the class and property are retrieved. They are checked to determine whether they are resources or not. a. If all the 5 values are resources, then the dataset is queried to determine the most
instantiated classes by the values of the property. Then, the most specific superclass of these classes is computed. The result is then considered the range of the facet and that class will become the new faceted view when the user pivots the facet.

b. If not all 5 values are resources, their data type, if present, is retrieved or computed by
trying to parse their values as an integer, double or date. By default, if it is not possible to determine a more specific data type, the value is considered a string. As no pivoting is enabled for this kind of facets, the range might be used to create specific facets for numeric values (like histograms with range selectors) or calendars.
Once the facets that should provide pivoting are determined, this option is offered to users as part of the facet using an arrow shaped link. Rhizomer keeps track of all pivoting operations and records the initial class, the pivot property and the target class. Moreover, when pivoting to the new class, the restrictions applied to the previous ones are kept so they user can combine restrictions for different interrelated classes and build much more complex SPARQL queries.
For instance, when pivoting from films to actors, after filtering films for which the director is the resource “Woody Allen (Director)”, the constraints capturing this switch are introduced in the generated query shown in Table 3 in lines 3-4. A new variable r2 is introduced together with its type, i.e. the range of the originating facet. Moreover, the link from the previous variable r1 to the new one is established using the pivoted property. Finally, the selected variable is the new variable as the focus has changed from films to actors. Fig. 9 illustrates the different sets of resources that are selected from Films by filtering those directed by Woody Allen and then the set of Actors selected after pivoting from the previous set of Films through the Film facet corresponding to the “actor” property.
Table 3. Generated SPARQL query after filtering films with director Woody Allen and then pivoting to actors through the property movie:actor (1) SELECT DISTINCT ?r2 (2) WHERE { (3) ?r2 a movie:actor . (4) ?r1 movie:actor ?r2 . (5) ?r1 a movie:film . (6) ?r1 movie:director <http://data.linkedmdb.org/resource/director/8501> }
Actor DirectorFilm directoractor
Woody Allen (director)
Films directed by Woody Allen
Actors in Films directed by
Woody Allen
Fig. 9. Set of Films after filtering those directed by Woody Allen and set of Actors selected after pivoting from the previous set of Films through the Film facet “actor”
Finally, the pivot operation also motivated us to consider some sort of breadcrumbs that help
contextualise user interaction. Previous tests with users showed that they got lost easily after moving around the underlying graph models. Breadcrumbs should show the path that the user

has followed to arrive to the set of results that is currently displayed. Users should also be capable of using the breadcrumbs to undo previous filtering and pivoting steps. Currently, breadcrumbs have been implemented as a natural language representation16 of the SPARQL query generated as a result of the user interaction so far. Fig. 8 shows on the left part the facets with the pivoting option; in the centre the breadcrumbs; and on the right a list of classes for which it is possible to pivot to from the current faceted view, i.e. and alternative to the pivot arrow shown in the pivoting facets. 4. EVALUATION This section summarises the results of the first round of user testing after integrating the pivoting functionality into Rhizomer. The evaluation approach is inspired by the Rapid Iterative Testing and Evaluation (RITE) Method (Medlock, Wixon, Terrano, Romero & Fulton, 2002), which involves testing with small groups as part of an iterative development process. The tests were conducted at the UsabiliLAB17, where sessions were registered using Morae Recorder together with Morae Observer18 to analyse test data.
The aim of the test was mainly to validate that the introduction of pivoting solves the problems highlighted in previous evaluations, as described in Section 3.3.1. Six users that were not involved in the previous evaluation rounds were recruited. Moreover, one of the tasks, Task 2, was identical to one used in previous evaluation rounds. It is used to test if pivoting has improved efficiency and effectiveness. The complete set of tasks is shown in Table 4. Table 4. Tasks posed to users during the pivoting testing round. Task 1 Find 5 films with "Orlando Bloom" as actor.
Task 2 Find 5 films with "Clint Eastwood" both as director and actor.
Task 3 Who has directed more films in countries located in "Oceania".
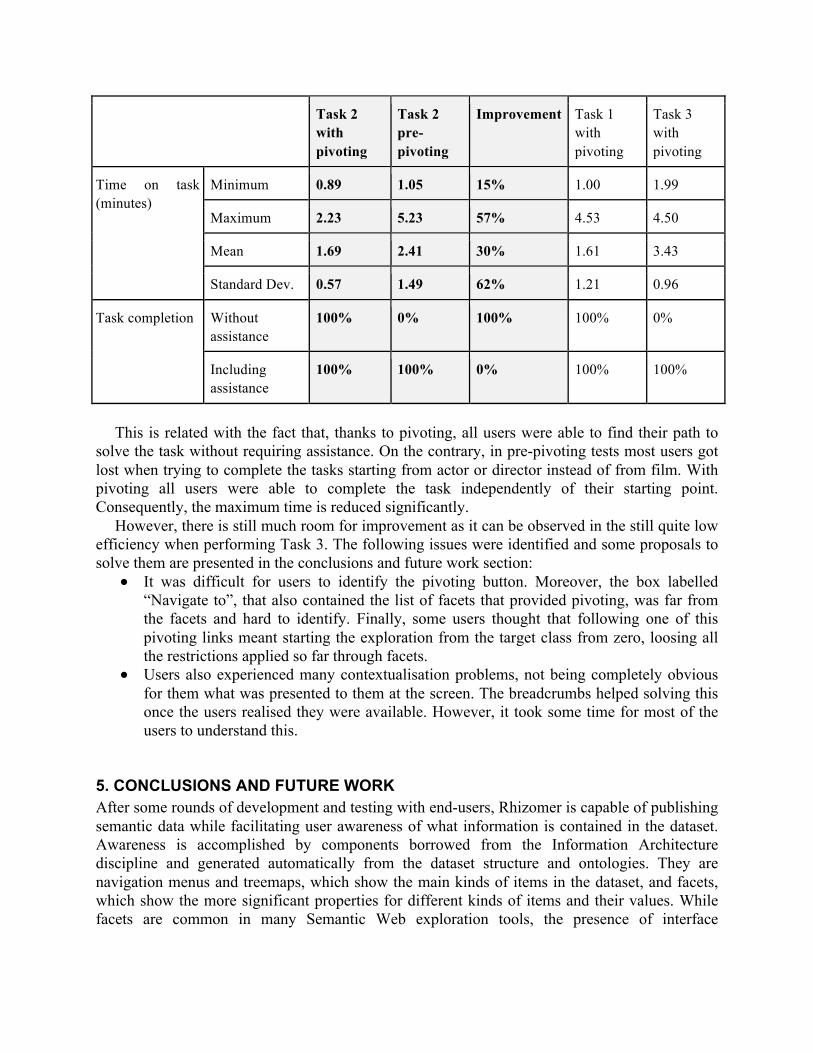
The efficiency results, i.e. time to complete the task, are shown in Table 5. There are,
highlighted, the results for Task 2 with pivoting, prior to pivoting and the observed improvement. Efficiency for Tasks 1 and 2 is also presented. More details about previous evaluations are available in (García, Gimeno, Perdrix, Gil, Oliva, López, Pascual & Sendín, 2010).
The first finding has been that the introduction of pivoting corresponded to a great increase of efficiency, with a 30% reduction in the mean time necessary to complete Task 2. However, the most promising outcome is that the biggest improvement has been in the reduction of the maximum time on tasks, with 57% improvement. From the point of view of effectiveness, it is important to note that all users completed Task 2 without facilitator help, while in the previous iteration, for the same task, all users required facilitator assistance. Table 5. Efficiency and effectiveness measures for the tasks in Table 4 plus comparison with pre-pivoting results for Task 2. 16 http://sparql2nl.aksw.org 17 UsabiliLAB, http://griho.udl.cat/en/infraestructures/usabililab.html 18 Morae, http://www.techsmith.com/morae.html
Task 2 with pivoting
Task 2 pre-pivoting
Improvement Task 1 with pivoting
Task 3 with pivoting
Time on task (minutes)
Minimum 0.89 1.05 15% 1.00 1.99
Maximum 2.23 5.23 57% 4.53 4.50
Mean 1.69 2.41 30% 1.61 3.43
Standard Dev. 0.57 1.49 62% 1.21 0.96
Task completion Without assistance
100% 0% 100% 100% 0%
Including assistance
100% 100% 0% 100% 100%
This is related with the fact that, thanks to pivoting, all users were able to find their path to
solve the task without requiring assistance. On the contrary, in pre-pivoting tests most users got lost when trying to complete the tasks starting from actor or director instead of from film. With pivoting all users were able to complete the task independently of their starting point. Consequently, the maximum time is reduced significantly.
However, there is still much room for improvement as it can be observed in the still quite low efficiency when performing Task 3. The following issues were identified and some proposals to solve them are presented in the conclusions and future work section:
● It was difficult for users to identify the pivoting button. Moreover, the box labelled “Navigate to”, that also contained the list of facets that provided pivoting, was far from the facets and hard to identify. Finally, some users thought that following one of this pivoting links meant starting the exploration from the target class from zero, loosing all the restrictions applied so far through facets.
● Users also experienced many contextualisation problems, not being completely obvious for them what was presented to them at the screen. The breadcrumbs helped solving this once the users realised they were available. However, it took some time for most of the users to understand this.
5. CONCLUSIONS AND FUTURE WORK After some rounds of development and testing with end-users, Rhizomer is capable of publishing semantic data while facilitating user awareness of what information is contained in the dataset. Awareness is accomplished by components borrowed from the Information Architecture discipline and generated automatically from the dataset structure and ontologies. They are navigation menus and treemaps, which show the main kinds of items in the dataset, and facets, which show the more significant properties for different kinds of items and their values. While facets are common in many Semantic Web exploration tools, the presence of interface

components that provide an overview of the dataset beyond lists of classes or properties is a novel contribution of Rhizomer, as detailed in the related work review.
Our preliminary tests with users showed that Rhizomer facilitates the exploration of the published datasets, and also highlighted some issues. The last addition, motivated during previous evaluation rounds, is pivoting. It corresponds to allowing users to move from the view of a particular class of resource, e.g. Actors, to another class of related resources, e.g. Film, while preserving the previous filters. It provides a great level of flexibility to the interaction and avoids dead-ends due to the way the data is structured.
Pivoting has allowed reducing the mean time to complete a particular task, thus improving efficiency, by a 30%. Moreover, the maximum time has been reduced by almost a 60% as a result of the fact that now, contrary to the tests prior to the introduction of pivoting, all users were able to complete the task without assistance.
However, the main improvement is that pivoting empowered users to build much more complex queries to explore the data, without requiring knowledge of Semantic Web query languages or the vocabularies used in the explored datasets. For instance, it is possible to express queries such as “Who has directed the most films in countries located in Oceania”.
The remaining issues, spotted during the last evaluation, are mainly related to the fact that the interface components providing pivoting are not so evident for users. Moreover, they suppose a conceptual shift that should be mitigated. For instance, some users understood pivoting as restarting the exploration for a new class of resources.
One possible way to overcome these limitations of pivoting is to try to integrate it with facets, so that users do not need to move their attention from facets, and also to make it clearer that the filtering done so far is not going to be lost. One way to achieve this is to present pivoting as a way of performing some advanced filtering on a facet. This way, users can start doing “classical” filtering using the labels of the facet values. For instance, filter the actors for a film using the actor facet and the actor labels. However, if they get stuck because they need a more sophisticated filter, we can make pivoting available as a way of attaining advanced filtering.
In our tests, users looked for films from countries in Oceania but got stuck because the country facet showed just country names. Some of them pointed out that they needed to filter the countries by continent but did not see pivoting as the solution to their problem. The idea is that we can link their need of performing “advanced filtering” to pivoting.
Another path to explore is related with overview visualisations. Alternative visualisations will be analysed and approaches that go beyond overviewing the hierarchical structure of the dataset will be also considered. For instance, overviews of how the different kinds of resources in the dataset are related through a particular property or set of properties.
Finally, future work will also focus on improving the performance of the proposed approach, optimising the SPARQL queries or looking for alternatives like pre-computed indexes. The aim is to be able to deploy Rhizomer live on top of existing SPARQL endpoints, or at least part of its functionality. ACKNOWLEDGEMENTS This work has been partially supported by the research projects InDAGuS, Infrastructures for Sustainable Open Government Data with Geospatial Features (Spanish Government TIN2012-37826-C02), and MediaMixer, Community and Networking for the Remixing of Online Media (European Commission FP7-ICT 318101).

REFERENCES Araújo, F. C. S., Schwabe, D., & Barbosa, D. J. S. (2009). Explorator : a tool for exploring RDF data through direct manipulation . Proceedings of the Linked Data on the Web Workshop (LDOW 2009) (Vol. 538, pp. 1613–1673). Madrid, Spain: CEUR Workshop Proceedings. Becker, C., & Bizer, C. (2009). Exploring the Geospatial Semantic Web with DBpedia Mobile. Web Semantics: Science, Services and Agents on the World Wide Web, 7(4), 278–286. Bizer, C., Heath, T., & Berners-Lee, T. (2009). Linked Data - The Story So Far. International Journal on Semantic Web and Information Systems, 5(3), 1–22. Brunetti, J.M., García, R. (2011). Information Architecture Automatization for the Semantic Web. Proceedings of the 13th IFIP TC 13 International Conference on Human-Computer Interaction, Interact’11 – Vol. 4, pp. 410–413. Springer-Verlag, Berlin, Heidelberg. Brunk, S., & Heim, P. (2011). tFacet: Hierarchical Faceted Exploration of Semantic Data Using Well-Known Interaction Concepts. Proceedings of the International Workshop on Data-Centric Interactions on the Web (DCI 2011), CEUR-WS.org (Vol. 817, pp. 31–36). Elmqvist, N., Fekete, J.D. (2010). Hierarchical aggregation for information visualization: Overview, techniques, and design guidelines. IEEE Trans. Vis. Comput. Graph., 16(3), 439–454. García, R., Brunetti, J.M., López-Muzás, A., Gimeno, J.M., Gil, R. (2011). Publishing and interacting with linked data. Proceedings of the International Conference on Web Intelligence, Mining and Semantics. pp. 18:1–18:12. ACM, New York, NY, USA. García, R., Gimeno, J.M., Perdrix, F., Gil, R., Oliva, M., López, J.M., Pascual, A., Sendín, M. (2010). Building a Usable and Accessible Semantic Web Interaction Platform. World Wide Web. 13, 143–167. Garrett, J.J. (2010). The Elements of User Experience: User-Centered Design for the Web and Beyond (2nd edition). Indianapolis, IN, United States: New Riders. Goldberg, J.H. & Helfman, J.I. (2005) Enterprise Network Monitoring Using Treemaps. Proceedings of the Human Factors and Ergonomics Society, 49(5), 671-675. Hearst, M. A. (2006). Design Recommendations for Hierarchical Faceted Search Interfaces. ACM SIGIR Workshop on Faceted Search. Heim, P., Hellmann, S., Lehmann, J., Lohmann, S., & Stegemann, T. (2009). RelFinder: Revealing Relationships in RDF Knowledge Bases. In T.-S. Chua, Y. Kompatsiaris, B. Mérialdo, W. Haas, G. Thallinger, & W. Bailer (Eds.), Semantic Multimedia, Lecture Notes in Computer Science (Vol. 5887, pp. 182–187). Springer Berlin / Heidelberg. Heim, P., Ziegler, J., & Lohmann, S. (2008). gFacet: A Browser for the Web of Data. In S. Auer, S. Dietzold, S. Lohmann, & J. Ziegler (Eds.), Proceedings of the International Workshop on Interacting with Multimedia Content in the Social Semantic Web (IMC-SSW’08) (pp. 49–58). CEUR-WS. Huynh, D., Mazzocchi, S., & Karger, D. (2007). Piggy Bank: Experience the Semantic Web inside your web browser. Web Semantics: Science, Services and Agents on the World Wide Web, 5(1), 16–27. ISO/IEC-25010. (2011). ISO/IEC 25010-3: Systems and software engineering: Software product quality and system quality in use models. ISO Press.

Medlock, M.C., Wixon, D., Terrano, M., Romero, R.L., Fulton, B. (2002). Using the RITE method to improve products: A definition and a case study. Proceedings of the Usability Professionals Association, Orlando, Florida, USA. Millen, D. R., Feinberg, J., & Kerr B. (2006). Dogear: Social bookmarking in the enterprise. Proceedings of the SIGCHI Conference on Human Factors in Computing Systems, CHI’06 (pp. 111-120). New York: ACM Press. Morville, P., Rosenfeld, L. (2006). Information Architecture for the World Wide Web. O'Reilly Media, Cambridge, MA. Pietriga, E. (2006). Semantic web data visualization with graph style sheets. Proceedings of the 2006 ACM Symposium on Software Visualization, SoftVis ’06 (pp. 177–178). New York, NY, USA: ACM Press. schraefel, m. c, & Karger, D. (2006). The Pathetic Fallacy of RDF. Proceedings of the International Workshop on the Semantic Web and User Interaction (SWUI’06). Athens, USA. Shneiderman, B. (1992). Tree visualization with tree-maps: 2-D space-filling approach. ACM Transactions on Graphics, 11(1):92–99. Spencer, D. (2009). Card Sorting, Rosenfeld Media, New York, USA. Wang, T. D., & Parsia, B. (2006). CropCircles: topology sensitive visualization of OWL class hierarchies. Proceedings of the 5th international conference on The Semantic Web, ISWC’06 (pp. 695–708). Berlin, Heidelberg: Springer-Verlag. Zhou, D.X., Oostendorp, N., Hess, M., & Resnick, P. (2008). Conversation pivots and double pivots. Proceedings of the SIGCHI Conference on Human Factors in Computing Systems, CHI’08 (pp. 1009-1012). New York: ACM Press.