from paper to integrated gis presented by: ted brenson kelly felton sally cobb
TRANSCRIPT
From Paper to Integrated GIS
Presented by: Ted Brenson Kelly FeltonSally Cobb

BACKGROUND INFORMATIONBACKGROUND INFORMATION
Sauk County is one of seventy-two units of county government in the State of Wisconsin and is a municipal corporation existing pursuant to the authority of Chapter 59 of the Wisconsin Statutes. Sauk County encompasses 840 square miles including 22 towns, 14 villages, and 3 cities. The County has an estimated population of 50,090.

Mapping HistoryMapping History
Sauk County has a unique history with regard to maintenance and development of assessment maps and related tax information
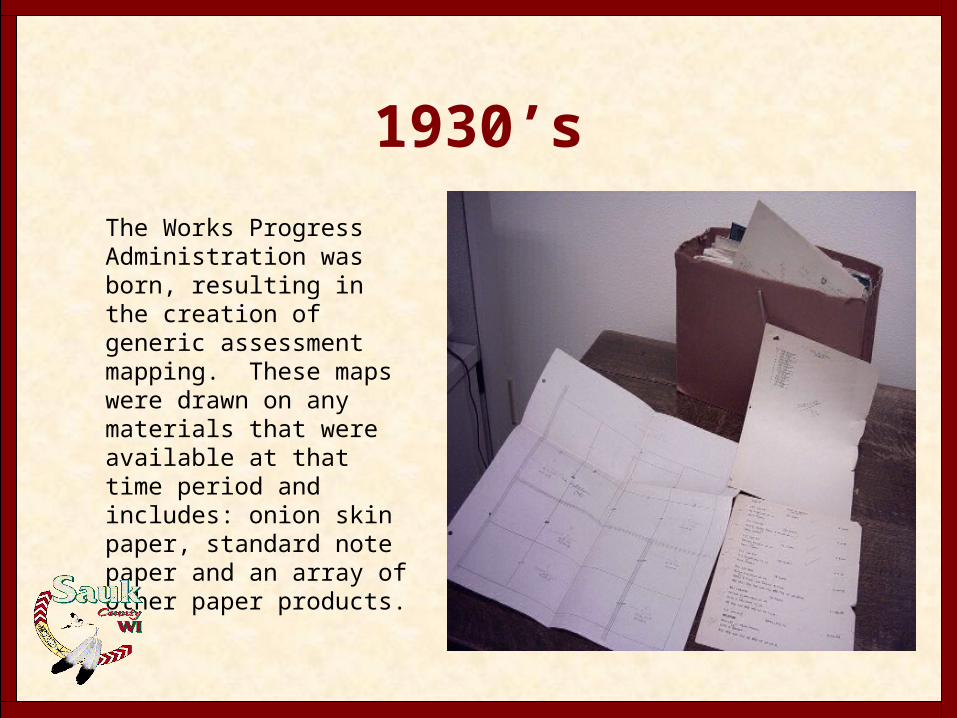
1930’s
The Works Progress Administration was born, resulting in the creation of generic assessment mapping. These maps were drawn on any materials that were available at that time period and includes: onion skin paper, standard note paper and an array of other paper products.
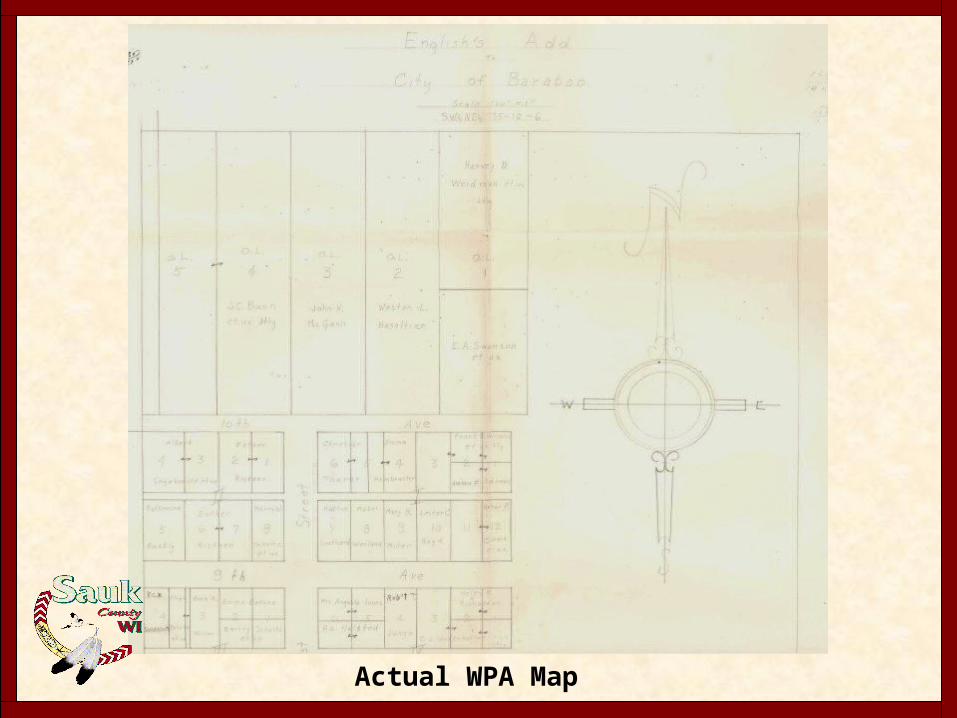
Actual WPA Map
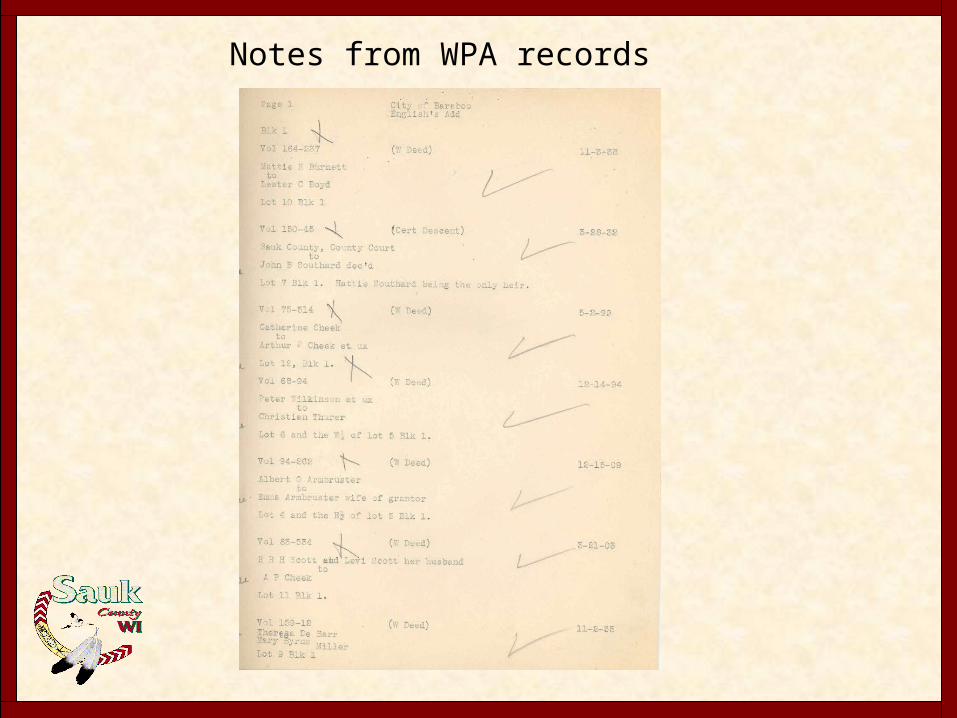
Notes from WPA records
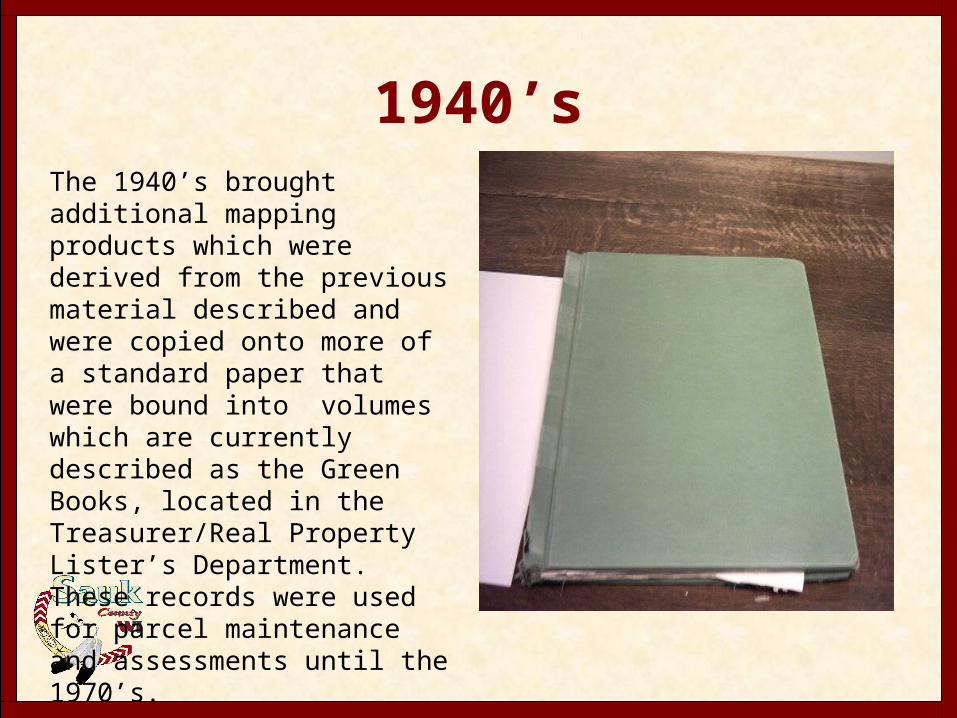
1940’sThe 1940’s brought additional mapping products which were derived from the previous material described and were copied onto more of a standard paper that were bound into volumes which are currently described as the Green Books, located in the Treasurer/Real Property Lister’s Department. These records were used for parcel maintenance and assessments until the 1970’s.

Page from one of the Green Books
Sauk County realized that updated assessment maps needed to be developed and submitted a bid for proposal in order to have this accomplished. At that time, projects like this were new to most counties, and a decision was made to accept the lowest bidder. The parcel maps were developed on mylar drafting media. Unfortunately there was not any research done. The blank sheets of mylar were laid over the maps developed in the 1930’s and 1940’s and the parcel boundaries were traced. The only research that was completed at that time were updates from 1973 forward.
1973
1978 - 1979
Sauk County had one LTE position which was located in the Planning and Zoning Department to continue to update the latest version of the parcel maps. By the end of 1979, it had been determined there was a need for a full-time parcel mapping position.

1980
The first full-time mapping position was created in March of that year. It was determined at that point that the existing parcel maps were not accurate for assessment purposes. The needed to be recreated using the necessary deed and survey records research. Re-mapping of the county was once again initiated, and completed by 1990. The highest standards for drafting techniques were used, along with the compilation of survey records.

1986
The first attempt to implement digital mapping in the county was initiated by the County Cartographer. Software and Hardware was extremely costly at that time, and those ideas were rejected by the over-site committee.

1992 - 1994 - 19941992
Two stations of Autocad version 11 were purchased. One for the Mapping Department and one for the Land Conservation Department.
1993The county received their first WLIA grant for the parcel mapping of four townships. This grant application also initiated the county’s first attempt at using GPS technology in order to develop the base maps.
1994The two existing Autocad stations were upgraded from version 11 to version 12, and one more Autocad license was purchased for the Planning and Zoning Department.

1996
In 1996 the second cartographic position was created in the Mapping Department. This position currently holds the title of Cartographer/GIS Specialist.

1999
1999 saw the establishment of the Sauk County Wisconsin High Accuracy Reference Network. It includes seven Primary and 15 Secondary Stations. Each control point is surrounded in concrete with a slip collar and aluminum rods pounded to refusal.
2000 - 2004
2000 The third Cartographic position was created and included with the the Mapping Department. This position currently holds the title of GIS/Web Design Specialist.
2004 The Mapping Department will have a completed digital base/parcel map by December.
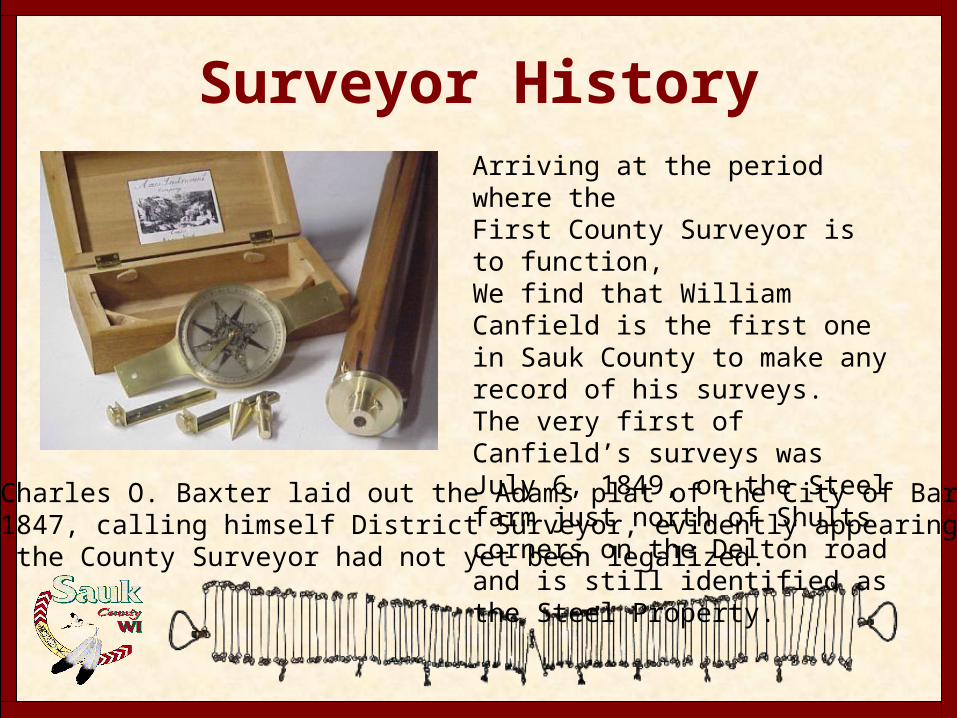
Surveyor HistoryArriving at the period where the First County Surveyor is to function,We find that William Canfield is the first one in Sauk County to make any record of his surveys. The very first of Canfield’s surveys was July 6, 1849, on the Steel farm just north of Shults corners on the Delton road and is still identified as the Steel Property.However, Charles O. Baxter laid out the Adams plat of the City of Baraboo
In April 1847, calling himself District Surveyor, evidently appearing that theOffice of the County Surveyor had not yet been legalized.
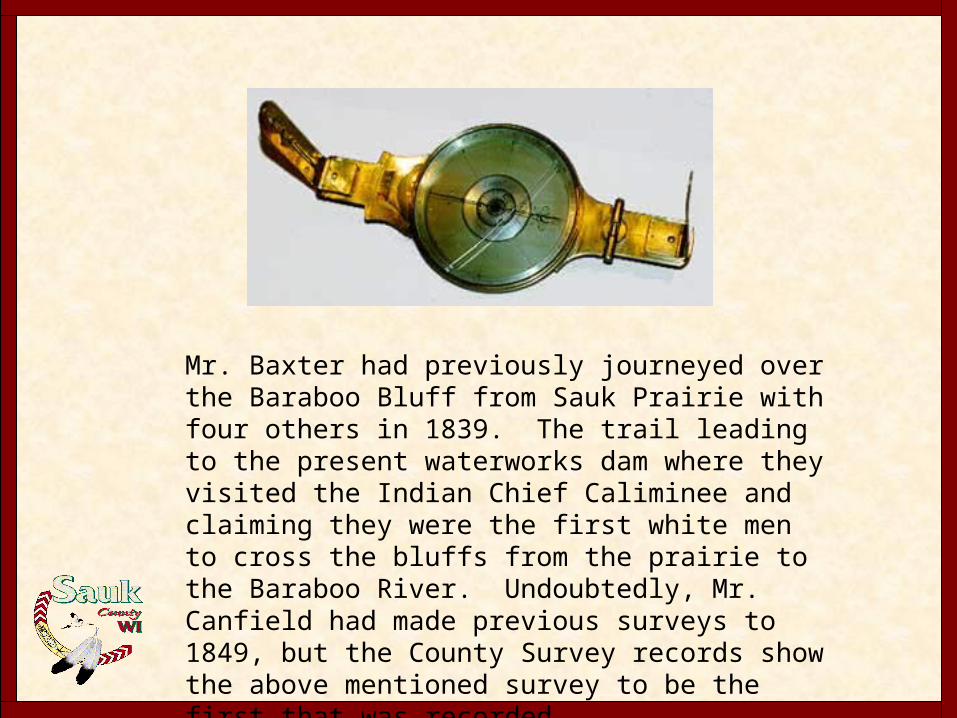
Mr. Baxter had previously journeyed over the Baraboo Bluff from Sauk Prairie with four others in 1839. The trail leading to the present waterworks dam where they visited the Indian Chief Caliminee and claiming they were the first white men to cross the bluffs from the prairie to the Baraboo River. Undoubtedly, Mr. Canfield had made previous surveys to 1849, but the County Survey records show the above mentioned survey to be the first that was recorded.
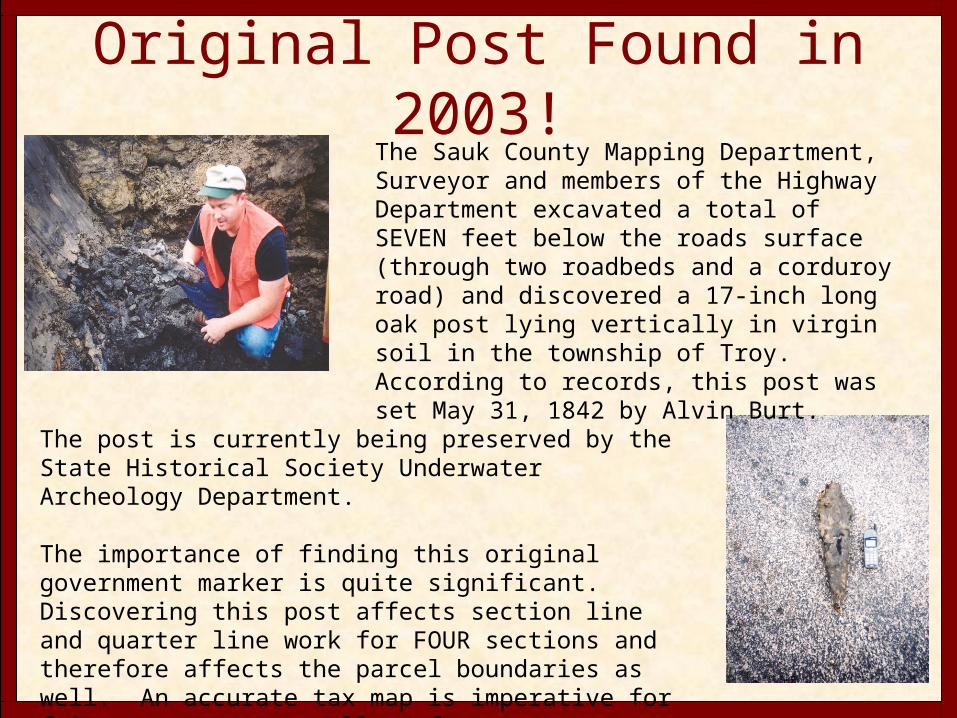
Original Post Found in 2003!The Sauk County Mapping Department, Surveyor and members of the Highway Department excavated a total of SEVEN feet below the roads surface (through two roadbeds and a corduroy road) and discovered a 17-inch long oak post lying vertically in virgin soil in the township of Troy. According to records, this post was set May 31, 1842 by Alvin Burt.
The post is currently being preserved by the State Historical Society Underwater Archeology Department.
The importance of finding this original government marker is quite significant. Discovering this post affects section line and quarter line work for FOUR sections and therefore affects the parcel boundaries as well. An accurate tax map is imperative for fair assessment as well as for accurate property legal descriptions.
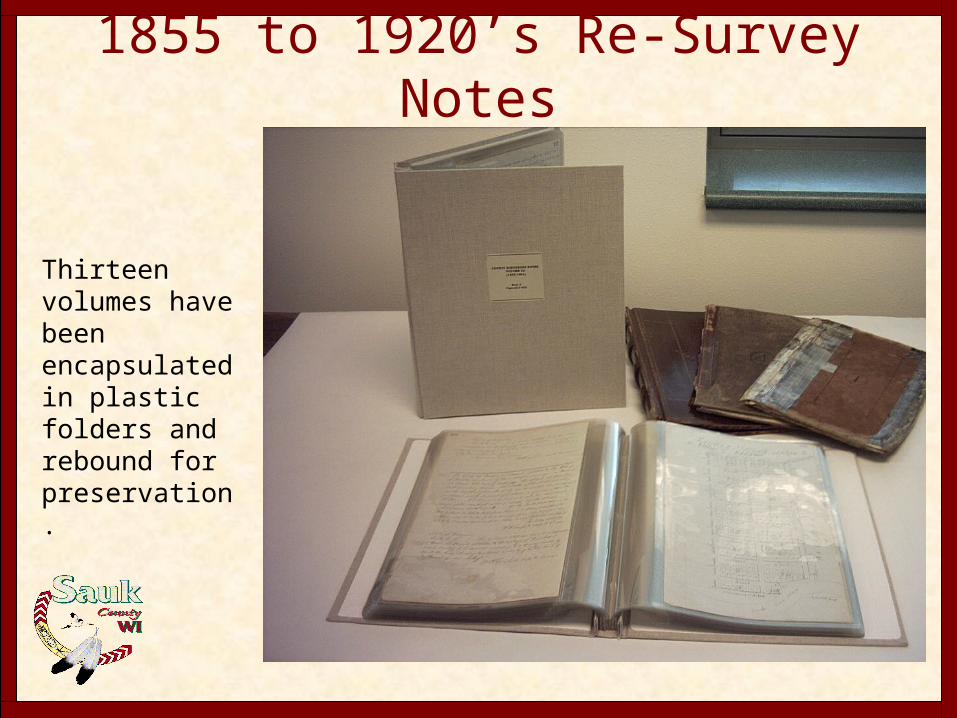
1855 to 1920’s Re-Survey Notes
Thirteen volumes have been encapsulated in plastic folders and rebound for preservation.

Parcel Map Development Process
Given the diverse geographic, as well as socioeconomic make up of Sauk County, producing maps has been an ever changing extensive learning process.

When maps were developed countywide in the 1980’s, they were drawn by hand using a Leroy penset with ink, drawing on mylar sheets. The process took a great deal of time, and as the years went on, automating the process with duplicating machines made it easier, but nonetheless tedious.

WLIP and WLIB Assistance
Once the WLIP was developed in the early 1990’s and WLIB started the grant processes for acquiring funds to produce modernized mapping products, Sauk County was able to apply for them in hopes of developing computerized, digital maps.
We have had AutoCad software since 1992 for development of our maps. The software has transformed over time, along with the processes, and allowed us the ability to develop better more useful maps for the public. Through those changes, use of digitizing tablets was at the time a “high tech” way to map from photography while mapping waterways and roadways that exact location could not be found.

Autocad through the years
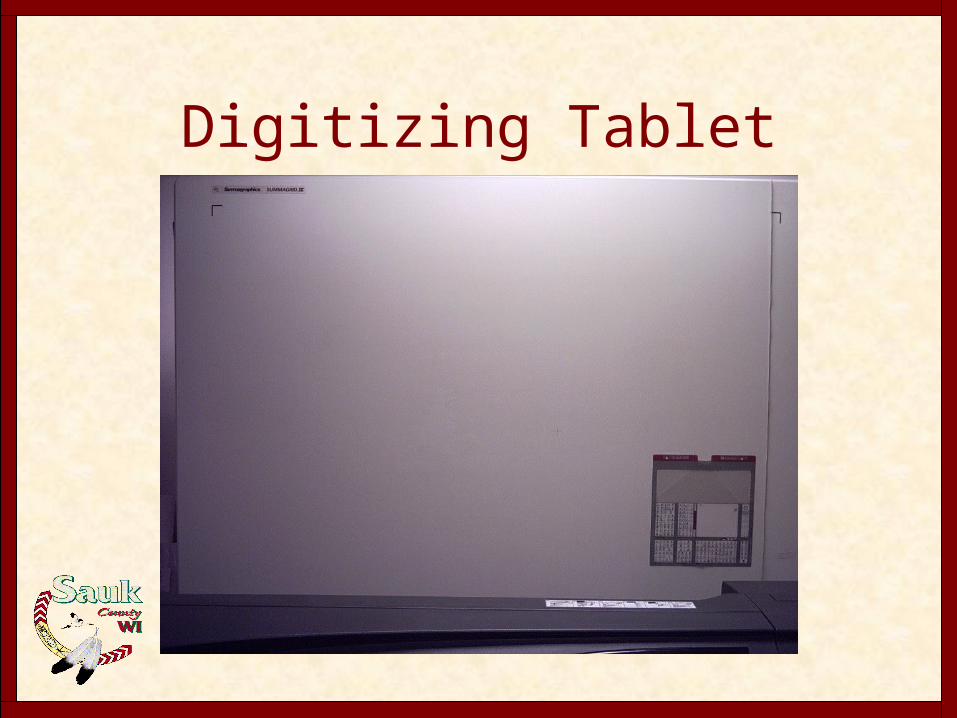
Digitizing Tablet
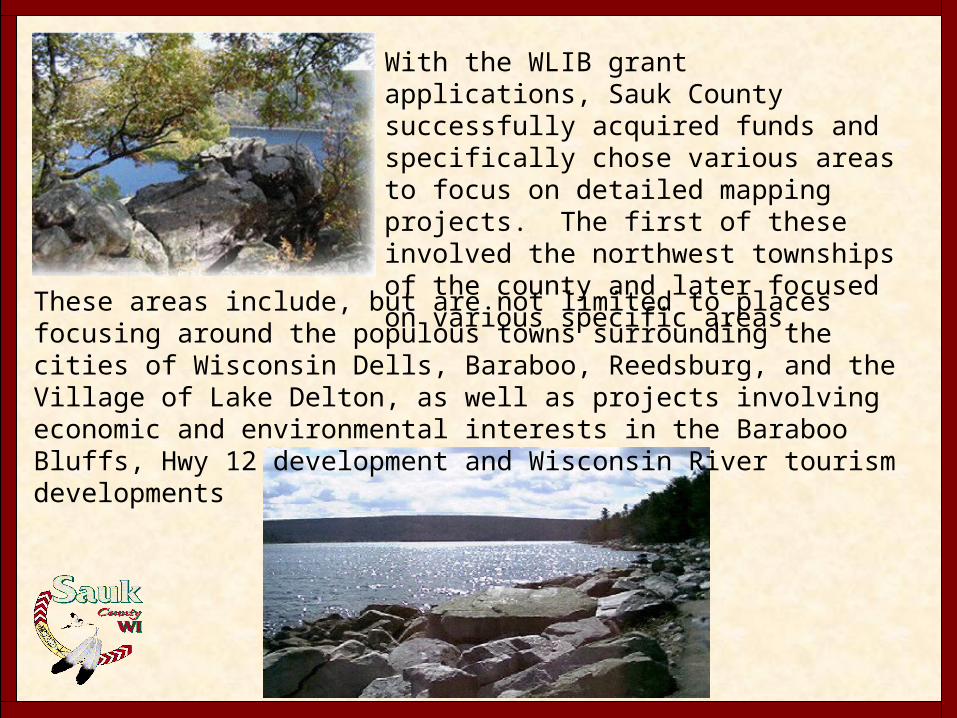
With the WLIB grant applications, Sauk County successfully acquired funds and specifically chose various areas to focus on detailed mapping projects. The first of these involved the northwest townships of the county and later focused on various specific areas.
These areas include, but are not limited to places focusing around the populous towns surrounding the cities of Wisconsin Dells, Baraboo, Reedsburg, and the Village of Lake Delton, as well as projects involving economic and environmental interests in the Baraboo Bluffs, Hwy 12 development and Wisconsin River tourism developments

Planning and StandardsEach project was meticulously planned and laid out. Each area was picked to have a common purpose and ability of completion. All along the way mapping practices changed, but always stayed true to cartographic standards set up in the early 1980’s by Theodore Brenson. These standards include layering schematics, township layout, section corner acquisition, as well as cogo geometry layout of each parcel, piece by piece, survey by survey for a complete township by township fit. These practices allowed the groundwork to be laid for what has been the current practice of GIS development.
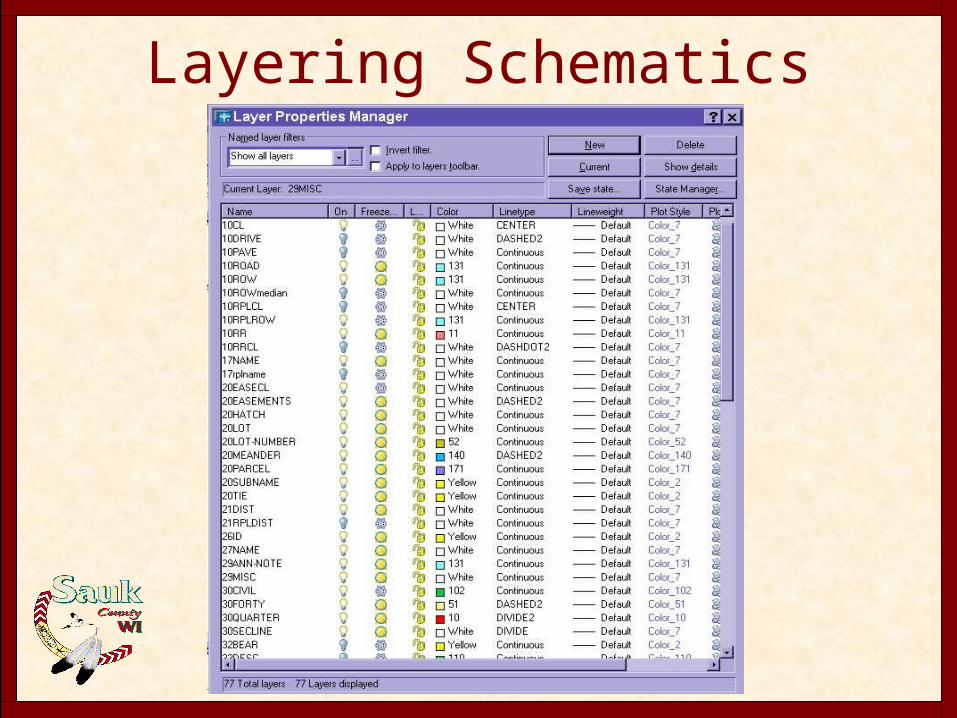
Layering Schematics

Township Layout
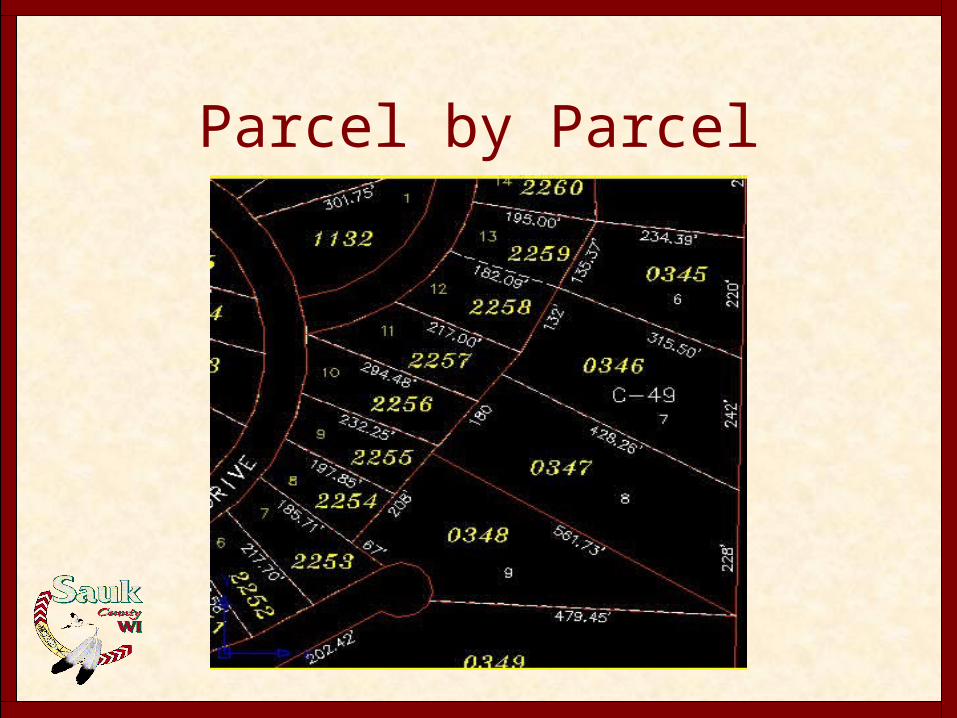
Parcel by Parcel

Countywide Parcel Fit

Without these basic fundamentals of practice and planning being set, we may have been piecing the county together haphazardly and not considering the total complete product and how the individual pieces fit the complete framework of the County. We have constantly sought greater knowledge in software and development techniques, staying abreast of current technologies and focusing on our goals and abilities.

Summary of Parcel DevelopmentKnowledge and experience of surveying practices, real property description insight, use of proper mapping standards, respect for and use of historic mapping products and the ability to see the future paths that need to be taken has given Sauk County an edge on development. Having all the pieces available such as we have, has allowed Sauk County the ability to provide the public with more beneficial and purposeful maps.
Now we have the ability to provide the public with interactive maps via the Internet for interests within Sauk County. This information has been carefully selected based on input from various departments, as well as our own insight into the public’s interest in mapping products and services. Over time we will be developing more data sets and incorporating numerous departmental requests into the overall Sauk County Mapping web site.
Lessons LearnedOne of the first and foremost lessons that we have acquired is that of patience. The mapping process has been long and sometimes arduous, but the form and function have stayed true. We set standards that were beneficial to the total process. Having our goals in mind, we were able to see how the process needed to be gradual, and over time we saw the advantage especially in regards to the changes that came with time, budgetary constraints and software upgrades.
QualityA second, equally important lesson would be that of quality. Our basic philosophy for mapping standards centers around the quality of our mapping techniques. Mapping parcel by parcel, utilizing surveys and section composite information, as well as GPS acquisition, and knowledge of the history of the county monumentation information, all allow for higher quality maps. We found it more in our personal interest to develop in a township by township process rather than having the areas scanned and fit to a countywide framework. In our opinion, this has streamlined the GIS development process.

Realistic Goals
Another important lesson is the ability to set realistic goals. By systematically budgeting and keeping in mind the grant acquisition process, as well as the knowledge of the county mapping and surveying practices in the past, we were able to plan for what areas needed to be mapped and foresee what would be realistic. We have always attained our goals and never needed extensions on grant application deadlines.
Advice
From our experiences we have seen that there are advantages and disadvantages to the processes with which you may pursue countywide mapping development. One of the first of these has to be the rapport you have with other departments within your county or municipality, especially and specifically those involved in using the products you will develop. Open communication with those individuals and ideally 100% participation and cooperation is what we would suggest to strive for.

NetworkingNetworking is also another key. Working with other organizations and groups involved with your perspective projects is a wonderful opportunity to harness all the skills and resources available. The more information you have allows for better preparation and planning of your projects, and will provide you with the needed support to accomplish your goals. We have sought the input of such groups as NRCS, DNR, local forestry and environmental groups such as Clark Forestry and Aldo Leopold Foundation. The groups utilize some of the information we produce, as well as produce information we use. If we can work together to make both our areas of expertise more productive, then it’s a win-win situation for all!
Attainable Project Goals
Another key to success is to set smaller, attainable project goals. Take into consideration the time and expense, but also the quality you will produce. Again, harness the insights of all the resources around you to make your decisions more easily.

Think Outside The Box
The final point is to think outside the box. Don’t be afraid to alter your paths, but plan for what you need and set your goals for success. Change is inevitable, so embrace it and use your resources to achieve it.
Using Autodesk Map Guide and RIT
Being an AutoCad shop for years, it was a smooth transition to begin using Map Guide and RIT. We began with 20 separate DWG’s that we combined in the form of three unique SDF’s (Space-Delimited Format Files) to create countywide Parcel, Certified Survey Map and Subdivision layers for our site. In creating these SDF’s, the attribute data is stored within each layer, so the database information is linked and ready to go!
We were just learning the software and these three layers were a great starting point to learn how to create simple reports and queries using Taylor Technologies Rapid Integration Toolkit.


Tackling the Soil Survey
As anyone who as ever worked with the NRCS Soil Survey will tell you, there is A LOT of data to work with! We began with 14 text files and a shapefile of Sauk County. The column headers have rather cryptic names, so the first task in order was to decipher what “P010A” vs. “P5060G” meant!
Then, we brought the text files into Microsoft Access to create a database and allow for querying and combining of tables.
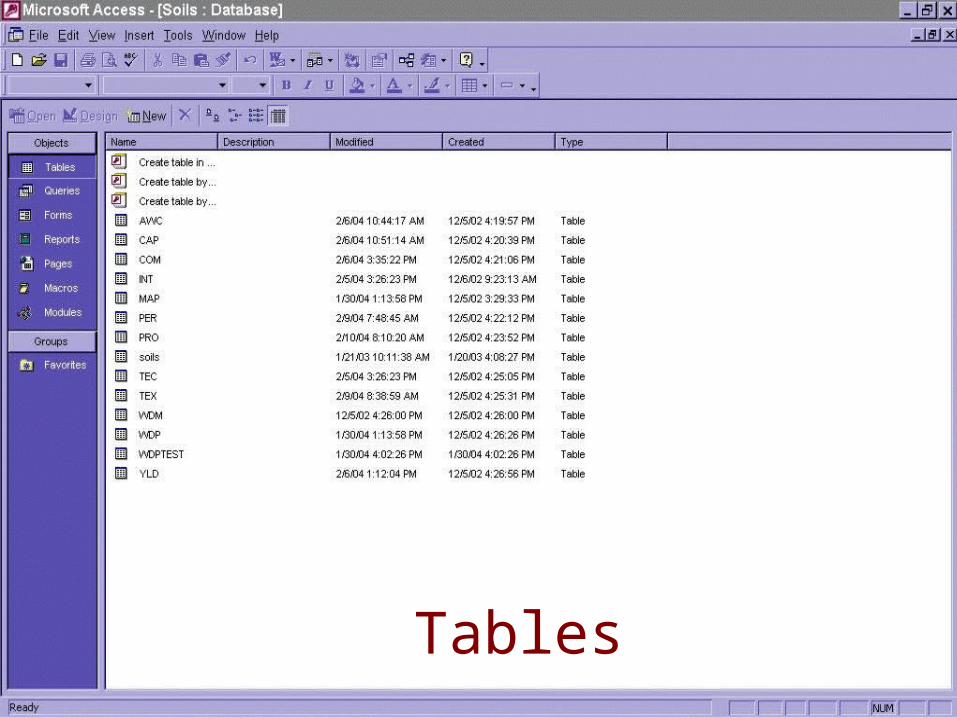
Tables

Queries Created In Access
The reason for creating queries in MS-Access is because RIT can read these queries and you can then combine elements of different tables. For instance, not every table had the MUNAME element (the full name of the type of soil), but we felt it was important to have the full name show up in every report.
Also, several reports needed information from more than one table to make sense. The Crop Production report needed data elements from the MAP, YLD, CAP and COM tables. By creating the query in Access, RIT sees the “joined” relationship and allows you to see the fields from each of the tables and add them to your report.

Soils Shapefile
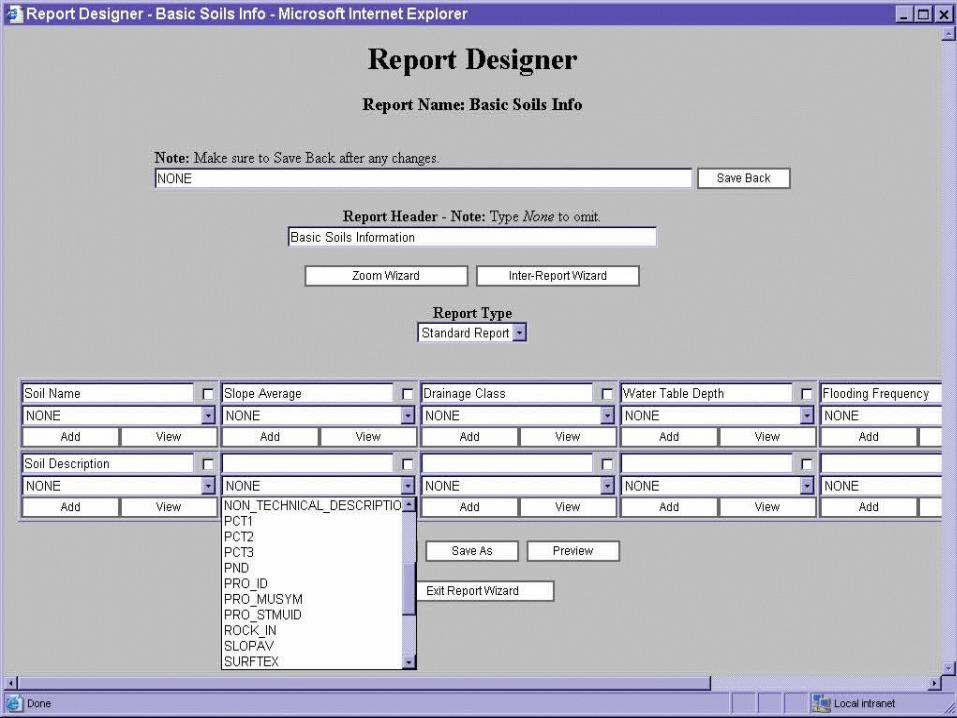
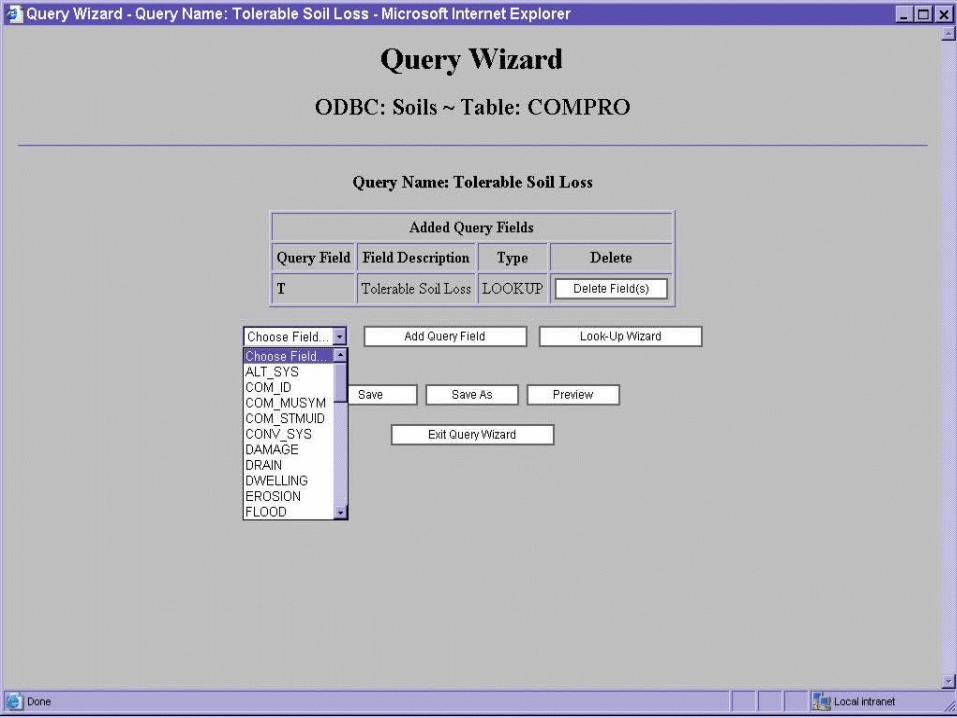
Creating Reports in RIT
Creating reports using the Rapid Integration Toolkit is made simple through pull-down menus and the flexibility to use HTML to enhance the column headers. You simply choose the field that you want to display in your report through the click of a mouse. Queries are created in the same way.
Tying it all together
The challenge of working with the soils tabular data was tying them all together so that the user could go back and forth between reports. This was solved by the Inter-Report Wizard in RIT. We were able to link all of the soils reports to one basic report and then link back to the basic report from each specialized report.
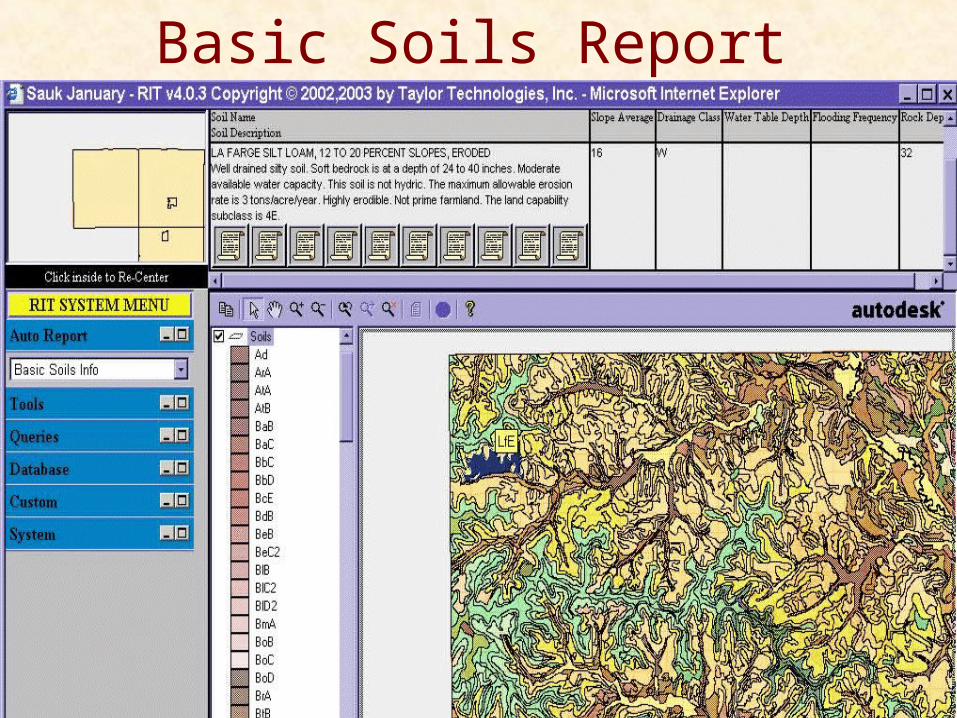
Basic Soils Report

Live Demo and Questions…