from tsunami risk assessment to disaster risk reduction ... · 1 from tsunami risk assessment to...
TRANSCRIPT

1
From Tsunami Risk Assessment to Disaster Risk Reduction. The case 1
of Oman 2
Ignacio Aguirre Ayerbe1, Jara Martínez Sánchez1, Íñigo Aniel-Quiroga1, Pino González-Riancho2, María 3
Merino1, Sultan Al-Yahyai 3, Mauricio González1, Raúl Medina1 4
1Environmental Hydraulics Institute “IHCantabria”, University of Cantabria, Santander, 39011, Spain 5 2GFA Consulting Group, Hamburg, 22359, Germany 6 3Directorate General of Meteorology and Air Navigation. Public Authority for Civil Aviation, Muscat, 111, Oman 7
Correspondence to: I. Aguirre Ayerbe ([email protected]) 8
Abstract. Oman is located in an area of high seismicity, facing the Makran Subduction Zone, which is the major source of 9
earthquakes in the eastern border of the Arabian plate. These earthquakes, as evidenced by several past events, may trigger a 10
tsunami event. The aim of this work is to minimize the consequences that tsunami events may cause in coastal communities 11
by integrating tsunami risk assessment and risk reduction measures as part of the risk-management preparedness strategy. An 12
integrated risk assessment approach and the analysis of site-specific conditions permitted to propose target-oriented risk 13
reduction measures. The process included a participatory approach, involving a panel of local and international experts. 14
One of the main concerns of this work was to obtain a really useful outcome for the actual improvement of tsunami risk 15
management in Oman. This goal was achieved through the development of comprehensive and functional management tools 16
such as the Tsunami Hazard, Vulnerability and Risk Atlas and the Risk Reduction Measures Handbook, which will help to 17
design and plan a roadmap towards risk reduction. 18
1 Introduction 19
Tsunamis are low-frequency natural events but have a great destructive power when striking coasts around the world, involving 20
loss of life and extensive damage to infrastructures and coastal communities worldwide. Between 1996 and 2015, estimated 21
tsunami disaster losses reached 250,000 lives, more than 3,500,000 affected people and more than 220,000 million of USD 22
(International Disaster Database, EM-DAT; UNISDR/CRED, 2016). 23
Oman is located in an area of high seismicity, facing the Makran Subduction Zone (MSZ), which is the major source of 24
earthquakes in the eastern border of the Arabian plate (Al-Shaqsi, 2012). These earthquakes may trigger a tsunami event, as 25
evidenced at least three times in the past (Heidarzadeh et al., 2008; Jordan, 2008). The high potential for tsunami generation 26
of MSZ makes it one of the most tsunamigenic areas of the Indian Ocean. The most recent tsunami event of seismic origin 27
was the 1945 Makran tsunami, which caused more than 4,000 fatalities and property losses in Iran, Pakistan, Oman and the 28
United Arab Emirates (Heidarzadeh et al., 2008, Mokhtari, 2011). Similar episodes may occur again in this area. 29
In addition to the tsunami threat on the coast of Oman, the rapid development and industrialization of this area explains the 30
need to develop specific studies on tsunami vulnerability and risk, especially in the northern low-lying coastal plain, which is 31
the most densely populated and the most exposed to the MSZ. 32
Suitable tsunami vulnerability and risk assessments are essential for the identification of the exposed areas and the most 33
vulnerable communities and elements. They allow identifying appropriate site-specific risk management strategies and 34
measures, thus enabling to mainstream disaster risk reduction (DRR) into development policies, plans and programs at all 35
levels including prevention, mitigation, preparedness, and vulnerability reduction, considering its root causes. 36
Most methods for risk assessment are quantitative or semi quantitative (usually indicator-based). Quantitative risk assessments 37
are generally better related to the analysis of specific impacts, which require large scales and high resolution for all the 38
components composing the risk. Results are usually expressed in terms of potential losses both economic (derived from 39
Nat. Hazards Earth Syst. Sci. Discuss., https://doi.org/10.5194/nhess-2017-448Manuscript under review for journal Nat. Hazards Earth Syst. Sci.Discussion started: 9 January 2018c© Author(s) 2018. CC BY 4.0 License.

2
building damage or even infrastructure damage) and human (derived from mortality estimations). There are several works 40
following this approach, among others Løvholt et al., 2014, Suppasri et al. in 2011 and 2013, Tinti et al. (2011) and Valencia 41
et al. (2011) within the frame of the European project SCHEMA1, Leone et al. (2011), Mas et al. (2012), Berryman et al. 42
(2005), Sugimoto et al. (2003), Sato et al. (2003), Koshimura et al. (2006), Jonkman et al. (2008), and Harbitz et al. (2016). 43
Although not as common, quantitative risk assessments are sometimes applied at global scale such as the case of the GRM - 44
Global Risk Model (last version in GAR, 2017), which addresses a probabilistic risk model at a world scale to assess economic 45
losses based on buildings damage (Cardona et al., 2015). 46
However, when the scope requires a holistic and integrated approach in which several dimensions, criteria and variables with 47
different magnitudes and ranges of values are to take into consideration, such as the case of the present work, it is necessary 48
to apply an indicator-based method. Some works following this approach may be found in ESPON (2006), Dall’Osso et al. 49
(2009a, 2009b), Taubenböck et al. (2008), Jelínek (2009, 2012), Birkmann et al. (2010, 2013), Strunz et al. (2011), Aguirre-50
Ayerbe (2011), Wegscheider, et al. (2011), González-Riancho et al. (2014), the European TRANSFER2 project, the Coasts at 51
Risk report (2014), the INFORM Global Risk Index (INFORM, 2017) and The World Risk Report (last version: Garschagen 52
et al., 2016). 53
Nevertheless, very few of them tackle with the direct link between integrated tsunami risk results and risk reduction measures 54
(RRM). González-Riancho et al., (2014) propose a translation of risk results into disaster risk management options and 55
Suppasri et al. (2017) describe some recommendations based on the lessons learned in recent tsunamis. 56
Therefore, it has been identified that there is not a clear applicability of science-based tsunami hazard and vulnerability tools 57
to improve actual DRR efforts, highlighting a general disconnection between technical and scientific studies and risk 58
management. 59
This work attempts to be complementary to preceding efforts and to fill the gap found in previous studies. The developed 60
methodology is based on the direct relationship found between risk components (hazard, exposure and vulnerability) and 61
specific DRR measures and integrates tsunami risk assessment and site-specific characteristics to select a suitable set of 62
tsunami countermeasures. The ultimate goal is the application of the method and the generation of useful management tools 63
to minimize the consequences that a potential tsunami could have on the coast of Oman. 64
2 Methodology 65
The methodology comprises two main phases: (i) the integrated tsunami risk assessment and (ii) the identification, selection 66
and prioritization of appropriate DRR measures. These two different but complementary tasks will guide the entire 67
methodology applied in this work. 68
As regards the conceptual framework, the methodology applied is fundamentally adapted from the definitions of UNISDR 69
(2004, 2009), ISO/IEC Guide 73 (2009), UNESCO (2009b) and UN (2016). Accordingly, the sequence of the work is 70
summarized schematically in Figure 1. Within the disaster risk assessment phase and prior to any risk study, it is necessary to 71
define the consequence to be analysed and the type of result pursued (for example, the estimation of buildings damages or, the 72
community’s affection from a holistic perspective, as the case presented in this article). The establishment of this main goal 73
determines the specific method, the dimensions to include in the study and the spatial and temporal scales (point 1 of Figure 74
1). 75
76
1 SCHEMA Project: Scenarios for Hazard-induced Emergencies Management. European 6th Framework Programme Project
no. 030963, August 2007 - October 2010.
2 TRANSFER project: Tsunami Risk and Strategies for the European Region. European 6th Framework Programme no. 37058, October 2006-September 2009.
Nat. Hazards Earth Syst. Sci. Discuss., https://doi.org/10.5194/nhess-2017-448Manuscript under review for journal Nat. Hazards Earth Syst. Sci.Discussion started: 9 January 2018c© Author(s) 2018. CC BY 4.0 License.

3
77
Figure 1. Schematic workflow 78
Next, the assessment of the hazard, explained in detail in section 2.1 Hazard Assessment, requires the selection of the variable 79
associated to the event (e.g. inundation depth) mainly determined by the general goal defined in the first step. The hazard 80
evaluation drives to the analysis of the individuals and elements exposed (e.g. people, buildings and infrastructures located in 81
a flooded populated area) together with its vulnerability (e.g. sensitive age groups). The risk assessment is performed by the 82
combination of the vulnerability assessment -of what is exposed- and the hazard intensity (points 3, 4 and 5 of Figure 1, 83
explained in detail in sections 2.2 Vulnerability assessment and 2.3 Risk Assessment). Both, exposure, vulnerability and the 84
integration of all risk components, circumscribed to a given spatial, cultural and socioeconomic context, are necessary for the 85
preliminary selection of risk reduction strategies and measures. These countermeasures are essential to prevent new and reduce 86
existing risk, as stated by UN (2016), contributing to the strengthening of resilience and reduction of disaster losses (point 6 87
in Figure 1. Schematic workflow, detailed in section 2.4 Risk reduction measures). 88
The determination of the efficiency of each proposed countermeasure is essential for the success of the risk reduction planning. 89
When an appropriate countermeasure is selected, the overall risk assessment must be conducted again to understand how and 90
to what extent it will actually reduce the risk. 91
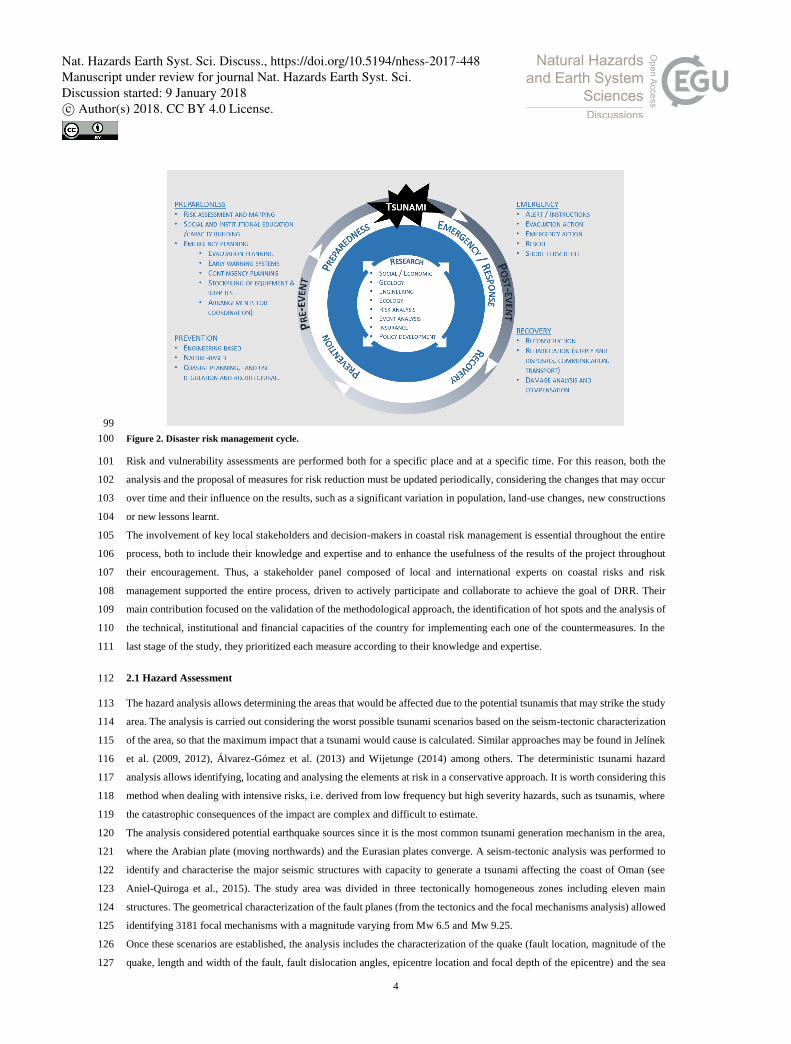
DRR measures are framed in the disaster risk management cycle proposed below, which brings together four main strategies 92
for risk reduction (Figure 2): (i) prevention and (ii) preparedness strategies in the pre-event stage and (iii) emergency/response 93
and (iv) recovery in the post-event phase. Each of the strategies includes several actions that may be overlapped on time and 94
that may even belong to more than one strategy. At the centre of the figure, research is presented as an essential element to 95
improve disaster management enriching the process through the integration of various disciplines and studies. This particular 96
study focuses on the strategies related to the pre-event phase: the prevention and the preparedness, which are explained in 97
section 2.4 Risk reduction measures. 98
Nat. Hazards Earth Syst. Sci. Discuss., https://doi.org/10.5194/nhess-2017-448Manuscript under review for journal Nat. Hazards Earth Syst. Sci.Discussion started: 9 January 2018c© Author(s) 2018. CC BY 4.0 License.
4
99
Figure 2. Disaster risk management cycle. 100
Risk and vulnerability assessments are performed both for a specific place and at a specific time. For this reason, both the 101
analysis and the proposal of measures for risk reduction must be updated periodically, considering the changes that may occur 102
over time and their influence on the results, such as a significant variation in population, land-use changes, new constructions 103
or new lessons learnt. 104
The involvement of key local stakeholders and decision-makers in coastal risk management is essential throughout the entire 105
process, both to include their knowledge and expertise and to enhance the usefulness of the results of the project throughout 106
their encouragement. Thus, a stakeholder panel composed of local and international experts on coastal risks and risk 107
management supported the entire process, driven to actively participate and collaborate to achieve the goal of DRR. Their 108
main contribution focused on the validation of the methodological approach, the identification of hot spots and the analysis of 109
the technical, institutional and financial capacities of the country for implementing each one of the countermeasures. In the 110
last stage of the study, they prioritized each measure according to their knowledge and expertise. 111
2.1 Hazard Assessment 112
The hazard analysis allows determining the areas that would be affected due to the potential tsunamis that may strike the study 113
area. The analysis is carried out considering the worst possible tsunami scenarios based on the seism-tectonic characterization 114
of the area, so that the maximum impact that a tsunami would cause is calculated. Similar approaches may be found in Jelínek 115
et al. (2009, 2012), Álvarez-Gómez et al. (2013) and Wijetunge (2014) among others. The deterministic tsunami hazard 116
analysis allows identifying, locating and analysing the elements at risk in a conservative approach. It is worth considering this 117
method when dealing with intensive risks, i.e. derived from low frequency but high severity hazards, such as tsunamis, where 118
the catastrophic consequences of the impact are complex and difficult to estimate. 119
The analysis considered potential earthquake sources since it is the most common tsunami generation mechanism in the area, 120
where the Arabian plate (moving northwards) and the Eurasian plates converge. A seism-tectonic analysis was performed to 121
identify and characterise the major seismic structures with capacity to generate a tsunami affecting the coast of Oman (see 122
Aniel-Quiroga et al., 2015). The study area was divided in three tectonically homogeneous zones including eleven main 123
structures. The geometrical characterization of the fault planes (from the tectonics and the focal mechanisms analysis) allowed 124
identifying 3181 focal mechanisms with a magnitude varying from Mw 6.5 and Mw 9.25. 125
Once these scenarios are established, the analysis includes the characterization of the quake (fault location, magnitude of the 126
quake, length and width of the fault, fault dislocation angles, epicentre location and focal depth of the epicentre) and the sea 127
Nat. Hazards Earth Syst. Sci. Discuss., https://doi.org/10.5194/nhess-2017-448Manuscript under review for journal Nat. Hazards Earth Syst. Sci.Discussion started: 9 January 2018c© Author(s) 2018. CC BY 4.0 License.

5
level. The numerical modelling applied to conduct the simulations is COMCOT (Wang, 2009), which is a shallow water 128
equation model that uses Okada model to generate the initial deformation of the sea surface. Based on the bathymetry, the 129
propagation of each potential tsunami is modelled from the source to the coast. Finally, according to the topography, the coastal 130
area is flooded, with a final resolution of 40 m onshore. 131
132
The approach is described in detail in Aniel-Quiroga et al. (2015) and is based on the works of Álvarez-Gómez et al. (2014) 133
and Gutiérrez et al. (2014). 134
Figure 3 shows the distribution of the major seismic structures and the number of events propagated for each of them. The 135
seism-tectonic study was particularly focused in the Makran subduction zone, since it is possibly the most active area in the 136
western Indian Ocean and located very near the north coast of Oman. 137
138
Figure 3. Main seismic areas surrounding the study area and number of events propagated for each area 139
On one side, the complete set of the 3181 scenarios were included in a tsunami-scenarios database, which is the basis for the 140
establishment of the early warning system in the country. On the other, seven scenarios were selected to perform the 141
deterministic hazard assessment, including the historical event of 1945, which took place in the Makran subduction zone 142
(Heidarzadeh et al., 2008). These scenarios were aggregated into a map that shows at each point of the study area the worst 143
possible situation. This enveloping map is the base for the risk assessment and includes the variables of inundation depth, 144
water velocity and drag level (multiplication of water velocity times inundation depth). 145
Hazard variables were finally classified into five intensity levels, which are described in section 2.3 Risk Assessment. Tsunami-146
drag variable classification is based on previous works carried out by Xia et al. (2014) Jonkman et al. (2008), Karvonen et al. 147
(2000), Abt et al. (1989), which establish different thresholds related to the people stability. As for the inundation depth 148
variable, the classification is based on the work developed in the SCHEMA project (Tinti et al., 2011) to establish building 149
damage levels, based on empirical damage functions considering building materials and water depth. 150
2.2 Vulnerability assessment 151
The method applied to assess the vulnerability relies on an indicator-based approach. The process include three main stages: 152
(a) the definition of criteria for selecting the dimensions and variables to be analysed for the exposed elements, (b) 153
establishment, calculation and classification of indicators and (c) the construction of vulnerability indexes and its classification. 154
These steps are explained in the following paragraphs. 155
Two different dimensions are selected: human and infrastructures, with the aim of developing an analysis with a human-centred 156
perspective. On one side, the human dimension allows analysing the intrinsic characteristics of the population. On the other, 157
the infrastructure dimension allows the analysis of buildings and critical facilities, to consider their potential worsening 158
implications for the populations, following the rational described in González-Riancho et al. (2014). In this sense, it is 159
Nat. Hazards Earth Syst. Sci. Discuss., https://doi.org/10.5194/nhess-2017-448Manuscript under review for journal Nat. Hazards Earth Syst. Sci.Discussion started: 9 January 2018c© Author(s) 2018. CC BY 4.0 License.

6
considered that an increase in the number of victims is likely to occur due to the loss or damage of emergency services, or the 160
recovery capacity may decrease due to the loss of strategic socioeconomic infrastructures such as ports. 161
The criteria to analyse the human dimension are, the population capacities related to their mobility and evacuation speed, and 162
the ability to understand a warning message and an alert situation. The criteria determined to analyse the infrastructure 163
dimension are, the critical buildings housing a large number of people (schools, hospitals, etc.), the emergency facilities and 164
infrastructures, the supply of basic needs, the building and infrastructures that could generate negative cascading effects, and 165
the economic consequences. 166
Consequently, a set of 11 indicators has been defined (see Table 1) to develop a framework that allows to encompass the major 167
issues related to the community’s vulnerability This framework was developed in agreement with local stakeholders and 168
international experts through the participatory process. 169
170
Table 1. Exposure and sensitivity indicators built for the tsunami vulnerability assessment in Oman. 171
Indicators H1 and I1 identifying and locating the number and type of exposed population and infrastructures respectively. 172
The human indicators H2-H5 are oriented to measure weaknesses in terms of evacuation and reaction capacities of the exposed 173
population. Specifically, H2 and H3 are related to problems with mobility and evacuation velocity whereas H2, H3, H4 and 174
H5 are related to difficulties in understanding a warning message and an alert situation. 175
The infrastructure indicators I2-I6 measure the number of critical facilities and buildings that would be affected by 176
administrative area, bearing in mind the implications for the population. I2 provides the number of buildings that would require 177
a coordinated and previously planned evacuation due to the high number of people in them (in some cases sensitive population), 178
such as hospitals, schools, geriatrics, malls, stadiums, mosques, churches, etc. I3 calculates the loss of emergency services that 179
are essential during the event. I4 reports on the potential number of power plants and desalination plants affected, hindering 180
the long-term supply of electricity and water to local communities. I5 analyses the generation of cascading impacts that could 181
take place due to affected hazardous/dangerous industries. Finally, I6 considers the loss of strategic ports and/or airport 182
infrastructures, essential for the economy of the country and the local livelihoods (fishing ports). 183
The construction of vulnerability indexes is performed through the weighted aggregation of the previously normalized 184
indicators (via the min-max method). Aggregated indexes are then classified considering the data distribution via the natural 185
breaks method (Jenks, 1967) and grouped in five classes, obtaining homogeneous vulnerability areas that are expected to need 186
similar DRR measures. 187
Index Indicator Variable
Hu
man
Vu
lner
abil
ity
Index
Human
Exposure H1 - Population Number of persons exposed
Human
Sensitivity
H2 - Sensitive age groups Number of persons <10 and > 65years
H3 - Disability Number of disabled persons (physical / intellectual)
H4 - Illiteracy Number of illiterate persons
H5 - Expatriates Number of expatriates
Infr
astr
uct
ure
Vuln
erab
ilit
y I
nd
ex Infrastructures
Exposure
I1 - Buildings and
infrastructures Number of exposed buildings and infrastructures
Infrastructures
Sensitivity
I2 - Critical buildings Number of critical buildings (health, educational, religious, cultural, governmental)
I3 - Emergency Number of emergency infrastructures (civil defence, police, firemen, military, royal guard)
I4 - Supply Number of water supply (desalination plants) and energy supply (power plants)
infrastructures
I5 - Dangerous Number of dangerous/hazardous infrastructures
I6 - Strategic Number of strategic infrastructures (ports and airports)
Nat. Hazards Earth Syst. Sci. Discuss., https://doi.org/10.5194/nhess-2017-448Manuscript under review for journal Nat. Hazards Earth Syst. Sci.Discussion started: 9 January 2018c© Author(s) 2018. CC BY 4.0 License.
7
Indicators and indexes have been applied to every wilayat along the coast of Oman (wilayat is an administrative division in 188
Oman). Comparable results are obtained among all areas due to the methods of normalization and classification, which take 189
into account the values of the index for all areas when establishing classes’ thresholds. This method depends on the distribution 190
of the data, therefore the study of any index evolution over time, for comparable purposes, must maintain the thresholds 191
established in the initial analysis. In the same way, if new study areas were added, they should be included and new thresholds 192
should be established. 193
2.3 Risk Assessment 194
Risk results are obtained by combining hazard and vulnerability components through a risk matrix (Greiving et al., 2006; 195
Jelínek et al., 2009; Aguirre-Ayerbe, 2011; González-Riancho et al., 2014; Schmidt-Thomé, 2006; ESPON, 2006; IH 196
Cantabria-MARN, 2010 and 2012 projects). Classes derived from the hazard assessment are blended with vulnerability classes 197
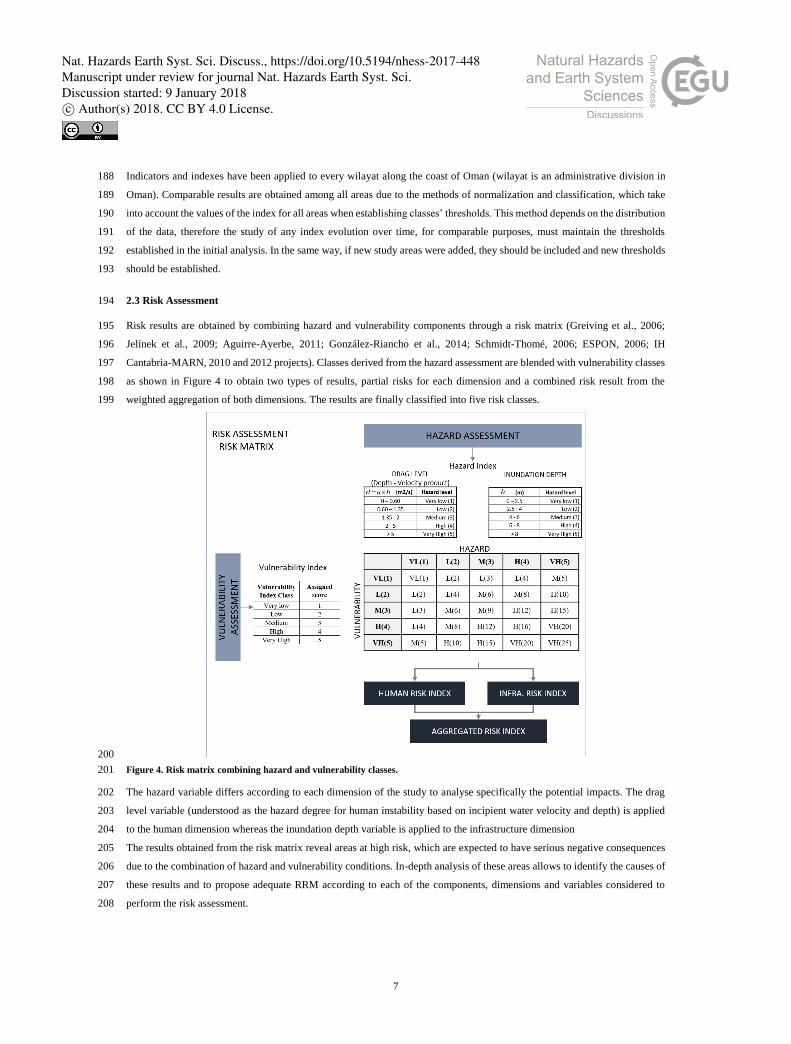
as shown in Figure 4 to obtain two types of results, partial risks for each dimension and a combined risk result from the 198
weighted aggregation of both dimensions. The results are finally classified into five risk classes. 199
200
Figure 4. Risk matrix combining hazard and vulnerability classes. 201
The hazard variable differs according to each dimension of the study to analyse specifically the potential impacts. The drag 202
level variable (understood as the hazard degree for human instability based on incipient water velocity and depth) is applied 203
to the human dimension whereas the inundation depth variable is applied to the infrastructure dimension 204
The results obtained from the risk matrix reveal areas at high risk, which are expected to have serious negative consequences 205
due to the combination of hazard and vulnerability conditions. In-depth analysis of these areas allows to identify the causes of 206
these results and to propose adequate RRM according to each of the components, dimensions and variables considered to 207
perform the risk assessment. 208
Nat. Hazards Earth Syst. Sci. Discuss., https://doi.org/10.5194/nhess-2017-448Manuscript under review for journal Nat. Hazards Earth Syst. Sci.Discussion started: 9 January 2018c© Author(s) 2018. CC BY 4.0 License.

8
2.4 Risk reduction measures 209
It has been developed a method to identify, recommend and prioritize a set of most-suitable alternatives for tsunami risk 210
reduction based on the risk analysis and site-specific conditions. The very first step has been the development of a RRM 211
catalogue, to finally obtain a set of site-specific and target-oriented countermeasures. This method facilitates the decision-212
making process by connecting scientific and technical results with risk management. 213
The work focuses on the straightforward feeding/reduction relation among the different risk components and the risk reduction 214
measures focused on the pre-event stage (see Figure 5). 215
216
Figure 5. Interactions between the different components of risk assessment and the pre-event approaches of risk reduction measures 217
Accordingly, two main strategies are identified to achieve a long-term coastal flooding risk reduction: preparedness and 218
prevention, which are based on the concepts defined by UN (2016) and UNISDR (2009). 219
Preparedness actions are focused on the knowledge, capacities and skills developed to anticipate and respond to the impacts 220
of the event, and include the following: (i) risk assessment and mapping, (ii) social and institutional awareness, educational 221
and capacity building measures, and (iii) emergency measures. The risk assessment and planning is the first step of the risk 222
management cycle, providing essential guidance within the decision-making process. The social and institutional measures 223
enhance the knowledge and capacities developed by communities and individuals to effectively anticipate and respond to the 224
impacts of likely, imminent or current hazard events, as stated by UN (2016). The emergency measures ensure public safety 225
by issuing alerts and planning evacuation of people and certain goods (e.g. vessels) at risk, to safe areas or shelters when a 226
tsunami is detected. There are some other preparedness measures, which are oriented to the post-event phase of the disaster 227
management, such as contingency planning, stockpiling of equipment and supplies and arrangement for coordination. 228
Prevention refers to actions that aim at shielding or protecting from the hazard through activities taken in advance, by reducing 229
the hazard itself, the exposure to that hazard or the vulnerability of the exposed people or goods. These include (i) engineering-230
based measures, (ii) nature-based measures, and (iii) coastal planning and architectural measures. The engineering-based 231
measures, i.e., controlled disruption of natural processes by using long term man-made structures (hard engineering solution) 232
help to reduce the intensity of the hazard. The nature-based measures, i.e., the use of ecological principles and practices (soft 233
engineering solution) help to reduce the intensity of the hazard and to enhance coastal areas safety while boosting ecological 234
wealth, improving aesthetics, and saving money. The coastal planning and architectural measures, i.e. regulations and good 235
practices, reduce the exposure and vulnerability mainly related to the infrastructure dimension. 236
Table 2 shows the set of RRM developed (based on UNFCC, 1999; Nicholls et al., 2007; UNESCO, 2009a, Linham et al., 237
2010), organised by strategies, approaches and specific goals. 238
Nat. Hazards Earth Syst. Sci. Discuss., https://doi.org/10.5194/nhess-2017-448Manuscript under review for journal Nat. Hazards Earth Syst. Sci.Discussion started: 9 January 2018c© Author(s) 2018. CC BY 4.0 License.

9
Strategy Approach Code Mitigation measure Specific Goal
Pre
par
edn
ess
Risk Mapping and
Assessment
RA. 1 Hazard, Vulnerability and
Risk V
Social and
institutional capacity
PR. 1 Raising awareness
Et and V PR. 2 Capacity building
PR. 3 Education
Emergency planning EM. 1 Early Warning Systems Et
EM. 2 Evacuation planning
Pre
ven
tion
Engineering-based EN. 1 Seawalls and sea dykes
H
EN. 2 Breakwaters
EN. 3 Movable barriers and
closure dams
EN. 4 Land claim
Nature-based NA. 1 Managed realignment
H
NA. 2 Beach nourishment
NA. 3 Artificial sand dunes and
dune restoration
NA. 4 Living shorelines
NA. 5 Wetland restoration
Coastal Planning and
Architectural
PL. 1 Building standards V
PL. 2 Flood proofing
PL. 3 Coastal setbacks Ep
Table 2. Strategies, approaches, measures and specific goals for risk reduction derived from coastal risk due to tsunami hazard (H: 239 hazard, Ep: permanent exposure, Et: temporary exposure, V: vulnerability). 240
The catalogue has been developed following this concepts and structure. Each measure is analysed and characterised by means 241
of individual RRM-cards that include the specific objective pursued and description of the measure in several sections: 242
rationale, preliminary requirements, supplementary measures, efficiency, durability and initial cost analysis. Each card 243
includes a list of stakeholders involved in the implementation of the specific RRM in Oman, and the estimation of the current 244
capacity for implementation, based on the information provided by the experts’ panel. Each card also contains a scheme, 245
several figures and a suitability analysis, which is performed through a SWOT analysis. Finally, it is incorporated a specific 246
bibliographic reference list that permits a deeper study of each measure. 247
This RRM catalogue is the basis for the next step, the selection and prioritization of the specific set of countermeasures for 248
each area. It is also worth to mention that a combination of measures from different approaches often offers an effective risk 249
reduction strategy, even enhancing the performance of the individual measures when implemented at the same time. 250
2.4.1 Risk reduction measures selection and prioritization 251
The methodology for the selection and prioritization of the RRM has been designed to ensure its adequacy to site-specific 252
conditions at local scale among those proposed in the catalogue. It is summarize in three main steps: (i) determination of the 253
management units, (ii) selection of the recommended RRM through a decision matrix and (iii) the prioritization of RRM (see 254
Figure 6). 255
Nat. Hazards Earth Syst. Sci. Discuss., https://doi.org/10.5194/nhess-2017-448Manuscript under review for journal Nat. Hazards Earth Syst. Sci.Discussion started: 9 January 2018c© Author(s) 2018. CC BY 4.0 License.
10
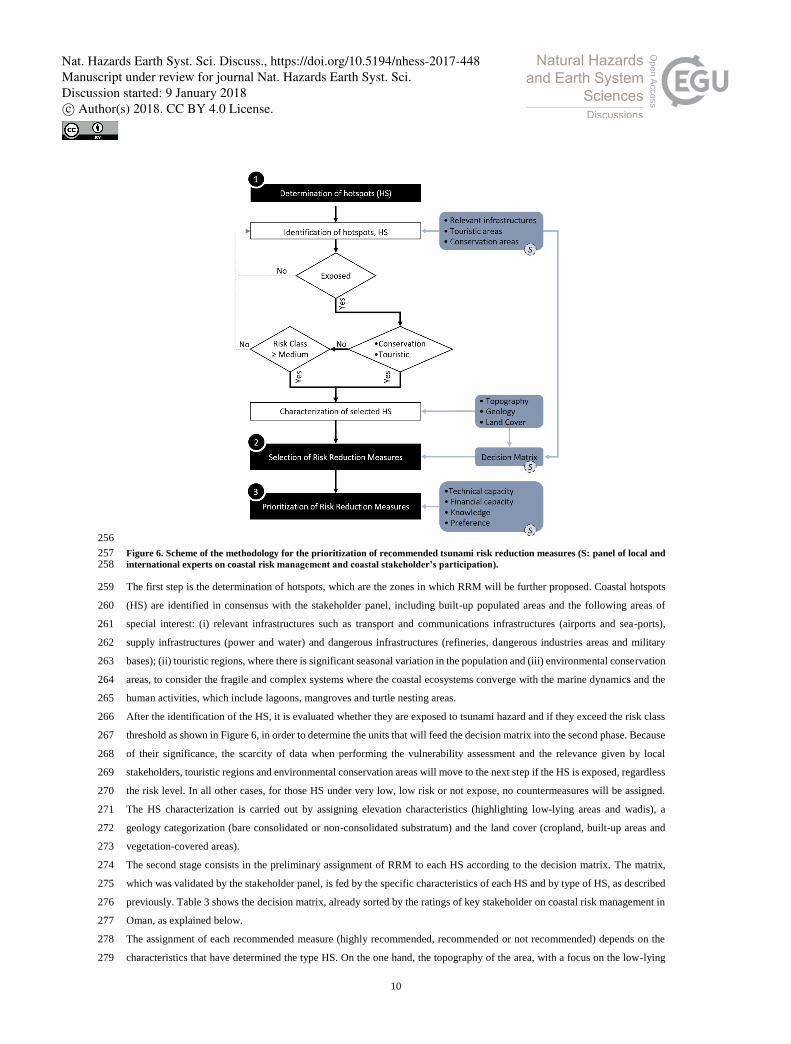
256
Figure 6. Scheme of the methodology for the prioritization of recommended tsunami risk reduction measures (S: panel of local and 257 international experts on coastal risk management and coastal stakeholder’s participation). 258
The first step is the determination of hotspots, which are the zones in which RRM will be further proposed. Coastal hotspots 259
(HS) are identified in consensus with the stakeholder panel, including built-up populated areas and the following areas of 260
special interest: (i) relevant infrastructures such as transport and communications infrastructures (airports and sea-ports), 261
supply infrastructures (power and water) and dangerous infrastructures (refineries, dangerous industries areas and military 262
bases); (ii) touristic regions, where there is significant seasonal variation in the population and (iii) environmental conservation 263
areas, to consider the fragile and complex systems where the coastal ecosystems converge with the marine dynamics and the 264
human activities, which include lagoons, mangroves and turtle nesting areas. 265
After the identification of the HS, it is evaluated whether they are exposed to tsunami hazard and if they exceed the risk class 266
threshold as shown in Figure 6, in order to determine the units that will feed the decision matrix into the second phase. Because 267
of their significance, the scarcity of data when performing the vulnerability assessment and the relevance given by local 268
stakeholders, touristic regions and environmental conservation areas will move to the next step if the HS is exposed, regardless 269
the risk level. In all other cases, for those HS under very low, low risk or not expose, no countermeasures will be assigned. 270
The HS characterization is carried out by assigning elevation characteristics (highlighting low-lying areas and wadis), a 271
geology categorization (bare consolidated or non-consolidated substratum) and the land cover (cropland, built-up areas and 272
vegetation-covered areas). 273
The second stage consists in the preliminary assignment of RRM to each HS according to the decision matrix. The matrix, 274
which was validated by the stakeholder panel, is fed by the specific characteristics of each HS and by type of HS, as described 275
previously. Table 3 shows the decision matrix, already sorted by the ratings of key stakeholder on coastal risk management in 276
Oman, as explained below. 277
The assignment of each recommended measure (highly recommended, recommended or not recommended) depends on the 278
characteristics that have determined the type HS. On the one hand, the topography of the area, with a focus on the low-lying 279
Nat. Hazards Earth Syst. Sci. Discuss., https://doi.org/10.5194/nhess-2017-448Manuscript under review for journal Nat. Hazards Earth Syst. Sci.Discussion started: 9 January 2018c© Author(s) 2018. CC BY 4.0 License.

11
areas and wadis, where flooding occurs on a regular basis, at least annually. Likewise, the geology and land cover is analysed 280
to consider the bedrock and type of land use, that condition the suitability of one or another measure. Finally, as shown in the 281
decision matrix, the type of hotspot also conditions the suitability of the RRM preliminarily selection. The sets of RRM 282
obtained according to the decision matrix for each of the determinants are merged, and finally the most restricted 283
recommendation is considered. 284
RR
M C
od
e
Ris
k R
edu
ctio
n M
easu
re Topography Geology Land cover
Types of HS
Pri
ori
tiza
tio
n
Sta
keh
old
ers
rank
ing Conservation
To
uri
stic
are
as
Rel
evan
t in
fras
tru
ctu
res
Flo
od
pro
ne
area
s
(Lo
w-l
yin
g/w
adis
)
Bar
e n
on
-
con
soli
dat
ed
Bar
e co
nso
lid
ated
Bu
ilt-
up
Cro
p l
and
Co
ver
ed b
y
veg
etat
ion
Lag
oon
s/ m
ang
rov
es
Tu
rtle
nes
tin
g a
reas
PR. 1 Social and Institutional
Raising awareness ++ + + ++ + + ++ ++ ++ ++ 1
EM. 1
Emergency Planning
Early Warning
Systems
++ + + ++ + + + + ++ ++ 2
PR. 3 Social and Institutional
Education ++ + + ++ + + ++ ++ ++ ++ 3
RA. 1 Hazard, Vulnerability
and Risk Assessment ++ ++ ++ ++ ++ ++ ++ ++ ++ ++ 4
EM. 2 Emergency Planning
Evacuation planning ++ + + ++ ++ + + + ++ ++ 5
PR. 2 Social and Institutional
Capacity building ++ + + ++ + + ++ ++ ++ ++ 6
EN. 2 Breakwaters ++ + + ++ + + - - + ++ 7
NA. 3 Artificial sand dunes
and dune restoration ++ ++ + - + ++ - ++ + +
8
NA. 4 Living shorelines ++ + - ++ + ++ ++ ++ + + 9
PL. 3 Coastal setbacks ++ + + ++ + ++ + + + + 10
NA. 5 Wetland restoration ++ + - - + ++ ++ ++ + + 11
PL. 1 Building standards ++ + + ++ + + + + + + 12
EN. 4 Land claim ++ + + + + + - - + ++ 13
NA. 2 Beach nourishment ++ ++ + - + ++ - ++ + + 14
PL. 2 Flood proofing ++ + + ++ + + + + + + 15
NA. 1 Managed realignment ++ + - - + + - ++ + + 16
EN. 1 Seawalls and sea dykes ++ + + ++ + + - - + ++ 17
EN. 3 Movable barriers and
closure dams ++ + + ++ + + - - + ++
18
Table 3. Decision matrix for the selection of recommended RRM (++: highly recommended; +: recommended; -: not recommended). 285 Last column: prioritization of RRM according to key stakeholder ratings on Oman risk management. The matrix is presented 286 ordered by these prioritization results. 287
Finally, in the third phase, the prioritization analysis considers the characteristics of each measure, its technical and economic 288
requirements, efficiency and durability, the SWOT analysis and the capacity of the country to implement them. In addition to 289
technical criteria, there are subjective aspects, including local knowledge and expertise, which should be taken into account 290
when selecting certain recommended RRM as preferred over others. Results of this preferences, shown in figure Figure 7, are 291
also reflected in the sorting of Table 3, based on the last column. 292
Nat. Hazards Earth Syst. Sci. Discuss., https://doi.org/10.5194/nhess-2017-448Manuscript under review for journal Nat. Hazards Earth Syst. Sci.Discussion started: 9 January 2018c© Author(s) 2018. CC BY 4.0 License.

12
293
Figure 7. Scoring of the RRM according to the stakeholder panel ratings (1: the least preferred; 5: most preferred) 294
3 Results 295
This section presents two types of results. First, sections 3.1 Tsunami risk assessmentand 3.2 Tsunami risk reduction in 296
Omandeal with technical results obtained from the application of the methodology to the Sultanate of Oman. They describe 297
the most relevant results of the tsunami risk assessment and one example regarding the risk reduction measures selected and 298
prioritized for a specific site. Finally, section 3.3 Science-based support for the tsunami DRR decision making processdescribe 299
the management tools developed and its usefulness for the tsunami DRR decision-making process. 300
3.1 Tsunami risk assessment 301
The tsunami hazard analysis indicates that the greater flooded area is located in the northern plain and in one section of the 302
eastern face of the country, as shown in figure Figure 8a (country’s wilayats are sorted from north to south in this and following 303
graphs). However, the greater the flooded area does not imply necessarily the greater the impact. In fact, the vulnerability 304
analysis show that the elements at risk are not homogenously distributed along these flooded areas. The greater values for the 305
exposure are on the northern plain, especially between Shinas and Bawshar Wilayats (see figure Figure 8b and Figure 8c). 306
Saham, Suwayq, Al Musanaah, Barka and As Seeb Wilayats have the highest percentage of exposed population, all above 307
10%, the latter two more than 15%, whereas there is almost no exposure in the coastline from Sur to Dalkut Wilayats, with 308
most of relative values below 1%. The Wilayat Al Jazir, even if having a low absolute number of exposed population, it 309
represents about the 8% of the total, ranking on the side of the most exposed in relative terms. Regarding the exposure of 310
buildings and infrastructures, the pattern is very similar. Higher rates of exposure take place in the northern area, especially 311
from Sinas to As Seeb Wilayats (with exposure values over 40%), with the exception of Liwa. In the rest of the country Jaalan 312
Bani Bu Ali and Al Jazir have the highest values, with 45% (about 8,300 items) and 25% (about 750 elements) respectively. 313
The vulnerability assessment reveal the different characteristics of each wilayat in terms of both population and infrastructure, 314
being the highest values correlated to the highest exposure values. In general, the most representative variables of the human 315
vulnerability assessment along the entire coast are the “expatriates” and the “sensitive age groups”, both around the 30% of 316
the total population exposed (Figure 8b). The variable that contributes less to the human vulnerability is “disable”, but even if 317
not very representative in relative values (about 2% of total exposure), it was maintained in the analysis because of its relevance 318
and importance within the risk assessment. 319
Nat. Hazards Earth Syst. Sci. Discuss., https://doi.org/10.5194/nhess-2017-448Manuscript under review for journal Nat. Hazards Earth Syst. Sci.Discussion started: 9 January 2018c© Author(s) 2018. CC BY 4.0 License.

13
As for the infrastructure dimension (Figure 8c and Figure 8d), the vulnerability analysis highlights that “critical buildings” 320
category are the most affected, being around 96% of all sensitive and exposed buildings. The 70% of the buildings within this 321
class are religious, being the wilayats Saham and As Suwayq the most affected. Despite their lower absolute number, it is 322
necessary to consider the other variables that feed the infrastructure vulnerability analysis due to their significant relevance in 323
case of an emergency (emergency, supply, dangerous and strategic), as described in the risk assessment section. In this sense, 324
Figure 8d shows their distribution along the coastal wilayats, highlighting Sohar, where ten petrochemical industries, three 325
container terminals, two bulk liquid terminals, one general cargo terminal and a sugar refinery could be affected. All of these 326
industries are located within the area and surroundings of the Port of Sohar. 327
328
Integrated vulnerability results are shown in Figure 9a for both human and infrastructure dimensions. According to the 329
vulnerability classification, the colour ramp varies from green to red, being the green the lowest value of the index and red the 330
highest. Note that, for a better understanding, the representation is at the wilayat level, while the vulnerability analysis is 331
performed exclusively for the potentially inundated area due to the tsunami hazard considered. The highest vulnerability scores 332
mainly corresponds with the wilayats located in the northern plain area. Analysing the differences among them, it may be 333
concluded that the most vulnerable wilayats (sorted from north to south) are Sohar, Saham (highest IVI score), As Suwayq, 334
Barka, As Seeb (highest HVI score) and Bawshar. 335
Nat. Hazards Earth Syst. Sci. Discuss., https://doi.org/10.5194/nhess-2017-448Manuscript under review for journal Nat. Hazards Earth Syst. Sci.Discussion started: 9 January 2018c© Author(s) 2018. CC BY 4.0 License.

14
336
Figure 8. Tsunami Risk assessment: (a) Tsunami flooded area and exposure, (b) Human exposure and vulnerability variables, (c) 337 and (d) Infrastructures exposure and vulnerability variables. 338
Finally, Figure 9b shows the integrated risk map as a synthesis, indicating the amount of area disaggregated by each risk level 339
and wilayat, which permits to know the amount of population and infrastructures per level. Therefore, it is shown that the 340
northern area of the country would be the most affected by the tsunami scenario modelled in this work, both because of the 341
greater impact of the hazard and the higher degree of exposure and vulnerability. 342
Nat. Hazards Earth Syst. Sci. Discuss., https://doi.org/10.5194/nhess-2017-448Manuscript under review for journal Nat. Hazards Earth Syst. Sci.Discussion started: 9 January 2018c© Author(s) 2018. CC BY 4.0 License.

15
343
Figure 9. (a) IVI and HVI: Infrastructure and human vulnerability indexes; (b) Integrated tsunami risk assessment 344
Nat. Hazards Earth Syst. Sci. Discuss., https://doi.org/10.5194/nhess-2017-448Manuscript under review for journal Nat. Hazards Earth Syst. Sci.Discussion started: 9 January 2018c© Author(s) 2018. CC BY 4.0 License.

16
Summarizing tsunami risk results, Figure 10a shows the distribution of the exposed population by risk level and wilayat, the 345
greater consequences being on As Seeb and Barka wilayats. Almost 55% of the exposed population is located in very high-346
risk areas and around 25% in high-risk areas. Regarding the infrastructure dimension, most of the exposed built-up area is 347
located in medium risk zones (about 60%), and around a 25% in high-risk zones. Less than 1% of the built up area result in 348
very high infrastructure risk areas. Built-up area by risk level and wilayat is presented in Figure 10b, showing that Sohar and 349
As Seeb are the most affected wilayats both in terms of built-up area exposure and risk level. 350
351
Figure 10. People and built up area by risk level 352
3.2 Tsunami risk reduction in Oman 353
The methodology applied for the selection and prioritization of optimal RRM, resulted in the identification of 89 hot spots 354
(HS) along the entire coast of the country, half of them located on the north coast, mainly from Liwa to Sur wilayats. About 355
25% of them are concentrated in the southeast area of the country, especially in wilayats Salalah (12) and Sadah (9). Mashira 356
and Ad Duqm concentrates 10 and 5 HS respectively. According to the method followed, 79 out of the initial 89 were assigned 357
with a set of RRM. 358
Next, an example is included to show the whole procedure, focused on the wilayat As Seeb. This wilayat concentrates the 359
largest amount of population exposed to the highest level of risk and is the second wilayat with the greatest infrastructures risk 360
level. The target area (the HS) is the Muscat International Airport and surroundings where, in addition to the airport itself, is 361
located the building of the Public Authority for Civil Aviation of Oman (PACA) that houses the Multi Hazard Early Warning 362
System and the National Tsunami Warning Centre. 363
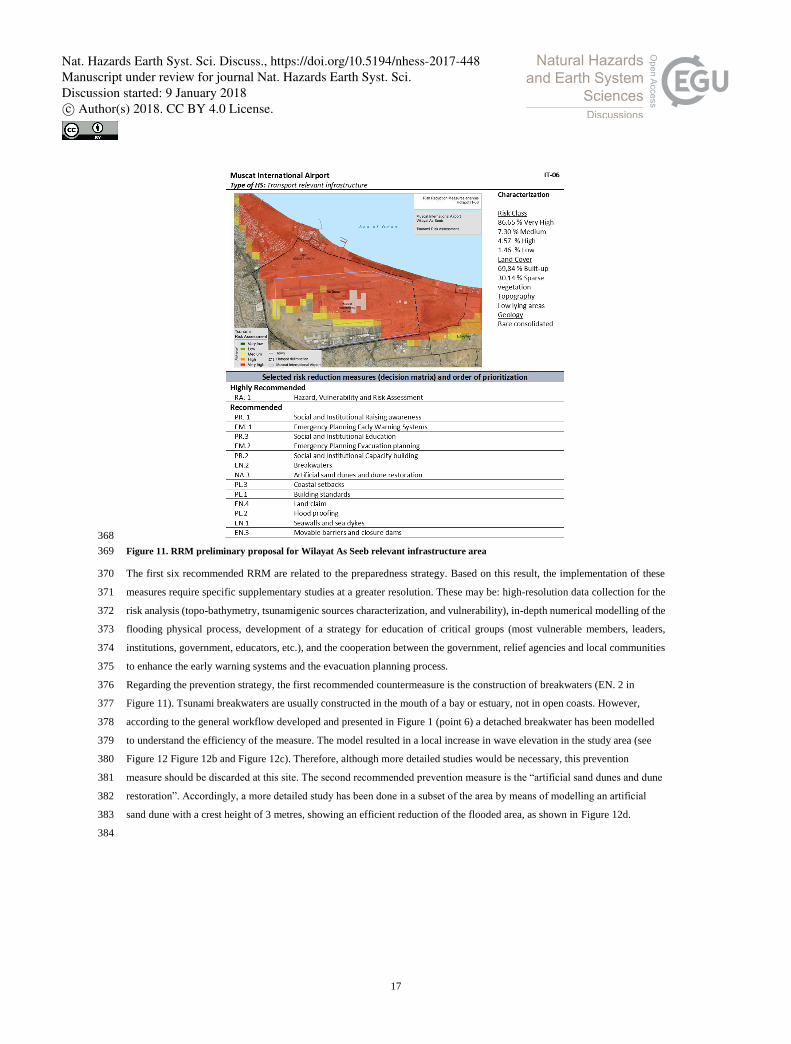
Figure 11 shows the selected HS, a simple view of the risk assessment results, a summary of the characterization, and the 364
preliminary set of RRM recommended resulting from the decision matrix. The list is shorted (most preferred on top) according 365
to the prioritization made by the stakeholder panel, based on their knowledge and expertise on the feasibility and the 366
institutional, economic and technological capacity of the country for their implementation. 367
Nat. Hazards Earth Syst. Sci. Discuss., https://doi.org/10.5194/nhess-2017-448Manuscript under review for journal Nat. Hazards Earth Syst. Sci.Discussion started: 9 January 2018c© Author(s) 2018. CC BY 4.0 License.
17
368
Figure 11. RRM preliminary proposal for Wilayat As Seeb relevant infrastructure area 369
The first six recommended RRM are related to the preparedness strategy. Based on this result, the implementation of these 370
measures require specific supplementary studies at a greater resolution. These may be: high-resolution data collection for the 371
risk analysis (topo-bathymetry, tsunamigenic sources characterization, and vulnerability), in-depth numerical modelling of the 372
flooding physical process, development of a strategy for education of critical groups (most vulnerable members, leaders, 373
institutions, government, educators, etc.), and the cooperation between the government, relief agencies and local communities 374
to enhance the early warning systems and the evacuation planning process. 375
Regarding the prevention strategy, the first recommended countermeasure is the construction of breakwaters (EN. 2 in 376
Figure 11). Tsunami breakwaters are usually constructed in the mouth of a bay or estuary, not in open coasts. However, 377
according to the general workflow developed and presented in Figure 1 (point 6) a detached breakwater has been modelled 378
to understand the efficiency of the measure. The model resulted in a local increase in wave elevation in the study area (see 379
Figure 12 Figure 12b and Figure 12c). Therefore, although more detailed studies would be necessary, this prevention 380
measure should be discarded at this site. The second recommended prevention measure is the “artificial sand dunes and dune 381
restoration”. Accordingly, a more detailed study has been done in a subset of the area by means of modelling an artificial 382
sand dune with a crest height of 3 metres, showing an efficient reduction of the flooded area, as shown in Figure 12d. 383
384
Nat. Hazards Earth Syst. Sci. Discuss., https://doi.org/10.5194/nhess-2017-448Manuscript under review for journal Nat. Hazards Earth Syst. Sci.Discussion started: 9 January 2018c© Author(s) 2018. CC BY 4.0 License.

18
385
Figure 12 . Detailed analysis of preliminary engineering RRM: a) Zoomed sample area; b) Modelled flooded area; c) with the 386 breakwater option; d) with artificial sand dune option. 387
Similar procedures for obtaining a preliminary set of RRM have been developed for all the hotspots and for some local areas. 388
In-depth studies should be made to perform a second stage analysis of the recommended countermeasures, considering higher 389
resolution of the hazard analysis and detailed information provided by the vulnerability variables and indicators. 390
3.3 Science-based support for the tsunami DRR decision making process 391
One of the main objectives of the study is to improve tsunami risk management through the effective use of the results 392
obtained. In this sense, science and technical results are translated into two risk management tools: (i) the Tsunami Hazard, 393
Vulnerability and Risk Atlas, and (ii) the Risk Reduction Measures Handbook. These tools have been implemented and 394
activated by the Directorate General of Meteorology of Oman (DGMET). In addition, a knowledge and technology transfer 395
strategy has been carried out to ensure adequate long-term management. 396
The “Tsunami Hazard, Vulnerability and Risk Atlas”, contains a comprehensive description of the methodology applied to 397
assess the risk and all maps from the hazard analysis and vulnerability variables and indices to the final risk results. It is 398
expected to be used as the main source for awareness and education regarding tsunamis and as the basis for further local and 399
detailed studies. In this regards, DGMET efforts are focused in distributing and conducting follow-up meetings to all 400
involved stakeholders, including Supreme Council for Planning, Ministry of Education, The Public Authority Of Radio And 401
Television, National Committee for Civil Defence (NCCD), Public Authority for Civil Defence and Ambulance and Royal 402
Oman Police-Operation. Follow up meetings are also included in the general strategy to explain the atlas information and 403
discuss the best approaches to utilize such information for the planning and implementing policies and strategies. 404
The “Tsunami Risk Reduction Measures Handbook” is a useful manual to help in the decision-making process related with 405
the tsunami prevention and preparedness. It includes a brief explanation of the methodology developed to select and 406
recommend each set of measures, the catalogue of RRM, containing individual RRM-cards for each countermeasure and the 407
results obtained for each area along the coast of Oman, including the set of recommended RRM for each specific location. 408
Similar to the hazard, vulnerability and risk atlas, DGMET has forwarded the handbook to the government cabinet to 409
distribute among all stakeholders, especially to the Supreme Council for Planning. 410
Finally, as an additional result of this study, a web based tool to support the tsunami early warning system (called MHRAS) 411
was also developed, implemented and linked to the DGMET Decision Support System. 412
Nat. Hazards Earth Syst. Sci. Discuss., https://doi.org/10.5194/nhess-2017-448Manuscript under review for journal Nat. Hazards Earth Syst. Sci.Discussion started: 9 January 2018c© Author(s) 2018. CC BY 4.0 License.

19
4 Conclusions 413
Integrated risk assessments are essential for identifying the most vulnerable communities and worst expected consequences, 414
as well as for designing and planning a roadmap towards risk reduction. For this reason, they should be the basis to link 415
scientific and technical advances with appropriate decision-making and effective risk management. 416
The methodology presented was developed to build an effective connection between tsunami risk assessment and tsunami risk 417
reduction, with the objective of supporting risk managers by facilitating science-based decision-making in the phases of 418
prevention and preparedness, before an event occurs. 419
The tsunami hazard modelling, based on potential earthquake sources, permitted to perform an analysis to identify the worst 420
possible scenario, considering the low frequency/high severity nature of the hazard. Thus, it permitted to estimate the worst 421
negative consequences as the main outcome of the risk assessment. The potentially most affected areas in Oman, in terms of 422
tsunami-prone flooded areas are the northern plain of the country especially Barka and As Seeb as well as Mahawt and Al 423
Jazir wilayats on the eastern area. 424
The semi quantitative indicator-based approach for the vulnerability and risk assessment, which integrates risk components 425
(hazard, exposure and vulnerability) and the human and infrastructure dimensions, has been proved useful to discern the more 426
sensitive areas from a human-centred perspective. The indicators system is helpful for the decision-making process in two 427
ways. First, the information at the index and indicator level allows a broad insight of where the exposed elements are and 428
which are more susceptible to suffering the impact of the hazard, i.e., where to focus the efforts towards risk reduction. Second, 429
the approach permits to easily track back to the variables. This information is essential to understand the precise root causes 430
of vulnerability and risk results, to be tackled by adequate and specific DRR measures. In Oman, the most vulnerable areas 431
are located in the northern plain of Oman, highlighting wilayat As Seeb, both in the human and infrastructure dimension and 432
wilayats Saham and Suwayq in the infrastructure dimension. The eastern part, although affected by the inundation, is not so 433
vulnerable. The combination of hazard and vulnerability assessments reveals that the worst expected consequences are for As 434
Seeb and Barka wilayats in terms of human risk and for Sohar and As Seeb in terms of infrastructure risk, according to the 435
tsunami modelled in this work. 436
As for the connection between risk assessment results and risk management, for each defined tsunami-risk management area, 437
the methodology allows identifying, selecting and prioritizing, a preliminary set of suitable and site-specific RRM. This 438
analysis discards non-suitable measures and allows a more in-depth exploration, defining the basis for analysing the feasibility 439
of its implementation, including its technical and economic viability. Through the example shown for the area of Muscat 440
International Airport, it has been illustrated the usefulness of the methodology, which can be applied in other parts of the world 441
facing other natural events that may trigger a disaster. 442
In this sense, with the aim of producing a useful outcome for the risk management, all the results obtained and the detailed 443
description of the method were compiled in two handy management tools. These tools permit to analyse and facilitate the 444
decision-making, to replicate and to update the study by the tsunami disaster managers of Oman, thus contributing to the 445
connection between science-based risk results and disaster risk management. 446
The involvement and support of relevant stakeholders in charge of the risk management process is essential for the success 447
and usefulness of the method. Their encouragement has been one of the priorities throughout the application of the method in 448
the case study with the aim of achieving the main objective of minimizing the consequences that a potential tsunami could 449
trigger. In this sense, the work aims to contribute to the implementation of the Sendai Framework, by understanding the current 450
tsunami risk, by the commitment of stakeholders and by the linkage between risk outcomes and risk reduction measures. 451
Nat. Hazards Earth Syst. Sci. Discuss., https://doi.org/10.5194/nhess-2017-448Manuscript under review for journal Nat. Hazards Earth Syst. Sci.Discussion started: 9 January 2018c© Author(s) 2018. CC BY 4.0 License.

20
5 Acknowledgements 452
The authors thank the Ministry of Transport and Communications of the Government of the Sultanate of Oman (MOTC), the 453
Public Authority for Civil Aviation (PACA) and the Directorate General of Meteorology (DGMET), for supporting and 454
funding the project “Assessment of Coastal Hazards, Vulnerability and Risk for the Coast of Oman” during the period 2014-455
2016. We also thank and appreciate the collaboration of the International Oceanographic Commission of the United Nations 456
Educational, Scientific and Cultural Organization personnel (IOC-UNESCO). 457
6 References 458
Abt, S. R., Wittler, R.J., Taylor, A., Love, D. J.: Human stability in a high flood hazard zone. Water Resour Bull 25(4):881–459
890, 1989. 460
Aguirre-Ayerbe, I.: Propuesta metodológica para la evaluación del riesgo de tsunami en zonas costeras. Aplicación en el litoral 461
de El Salvador. MSc. thesis, Earth Science Department, Universidad de Cantabria, Spain, accessible at: 462
http://catalogo.unican.es/cgi-bin/abnetopac/O7576/ID14b6d08d?ACC=161, 2011. 463
Al-Shaqsi, S.: Emergency management in the Arabian Peninsula: A case study from the Sultanate of Oman, in: Comparative 464
Emergency Management: Understanding Disaster Policies, Organizations, and Initiatives from Around the World. Edited by 465
David McEntire, FEMA, USA, 19 pp, 2012. 466
Álvarez-Gómez, J. A., Aniel-Quiroga, Í., Gutiérrez-Gutiérrez, O.Q., Larreynaga, J., González, M., Castro, M., Gavidia, F., 467
Aguirre Ayerbe, I., González-Riancho, P., and Carreño, E.: Tsunami hazard assessment in El Salvador, Central America, from 468
seismic sources through flooding numerical models., Nat. Hazards Earth Syst. Sci., 13, 2927–2939, doi:10.5194/nhess- 13- 469
2927, 2013. 470
Álvarez-Gómez, J. A., Martínez Parro, L., Aniel-Quiroga, I., González M., Al-Yahyai S., M. S. Jara, Méndez F., Rueda A. 471
and Medina R.: Tsunamigenic seismic sources characterization in the Zagros fold and thrust belt. Implications for tsunami 472
threat in the Persian Gulf, in: Geophysical Research Abstracts, 16, p 10951, 2014. 473
Aniel-Quiroga, Í., Álvarez-Gómez, J. A., González, M., Aguirre Ayerbe, I., Fernández Pérez, F., M. S. Jara, González-Riancho, 474
P., Medina, R., Al-Harthy, S., Al-Yahyai, S., Al-Hashmi, S.: Tsunami Hazard assessment and Scenarios Database development 475
for the Tsunami Warning System for the coast of Oman, Reducing Tsunami Risk in the Western Indian Ocean conference, 476
Muscat, Oman, 2015. 477
Berryman, K. (ed.): Review of tsunami hazard and risk in New Zealand. Geological and Nuclear Sciences (GNS) Client 478
Report 2005/104, p.149, 2005. 479
Birkmann, J., Cardona, O. D., Carreño, M. L., Barbat, A. H., Pelling, M., Schneiderbauer, S., Kienberger, S., Keiler, M., 480
Alexander, D., Zeil, P., and Welle, T.: Framing vulnerability, risk and societal responses: the MOVE framework, Nat. Hazards, 481
67, 193–211, 2013. 482
Birkmann, J., Teichman, K. v., Welle, T., González, M., and Olabarrieta, M.: The unperceived risk to Europe's coasts: tsunamis 483
and the vulnerability of Cadiz, Spain, Nat. Hazards Earth Syst. Sci., 10, 2659-2675, available at: https://doi.org/10.5194/nhess-484
10-2659-2010, 2010. 485
Cardona O.D., Bernal G.A., Ordaz M.G., Salgado-Gálvez M.A., Singh S.K., Mora M.G. and C.P. Villegas.: Update on the 486
probabilistic modelling of natural risks at global level: Global Risk Model – Global Earthquake and Tropical Cyclone Hazard 487
Assessment. Disaster Risk Assessment at Country Level for Earthquakes, Tropical Cyclones (Wind and Storm Surge), Floods, 488
Tsunami and Volcanic Eruptions. CIMNE & INGENIAR Consortium. Background paper for GAR15. Barcelona-Bogotá D.C., 489
Colombia, 2015. 490
Michael Beck W. (Editor): Coasts at Risk: An Assessment of Coastal Risks and the Role of Environmental Solutions. A joint 491
publication of United Nations University - Institute for Environment and Human Security (UNU-EHS), The Nature 492
Nat. Hazards Earth Syst. Sci. Discuss., https://doi.org/10.5194/nhess-2017-448Manuscript under review for journal Nat. Hazards Earth Syst. Sci.Discussion started: 9 January 2018c© Author(s) 2018. CC BY 4.0 License.
21
Conservancy (TNC) and the Coastal Resources Center (CRC) at the University of Rhode Island Graduate School of 493
Oceanography, 2014. 494
Dall’Osso, F., Gonella, M., Gabbianelli, G., Withycombe, G., and Dominey-Howes, D.: Assessing the vulnerability of 495
buildings to tsunami in Sydney, Nat. Hazards Earth Syst. Sci., 9, 2015–2026, doi:10.5194/nhess-9-2015-2009, 2009a. 496
Dall’Osso, F. and Dominey-Howes, D.: A method for assessing the vulnerability of buildings to catastrophic (tsunami) marine 497
flooding, 138 pp., available at (last access on September 2017): 498
http://www.sydneycoastalcouncils.com.au/Project/Vulnerability_of_Buildings_Tsunami_Flooding. 2009b. 499
ESPON Monitoring Committee.: The Spatial Effects and Management of Natural and Technological Hazards in Europe. 500
European Spatial Observation Network (ESPON 2006) Project 1.3.1., 2006. 501
Garschagen, M., Hagenlocher, M., Comes, M., Dubbert, M., Sabelfeld, R., Lee, Yew J., Grunewald, L., Lanzendörfer, M., 502
Mucke, P., Neuschäfer, O., Pott, S., Post, J., Schramm, S., Schumann-Bölsche, D., Vandemeulebroecke, B., Welle, T. and 503
Birkmann, J.: World Risk Report 2016. World Risk Report. Bündnis Entwicklung Hilft and UNU-EHS, 2016. 504
González Riancho, P., Aguirre Ayerbe, I., García Aguilar, O., Medina, R., González, M., Aniel Quiroga, I., Gutiérrez, O. Q., 505
Álvarez Gómez, J. A., Larreynaga, J., and Gavidia, F.: Integrated tsunami vulnerability and risk assessment: application to the 506
coastal area of El Salvador, Nat. Hazards Earth Syst. Sci. 14:1223–1244, doi:10.5194/nhess-14-1223-2014, 2014. 507
Greiving, S., Fleischhauer, M., and Lückenkötter, J.: A methodology for an integrated risk assessment of spatially relevant 508
hazards, J. Environ. Plann. Man., 49, 1–19, doi:10.1080/09640560500372800, 2006. 509
Gutiérrez, O., Aniel-Quiroga I., and González, M.: Tsunami run up in coastal areas: a methodology to calculate run up in large 510
scale areas. Proc. 34th International Conference on Coastal Engineering, 2014. Ed. J.M. Smith. World Scientific, ASCE, Seoul 511
(Korea). June, 2014. 512
Harbitz C. B., Nakamura, Y., Arikawa, T., Baykal, C., Dogan, G.G., Frauenfelder, R., Glimsdal, S., Guler, H.G., Issler, D., 513
Kaiser, G., Kânoğlu, U., Kisacik, D., Kortenhaus, A., Løvholt, F., Maruyama, Y., Sassa, S., Sharghivand, N., Strusinska-514
Correia, A., Tarakcioglu, G.O. and Yalciner, A.Y.: Risk Assessment and Design of Prevention Structures for Enhanced 515
Tsunami Disaster Resilience (RAPSODI)/ Euro-Japan Collaboration. Coastal Engineering Journal 2016 58:04, 516
doi:10.1142/S057856341640012X, 2016. 517
Heidarzadeh, M., Pirooz, M.D., Zaker, N.H., Yalciner, A. C., Mokhtari, M., Esmaeily, A.: Historical tsunami in the Makran 518
Subduction Zone off the southern coasts of Iran and Pakistan and results of numerical modeling. Ocean Engineering, 35, 774–519
786, 2008. 520
IH Cantabria-MARN (Instituto de Hidráulica Ambiental IH Cantabria, Ministerio de Medio Ambiente y Recursos Naturales 521
de El Salvador MARN): Catálogo de Peligrosidad debida a la inundación por Tsunami en la costa de El Salvador, Spanish 522
Agency for International Development Cooperation (AECID), available at: http://www.ihcantabria.com/es/proyectos-523
id/item/839-tsunami-hazard-el-salvador (last access: September 2017, in Spanish), 2010. 524
IH Cantabria-MARN (Instituto de Hidráulica Ambiental IH Cantabria, Ministerio de Medio Ambiente y Recursos Naturales 525
de El Salvador MARN): Catálogo de Vulnerabilidad y Riesgo debido a la inundación por Tsunami en la costa de El Salvador, 526
Spanish Agency for International Development Cooperation (AECID), available at: http://www.ihcantabria.com/es/proyectos-527
id/item/843-tsunami-vulnerability-risk-el-salvador (last access: September 2017, in Spanish), 2012. 528
INFORM. Index for Risk Management. Results 2017. Inter-Agency Standing Committee Reference Group on Risk, Early 529
Warning and Preparedness and European Commission, 2017. 530
ISO Guide 73:2009.: Risk management — Vocabulary. International Electrotechnical Commission/International Organization 531
for Standardization. IEC/ISO, available at: https://www.iso.org/standard/44651.html, 2009 532
Jelínek, R., Eckert, S., Zeug, G., and Krausmann, E.: Tsunami Vulnerability and Risk Analysis Applied to the City of 533
Alexandria, Egypt, Tsunami Risk ANd Strategies For the European Region (TRANSFER Project), 2009. 534
Nat. Hazards Earth Syst. Sci. Discuss., https://doi.org/10.5194/nhess-2017-448Manuscript under review for journal Nat. Hazards Earth Syst. Sci.Discussion started: 9 January 2018c© Author(s) 2018. CC BY 4.0 License.

22
Jelínek, R., Krausmann, E., Gonzalez, M., Álvarez-Gómez, J.L., Birkmann, J. and Welle, T.: Approaches for tsunami risk 535
assessment and application to the city of Cádiz, Spain. Natural Hazards 60:273–293, doi: 10.1007/s11069-011-0009-0, 2012. 536
Jenks, G. F.: The data model concept in statistical mapping, Int. Yearbook Cartogr., 7, 186–190, 1967. Jordan, B. R.: Tsunamis 537
of the Arabian Peninsula. A guide of historic events. Science of Tsunami Hazards 27: 31-46, 2008. 538
Jonkman, S. N., Vrijling, J. K., and Vrouwenvelder, A. C. W. M.: Methods for the estimation of loss of life due to floods: a 539
literature review and a proposal for a new method, Nat. Hazards, 46, 353–389, doi:10.1007/s11069-008-9227-5, 2008. 540
Jordan, B. R.: Tsunamis of the Arabian Peninsula. A guide of historic events. Science of Tsunami Hazards 27: 31-46, 2008. 541
Karvonen, R.A., Hepojoki, H.K., Huhta, H.K. and A. Louhio.: The use of physical models in dam-break analysis. 542
RESCDAM Final Report, Helsinki University of Technology, Helsinki, Finland, 2000. 543
Koshimura, S., Katada, T., Mofjeld, H.O., Kawata, Y.: A method for estimating casualties due to the tsunami inundation flow. 544
Nat Hazards 39: 265. https://doi.org/10.1007/s11069-006-0027-5, 2006. 545
Linham, M. and Nicholls, R.J.: Technologies for Climate Change Adaptation: Coastal erosion and flooding. TNA Guidebook 546
Series. UNEP/GEF, 2010. 547
Leone, F., Lavigne, F., Paris, R., Denain, J. C. & Vinet, F.: A spatial analysis of the December 26th, 2004 tsunami-induced 548
damages: lessons learned for a better risk assessment integrating buildings vulnerability. Appl. Geogr. 31, 363–375, 2011. 549
Løvholt, F., Setiadi, N. J., Birkmann, J., Harbitz, C. B., Bach, C., Fernando, N., Kaiser, G., and Nadim, F.: Tsunami risk 550
reduction–are we better prepared today than in 2004? International Journal of Disaster Risk Reduction, 10, 127-142, DOI: 551
10.1016/j.ijdrr.2014.07.008, 2014. 552
Mas, E., Koshimura, S., Suppasri, A., Matsuoka, M., Matsuyama, M., Yoshii, T., Jimenez, C., Yamazaki, F., and Imamura, 553
F.: Developing Tsunami fragility curves using remote sensing and survey data of the 2010 Chilean Tsunami in Dichato, Nat. 554
Hazards Earth Syst. Sci., 12, 2689-2697, https://doi.org/10.5194/nhess-12-2689-2012, 2012. 555
Mokhtari, M.: Tsunami in Makran Region and its effect on the Persian Gulf. In: Tsunami - A Growing Disaster. Edited by 556
Mohammad Mokharti. ISBN 978-953-307-431-3. Published by InTech, 2011. 557
Nicholls, R.J., Cooper, N. and Townend, I.H.: The management of coastal flooding and erosion in Thorne, C.R. et al. (Eds.). 558
Future Flood and Coastal Erosion Risks. London: Thomas Telford, 392-413, 2007. 559
Sato, H., Murakami, H., Kozuki, Y., Yamamoto, N.: Study on a Simplified Method of Tsunami Risk Assessment Natural 560
Hazards 29: 325. https://doi.org/10.1023/A:1024732204299, 2003. 561
Schmidt-Thomé, P. (Ed.): ESPON Project 1.3.1 – Natural and technological hazards and risks affecting the spatial development 562
of European regions. Geological Survey of Finland, 2006. 563
Strunz, G., Post, J., Zosseder, K., Wegscheider, S., Mück, M., Riedlinger, T., Mehl, H., Dech, S., Birkmann, J., Gebert, N., 564
Harjono, H., Anwar, H. Z., Sumaryono, Khomarudin, R. M., and Muhari, A.: Tsunami risk assessment in Indonesia, Nat. 565
Hazards Earth Syst. Sci., 11, 67–82, doi:10.5194/nhess-11-67-2011, 2011. 566
Sugimoto, T., Murakami, H., Kozuki, Y., Nishikawa, K., Shimada, T.: A Human Damage Prediction Method for Tsunami 567
Disasters Incorporating Evacuation Activities. Natural Hazards 29:587. https://doi.org/10.1023/A:1024779724065, 2003. 568
Suppasri A, Koshimura S, Imamura F.: Developing tsunami fragility curves based on the satellite remote sensing and the 569
numerical modeling of the2004 Indian Ocean tsunami in Thailand. Nat. Hazards Earth Syst Sci 2011;11:173–89, 570
http://dx.doi.org/10.5194/nhess-11-173-2011, 2011. 571
Suppasri, A., Mas, E., Charvet, I., Gunasekera, R., Imai, K., Fukutani, Y., Abe, Y. & Imamura, F.: Building damage 572
characteristics based on surveyed data and fragility curves of the 2011 Great East Japan tsunami. Nat. Hazards 66, 319–341, 573
2013. 574
Suppasri, A., Leelawat, N., Latcharote, P., Roeber, V., Yamashita K., Hayashi, A., Ohira, H., Fukui, K., Hisamatsu, A., 575
Nguyen, D., Imamura, F.: The 2016 Fukushima earthquake and tsunami: Local tsunami behavior and recommendations for 576
Nat. Hazards Earth Syst. Sci. Discuss., https://doi.org/10.5194/nhess-2017-448Manuscript under review for journal Nat. Hazards Earth Syst. Sci.Discussion started: 9 January 2018c© Author(s) 2018. CC BY 4.0 License.
23
tsunami disaster risk reduction. International Journal of Disaster Risk Reduction, 21 (2017) 323-330, doi: 577
10.1016/j.ijdrr.2016.12.016, https://doi.org/10.1016/j.ijdrr.2016.12.016, 2017. 578
Taubenböck, H., Post, J., Roth, A., Zosseder, K., Strunz, G., and Dech, S.: A conceptual vulnerability and risk framework as 579
outline to identify capabilities of remote sensing, Nat. Hazards Earth Syst. Sci., 8, 409–420, 2008, http://www.nat-hazards-580
earth-syst-sci.net/8/409/2008/. 581
Tinti, S., Tonini, R., Bressan, L., Armigliato, A., Gardi, A., Guillande, R., Valencia, N., and Scheer, S.: Handbook of Tsunami 582
Hazard and Damage Scenarios, SCHEMA project (Scenarios for Hazard induced Emergencies Management), European 583
Commission’s Joint Research Centre, Institute for the Protection and Security of the Citizen, EU Publications Office, 584
Luxembourg, 2011. 585
UN (United Nations): Report of the open-ended intergovernmental expert working group on indicators and terminology 586
relating to disaster risk reduction. United Nations General Assembly A/71/644.1 December 2016. New York, USA, 2016. 587
UNFCCC: Coastal Adaptation Technologies. Bonn: UNFCCC, 1999. 588
UNESCO (United Nations Educational, Scientific and Cultural Organization): Hazard Awareness and Risk Mitigation in 589
Integrated Coastal Management (ICAM), IOC Manual and Guides No. 50, ICAM Dossier No. 5, UNESCO, Paris, 2009a. 590
UNESCO (United Nations Educational, Scientific and Cultural Organization): Tsunami risk assessment and mitigation for the 591
Indian Ocean, Knowing your tsunami risk – and what to do about it, IOC Manuals and Guides No. 52, UNESCO, Paris, 2009b. 592
UNISDR (United Nations International Strategy for Disaster Reduction): Living with Risk: a Global Review of Disaster 593
Reduction Initiatives, 2004 version, UN Publications, Geneva, 2004. 594
UNISDR (United Nations International Strategy for Disaster Reduction): Terminology on Disaster Risk Reduction. Published 595
by the UN/ISDR. Geneva, Switzerland, May 2009. 596
UNISDR/CRED: Tsunami Disaster Risk: Past impacts and projections. United Nations Office for Disaster Risk Reduction 597
(UNISDR), Centre for Research on the Epidemiology of Disasters (CRED), available at: http://www.preventionweb.net/ 598
files/50825_credtsunami08. pdf, 2016. 599
UNISDR (United Nations International Strategy for Disaster Reduction): Global Assessment Report on Disaster Risk 600
Redcution. GAR Atlas, available at: https://www.unisdr.org/we/inform/publications/53086, 2017. 601
Valencia, N., Gardi, A., Gauraz, A., Leone, F., and Guillande, R.: New tsunami damage functions developed in the framework 602
of SCHEMA project: application to European-Mediterranean coasts, Nat. Hazards Earth Syst. Sci., 11, 2835-2846, 603
https://doi.org/10.5194/nhess-11-2835-2011, 2011. 604
Wegscheider, S., Post, J., Zosseder, K., Mück, M., Strunz, G., Riedlinger, T., Muhari, A., and Anwar, H. Z.: Generating 605
tsunami risk knowledge at community level as a base for planning and implementation of risk reduction strategies, Nat. 606
Hazards Earth Syst. Sci., 11, 249–258, doi:105194/nhess-11-249-2011, 2011 607
Wijetunge, L. J.: A deterministic analysis of tsunami hazard and risk for the southwest coast of Sri Lanka, Cont. Shelf Res., 608
79, 23–35, 2014. 609
Wang X.: COMCOT User Manual Ver. 1.7, 59 pp. Cornell University, 2009 610
Xia, J., Falconer, R.A, Wang, Y. and Xiao, X.: New criterion for the stability of a human body in floodwaters. 611
Journal of Hydraulic Research, 52(1), pp.93–104, 2014. 612
Nat. Hazards Earth Syst. Sci. Discuss., https://doi.org/10.5194/nhess-2017-448Manuscript under review for journal Nat. Hazards Earth Syst. Sci.Discussion started: 9 January 2018c© Author(s) 2018. CC BY 4.0 License.