fructan accumulation in wheat stems during kernel filling
TRANSCRIPT

Fructan accumulation in wheat stems during kernel fillingunder varying nitrogen fertilization
N. Shiomi1, N. Benkeblia1, 2, S. Onodera1, T. Yoshihira1, S. Kosaka1, and M. Osaki2
1Department of Food and Nutrition Sciences, Graduate School of Dairy Science Research, 582 BunkyodaiMidorimachi, Rakuno Gakuen University, Ebetsu, Hokkaido 069-8501, Japan (e-mail: [email protected]);
and 2Department of Bioscience and Chemistry, Graduate School of Agriculture, Faculty of Agriculture, Hokkaido University, Sapporo, Hokkaido 060-8589, Japan.
Received 23 November 2005, accepted 16 May 2006.
Shiomi, N., Benkeblia, N., Onodera, S., Yoshihira, T., Kosaka, S. and Osaki, M. 2006. Fructan accumulation in wheat stemsduring kernel filling under varying nitrogen fertilization. Can. J. Plant Sci. 86: 1027–1035. The authors studied the accumu-lation of saccharides (glucose, fructose and sucrose) and fructans (1-ketsose, 6-kestose, oligofructosaccharides and polyfructosac-charides) in three different internodes of wheat stems receiving varying nitrogen supply at different stages of growth. Four levelsof nitrogen supply, N1 (0, 0 and 100 kg ha–1), N2 (40, 0 and 0 kg ha–1), N3 (40, 120 and 0 kg ha–1) and N4 (40, 60 and 0 kg ha–1,standard fertilization in Hokkaido), were applied before sowing, at the six leaf stage and at the flag leaf stage, respectively.Glucose, fructose, sucrose, 1-kestose, 6-kestose, oligofructosaccharides and polyfructosaccharides were assessed in internodes 1(upper part), internodes 2 (middle part) and internodes 3 (lower part) of the stems during early milky, middle milky and dough ripestages. During the dough ripe stage, glucose content decreased in N1 and N2 stems, increased in N3 stems, and varied slightly inN4 stems. Fructose content was lower during the early milky stage and increased significantly during the middle milky and doughripe stages. Sucrose content of N1 and N2 stems increased significantly during dough ripe stage, while these of N3 and N4 stemsdid not vary significantly. The levels of 1-kestose and 6-kestose in N1 stems were high compared with N2, N3 and N4 stems.However, their contents decreased during the dough ripe stage for 6-kestose. Oligosaccharides have shown similar variation bydecreasing during the dough ripe stage, while polysaccharides decreased in N1 and N2 stems, but varied weakly in N3 and N4stems. Total fructooligosaccharides (FOS) decreased during the dough ripe stage, particularly in internodes 1, while total FOS ofinternodes 3 remained quite stable. Comparatively, internodes 1 showed the lowest content compared with internodes 2 and 3. Theresults showed that fructans accumulated early, while a decreasing gradient was often observed from the bottom to the top of thestems. Results also showed that under N1 nitrogen fertilization rate, wheat plants accumulated high contents of fructans, and thisfertilization rate could be applied in the Hokkaido region.
Key words: Nitrogen, fertilization, stems, fructans, accumulation, Triticum aestivum
Shiomi, N., Benkeblia, N., Onodera, S., Yoshihira, T., Kosaka, S. et Osaki, M. 2006. Accumulation des fructanes durant le rem-plissage du grain dans les tiges du blé fertilisé avec différent apports azotés. Can. J. Plant Sci. 86: 1027–1035. Les auteurs ontétudiés l’accumulation des saccharides (glucose, fructose et saccharose) et des fructanes (1-kestose, 6-kestose, oligosaccharides etpolysaccharides) dans trois différentes internodes des tiges de blé recevant différents apports azotés à différents stades dedéveloppement. Quatre apports azotés N1 (0, 0 et 100 kg ha–1), N2 (40, 0 et 0 kg ha–1), N3 (40, 120 et 0 kg ha–1) et N4 (40, 60 et0 kg ha–1, fertilisation standard utilisée à Hokkaido) ont été appliqués, avant le semis, au stade six feuilles et au tallage respec-tivement. Les teneurs en glucose, fructose, saccharose, 1-kestose, 6-ketose, oligosaccharides et polysaccharides ont été dosées dansles internodes 1 (parties supérieures de la tige), les internodes 2 (parties centrales) et les internodes 3 (parties inférieures) durantle stade laiteux, mi-laiteux et farineux. Durant le stade farineux, la teneur en glucose diminua dans les tiges de N1 et N2, augmen-ta pour N3, alors qu’elle varia légèrement dans les tiges de N4. La teneur en fructose était plus faible durant le stade laiteux et aug-menta significativement durant le stade mi-laiteux et farineux. Le saccharose des tiges de N1 et N2 augmenta significativementdurant le stade farineux, alors qu’il ne varia pas significativement pour N3 et N4. Les teneurs du 1-kestose et du 6-kestose pour N1étaient plus élevées comparées à celles de N2, N3 et N4. Cependant leurs teneurs diminuèrent durant le stade farineux partic-ulièrement le 6-kestose. Les oligosaccharides varièrent similairement en diminuant durant le stade farineux, alors que les poly-saccharides diminuèrent dans les tiges de N1 et N2, mais varièrent légèrement pour N3 et N4. Les teneurs totales enfructooligosaccharides (FOS) diminuèrent durant le stade farineux surtout dans les internodes 1, alors que les FOS totaux dans lesinternodes 3 demeurèrent relativement stables. Les teneurs les plus faibles ont été observées dans les internodes 1, comparées àcelles des internodes 2 et 3. Les résultats ont montré que les fructanes s’accumulèrent très tôt, alors qu’un gradient décroissant aété observé du bas vers le haut des tiges. Les résultats ont aussi montré que l’apport azoté N1 a permis une accumulation plus élevéedes fructanes, et cet apport de fertilisation pourrait être appliqué dans la région de Hokkaido.
Mots clés: Azote, fertilisation, accumulation, fructanes, tiges, Triticum aestivum
Abbreviations: FOS, fructooligosaccharides; FW, freshweight; PAD, pulsed amperometric detector; WSC, water-soluble carbohydrate
1027
1028 CANADIAN JOURNAL OF PLANT SCIENCE
So far back as we know, wheat is one of the cereal crops thathas long been important to human development. The impor-tance of cereals for humans rests partly in their sturdinessand good roots, partly in the large grains, with their compactcontent of starch and proteins, and partly in the extreme dry-ness of these grains, which allows easy storage for a longtime even under rigorous conditions.
Fructans, also known as fructooligosaccharides (FOS),polyfructosylsucroses of varying molecular size, are impor-tant soluble polysaccharides in many species of cereals andgrasses. They are stored in the cell vacuoles of fully devel-oped leaves when their synthesis rate (photosynthesis)exceeds their export rate (Pollock and Cairns 1991). In addi-tion to their role in carbon storage, fructans have been impli-cated in other physiological functions such as protectingplants against drought or cold stress (Hendry 1993; Hendryand Wallace 1993, Vijn and Smeekens 1999) or as osmoreg-ulators (Hendry 1993; Hincha et al. 2000; Livingston andHenson 1998), although the molecular mechanisms behindthese putative roles still remain unclear. According toWardlaw and Willenbrink (1994) and Yukawa et al. (1995),the main storage forms of non-structural carbohydrates inthe stem (culm + sheath) of wheat, as of temperate grasses,are sucrose and mixed-type fructans with both β-(2,1) andβ-(2,6)-linked fructofuranosyl units. This storage peaks wellinto the period of grain filling, but declines during the laterstage of kernel development (Gebbing 2003; Pollock andCairns 1991). Moreover, the grain filling depends on remo-bilization of fructan reserves stored in the stem either pre- orpost-anthesis (Wardlaw and Willenbrinnk 1994). Most esti-mates of the contribution of stem reserves to grain filling are25 to 30% of the final grain weight under non-stress condi-tions (Gebbing and Schnyder 1999; Wardlaw andWillenbrinnk 2000).
Nitrogen (N) is one of the main factors controlling cropgrowth of winter cereals, and its application amount must becarefully managed and synchronized with crop demand.Under temperate conditions, the photosynthetic activities ofthe tissues depend partly on crop N uptake (Sylvester-Bradley et al. 1997). It is considered to be one of the exter-nal factors that can alter the amount of reserve carbohydratein fructan-accumulating plants (Pollock 1986; Diekmannand Fischbeck 2005a, b). Despite the extensive literatureavailable on nitrogen fertilization of cereals (Schnyder1993; McGrath et al. 1997; Karamanos et al. 2005; Sielinget al. 2005), little research has focused on the effects ofnitrogen supply and fructan accumulation. Some investiga-tions have reported that long- or short-term nitrogen defi-ciency stimulates fructans and sucrose accumulation inbarley (Archbold 1938; Wang and Tillberg 1996; Wang etal. 2000); however, the effects of nitrogen fertilization ondifferent types of FOS levels in wheat stems have not beenstudied. Nevertheless, Diekmann and Fischbeck (2005b) didnot observed significant difference in water-soluble carbo-hydrate (WSC) accumulation between unfertilized and addi-tional N supplied wheat; however, they reported WSCvaried in response to N supply within cultivar-specific pat-terns.
Because of the importance of carbohydrate accumulationduring the different stages preceding kernel filling, and the
lack of information regarding this, the objective of this studywas to investigate the effects of four different nitrogen sup-plies, applied at different growth stages, on accumulation ofdifferent types of FOS in three different internodes of wheatstems. This investigation also aimed to compare practicalfertilization applied in Hokkaido the region with otherregions, because of the severity of climate during the winter.
MATERIALS AND METHODS
Plant Material and Growth ConditionsThe research was carried out at National AgriculturalResearch Center, Sapporo, Japan (43°07′N, 141°35′E) fromSeptember to July during 2 successive years. The averagetemperatures and rainfalls are as follow: September–November: 8 to 15°C, 112 mm; December–February: –10 to–1°C, 100 mm; March–May: 0 to 9°C, 72 mm;June–August: 14 to 23°C, 87 mm. A highly frost-resistantcultivar of winter wheat (Triticum aestivum L. var.Hakushin) was used for the experiment. The trials were runin a block design with two replications. Plots were sowedduring the middle of September at the rate of 250 plants m–2
with an inter-row distance of 0.3 m.
Nitrogen Treatments and SamplingBecause of the impact of N availability late in the seasonand the effect of N deficiency on fructan accumulation, fourlevels of N were designed and applied as ammonium sulfate(21% N) as described in Table 1. Sampling was carried outduring kernel filling and maturation from late June to themiddle of July, with a 1-wk interval, based on Zadok’s scaleof development. Samples were taken at the early milky stage(scale 73), middle milky stage (scale 75) and dough ripestage (scale 87) of kernel filling. Stem samples (without leafsheaths) were divided into three parts: internodes 1 (twoupper parts of the stem), internodes 2 (two central parts) andinternodes 3 (two lower parts) and stored at –40°C untilused.
Fructooligosaccharide ExtractionFructooligosaccharides were extracted by the method ofShiomi (1992). Tissues (10 g) were homogenized in 80 mLof aqueous ethanol (70 %) using a small amount of calciumcarbonate (0.5 g L–1). The homogenate was boiled underreflux in a water bath for 10 min. Homogenate was then
Table 1. Nitrogen fertilization levels and stages of application during theexperiment
Nitrogen levels (as ammonium sulfate) (kg h–1)
N1 N2 N3 N4Pre-sowing (early Sept) 0 40 40 40~10 cm height (early April) 0 0 120 60Flag-leaf stage (late May) 100 0 0 0
Total 100 40 160 100
N1, early nitrogen deficiency and high late availability; N2, low early nitro-gen availability and severe late deficiency; N3, high nitrogen availability;N4, standard nitrogen fertilization in Hokkaido region.
SHIOMI ET AL. — NITROGEN FERTILIZATION AND FRUCTANS ACCUMULATION IN WHEAT 1029
filtered and the residue extracted three times with aqueousethanol and once with water under the same conditions. Thefiltrates were combined and made up to 500 mL with dis-tilled water. An aliquot of the filtrate (10 mL) was concen-trated under vacuum at 35°C to dryness using a Büchirotavapor (Büchi Laboratoriums-Technik, Flawil,Switzerland). The concentrated sugars were collected in 1mL of water and passed through a 0.45-µm filter and ana-lyzed by high performance anion exchange chromatography(HPAEC, Dionex, Sunnyvale, CA). All processes were runin triplicate.
Fructooligosaccharide AnalysisFructooligosaccharides were separated on an HPLC-carbo-hydrate column PA1, Carbo Pack with a Dionex Bio LCseries HPLC (Sunnyvale, CA) and pulsed amperometricdetector (PAD). The gradient was established by mixingeluent A (150 mM NaOH) with eluent B (500 mM acetate-Na in 150 mM NaOH) in two ways. System I: 0–1 min, 25mM; 1–2 min, 25–50 mM; 2–20 min, 50–200 mM, 20–22min, 500 mM; 22–30, 25 mM. System II: 0–1 min, 25 mM;1–2 min, 25–50 mM; 2–14 min, 50–500 mM, 14–22 min,500 mM; 22–30, 25 mM. The flow rate through the columnwas 1.0 mL min–1. The applied PAD potentials for E1 (500ms), E2 (100 ms) and E3 (50 ms) were 0.01, 0.60 and –0.60V, respectively, and the output range was 1 µC.Fructooligosaccharides are expressed in mg per g freshweight (FW).
Glucose, fructose and sucrose standards were purchasedfrom Nacalai Tesque Inc. (Kyoto, Japan). 1-Kestose [3a, 1F-β-D-fructofuranosylsucrose, 1-kestotriose] and nystose [4a,1F (1-β-D-fructofuranosyl)2 sucrose, 1,1-kestotetraose]were previously prepared in the laboratory as described byTakeda et al. (1994). 6-Kestose [3c, 6F-β-D-fructofura-nosylsucrose, 6-kestotriose] was obtained from the labora-tory of functional biological molecules (Osaka CityUniversity, Japan). Neokestose [3b, 6G-β-D-fructofura-nosylsucrose, 6G-kestotriose], 4b [6G (1-β-D-fructofura-nosyl)2 sucrose 1, 6G-kestotetraose], 4c [1F, 6G –di-β-D-fructofuranosyl sucrose, 1 and 6G-kestotetraose], 5a [1F (1-β-D-fructofuranosyl)3 sucrose, 1, 1, 1-kestopentaose), 5b[6G (1-β-D-fructofuranosyl)3 sucrose, 1, 1, 6G-kestopen-taose], 5c [1F (1-β-D-fructofuranosyl)2- 6G-β-D-fructofura-nosyl sucrose, 1, 1 and 6G-kestopentaose], 5d [1F-β-D-fructofuranosyl- 6G (1-β-D-fructofuranosyl)2 sucrose, 1 and1, 6G-kestopentaose], and DP 6b, 6c, 6d1, 6d2 isomers andDP up to 12 were obtained from asparagus roots asdescribed in previous papers (Shiomi et al. 1976, 1979;Shiomi 1981). The standards 6a [1F (1-β-D-fructofura-nosyl)4 sucrose, 1, 1, 1, 1-kestohexaose) and 7a [1F (1-β-D-fructofuranosyl)5 sucrose, 1, 1, 1, 1, 1-kestoheptaose)] wereprepared from Jerusalem artichoke tubers in our laboratory.Levan oligosaccharides (DP 4–9) and levan polysaccharideswere also prepared from timothy plant. Because the fructannomenclature is not simple and the structures are very com-plex, the nomenclatures for FOS proposed by Lewis (1993)and Waterhouse and Chatterton (1993) were also used. Allisolated and synthesized standards are of high grade purity(≥ 99.8%).
All analyses were carried out in triplicate, the experimentwas conducted in duplicate (2 successive years) and datawere averaged (n = 6). The data were analyzed statisticallyby comparison of means by one-way ANOVA test usingGraphPad Instat 3.06 (GraphPad Software Inc, San Diego,CA).
RESULTSThe accumulation of glucose showed significant variationamong the different N sources during growth development(Fig. 1). At early stages, total glucose content of the threeinternodes ranged from 20.59 to 46.42 mg g–1 FW and, N1and N2 stems showed the highest accumulation, while N4stems had the lowest level of total glucose. Afterwards andduring the middle milky stage, total glucose content of thethree internodes increased significantly, ranging from 35.45to 69.01 mg g–1 FW, showing, however, the same previouspatterns, while N4 stems showed the lowest level. Duringthe last stage, total glucose content also decreased signifi-cantly in N1, N2 and N4 stems with 47.41, 14.31 and 18.95mg g–1 FW, respectively, but remained high in N3 stemswith an average content of 74.80 mg. Comparatively, theinternodes 3 (lower part) showed the highest glucose con-tent compared with the other two internodes (upper andmiddle). The glucose content observed in N3 during the lasttwo stages could possibly be due to the vegetative growthunder high nitrogen supply and relatively higher photosyn-thetic activity leading to higher glucose accumulation in tis-sues.
The accumulation of fructose showed similar patterns toglucose accumulation (Fig. 2). At the early stage, total fruc-tose content of the three internodes of the stems was low,ranging from 46.26 to 56.67 mg g–1 FW, except for N1stems, which showed a high content, 135.24 mg g–1 FW.During the middle milky stage, total fructose contentincreased significantly varying from 113.23 to 181.41 mgg–1 FW; however, no significant difference was observedamong N2, N3 and N4 stems. During the last stage, totalfructose content decreased and its content ranged from111.34 to 137.40 mg g–1 FW. Comparatively, the internodes3 (lower part) also showed the highest fructose content com-pared with the other two internodes.
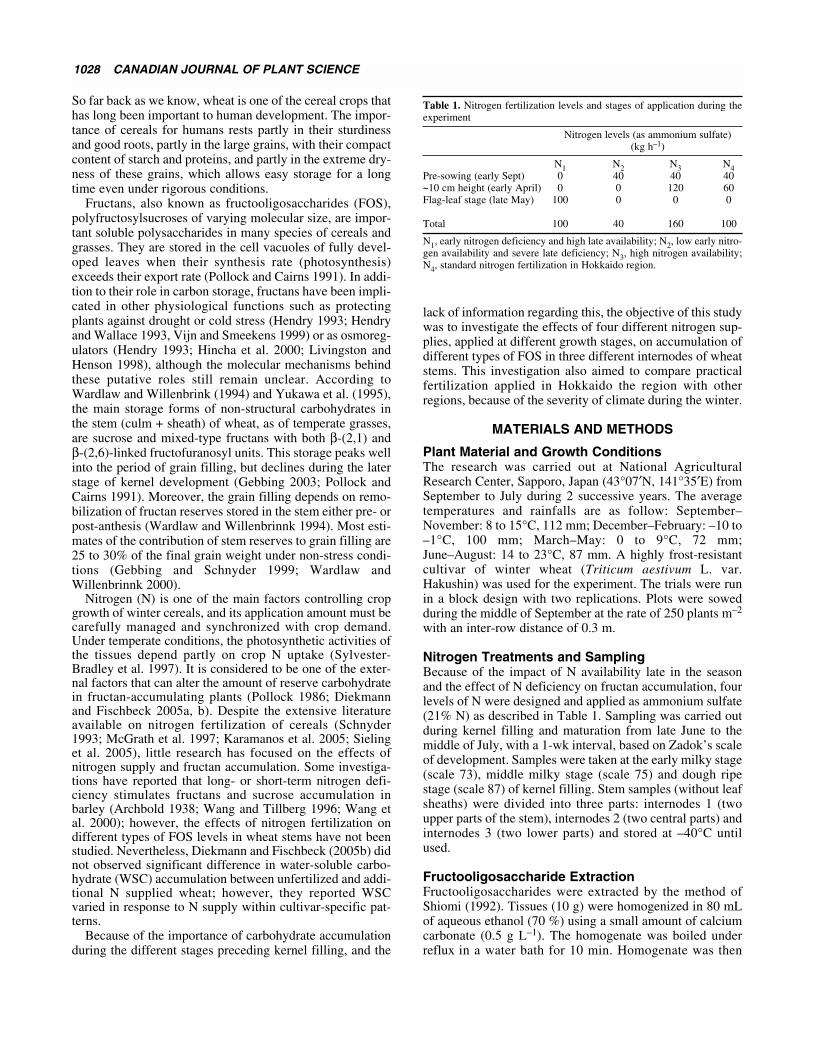
Surprisingly, total sucrose content of N1 stems was weak-ly high, ranging from 63.86 to 115.40 mg g–1 FW, while thatof N2, N3 and N4 stems was comparatively low, rangingfrom 32.43 to 73.95 mg g–1 FW (Fig. 3). It was also notedthat no significant differences were observed among theinternodes of N2, N3 and N4 stems.
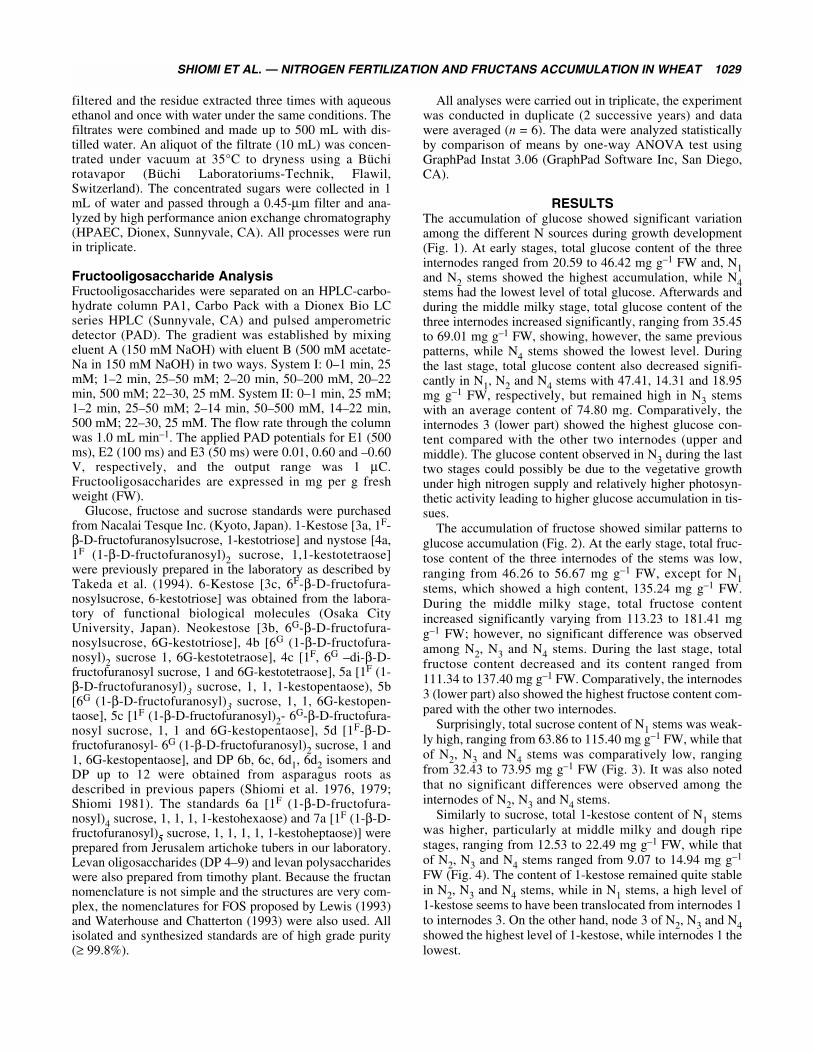
Similarly to sucrose, total 1-kestose content of N1 stemswas higher, particularly at middle milky and dough ripestages, ranging from 12.53 to 22.49 mg g–1 FW, while thatof N2, N3 and N4 stems ranged from 9.07 to 14.94 mg g–1
FW (Fig. 4). The content of 1-kestose remained quite stablein N2, N3 and N4 stems, while in N1 stems, a high level of1-kestose seems to have been translocated from internodes 1to internodes 3. On the other hand, node 3 of N2, N3 and N4showed the highest level of 1-kestose, while internodes 1 thelowest.

1030 CANADIAN JOURNAL OF PLANT SCIENCE
Total content of 6-kestose showed similar variation tothose of 1-kestose (Fig. 5). 6-Kestose content of N1 stemswas high particularly at early and middle milky stages aver-aging 37.05 and 26.65 mg g–1 FW, respectively, while totalcontent was low in N2 during the three stages, and rangedfrom 4.10 to 11.10 mg g–1 FW. However, the total contentof 6-kestose decreased during kernel filling in N1, N2, N3and N4 stems and averaged 10.35, 8.04, 7.88 and 5.55 mgg–1 FW at dough ripe stage, respectively.
Variations in total oligosaccharides (DP 4–9) were partic-ularly similar to those of 6-kestose (Fig. 6). The content ofN1 stems was high and averaged 186.89, 174.94 and 155.90mg g–1 FW during early milky, middle milky and dough ripestages, respectively. On the other hand, the content of N2,N3 and N4 stems was low, averaging 112.12, 50.4 and104.04 mg g–1 FW in N2 stems, 80.01, 30.89 and 39.00 mg
g–1 FW in N3 stems, and, 116.58, 52.74 and 81.55 mg g–1
FW in N4 stems during early milky, middle milky anddough ripe stages, respectively. Comparatively, no signifi-cant differences were observed among N2, N3 and N4 totaloligosaccharide contents at early and middle milky stage,while N1 stems exhibited a high total content and was sig-nificantly different. The lower content of oligosaccharidesin N3 observed during the two stages is a consequence of theabsence of any nitrogen stress and low accumulation offructans. Furthermore, we observed that oligosaccharideaccumulation was higher under severe or low initial nitro-gen fertilization deficiency (N1 and N2), while it was lowerunder normal (N4) or high (N3) initial nitrogen fertilization.
Total polysaccharides (DP ≥ 10) varied similarly tooligosaccharides, although N1 and N2 stems showed a highcontent at early and middle milky stages (Fig. 7). The total
Fig. 2. Fructose content of the different internodes at differentgrowth stages of wheat plant under varying nitrogen fertilizationlevels ( internodes 1; internodes 2; internodes 3).
Fig. 1. Glucose content of the different internodes at differentgrowth stages of wheat plant under varying nitrogen fertilizationlevels ( internodes 1; internodes 2; internodes 3).
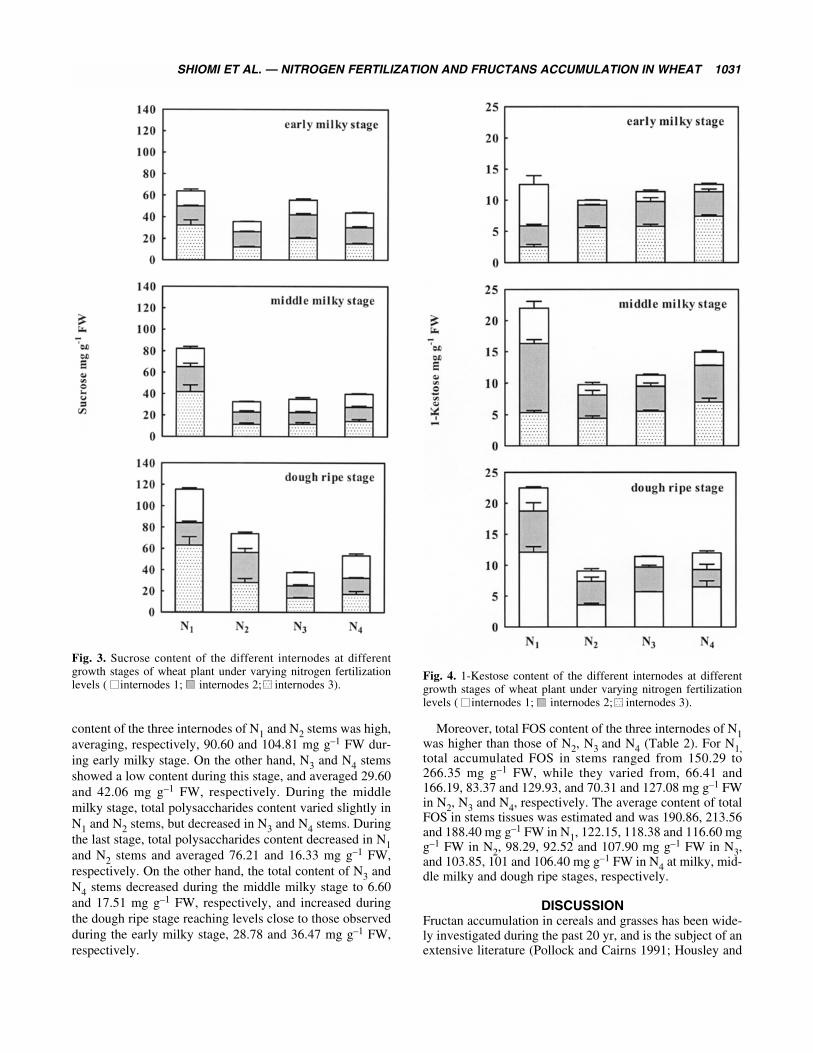
Fig. 3. Sucrose content of the different internodes at differentgrowth stages of wheat plant under varying nitrogen fertilizationlevels ( internodes 1; internodes 2; internodes 3).
Fig. 4. 1-Kestose content of the different internodes at differentgrowth stages of wheat plant under varying nitrogen fertilizationlevels ( internodes 1; internodes 2; internodes 3).
SHIOMI ET AL. — NITROGEN FERTILIZATION AND FRUCTANS ACCUMULATION IN WHEAT 1031
content of the three internodes of N1 and N2 stems was high,averaging, respectively, 90.60 and 104.81 mg g–1 FW dur-ing early milky stage. On the other hand, N3 and N4 stemsshowed a low content during this stage, and averaged 29.60and 42.06 mg g–1 FW, respectively. During the middlemilky stage, total polysaccharides content varied slightly inN1 and N2 stems, but decreased in N3 and N4 stems. Duringthe last stage, total polysaccharides content decreased in N1and N2 stems and averaged 76.21 and 16.33 mg g–1 FW,respectively. On the other hand, the total content of N3 andN4 stems decreased during the middle milky stage to 6.60and 17.51 mg g–1 FW, respectively, and increased duringthe dough ripe stage reaching levels close to those observedduring the early milky stage, 28.78 and 36.47 mg g–1 FW,respectively.
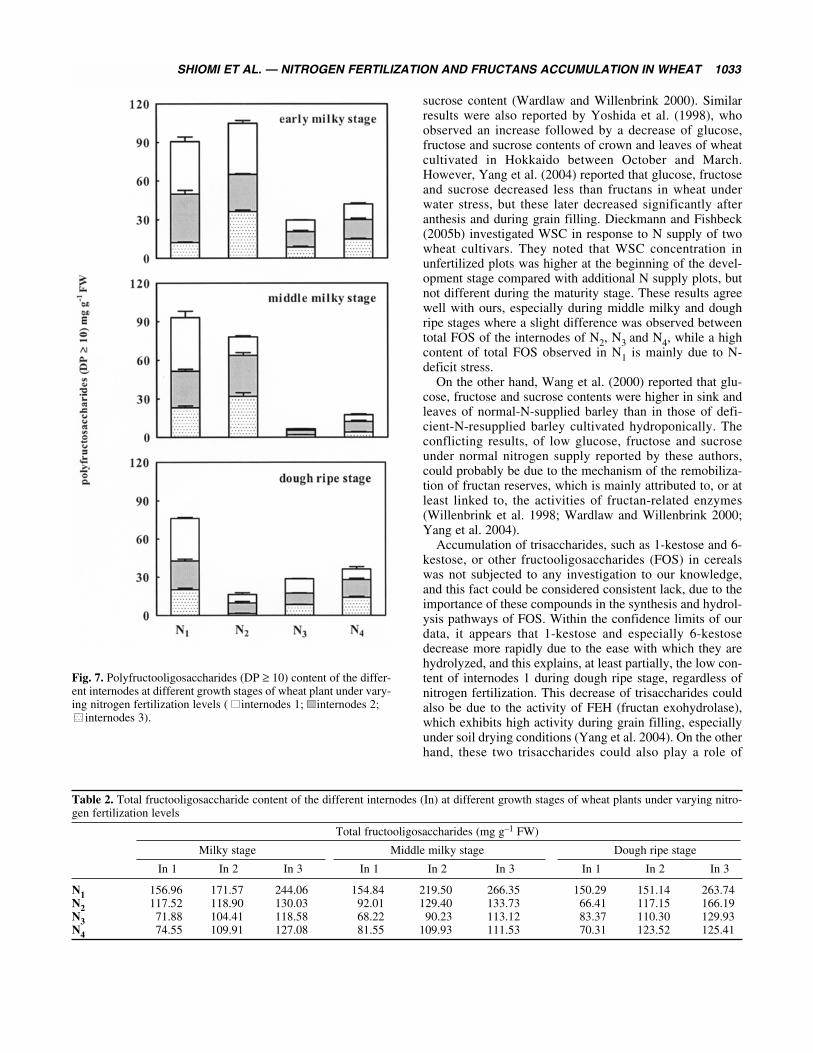
Moreover, total FOS content of the three internodes of N1was higher than those of N2, N3 and N4 (Table 2). For N1,total accumulated FOS in stems ranged from 150.29 to266.35 mg g–1 FW, while they varied from, 66.41 and166.19, 83.37 and 129.93, and 70.31 and 127.08 mg g–1 FWin N2, N3 and N4, respectively. The average content of totalFOS in stems tissues was estimated and was 190.86, 213.56and 188.40 mg g–1 FW in N1, 122.15, 118.38 and 116.60 mgg–1 FW in N2, 98.29, 92.52 and 107.90 mg g–1 FW in N3,and 103.85, 101 and 106.40 mg g–1 FW in N4 at milky, mid-dle milky and dough ripe stages, respectively.
DISCUSSIONFructan accumulation in cereals and grasses has been wide-ly investigated during the past 20 yr, and is the subject of anextensive literature (Pollock and Cairns 1991; Housley and

1032 CANADIAN JOURNAL OF PLANT SCIENCE
Pollock 1993; Schnyder 1993; Henson 2000; Ritsema andSmeekens 2003a, b). Beside this literature, investigation hasfocused on fructan accumulation under stress conditionsincluding nitrogen deficiency, drought stress and salinity,and also a few studies have been carried out on this processduring the growth of barley.
Indeed, because of the large mass of tissue involved,accumulation of fructans in cereal stems is the most readilydetected physiological parameter related to metabolism, andthe final concentration can be as high as 30% of the dryweight, with a gradient of accumulation between the apexand base (Smith 1973; Pollock and Jones 1979). This accu-mulation occurs from the early growth stage and continuesduring stem growth, flowering and anthesis, after whichabrupt reduction occurs during the later stages of kernel fill-ing, when fructans almost completely disappear from stems
(Blacklow et al. 1984). According to Gaudet et al. (2001),this early accumulation provides cold resistance in early-seeded wheat. These results are in agreements with ours,and this could well explain the high fructan contentobserved at the milky stage in N1; this high level is proba-bly the combined effect of frost hardiness and stress nitro-gen deficiency. The study of fructan to nitrogen ratioshowed that total fructan content of the total plant from alow-fertility soil is always higher than that from a medium-fertility site, which in turn is higher than that from a high-fertility site (McGrath et al. 1997).
In this context, Willenbrink et al. (1998) noted that glu-cose, fructose and sucrose contents of peduncle and penulti-mate of wheat decreased during kernel filling, and thisdecrease was more severe under water stress condition(drought); however, slight changes were observed in
Fig. 5. 6-Kestose content of the different internodes at differentgrowth stages of wheat plant under varying nitrogen fertilizationlevels ( n internodes 1; internodes 2; internodes 3).
Fig. 6. Fructooligosaccharides (DP 4–9) content of the differentinternodes at different growth stages of wheat plant under vary-ing nitrogen fertilization levels ( internodes 1; internodes 2;
internodes 3).
SHIOMI ET AL. — NITROGEN FERTILIZATION AND FRUCTANS ACCUMULATION IN WHEAT 1033
sucrose content (Wardlaw and Willenbrink 2000). Similarresults were also reported by Yoshida et al. (1998), whoobserved an increase followed by a decrease of glucose,fructose and sucrose contents of crown and leaves of wheatcultivated in Hokkaido between October and March.However, Yang et al. (2004) reported that glucose, fructoseand sucrose decreased less than fructans in wheat underwater stress, but these later decreased significantly afteranthesis and during grain filling. Dieckmann and Fishbeck(2005b) investigated WSC in response to N supply of twowheat cultivars. They noted that WSC concentration inunfertilized plots was higher at the beginning of the devel-opment stage compared with additional N supply plots, butnot different during the maturity stage. These results agreewell with ours, especially during middle milky and doughripe stages where a slight difference was observed betweentotal FOS of the internodes of N2, N3 and N4, while a highcontent of total FOS observed in N1 is mainly due to N-deficit stress.
On the other hand, Wang et al. (2000) reported that glu-cose, fructose and sucrose contents were higher in sink andleaves of normal-N-supplied barley than in those of defi-cient-N-resupplied barley cultivated hydroponically. Theconflicting results, of low glucose, fructose and sucroseunder normal nitrogen supply reported by these authors,could probably be due to the mechanism of the remobiliza-tion of fructan reserves, which is mainly attributed to, or atleast linked to, the activities of fructan-related enzymes(Willenbrink et al. 1998; Wardlaw and Willenbrink 2000;Yang et al. 2004).
Accumulation of trisaccharides, such as 1-kestose and 6-kestose, or other fructooligosaccharides (FOS) in cerealswas not subjected to any investigation to our knowledge,and this fact could be considered consistent lack, due to theimportance of these compounds in the synthesis and hydrol-ysis pathways of FOS. Within the confidence limits of ourdata, it appears that 1-kestose and especially 6-kestosedecrease more rapidly due to the ease with which they arehydrolyzed, and this explains, at least partially, the low con-tent of internodes 1 during dough ripe stage, regardless ofnitrogen fertilization. This decrease of trisaccharides couldalso be due to the activity of FEH (fructan exohydrolase),which exhibits high activity during grain filling, especiallyunder soil drying conditions (Yang et al. 2004). On the otherhand, these two trisaccharides could also play a role of
Table 2. Total fructooligosaccharide content of the different internodes (In) at different growth stages of wheat plants under varying nitro-gen fertilization levels
Total fructooligosaccharides (mg g–1 FW)
Milky stage Middle milky stage Dough ripe stage
In 1 In 2 In 3 In 1 In 2 In 3 In 1 In 2 In 3
N1 156.96 171.57 244.06 154.84 219.50 266.35 150.29 151.14 263.74N2 117.52 118.90 130.03 92.01 129.40 133.73 66.41 117.15 166.19N3 71.88 104.41 118.58 68.22 90.23 113.12 83.37 110.30 129.93N4 74.55 109.91 127.08 81.55 109.93 111.53 70.31 123.52 125.41
Fig. 7. Polyfructooligosaccharides (DP ≥ 10) content of the differ-ent internodes at different growth stages of wheat plant under vary-ing nitrogen fertilization levels ( internodes 1; internodes 2;
internodes 3).
1034 CANADIAN JOURNAL OF PLANT SCIENCE
buffering compounds between on one hand oligosaccharidesand polysaccharides, and on the other hand sucrose, fructoseand glucose. As illustrated by Fig. 7 and Table 2, the resultssuggest that accumulation of FOS was maximal at the earlystage and declines thereafter. This is in agreement with theevidence that stem reserves, mainly FOS, can contribute sig-nificantly to the final yield, even though there are significantdiscrepancies in estimates of the actual contribution(Schnyder 1993; Pollock et al. 1996). The variation in thesetrisaccharides could also explain the pseudo-steady state andthe content of sucrose and fructose during the last stage ofdevelopment. Thus, the accumulated polymers arehydrolyzed prior to their translocation, and this hydrolysisleads to the formation of sucrose and fructose, which are themain moieties of these polymers. A similar observation wasreported by Goggin and Setter (2004), who noted that totalcarbohydrate and fructan of stems decreased after the anthe-sis stage. These authors also investigated carbohydrate con-centration and composition in different stems tissues(including leaves and ears) comprising leaf sheath and fivedifferent internodes. They found that total soluble carbohy-drate concentrations in the three central internodes weresimilar to each other, but all were significantly higher thanthe other stem tissues; these results are similar to thoseobserved in our study, particularly for N3 and N4.
Furthermore, the results showing the accumulation ofoligosaccharides and polysaccharides during early milkystage and their fall during the dough ripe stage are in agree-ment with those of Wardlaw and Willenbrink (2000),Willenbrink et al. (1998) and Yang et al. (2004). However,this early accumulation is not affected by the varying nitro-gen supply at different stages of development (Longneckerand Robson 1994). On the other hand, the low fructansobserved during the two last stages (middle milky anddough ripe) are the consequence of the stem reserve remo-bilization. This mobilization is mainly affected by waterdeficit, which reduces nitrogen uptake, and the reduction inassimilation during grain filling, under different stresses,induces greater stem reserve mobilization to the grain (Blum1966, 1998). Indeed, the stem carbohydrates have a strongeffect on grain filling whatever the type of stress, eventhough this mobilization is also affected by other factorssuch as genotype (Austin et al. 1977), growth stage (Belland Incoll 1990) and saline soil conditions (Hu et al. 2000).
CONCLUSIONIn conclusion, our results show that FOS, mainly oligo andpoly, are accumulated early during the growth stage andbefore the kernel filling started. As well, demonstrated bynumerous previous investigations, nitrogen deficiencyincreased accumulation of FOS, which decreased during thelater stages of kernel filling, i.e., middle milky and doughripe stages. At first glance, it also seems that the middle partof the stems (internodes 2) might play a role of buffering-parts in the mobilization of FOS due the decreasing gradientobserved from the lower to the upper parts of the stem tis-sues. The nitrogen supply rates N1 (0, 0 and 100) seem toallow wheat to accumulate FOS more efficiently. This fer-tilization could be adapted to the Hokkaido region, where
the climate is severe, because it allows early accumulationof storage carbohydrates, which affect yield, grain quality,and also increase frost tolerance of this crop during thesnowy period of this region. However, further investigationis needed to determine the details of the mobilization gradi-ent that are correlated with the kernel filling, including otherparameters such as grain yield and characteristics.
ACKNOWLEDGEMENTSThe authors are grateful to Professor Masaru Iizuka(Department of Bio- and Geosciences, Graduate School ofScience, Osaka City University, Japan) who kindly provid-ed 6-kestose.
Archbold, H. K. 1938. Physiological studies in plant nutrition.VII. The role of fructosan in the carbohydrate metabolism of bar-ley plant. Part 2. Seasonal changes in the carbohydrates with a noteon the effect of nitrogen deficiency. Ann. Bot. 2: 403–436.Austin, R. B., Edrich, J. A., Ford, M. A. and Blackwell, R. D.1977. The fate of the dry matter, carbohydrate and 14C lost fromthe leaves and stems of wheat during grain filling. Ann. Bot. 41:1309-1341.Bell, C. J. and Incoll, L. D. 1990. The redistribution of assimilatein filed-grown winter wheat. J. Exp. Bot. 41: 949–960.Blacklow, W. M., Darbyshire, B. and Pheloung, P. 1984.Fructans polymerised in the internodes of winter wheat as grain-filling progressed. Plant Sci. Lett. 36: 213–218.Blum, A. 1966. Improving wheat grain filling under stress by stemreserve utilization. Pages 135–142 in H. J. Braun, F. Altay, W. E.Kronstad, S. P. S. Beniwal, and A. McNab, eds. Proc. of the 5thInternational Wheat Conference, Ankara, Turkey.Blum, A. 1998. Improving wheat grain filling under stress by stemreserve mobilization. Euphytica 100: 77-83.Dieckmann, F. and Fischbeck, G. 2005a. Differences in wheatcultivar responses to N supply. I: Differences in grain yield forma-tion. J. Agron. Crop Sci. 191: 351–361.Dieckmann, F. and Fischbeck, G. 2005b. Differences in wheatcultivar responses to N supply. I: Differences in N-metabolism-related traits. J. Agron. Crop Sci. 191: 362–373.Gaudet, D. A., Laroche, A. and Puchalski, B. 2001. Seeding datealters carbohydrate accumulation in winter wheat. Crop Sci. 41:728–738.Gebbing, T. 2003. The enclosed and exposed part of the peduncleof wheat (Triticum aestivum) – spatial separation of fructan stor-age. New Phytol. 159: 245–252.Gebbing, T. and Schnyder, H. 1999. Pre-anthesis reserve utiliza-tion for protein and carbohydrate synthesis in grains of wheat.Plant Physiol. 121: 871–878.Goggin, D. E. and Setter, T. L. 2004. Fructosyltransferase activ-ity and fructan accumulation during development in wheat exposedto terminal drought. Func. Plant Biol. 31: 11-21.Hendry, G. A. F. 1993. Evolutionary origins and natural functionsof fructan. A climatological, biogeographic and mechanisticappraisal. New Phytol. 123: 3–14.Hendry, G. A. F. and Wallace, R. K. 1993. The origin, distribu-tion, and evolutionary significance of fructans. Pages 119–139 inM. Suzuki, and N. J. Chatterton, eds. Science and technology offructans. CRC Press, Boca Raton, FL.Henson, C. A. 2000. Enzymology of fructan metabolism in grass-es. Pages 1–7 in A. K. Gupta and N. Kaur, eds. Carbohydratereserves in plants – Synthesis and regulation. Elsevier, Amsterdam,the Netherlands.Hincha, D. K., Hellwege, E. M., Heyer, A. G. and Crowe, J. H.
SHIOMI ET AL. — NITROGEN FERTILIZATION AND FRUCTANS ACCUMULATION IN WHEAT 1035
2000. Plant fructans stabilize phosphatidylcholine liposomes dur-ing freeze-drying. Eur. J. Biochem. 50: 525–534.Housley, T. L. and Pollock, C. J. 1993. The metabolism of fruc-tan in higher plant. Pages 191–226 in M. Suzuki and N. J.Chatterton, eds. Science and technology of fructans. CRC Press,Boca Raton, FL.Hu, Y., Schnyder, H. and Schmidhalter, U. 2000. Carbohydratedeposition and partitioning in elongating leaves of wheat undersaline soil conditions. Aust. J. Plant Physiol. 27: 363-370.Karamanos, R. E., Flore, N. A. and Harapiak, J. T. 2005. Effectof post-emergence nitrogen application on the yield and proteincontent of wheat. Can. J. Plant Sci. 85: 327-342.Lewis, D. H. 1993. Nomenclature and diagrammatic representa-tion of oligomeric fructans- a paper for discussion. New Phytol.124: 583–594.Livingston, D. P. and Henson, C. A. 1998. Apoplastic sugars,fructans, fructan exohydrolase, and invertase in winter oat:responses to second-phase cold hardening. Plant Physiol. 116:403–408.Longnecker, N. and Robson, A. 1994. Leaf emergence of springwheat receiving varying nitrogen supply at different stages ofdevelopment. Ann. Bot. 74: 1–7.McGrath, V. B., Blakeney, A. B. and Batten, G. D. 1997.Fructan to nitrogen ratio as an indicator of nutrient stress in wheatcrops. New Phytol. 136: 145-152.Pollock, C. J., Cairns, A. J., Sims, I. M. and Housley, T. I. 1996.Fructans as reserve carbohydrates in crop plants. Source–sink rela-tionships. Pages 97–114 in E. Zamski and A. A. Schaffer, eds.Photoassimilate distribution in plants and crops. Marcel Dekker,New York, NY.Pollock, C. J. 1986. Environmental effects on sucrose and fructanmetabolism. Curr. Trop. Plant Biochem. Physiol. 5: 32–46.Pollock, C. J. and Jones, T. 1979. Seasonal patterns of fructanmetabolism in forage grasses. New Phytol. 83: 8–15.Pollock, C. J. and Cairns, A. J. 1991. Fructan metabolism ingrasses and cereals. Annu. Rev. Plant Physiol. Plant. Mol. Biol. 42:77–101.Ritsema, T. and Smeekens, S. 2003a. Engineering fructan metab-olism in Plants. J. Plant Physiol. 160: 811–820.Ritsema, T. and Smeekens, S. 2003b. Fructans: beneficial forplants and humans. Curr. Opinion Plant Biol. 6: 223–230.Schnyder, H. 1993. The role of carbohydrate storage and redistri-bution in the source–sink relations of wheat and barley duringgrain filling – a review. New Phytol. 123: 233–245.Shiomi, N., Yamada, J. and Izawa, M. 1976. Isolation and iden-tification of fructo-oligosaccharides in roots of Asparagus(Asparagus officinalis L.). Agric. Biol. Chem. 40: 567–575.Shiomi, N., Yamada, J. and Izawa, M. 1979. A novel pentasac-charide in the roots of Asparagus (Asparagus officinalis L.). Agric.Biol. Chem. 43: 1375–1377.Shiomi, N. 1981. Two novel hexasaccharides from the roots ofAsparagus officinalis. Phytochemistry 20: 2581–2583.
Shiomi, N. 1992. Content of carbohydrate and activities of fructo-syltransferase and invertase in asparagus roots during fructo-oligosaccharide- and fructo-polysaccharide accumulating season.New Phytol. 122: 421–432.Sieling, K., Stahl, C., Winkelmann, C. and Christen, O. 2005.Growth and yield of winter wheat in the first 3 years of a mono-culture under varying N fertilization in NW Germany. Eur. J.Agron. 22: 71-84.Smith, D. 1973. The nonstructural carbohydrates. Pages 105–155in G. W. Butler and R. W. Bailey, eds. The biochemistry ofherbage. Academic Press, New York, NY.Sylvester-Bradley, R., Scott, R. K., Stokes, D. T. and Clare, R.W. 1997. The significance of crop canopies for N nutrition.Aspects Appl. Biol. 50: 103–116.Takeda, H., Sato, K., Kinoshita, S. and Sasaki, H. 1994.Production of 1-kestose by Scopulariopsis brevicaulis. J. Ferment.Bioeng. 79: 242–246.Vijn, I. and Smeekens, S. 1999. Fructan: more than a reserve car-bohydrate. Plant Physiol. 120: 351–359.Wang, C. and Tillberg, J. E. 1996. Effects of nitrogen deficiencyon accumulation of fructans and fructans metabolizing enzymeactivities in sink and source leaves of barley (Hordeum vulgare).Physiol. Plant. 97: 339–345.Wang, C., Van den Ende, W. and Tillberg, J. E. 2000. Fructanaccumulation induced by nitrogen deficiency in barley leaves cor-relates with the level of sucrose:fructan 6-fructosyltransferasemRNA. Planta 211: 701–707.Wardlaw, I. F. and Willenbrink, J. 1994. Carbohydrate storageand mobilization by the culm of wheat between heading and grainmaturity: the relation to sucrose synthase and sucrose-phosphatesynthase. Aust. J. Plant Physiol. 21: 255–271.Wardlaw, I. F. and Willenbrink, J. 2000. Mobilization of fruc-tan reserves and changes in enzymes activities in wheat stems cor-relate with water stress during kernel filling. New Phytol. 148:413–422.Waterhouse, A. L. and Chatterton, N. J. 1993. Glossary of fruc-tan terms. Pages 1–7 in M. Suzuki and N. J. Chatterton, eds.Science and technology of fructans. CRC Press, Boca Raton, FL.Willenbrink, J., Bonnett, G. D., Willenbrink, S. and Wardlaw,I. F. 1998. Changes of enzyme activities associated with the mobi-lization of carbohydrate reserves (fructans) from the stem of wheatduring kernel filling. New Phytol. 139: 471–478.Yang, J., Zhang, J., Wang, Z., Zhu, Q. and Liu, L. 2004.Activities of fructan- and sucrose-metabolizing enzymes in wheatstems subjected to water stress during grain filling. Planta 220:331–334.Yoshida, M., Abe, J., Moriyama, M. and Kuwabara, T. 1998.Carbohydrate levels among winter wheat cultivars varying infreezing tolerance and snow mold resistance during autumn andwinter. Physiol. Plant. 103: 8–16.Yukawa, T., Kobayashi, M. and Watanabe, Y. 1995. Studies offructan accumulation in wheat (Triticum aestivum L.). Jpn. J. CropSci. 64: 801–806.
