fruit production and export in china - unapcaem.org files/a22/080_china.pdf · enhanced the fruit...
TRANSCRIPT
Fruit Production and Export in
China
Xiuxin Deng
College of Hort. & Forestry
Huazhong Agricultural University
Wuhan, Hubei 430070
P.R.China
The Present Situation of Fruit
Production
• China produced 15.2% of the world total
fruits in 2003;
• The No. one producer of apple, and pear
accounting for 35.5% and 53.1% of the
world total volume respectively.
• No. 2 producer of citrus fruit, with 16 MMT,
about 16% of the world production.
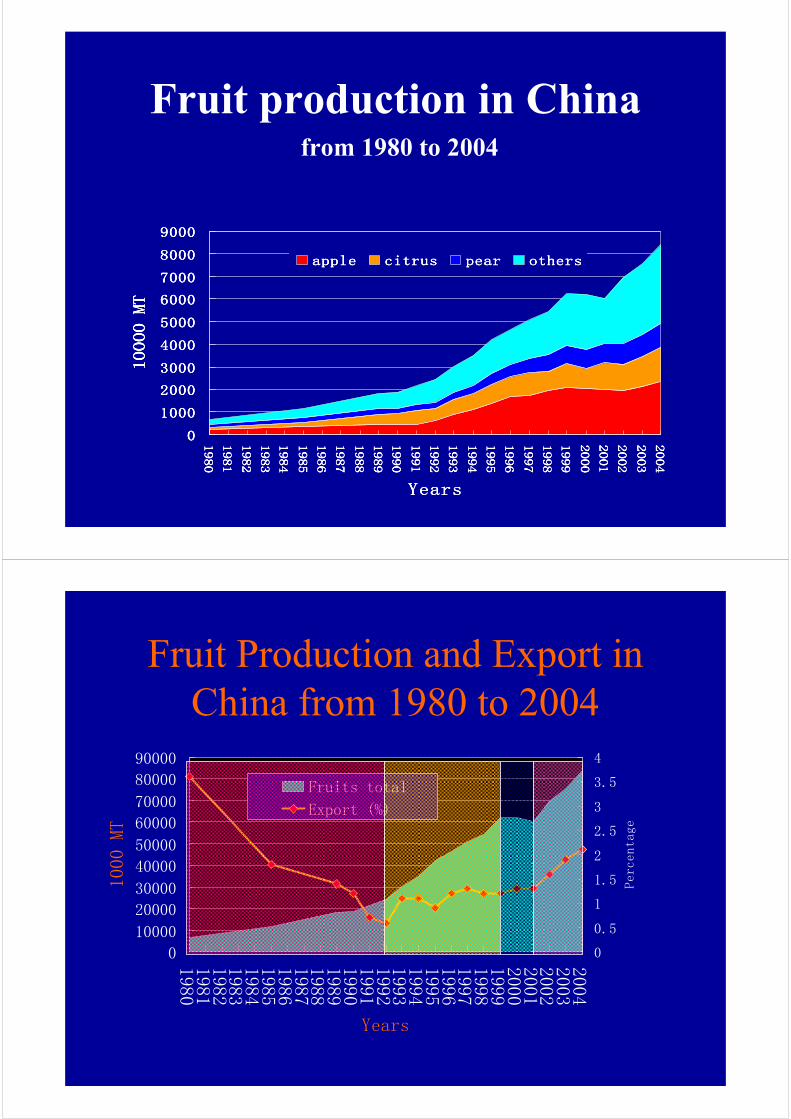
Fruit production in Chinafrom 1980 to 2004
0000
1000100010001000
2000200020002000
3000300030003000
4000400040004000
5000500050005000
6000600060006000
7000700070007000
8000800080008000
9000900090009000
1980
1980
1980
1980
1981
1981
1981
1981
1982
1982
1982
1982
1983
1983
1983
1983
1984
1984
1984
1984
1985
1985
1985
1985
1986
1986
1986
1986
1987
1987
1987
1987
1988
1988
1988
1988
1989
1989
1989
1989
1990
1990
1990
1990
1991
1991
1991
1991
1992
1992
1992
1992
1993
1993
1993
1993
1994
1994
1994
1994
1995
1995
1995
1995
1996
1996
1996
1996
1997
1997
1997
1997
1998
1998
1998
1998
1999
1999
1999
1999
2000
2000
2000
2000
2001
2001
2001
2001
2002
2002
2002
2002
2003
2003
2003
2003
2004
2004
2004
2004
YearsYearsYearsYears
10000 MT
10000 MT
10000 MT
10000 MT
appleappleappleapple citruscitruscitruscitrus pearpearpearpear othersothersothersothers
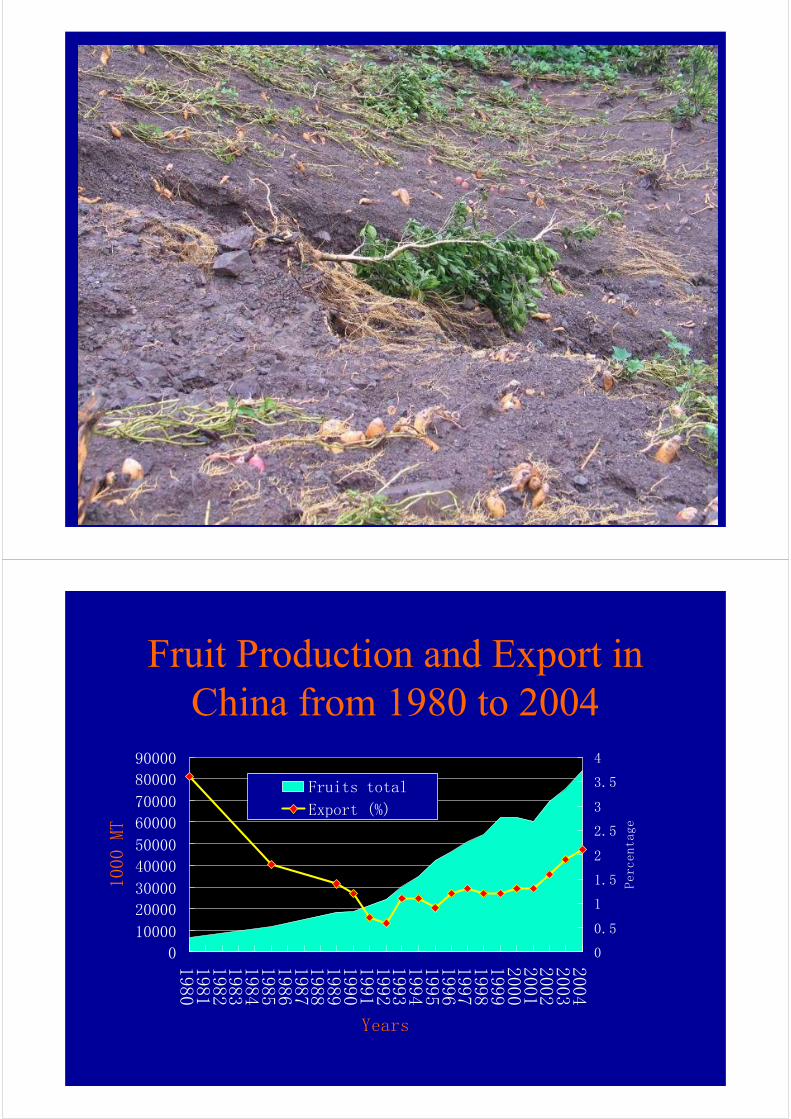
Fruit Production and Export in
China from 1980 to 2004
0
10000
20000
30000
40000
50000
60000
70000
80000
90000
198
0198
1198
2198
3198
4198
5198
6198
7198
8198
9199
0199
1199
2199
3199
4199
5199
6199
7199
8199
9200
0200
1200
2200
3200
4
Years
100
0 MT
0
0.5
1
1.5
2
2.5
3
3.5
4
Percentage
Fruits total
Export (%)
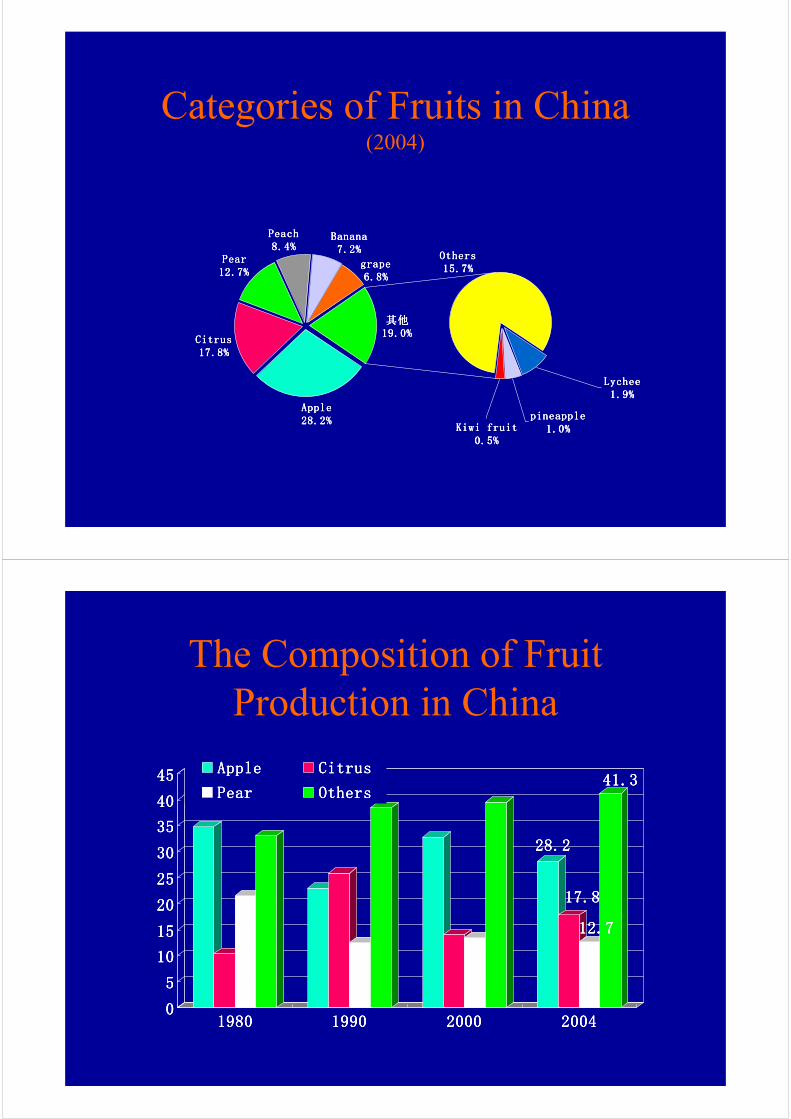
Categories of Fruits in China(2004)
AppleAppleAppleApple28.2%28.2%28.2%28.2%
CitrusCitrusCitrusCitrus17.8%17.8%17.8%17.8%
PearPearPearPear12.7%12.7%12.7%12.7%
PeachPeachPeachPeach8.4%8.4%8.4%8.4%
BananaBananaBananaBanana7.2%7.2%7.2%7.2%
OthersOthersOthersOthers15.7%15.7%15.7%15.7%
其他其他其他其他19.0%19.0%19.0%19.0%
grapegrapegrapegrape6.8%6.8%6.8%6.8%
LycheeLycheeLycheeLychee1.9%1.9%1.9%1.9%
pineapplepineapplepineapplepineapple1.0%1.0%1.0%1.0%Kiwi fruitKiwi fruitKiwi fruitKiwi fruit
0.5%0.5%0.5%0.5%
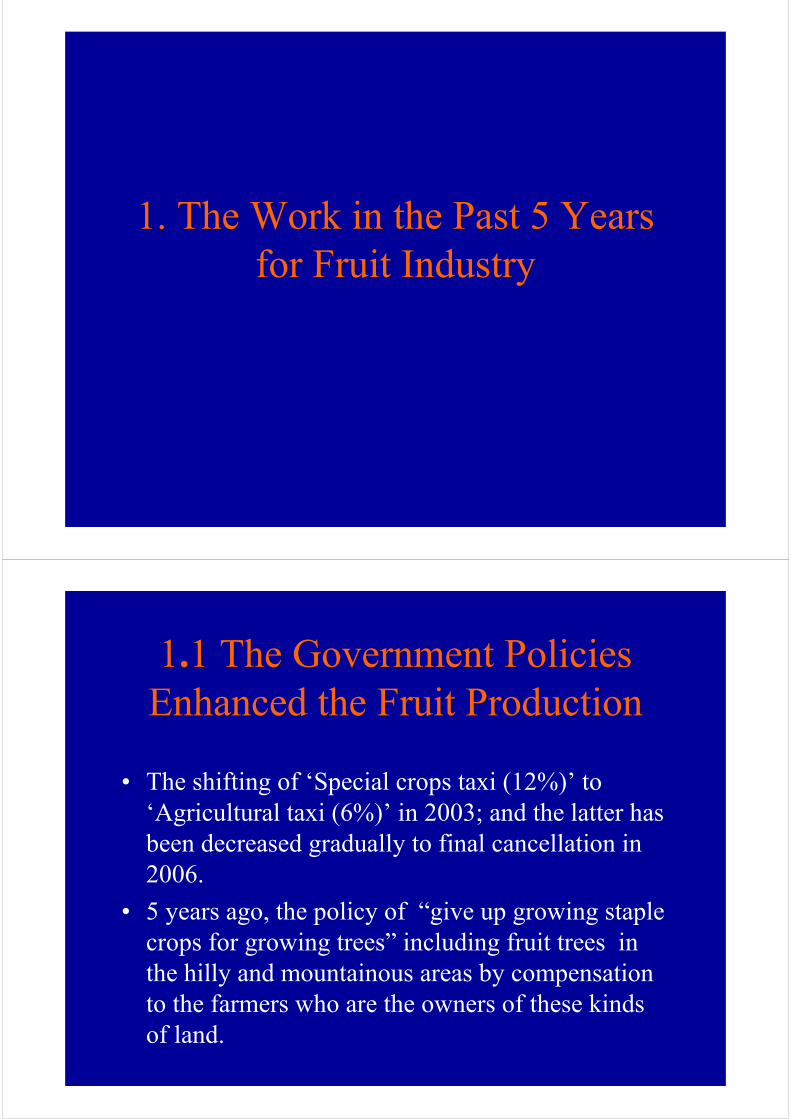
The Composition of Fruit
Production in China
28.228.228.228.2
17.817.817.817.8
12.712.712.712.7
41.341.341.341.3
0000
5555
10101010
15151515
20202020
25252525
30303030
35353535
40404040
45454545
1980198019801980 1990199019901990 2000200020002000 2004200420042004
AppleAppleAppleApple CitrusCitrusCitrusCitrus
PearPearPearPear OthersOthersOthersOthers
1. The Work in the Past 5 Years
for Fruit Industry
1.1 The Government Policies
Enhanced the Fruit Production
• The shifting of ‘Special crops taxi (12%)’ to
‘Agricultural taxi (6%)’ in 2003; and the latter has
been decreased gradually to final cancellation in
2006.
• 5 years ago, the policy of “give up growing staple
crops for growing trees” including fruit trees in
the hilly and mountainous areas by compensation
to the farmers who are the owners of these kinds
of land.
Fruit Production and Export in
China from 1980 to 2004
0
10000
20000
30000
40000
50000
60000
70000
80000
90000
198
0198
1198
2198
3198
4198
5198
6198
7198
8198
9199
0199
1199
2199
3199
4199
5199
6199
7199
8199
9200
0200
1200
2200
3200
4
Years
100
0 MT
0
0.5
1
1.5
2
2.5
3
3.5
4
Percentage
Fruits total
Export (%)
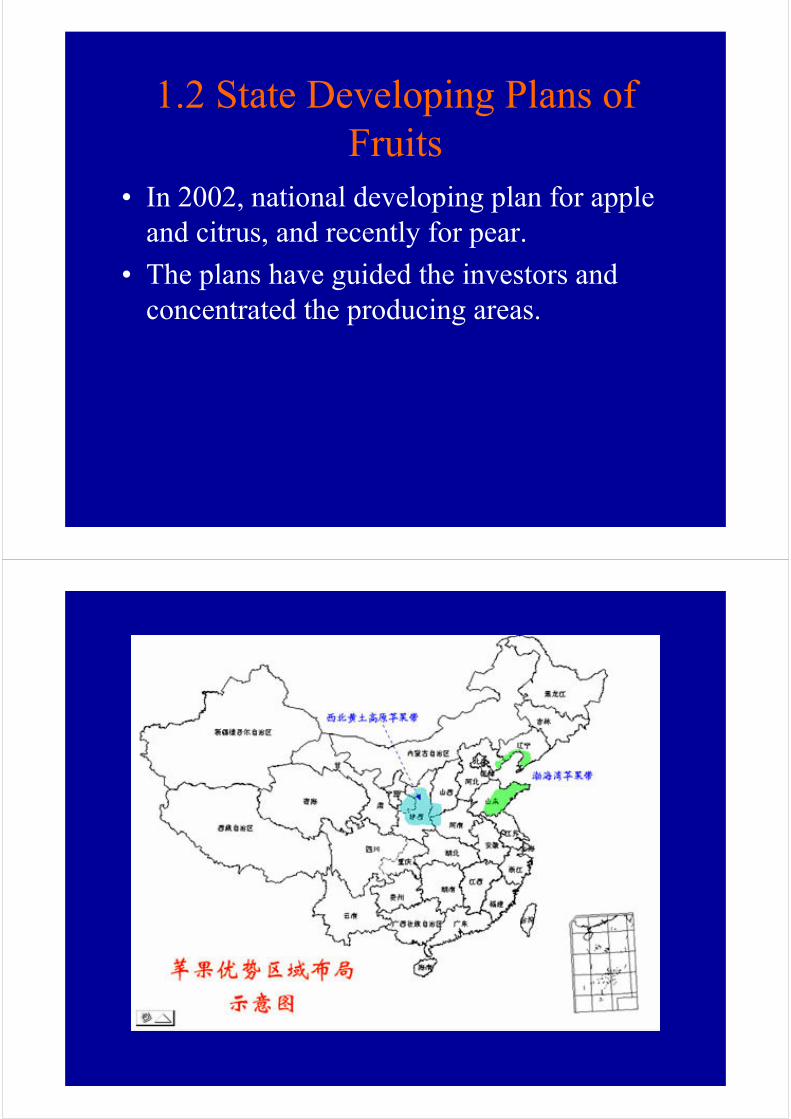
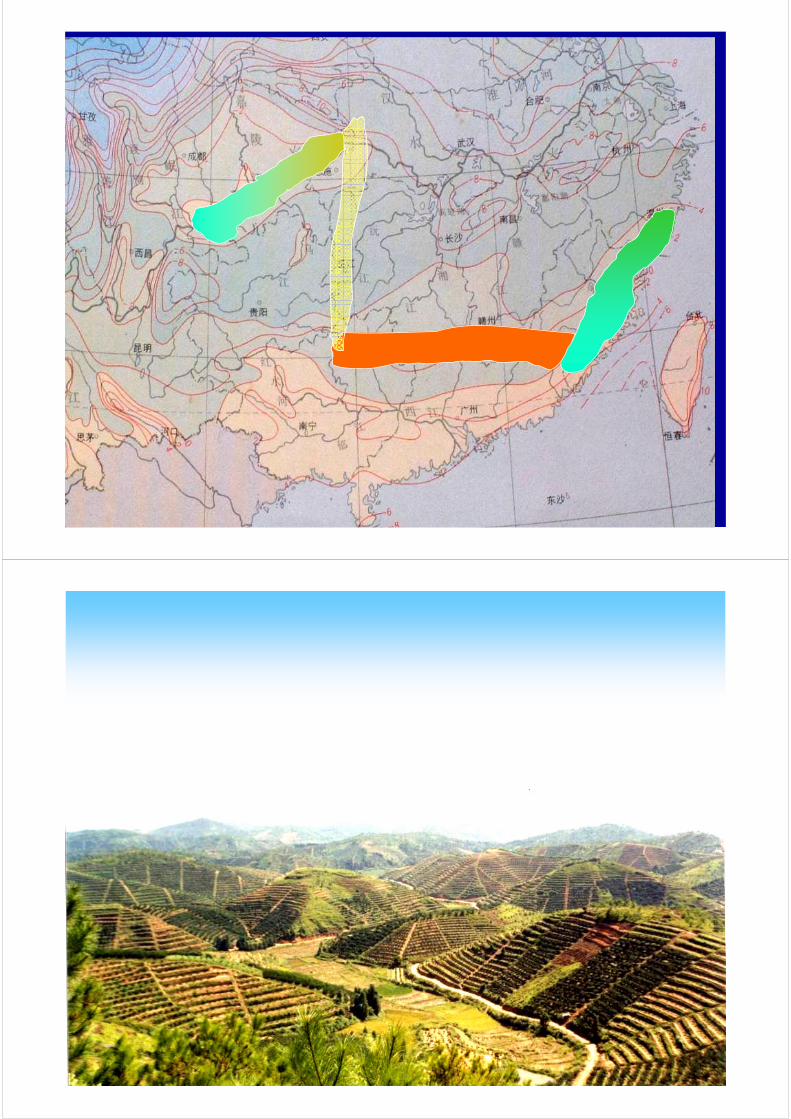
1.2 State Developing Plans of
Fruits
• In 2002, national developing plan for apple
and citrus, and recently for pear.
• The plans have guided the investors and
concentrated the producing areas.
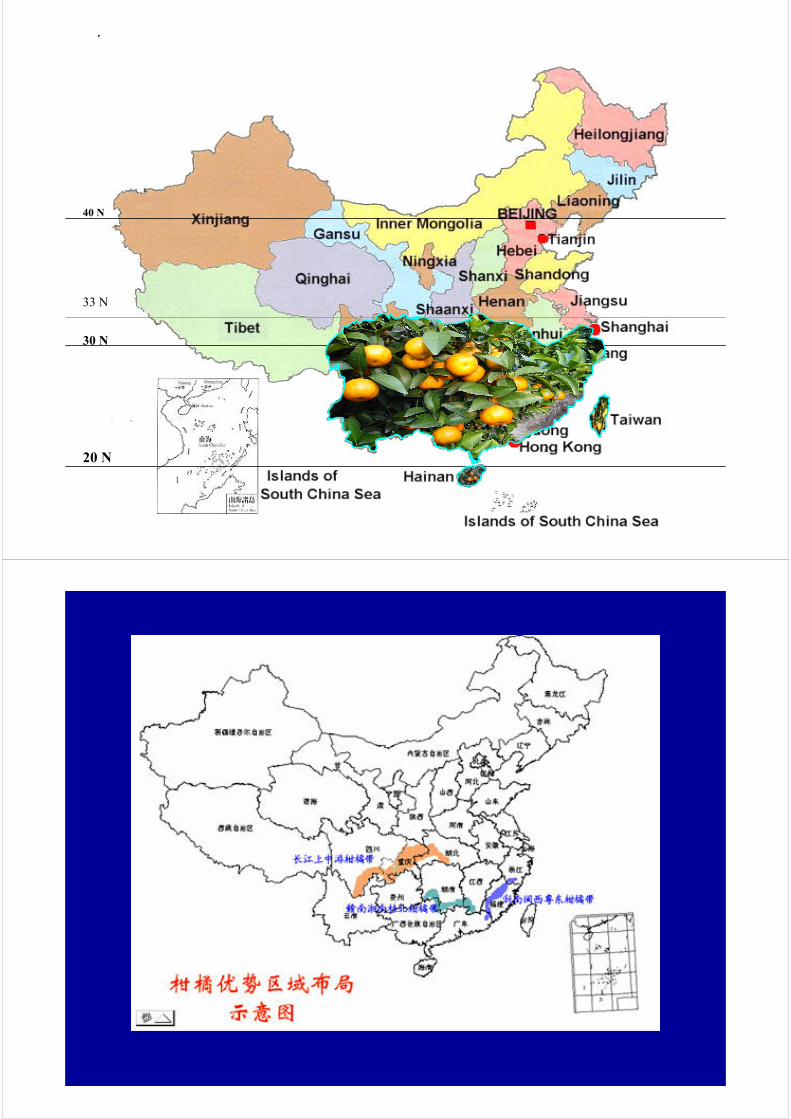
Wuhan
20 N
30 N
40 N
33 N
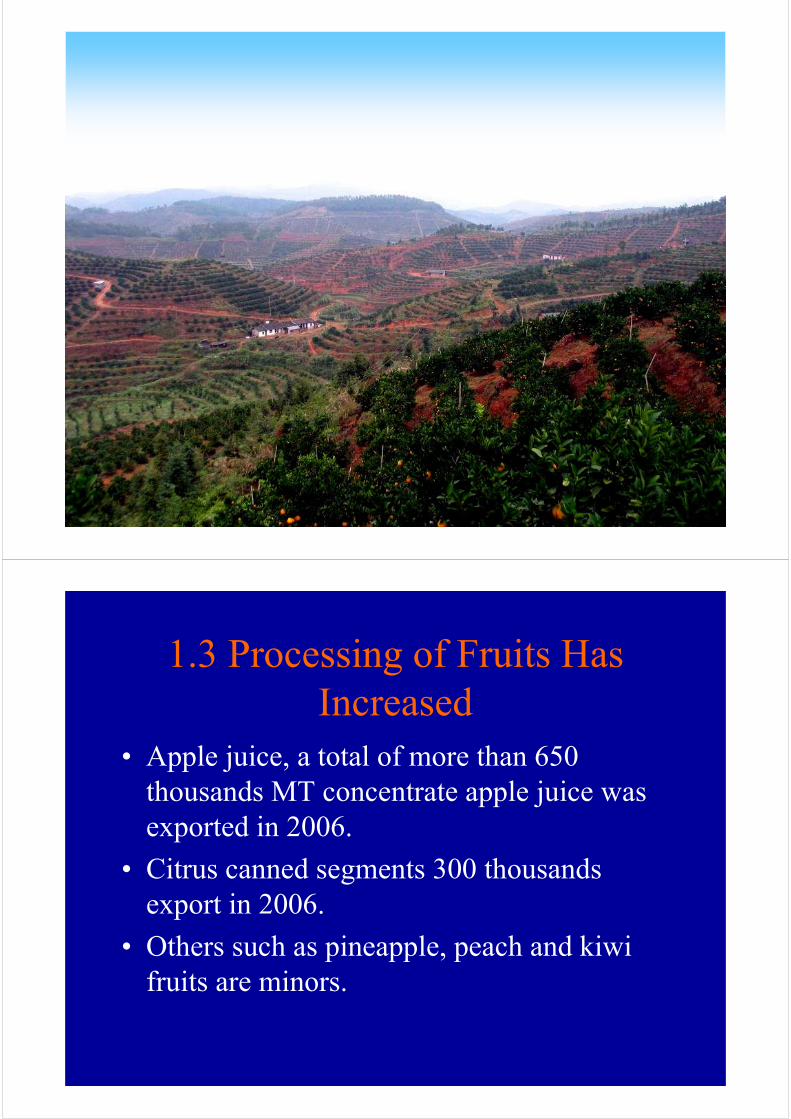
1.3 Processing of Fruits Has
Increased
• Apple juice, a total of more than 650
thousands MT concentrate apple juice was
exported in 2006.
• Citrus canned segments 300 thousands
export in 2006.
• Others such as pineapple, peach and kiwi
fruits are minors.

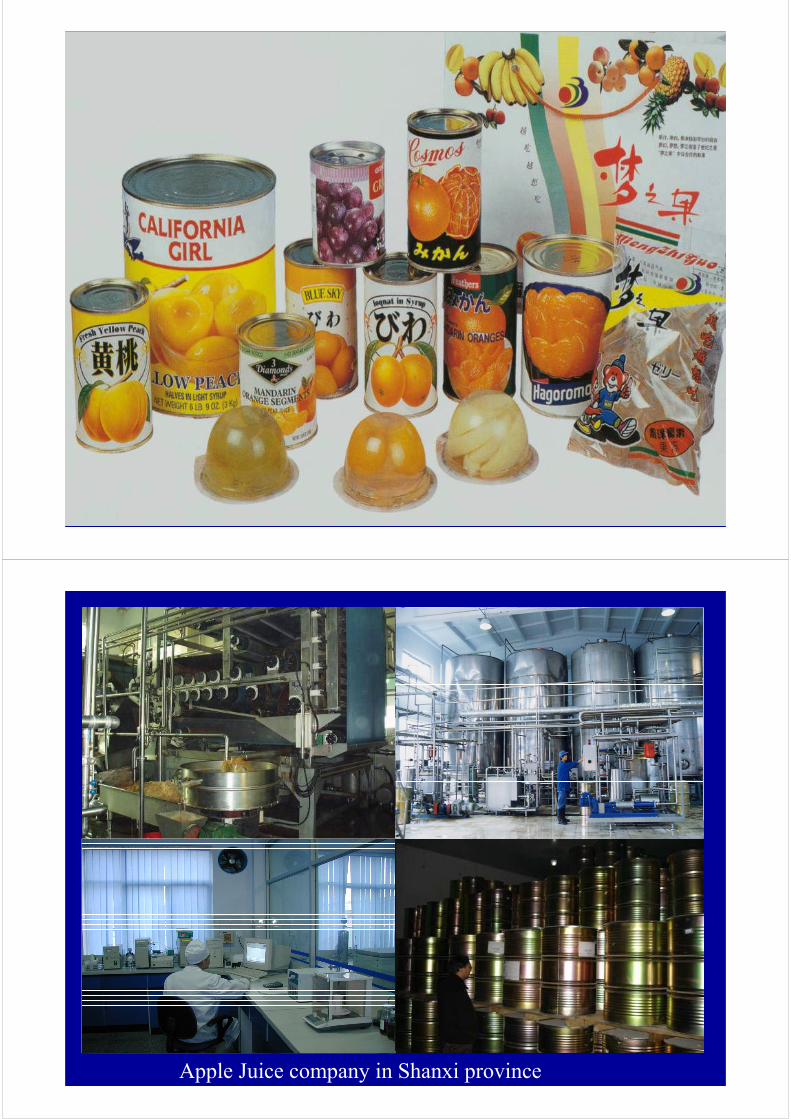
Apple Juice company in Shanxi province
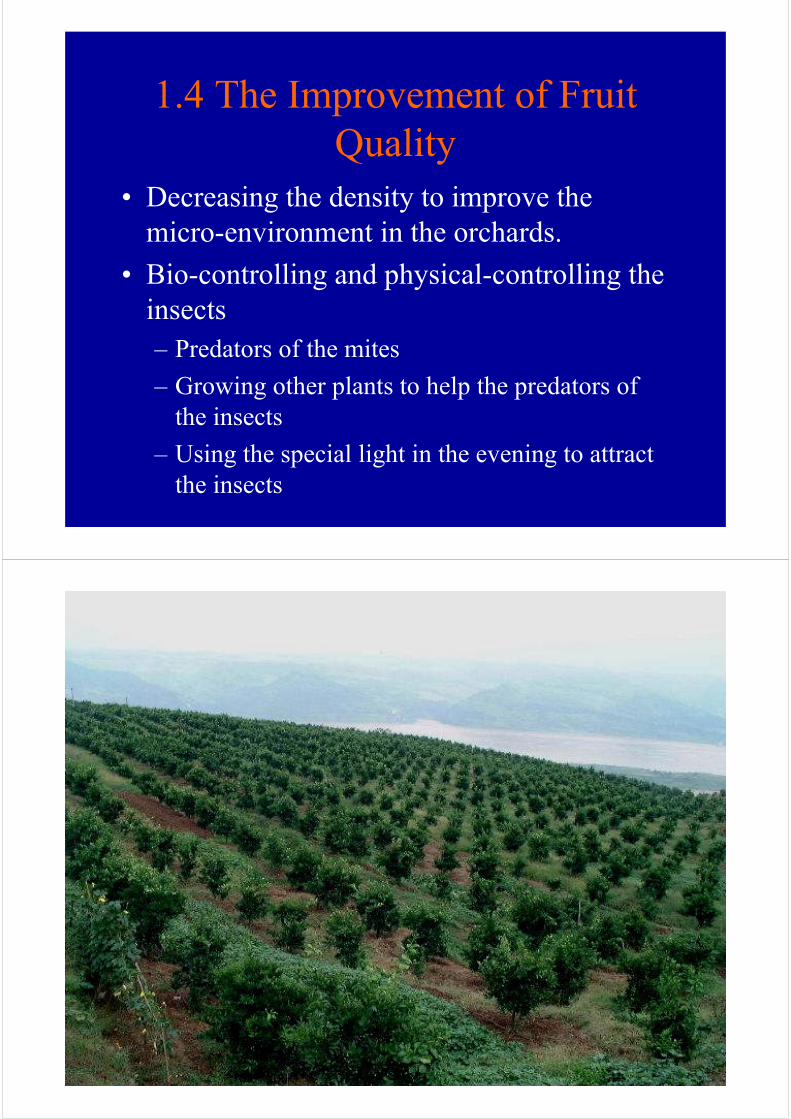
1.4 The Improvement of Fruit
Quality
• Decreasing the density to improve the
micro-environment in the orchards.
• Bio-controlling and physical-controlling the
insects
– Predators of the mites
– Growing other plants to help the predators of
the insects
– Using the special light in the evening to attract
the insects
二年生果园二年生果园二年生果园二年生果园
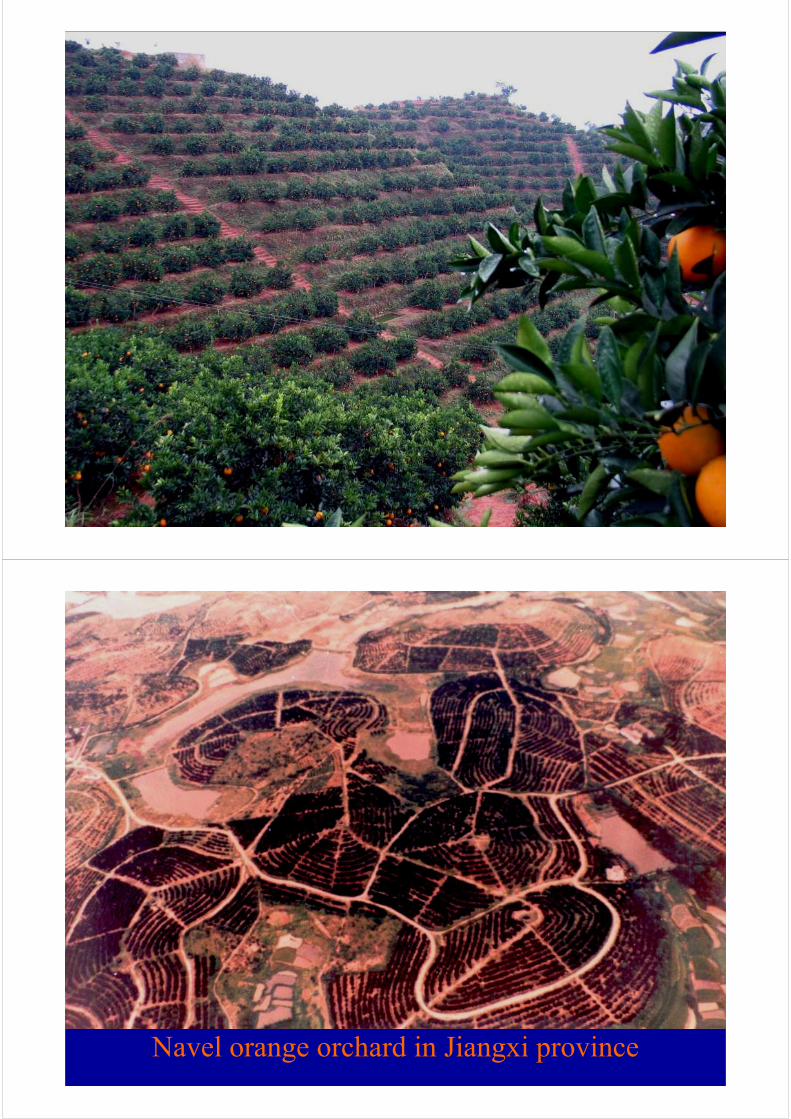
Navel orange orchard in Jiangxi province
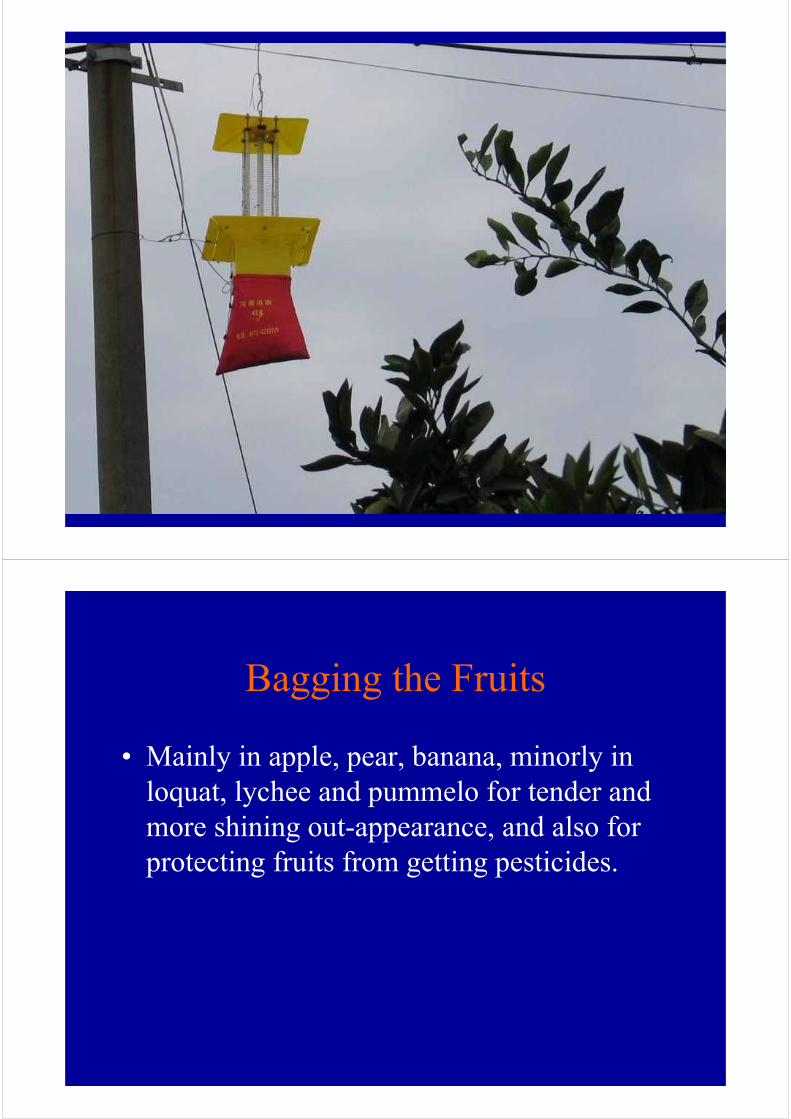
Bagging the Fruits
• Mainly in apple, pear, banana, minorly in
loquat, lychee and pummelo for tender and
more shining out-appearance, and also for
protecting fruits from getting pesticides.
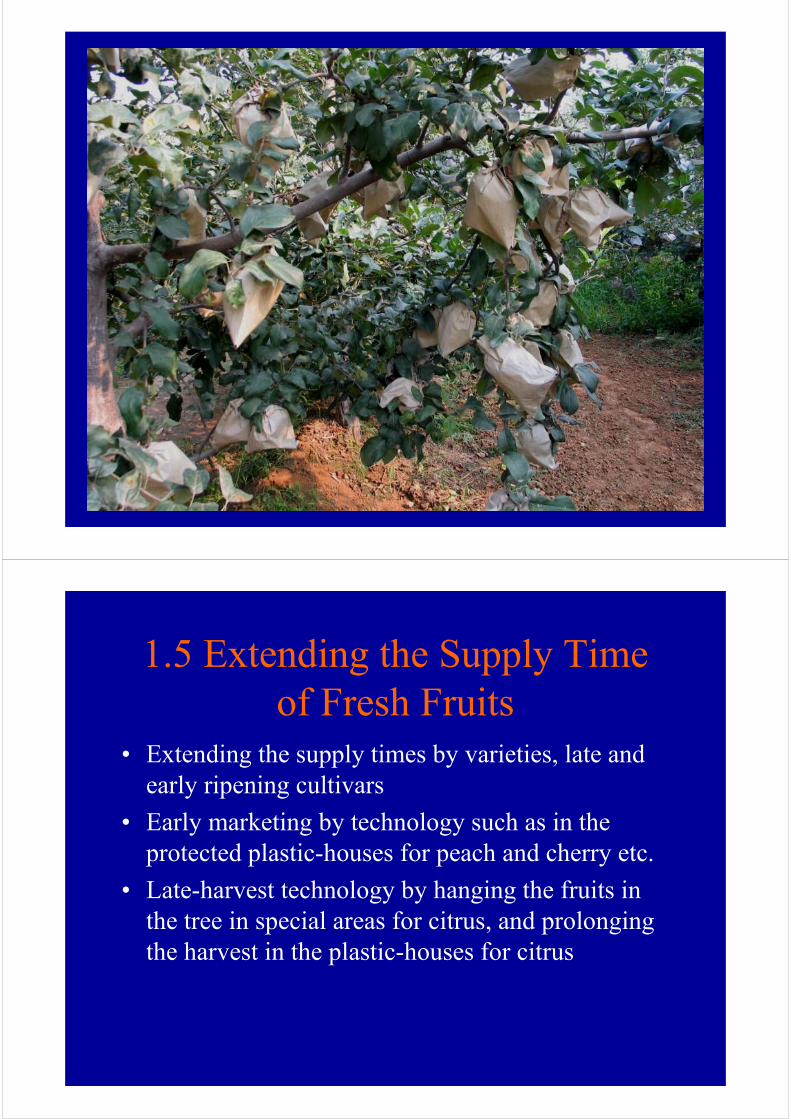
1.5 Extending the Supply Time
of Fresh Fruits• Extending the supply times by varieties, late and
early ripening cultivars
• Early marketing by technology such as in the
protected plastic-houses for peach and cherry etc.
• Late-harvest technology by hanging the fruits in
the tree in special areas for citrus, and prolonging
the harvest in the plastic-houses for citrus
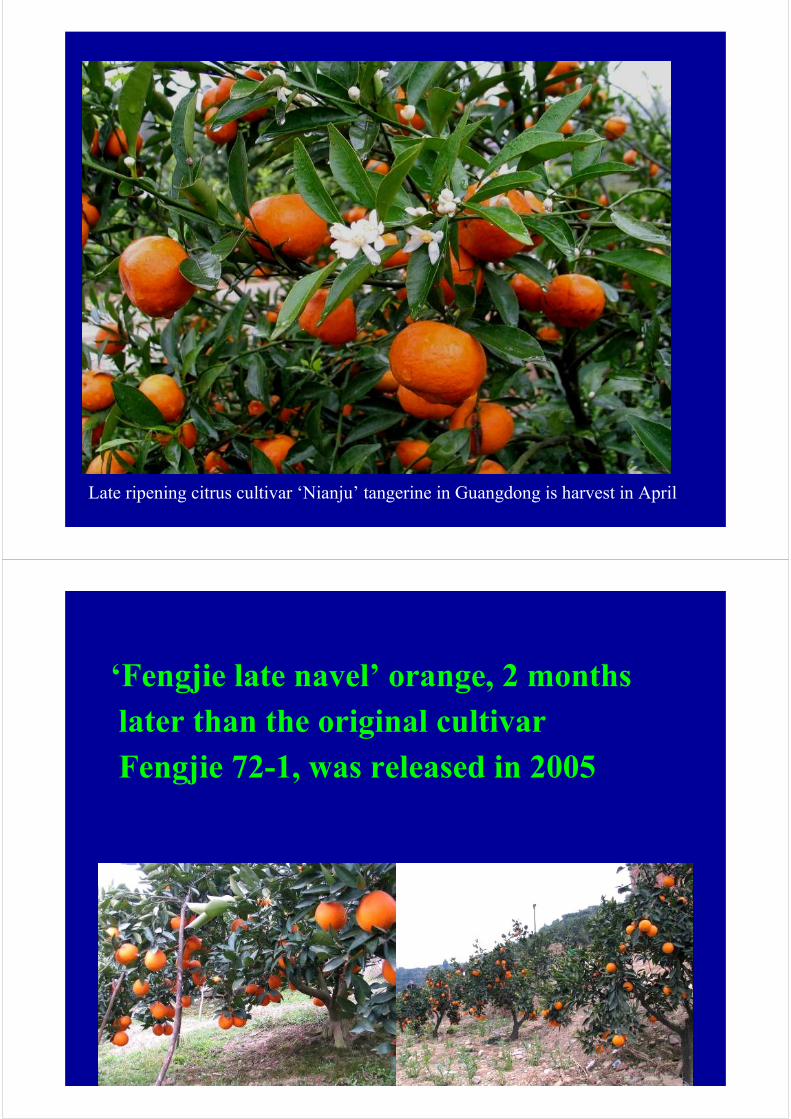
Late ripening citrus cultivar ‘Nianju’ tangerine in Guangdong is harvest in April
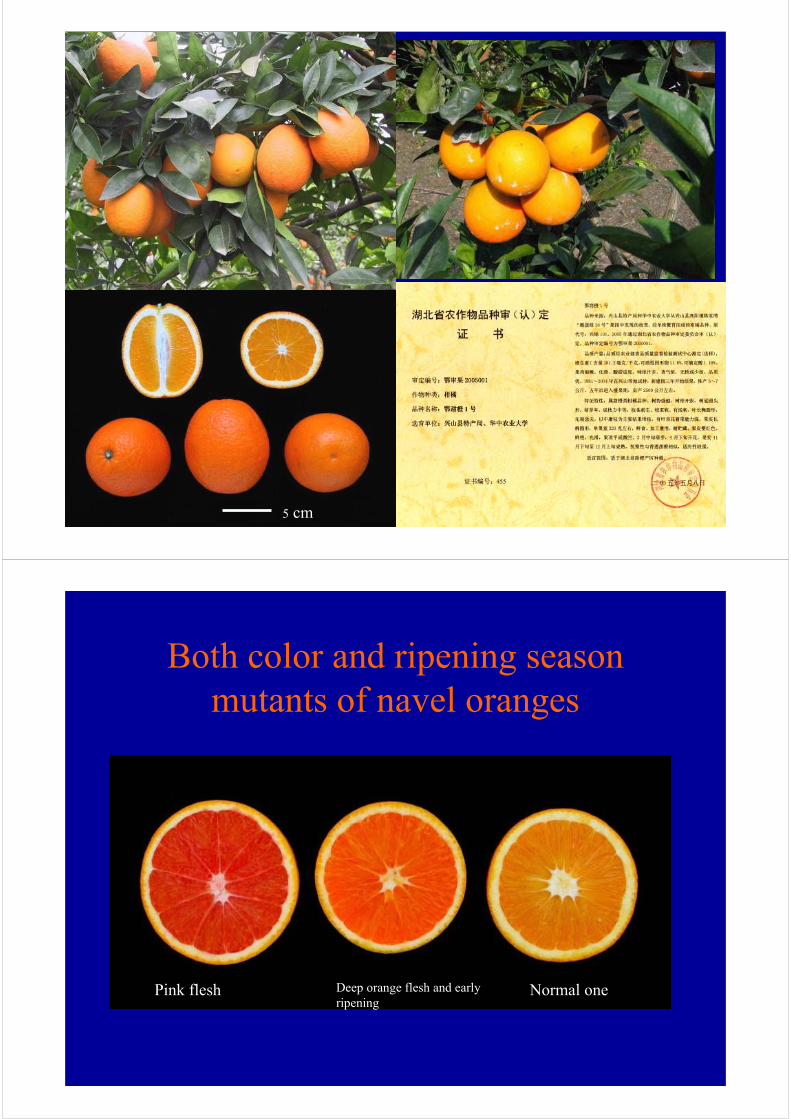
‘Fengjie late navel’ orange, 2 months
later than the original cultivar
Fengjie 72-1, was released in 2005
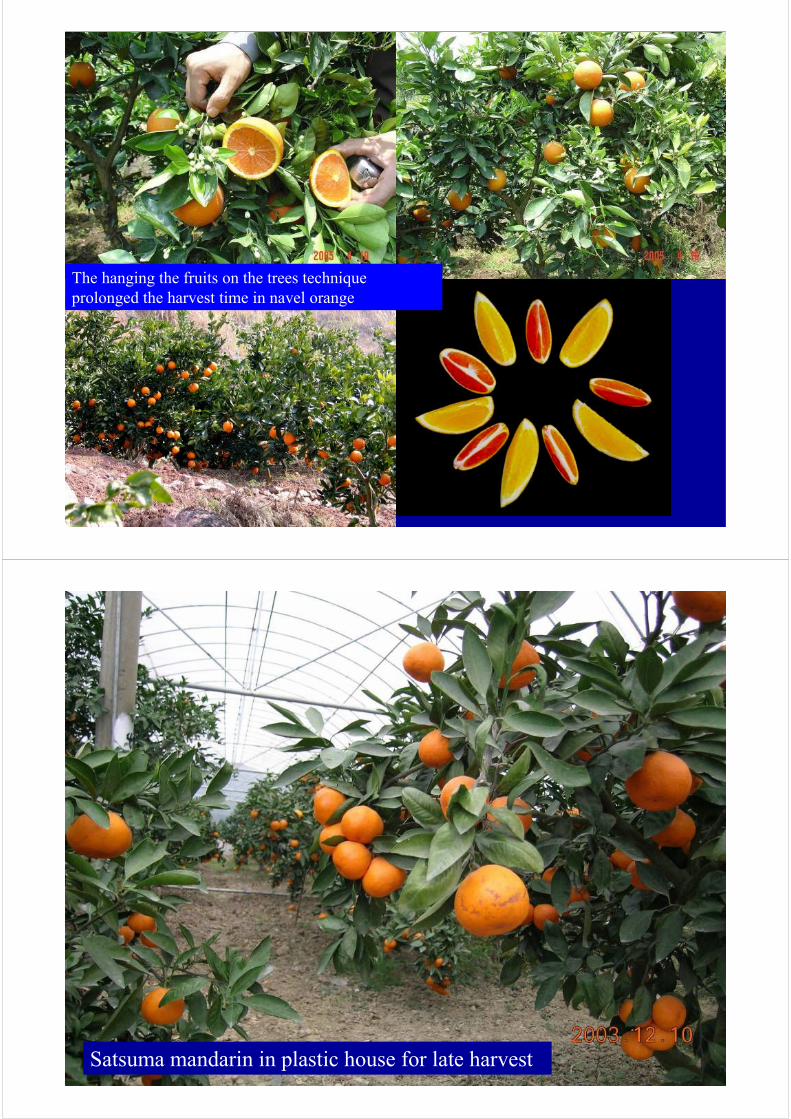
The hanging the fruits on the trees technique
prolonged the harvest time in navel orange
Satsuma mandarin in plastic house for late harvest
5 cm
Both color and ripening season
mutants of navel oranges
Pink flesh Deep orange flesh and early
ripeningNormal one
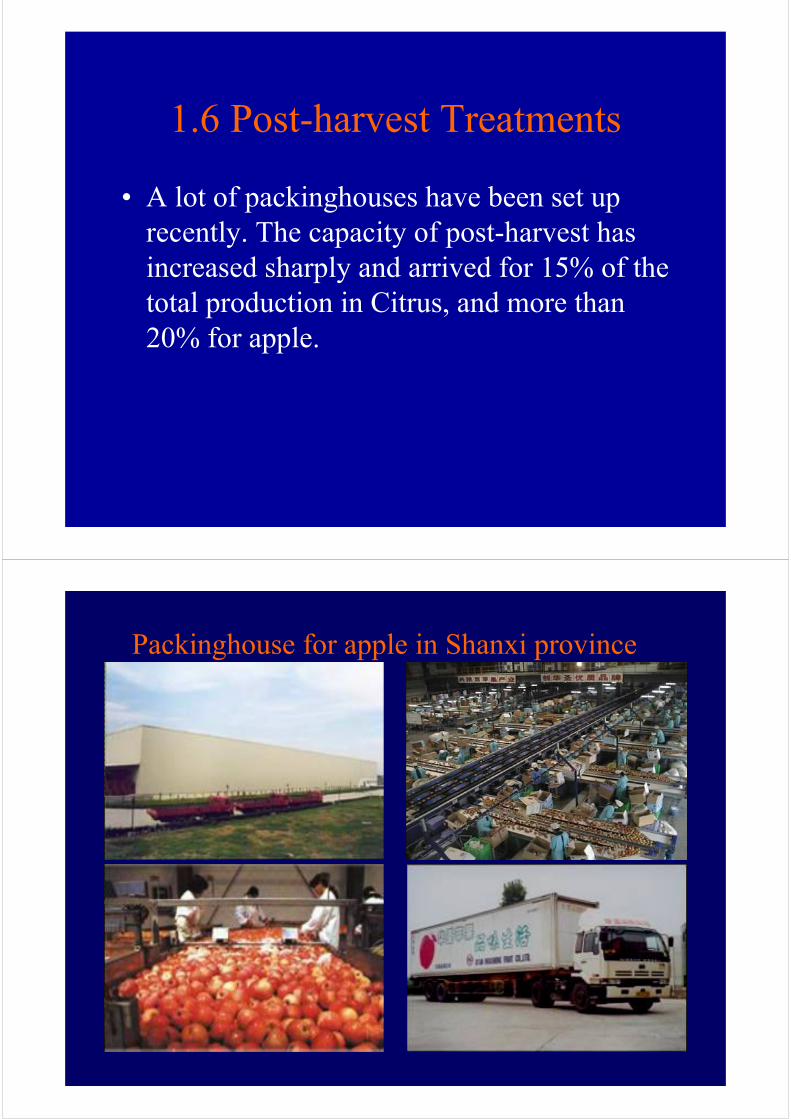
1.6 Post-harvest Treatments
• A lot of packinghouses have been set up
recently. The capacity of post-harvest has
increased sharply and arrived for 15% of the
total production in Citrus, and more than
20% for apple.
Packinghouse for apple in Shanxi province
1.7 Organizations for the Industry
and for the farmers
• Bureau of provincial and local government
for fruit industry
• Farmer organizations for fruit production or
for fruit industry
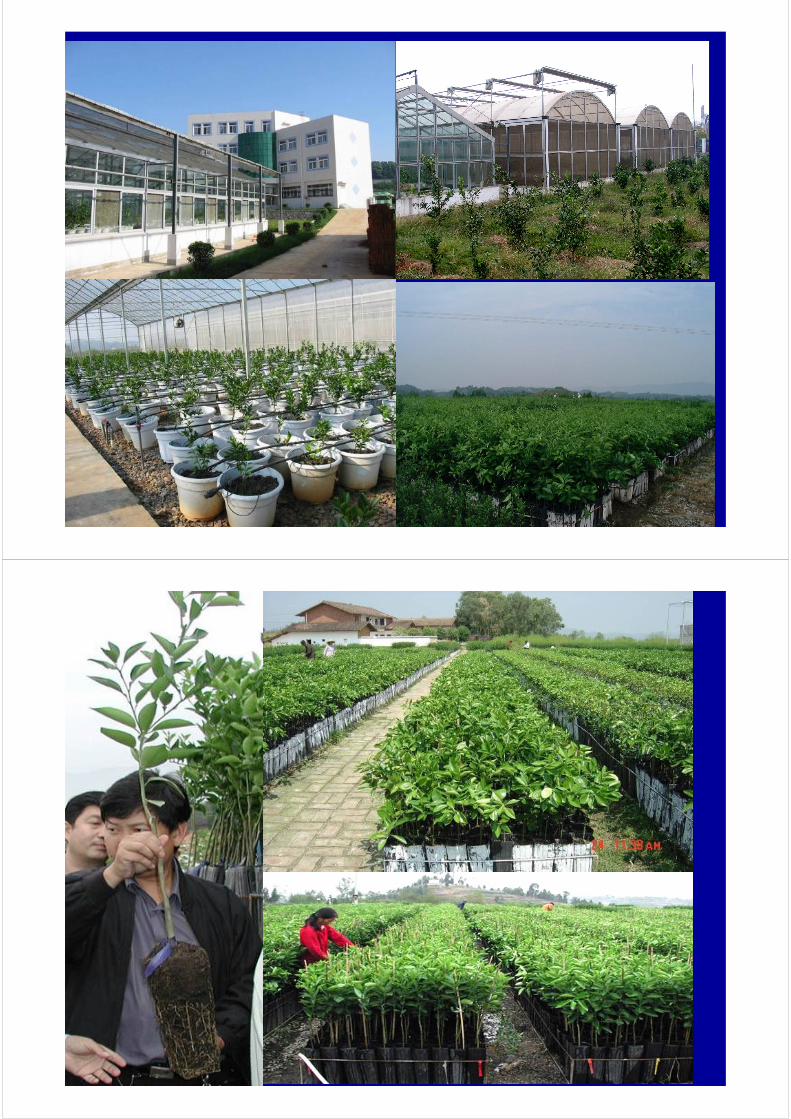
1.8 The Technology Supporting
Facilities
• National breeding (improving) centers for
apple and for citrus have been set up
• The virus-free centers of main fruit fruits
were also invested in the past years
• The bud-wood and propagation system for
apple, citrus and other fruits were
established also in the past 5 years
国家果树脱毒中心
2. Fruit Export and Import of
China in CY2005
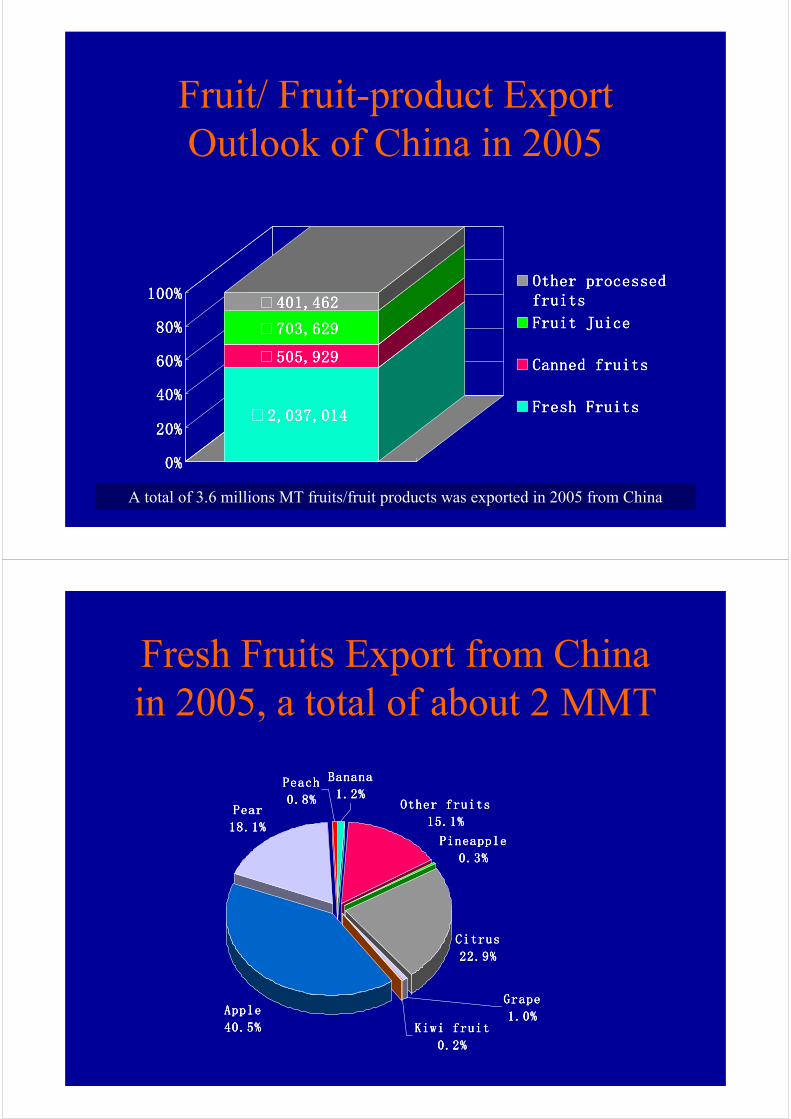
Fruit/ Fruit-product Export
Outlook of China in 2005
2,037,0142,037,0142,037,0142,037,014
505,929505,929505,929505,929
703,629703,629703,629703,629
401,462401,462401,462401,462
0%0%0%0%
20%20%20%20%
40%40%40%40%
60%60%60%60%
80%80%80%80%
100%100%100%100%Other processedOther processedOther processedOther processedfruitsfruitsfruitsfruits
Fruit Juice Fruit Juice Fruit Juice Fruit Juice
Canned fruits Canned fruits Canned fruits Canned fruits
Fresh FruitsFresh FruitsFresh FruitsFresh Fruits
A total of 3.6 millions MT fruits/fruit products was exported in 2005 from China
Fresh Fruits Export from China
in 2005, a total of about 2 MMT
Other fruitsOther fruitsOther fruitsOther fruits
15.1%15.1%15.1%15.1%
PineapplePineapplePineapplePineapple
0.3%0.3%0.3%0.3%
CitrusCitrusCitrusCitrus
22.9%22.9%22.9%22.9%
AppleAppleAppleApple
40.5%40.5%40.5%40.5%
PearPearPearPear
18.1%18.1%18.1%18.1%
GrapeGrapeGrapeGrape
1.0%1.0%1.0%1.0%Kiwi fruitKiwi fruitKiwi fruitKiwi fruit
0.2%0.2%0.2%0.2%
BananaBananaBananaBanana
1.2%1.2%1.2%1.2%PeachPeachPeachPeach
0.8%0.8%0.8%0.8%
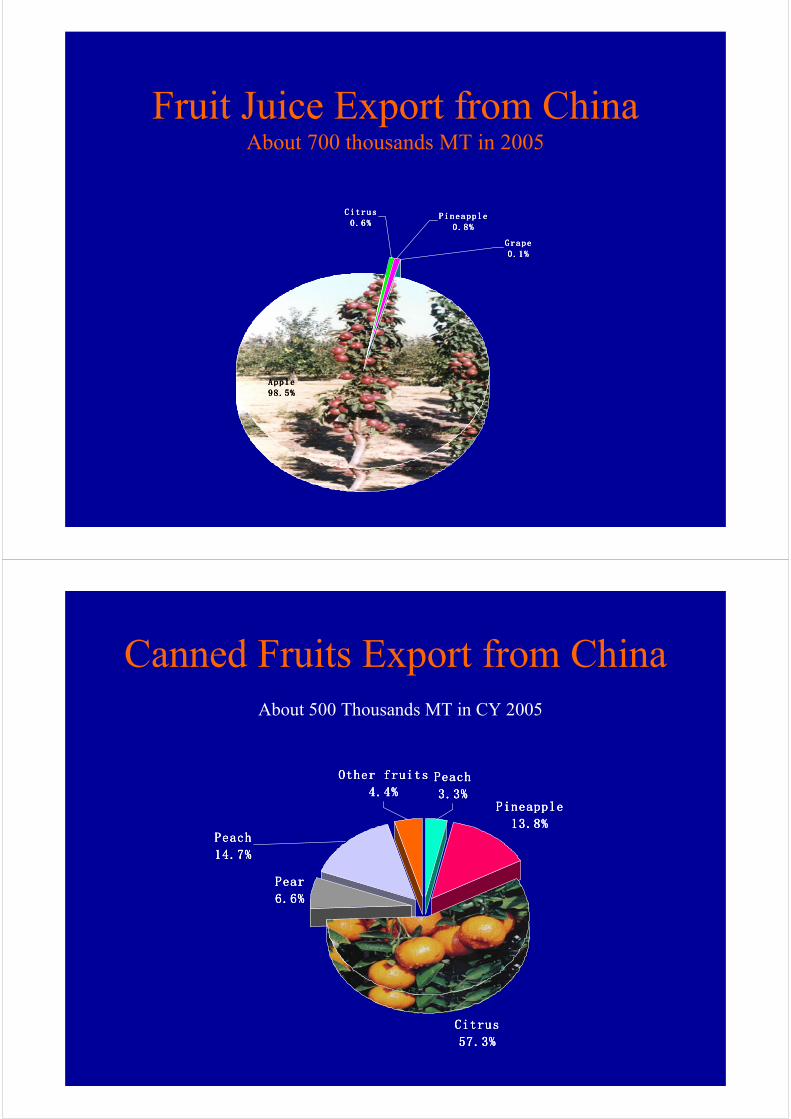
Fruit Juice Export from ChinaAbout 700 thousands MT in 2005
CitrusCitrusCitrusCitrus0.6%0.6%0.6%0.6%
GrapeGrapeGrapeGrape0.1%0.1%0.1%0.1%
PineapplePineapplePineapplePineapple0.8%0.8%0.8%0.8%
AppleAppleAppleApple98.5%98.5%98.5%98.5%
Canned Fruits Export from China
About 500 Thousands MT in CY 2005
PineapplePineapplePineapplePineapple
13.8%13.8%13.8%13.8%
CitrusCitrusCitrusCitrus
57.3%57.3%57.3%57.3%
PearPearPearPear
6.6%6.6%6.6%6.6%
PeachPeachPeachPeach
14.7%14.7%14.7%14.7%
Other fruitsOther fruitsOther fruitsOther fruits
4.4%4.4%4.4%4.4%PeachPeachPeachPeach
3.3%3.3%3.3%3.3%
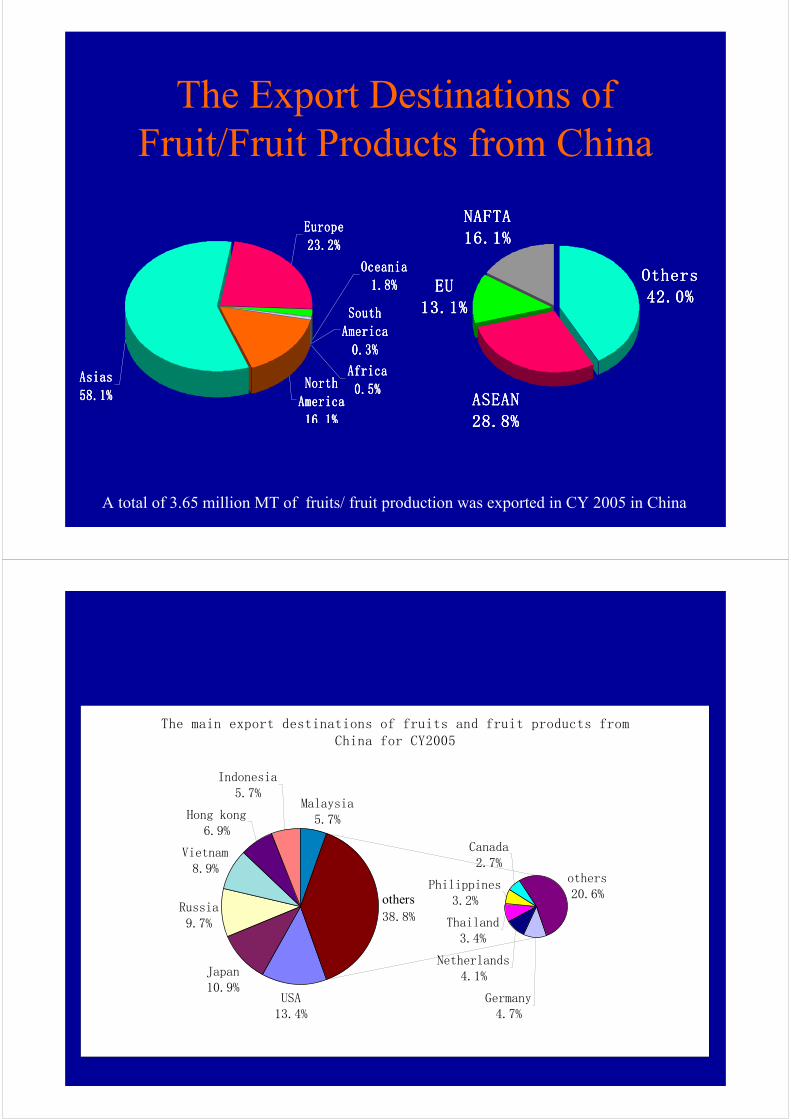
The Export Destinations of
Fruit/Fruit Products from China
AsiasAsiasAsiasAsias
58.1%58.1%58.1%58.1%NorthNorthNorthNorth
AmericaAmericaAmericaAmerica
16.1%16.1%16.1%16.1%
OceaniaOceaniaOceaniaOceania1.8%1.8%1.8%1.8%
SouthSouthSouthSouthAmericaAmericaAmericaAmerica
0.3%0.3%0.3%0.3%
AfricaAfricaAfricaAfrica
0.5%0.5%0.5%0.5%
EuropeEuropeEuropeEurope23.2%23.2%23.2%23.2%
OthersOthersOthersOthers
42.0%42.0%42.0%42.0%
ASEANASEANASEANASEAN
28.8%28.8%28.8%28.8%
EUEUEUEU
13.1%13.1%13.1%13.1%
NAFTANAFTANAFTANAFTA
16.1%16.1%16.1%16.1%
A total of 3.65 million MT of fruits/ fruit production was exported in CY 2005 in China
The main export destinations of fruits and fruit products fromChina for CY2005
USA13.4%
Japan10.9%
Russia9.7%
Vietnam8.9%
Hong kong6.9%
Indonesia5.7%
Malaysia5.7%
Germany4.7%
Netherlands4.1%
Thailand3.4%
Philippines3.2%
Canada2.7%
others20.6%others
38.8%
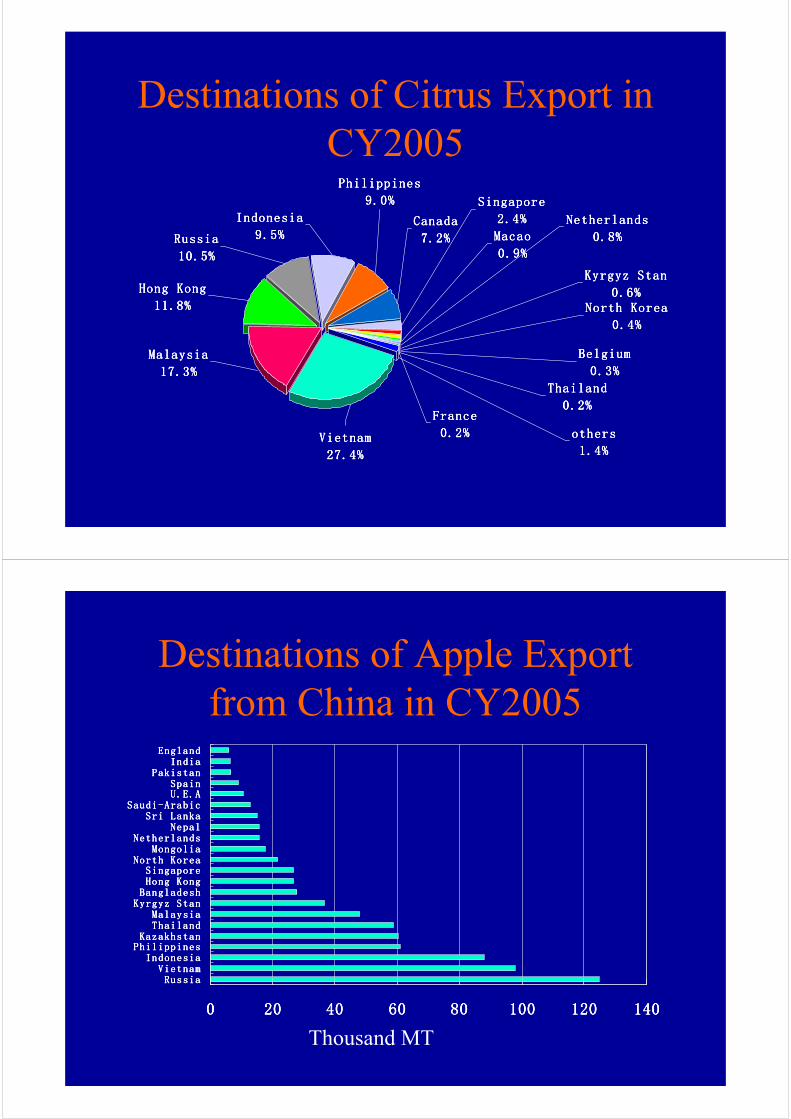
Destinations of Citrus Export in
CY2005
ThailandThailandThailandThailand
0.2%0.2%0.2%0.2%
BelgiumBelgiumBelgiumBelgium
0.3%0.3%0.3%0.3%
North KoreaNorth KoreaNorth KoreaNorth Korea
0.4%0.4%0.4%0.4%
NetherlandsNetherlandsNetherlandsNetherlands
0.8%0.8%0.8%0.8%
FranceFranceFranceFrance
0.2%0.2%0.2%0.2%
CanadaCanadaCanadaCanada
7.2%7.2%7.2%7.2%
othersothersothersothers
1.4%1.4%1.4%1.4%
MacaoMacaoMacaoMacao
0.9%0.9%0.9%0.9%
Kyrgyz StanKyrgyz StanKyrgyz StanKyrgyz Stan
0.6%0.6%0.6%0.6%
SingaporeSingaporeSingaporeSingapore
2.4%2.4%2.4%2.4%
PhilippinesPhilippinesPhilippinesPhilippines
9.0%9.0%9.0%9.0%
IndonesiaIndonesiaIndonesiaIndonesia
9.5%9.5%9.5%9.5%
Hong KongHong KongHong KongHong Kong
11.8%11.8%11.8%11.8%
MalaysiaMalaysiaMalaysiaMalaysia
17.3%17.3%17.3%17.3%
VietnamVietnamVietnamVietnam
27.4%27.4%27.4%27.4%
RussiaRussiaRussiaRussia
10.5%10.5%10.5%10.5%
Destinations of Apple Export
from China in CY2005
0000 20202020 40404040 60606060 80808080 100100100100 120120120120 140140140140
RussiaRussiaRussiaRussiaVietnamVietnamVietnamVietnam
IndonesiaIndonesiaIndonesiaIndonesiaPhilippinesPhilippinesPhilippinesPhilippinesKazakhstanKazakhstanKazakhstanKazakhstan
ThailandThailandThailandThailandMalaysiaMalaysiaMalaysiaMalaysia
Kyrgyz StanKyrgyz StanKyrgyz StanKyrgyz StanBangladeshBangladeshBangladeshBangladeshHong KongHong KongHong KongHong KongSingaporeSingaporeSingaporeSingapore
North KoreaNorth KoreaNorth KoreaNorth KoreaMongoliaMongoliaMongoliaMongolia
NetherlandsNetherlandsNetherlandsNetherlandsNepalNepalNepalNepal
Sri LankaSri LankaSri LankaSri LankaSaudi-ArabicSaudi-ArabicSaudi-ArabicSaudi-Arabic
U.E.AU.E.AU.E.AU.E.ASpainSpainSpainSpain
PakistanPakistanPakistanPakistanIndiaIndiaIndiaIndia
EnglandEnglandEnglandEngland
Thousand MT
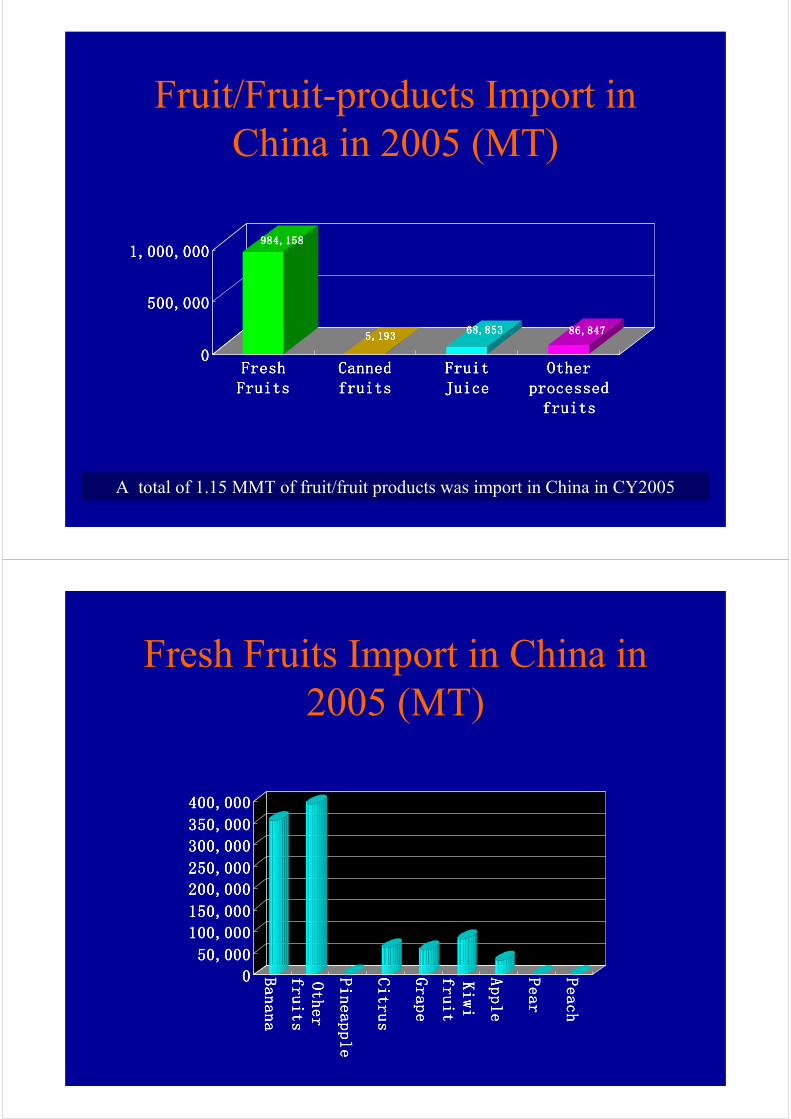
Fruit/Fruit-products Import in
China in 2005 (MT)
984,158984,158984,158984,158
5,1935,1935,1935,19368,85368,85368,85368,853 86,84786,84786,84786,847
0000
500,000500,000500,000500,000
1,000,0001,000,0001,000,0001,000,000
FreshFreshFreshFreshFruitsFruitsFruitsFruits
CannedCannedCannedCannedfruitsfruitsfruitsfruits
FruitFruitFruitFruitJuiceJuiceJuiceJuice
OtherOtherOtherOtherprocessedprocessedprocessedprocessedfruitsfruitsfruitsfruits
A total of 1.15 MMT of fruit/fruit products was import in China in CY2005
Fresh Fruits Import in China in
2005 (MT)
0000
50,00050,00050,00050,000
100,000100,000100,000100,000
150,000150,000150,000150,000
200,000200,000200,000200,000
250,000250,000250,000250,000
300,000300,000300,000300,000
350,000350,000350,000350,000
400,000400,000400,000400,000
Banana
Banana
Banana
Banana
Other
Other
Other
Other
fruits
fruits
fruits
fruits
Pineapple
Pineapple
Pineapple
Pineapple
Citrus
Citrus
Citrus
Citrus
Grape
Grape
Grape
Grape
Kiwi
Kiwi
Kiwi
Kiwi
fruit
fruit
fruit
fruit
Apple
Apple
Apple
Apple
Pear
Pear
Pear
Pear
Peach
Peach
Peach
Peach
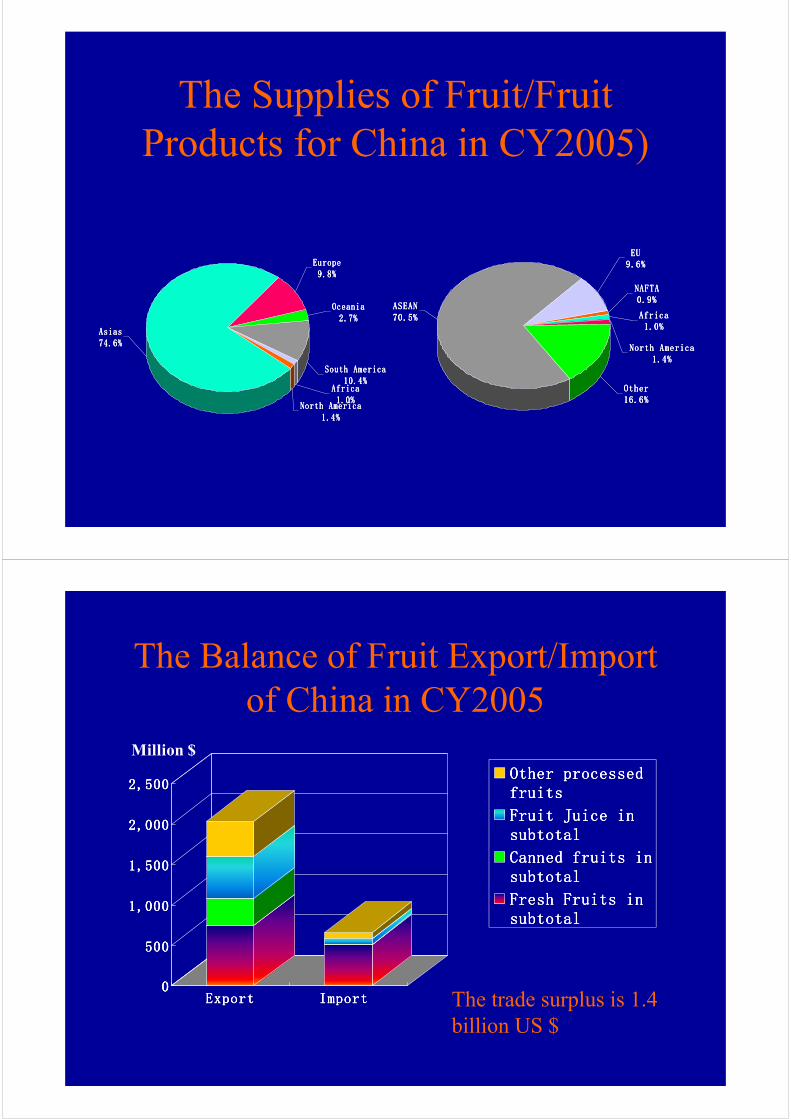
The Supplies of Fruit/Fruit
Products for China in CY2005)
AsiasAsiasAsiasAsias74.6%74.6%74.6%74.6%
EuropeEuropeEuropeEurope9.8%9.8%9.8%9.8%
OceaniaOceaniaOceaniaOceania2.7%2.7%2.7%2.7%
South AmericaSouth AmericaSouth AmericaSouth America10.4%10.4%10.4%10.4%
North AmericaNorth AmericaNorth AmericaNorth America1.4%1.4%1.4%1.4%
AfricaAfricaAfricaAfrica1.0%1.0%1.0%1.0%
AfricaAfricaAfricaAfrica1.0%1.0%1.0%1.0%
North AmericaNorth AmericaNorth AmericaNorth America1.4%1.4%1.4%1.4%
OtherOtherOtherOther16.6%16.6%16.6%16.6%
ASEANASEANASEANASEAN70.5%70.5%70.5%70.5%
NAFTANAFTANAFTANAFTA0.9%0.9%0.9%0.9%
EUEUEUEU9.6%9.6%9.6%9.6%
The Balance of Fruit Export/Import
of China in CY2005
0000
500500500500
1,0001,0001,0001,000
1,5001,5001,5001,500
2,0002,0002,0002,000
2,5002,5002,5002,500
ExportExportExportExport Import Import Import Import
Other processedOther processedOther processedOther processedfruitsfruitsfruitsfruits
Fruit Juice inFruit Juice inFruit Juice inFruit Juice insubtotalsubtotalsubtotalsubtotal
Canned fruits inCanned fruits inCanned fruits inCanned fruits insubtotalsubtotalsubtotalsubtotal
Fresh Fruits inFresh Fruits inFresh Fruits inFresh Fruits insubtotalsubtotalsubtotalsubtotal
Million $
The trade surplus is 1.4
billion US $
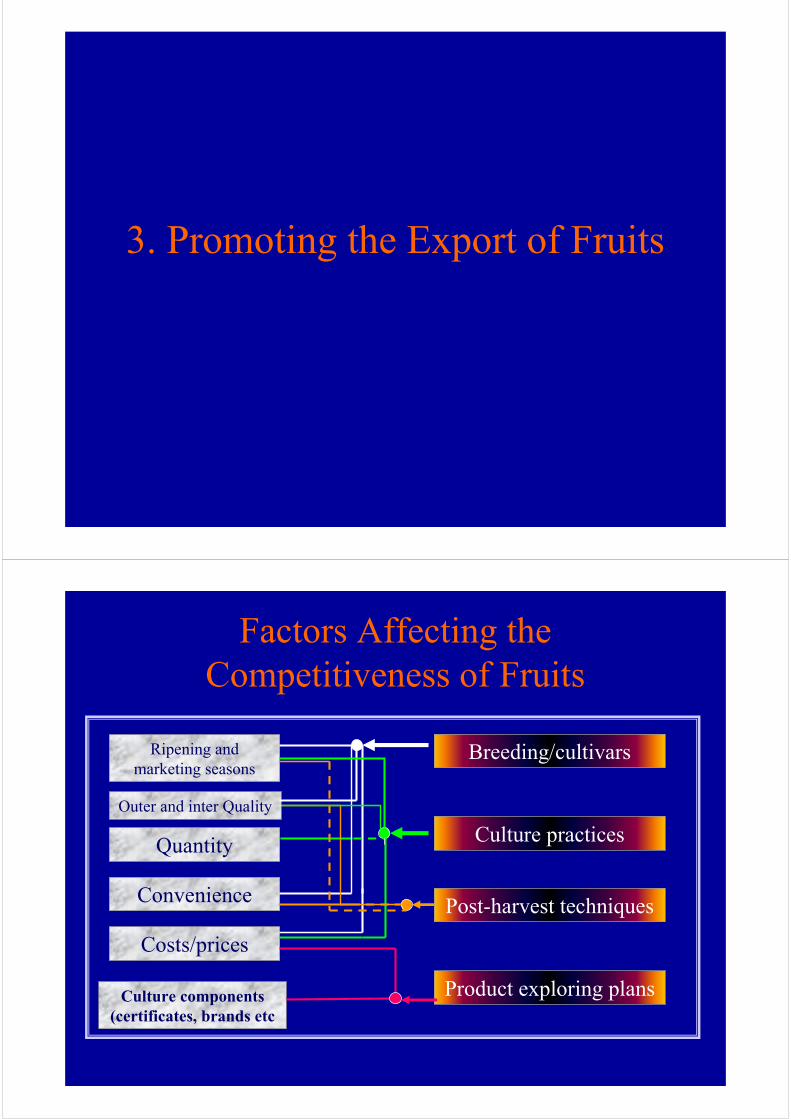
3. Promoting the Export of Fruits
Factors Affecting the
Competitiveness of Fruits
Ripening and
marketing seasons
Outer and inter Quality
Convenience
Costs/prices
Culture components
(certificates, brands etc
Quantity
Breeding/cultivars
Culture practices
Product exploring plans
Post-harvest techniques
Promoting the Export
• Bi- and multi- lateral agreements benefits
each other and promotes the optimizations
of the resources
– The Sino-Thailand, Sino-other countries in
ASEAN of no-tariff agreements for
fruits/vegetables
• Farmer organization
Promoting the Export
• Adopting the good agricultural practice in
fruit production
• Establish of no-infected areas of quarantine
pests/diseases

Thank you for your attentions