fry & hart
DESCRIPTION
temperatura y oxigeno papersTRANSCRIPT
THE RELATION OF TEMPERATURE TO OXYGEN CONSUMPTION•¿� IN THE GOLDFISH'
F. E. J. FRY AND J. S. HART
University of Toronto
I NTRODUCTION
In general, studies on the relation of the metabolic rate to temperature have beenlimited to a consideration of the standard metabolism. Standard metabolism in animals has been taken as the approximate equivalent to basal metabolism in man. Adistinction is made in deference to the fact that animals cannot approach the experiment in such a consciously basal state as can the human subject. However, fromthe ecological point of view, which recognizes that much of the measure of successwhich an animal may enjoy is due to its ability to be active, it is not enough toknow the basal or standard metabolic state alone. It is of equal importance tomeasure-the maximum metabolic rate, unless changes in the maximum rate followno rule, or can be predicted from the standard rate. For fish at least there appear tobe no data which establish either of these two provisos. For these reasons we undertook to explore the relation between a standard and a maximum level of metabolism in the goldfish and the ambient temperature. The two levels chosen were (1)a standard which was the minimum resting level in the diurnal cycle, a level as nearbasal as we could establish, and (2) a “¿�maximum―which was the rate which appeared to be the highest the fish were able to maintain continuously until fatigue setin.
MATERIAL AND METHODS
The goldfish used were a single lot of animals approaching one year old with anaverage weight of 3.8 gms. These fish were similar in age and source to thoseused for the exploration of various other physiological characteristics of the species(Fry, Brett and Clawson, 1942; Brett, 1946; Fry, Black and Black, 1947; and Fryand Hart, 1947). They were stored in running water and fed on a commercial foxfood. Previous to any experiment the fish were acclimated to the particular temperature at which the experiment was to be carried out by maintaining them at thattemperature for a length of time that would enable them to come to a stable state, asfar as this is indicated by the stability of the upper lethal temperature (Brett,1946). This period ranged from twenty days at 50 C. to less than four at 350 C:During this acclimation period the fish fed well. Both the standard and maximumlevels of metabolism for any given temperature were measured on the same subjects, but the measurements at different temperatures were carried out on differentsamples drawn from the common stock. The metabolic rates were measured by determining the rate of oxygen consumption.
1 An abstract of this paper appeared under the same title in the Anatonomical Record, Vol.
96, No. 4 Supp., December, 1946.66
67OXYGEN CONSUMPTION IN GOLDFISH
All the rates of oxygen uptake were determined by means of the unmodifiedWinkler method. While nitrite contamination may introduce error into oxygendeterminations (Allee and Oesting, 1934) it does not seem to have been a serious
factor here. A number of checks with the Rideal-Stewart modification gave es
sentially the same readings as the unmodified Winkler's. Moreover, consistent results were obtained on check runs in which the initial levels of oxygen differed andhence similar levels were reached after different intervals of time.
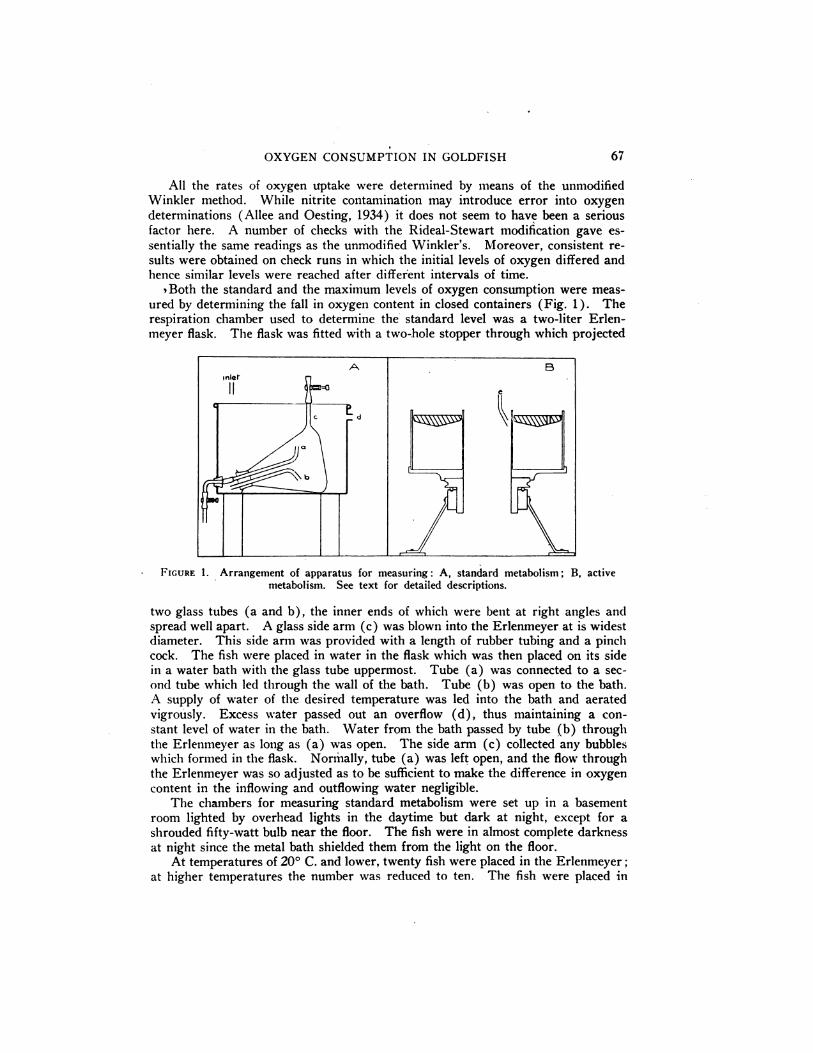
Both the standard and the maximum levels of oxygen consumption were measured by determining the fall in oxygen content in closed containers (Fig. 1). Therespiration chamber used to determine the standard level was a two-liter Erlenmeyer flask. The flask was fitted with a two-hole stopper through which projected
FIGURE 1. Arrangement of apparatus for measuring: A, standard metabolism; B, activemetabolism. See text for detailed descriptions.
two glasstubes (a and b), the inner ends of which were bent at rightanglesandspreadwellapart. A glasssidearm (c) was blown intothe Erlenmeyer at iswidestdiameter. This sidearm was provided with a lengthof rubber tubingand a pinchcock. The fish were placed in water in the flask which was then placed on its sidein a water bath with the glass tube uppermost. Tube (a) was connected to a second tube which led through the wall of the bath. Tube (b) was open to the bath.A supply of water of the desiredtemperature was led into the bath and aerated
vigrously. Excess water passed out an overflow (d), thus maintaining a constant level of water in the bath. Water from the bath passed by tube (b) throughthe Erlenmeyer as long as (a) was open. The side arm (c) collected any bubbleswhich formed in the flask. Normally, tube (a) was left open, and the flow through
the Erlenmeyer was so adjustedas to be sufficientto make the differencein oxygencontent in the inflowing and outfiowing water negligible.
The chambers for measuring standard metabolism were set up in a basementroom lighted by overhead lights in the daytime but dark at night, except for ashrouded fifty-watt bulb near the floor. The fish were in almost complete darknessat night since the metal bath shielded them from the light on the floor.
At temperatures of 200 C. and lower, twenty fish were placed in the Erlenmeyer;at higher temperaturesthe number was reduced to ten. The fishwere placed in
68 F. E. J. FRY AND J. S. HART
the chambers on the day previous to the experiment, and water samples for oxygendetermination were taken as described below over at least one complete twentyfour hour cycle. All samples were taken as quietly as possible in order to minimizeany disturbance of the subjects. However, at that time we were not conversant withthe findings of Spoor (1946), and we undoubtedly did not eliminate such disturbance entirely. The minimum oxygen consumption generally occurred between 10P.M. and dawn. The titration figures for each twenty-four hour cycle were plotted,
and the lowest point during the night hours found by interpolation. The standardrate of oxygen consumption was calculated from the value thus found.
When a measurement of the oxygen consumption was to be made, any bubblesin tube (c) were carefully drawn out by suction. Water samples were taken fromtube (a) and the bath. Tube (a) was then closed by the screw cock, thus isolatingthe water in the flask except for the connection through the relatively long andnarrow tube (b) . The time interval between the first and second sample was dependent on the metabolic rate. These intervals varied from four hours at 5°C. tothirty minutes at 35°C. The time between the initial and final samples was sochosen that the oxygen tension in the chamber did not fall low enough to affect therate of oxygen uptake, a number of preliminary experiments being performed toconfirm this fact. After the appropriate interval of time a second sample of approximately 100 cc. was drawn from tube (a) into a 50 cc. sample bottle, the first 50cc. being used to flush, the second 50 cc. being retained as the sample. This partitioning of the sample was accomplished by taking the time during the first filling ofthe bottle and then allowing the water to flow for a further equal time before removing the sample bottle. It was presumed that this relatively rapid withdrawal of 100cc. took place without any contamination from the corresponding 100 cc. of waterwhich entered the Erlenmeyer from the bath.
The maximum level of metabolism was measured on fish swimming steadilyagainst a current generated in a rotating chamber (Fig. 1B). This chamber wasan annular vessel of rectangular cross section of which the outer wall was glass andthe inner wall and bottom metal. The outside diameter was 12 inches, the width 3inches, and the depth 6 inches. This apparatus is an elaboration of that originallyused by Black, Fry and Scott (1939). A measured volume of water was placed inthe chamber, the fish introduced, and the surface of the water protected from theatmosphere by means of a loosely fitting cover. Samples of water for the determination of the oxygen content were obtained by withdrawing 100 cc. by pipette. Thepipette was then inserted to the bottom of a 50 cc. sample bottle and approximately75 cc. of the sample was delivered into it, the excess being flushed out. The last25 cc. in the pipette were discarded. Since the cover did not isolate the water completely from the atmosphere, some exchange of gas took place between the water andthe air. The magnitude of this exchange at different temperatures and oxygen tensions was determined by filling the chamber with water which had been boiled -andflushed with nitrogen, and then following the increase in oxygen with the coverin place. We are indebted to Miss J. M. Graham for making these determinations.A correction based on •¿�theseresults was applied to the apparent rates of oxygen uptake determined experimentally. The temperature of the water in the rotatingchamber was controlled by playing a stream of water on its inner wall throughtube (e).
10 15 20 25 30 35
Terr@perorure °C.
1 111 1 1 1 1 11 1 1 II 1 II 1 1 1 I I 1 I I
69OXYGEN CONSUMPTION IN GOLDFISH
RESULTS
(a) Relation of temperature to standard metabolism
The relation of the standard metabolism of the goldfish to temperature has beeninvestigatedby other workers on a number of occasions. On two occasionsin
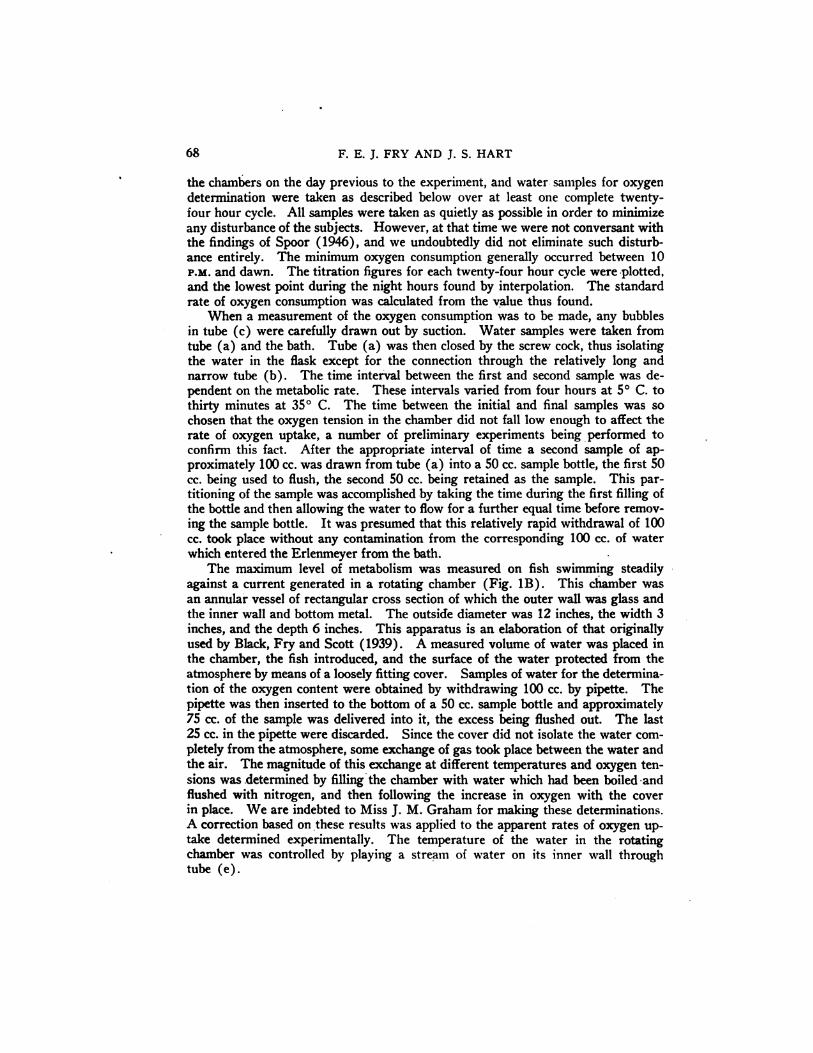
particular (Ege and Krogh, 1914; Gardner, King and Powers, 1922) this relationhas been worked out over a considerable range of temperature. The results ofthese workers are displayedwith our own in Figure 2. The logarithms of the
.c
C.,C)
1W
0.‘¿�SCOam‘¿�I‘¿�C
5
FIGURE 2. The relation of temperature to standard metabolism in the goldfish.
rates of oxygen uptake are used in this figure rather than the actual values so that acomparison can be made between the relative rates of change. The relative ratesof change with increase in temperature are very similar in the three sets of data.
Since different techniques were used in the three cases, such agreement can probablybe taken as a satisfactory indication that the relative change is a stable characteristicof the species, although it must be remembered that this particular curve is char
acteristic of quite a number of other animals also (Krogh, 1941).There does not appear to be any indication of any difference in this relative rate
with difference in size such as wells (1935) believed was the case in Fundulus parvipinnis. However, his evidence is somewhat confused by the fact that the rates atdifferent temperatures were measured at different times of day. Moreover, a gooddeal of the divergence in the rate-temperature curves he gives is an attribute of themagnitude of the absolute rates and disappears if a semi-logarithmic plot is used,as in Figure 2.
The rate of oxygen uptake per unit weight does not bear any consistent relationwith size in the three sets of data in Figure 2. Such disagreement is probably dueto the fact that the standard states used by the three groups of investigators werenot the same.
x Ege and krogh
o [email protected]@ king and Pow.es
@ Pr.sent dererminarons
70 F. E. J. FRY AND J. S. HART
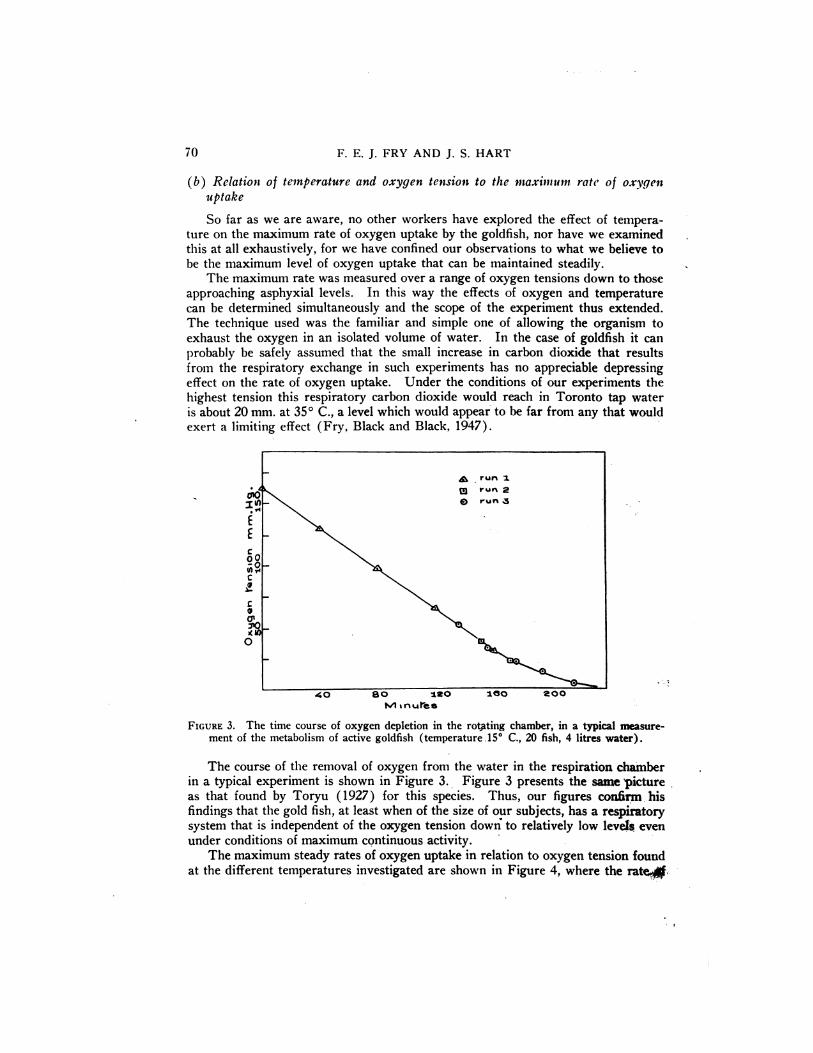
(b) Relation of temperatureand oxygen tensionto the maximum rate of oxygen
uptake
So far as we are aware, no other workers have explored the effect of temperature on the maximum rate of oxygen uptake by the goldfish, nor have we examinedthisatallexhaustively,forwe have confinedour observationsto what we believetobe the maximum levelof oxygen uptake thatcan be maintained steadily.
The maximum ratewas measured over a range ofoxygen tensionsdown to thoseapproaching asphyxiallevels. In thisway the effectsof oxygen and temperaturecan be determined simultaneously and the scope of the experiment thus extended.The techniqueused was the familiarand simple one of allowing the organism to
exhaust the oxygen in an isolatedvolume of water. In the case of goldfishitcanprobably be safelyassumed that the small increasein carbon dioxide that results
from the respiratoryexchange in such experiments has no appreciabledepressingeffect on the rate of oxygen uptake. Under the conditions of our experiments the
highest tension this respiratory carbon dioxide would reach in Toronto tap wateris about 20 mm. at 35° C., a level which would appear to be far from any that would
exerta limitingeffect(Fry, Black and Black,1947).
FIGURE 3. The time course of oxygen depletion in the rotj@ting chamber, in a typical measurement of the metabolism of active goldfish (temperature .15° C., 20 fish, 4 litres water).
The course of the removal of oxygen from the water in the respiration chamberin a typical experiment is shown in Figure 3. Figure 3 presents the same Dicture
as that found by Toryu (1927) for this species. Thus, our figures coxthrm. hisfindings that the gold fish, at least when of the size of our subjects, has a respiratorysystem thatisindependentof the oxygen tensiondown@ to relativelylow levelseven
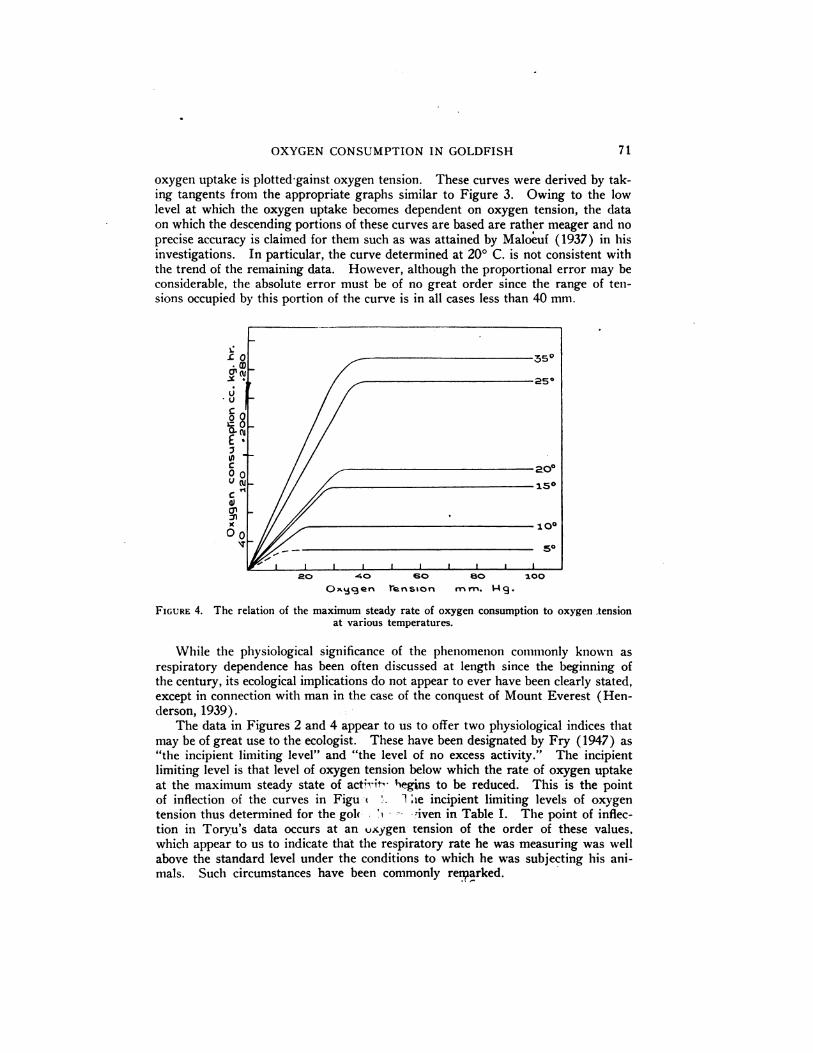
under conditions of maximum continuous activity.The maximum steady rates of oxygen uptake in relation to oxygen tension found
at the different temperatures investigated are shown in Figure 4, where the rate4
.1 @i'1
M inures
20 @0 60 60 100
Q@@gen rension mm.
71OXYGEN CONSUMPTION IN GOLDFISH
oxygen uptake is plotted-gainst oxygen tension. These curves were derived by taking tangents from the appropriate graphs similar to Figure 3. Owing to the lowlevel at which the oxygen uptake becomes dependent on oxygen tension, the dataon which the descending portions of these curves are based are rather meager and no
precise accuracy is claimed for them such as was attained by Maloeuf (1937) in hisinvestigations. In particular, the curve determined at 20°C. is not consistent withthetrendof the remaining data. However, althoughthe proportionalerrormay beconsiderable,the absoluteerrormust be of no great order sincethe range of tensions occupied by this portion of the curve is in all cases less than 40 mm.
FIGURE 4. The relation of the maximum steady rate of oxygen consumption to oxygen ,tensionat various temperatures.
While the physiological significance of the phenomenon commonly known asrespiratory dependence has been often discussed at length since the beginning ofthe century, its ecological implications do not appear to ever have been clearly stated,except in connection with man in the case of the conquest of Mount Everest (Henderson, 1939).
The data in Figures 2 and 4 appear to us to offer two physiological indices thatmay be ofgreatuse tothe ecologist.These have been designatedby Fry (1947) as“¿�theincipient limiting level―and “¿�thelevel of no excess activity.― The incipientlimiting level is that level of oxygen tension below which the rate of oxygen uptakeat the maximum steady state of actHt@ begins to be reduced. This is the point
of inflection of the curves in Figu' 1 :@e incipient limiting levels of oxygen
tension thus determined for the gok . ‘¿�@‘¿�‘¿�!ivenin Table I. The point of inflection in Toryu's data occurs at an uAygen tension of the order of these values,
which appear to us to indicate that the respiratory rate he was measuring was wellabove the standard level under the conditions to which he was subjecting his animals. Such circumstances have been commonly remarked.
- @_ @-
Ic': -
Tem@ratureStandard met. ratecc. Kg.
hr.Level
of no excessactivitymm. HgAsphyxial
level'mm. HgResidual
level'mm.Hg‘142.6nil584741024811.48155010420851872514017827.21232.
83522525
72 F. E. J. FRY AND J. S. HART
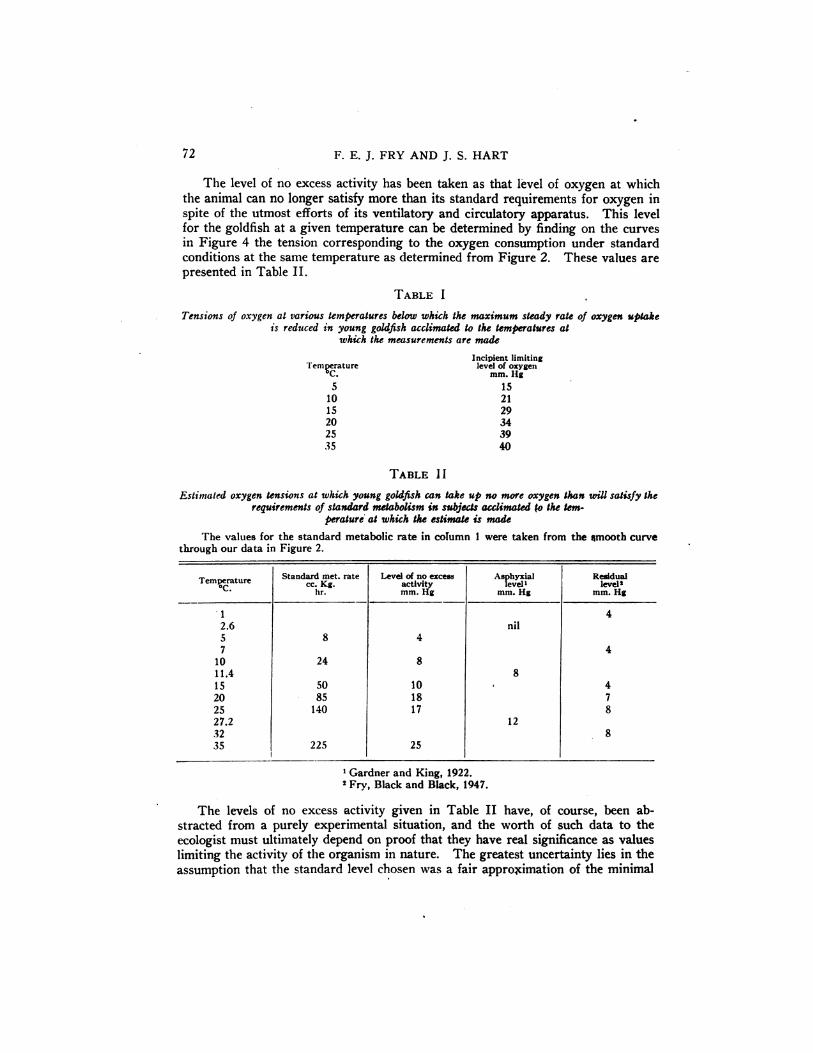
The levelof no excessactivityhas been taken as thatlevelof oxygen at which
the animal can no longer satisfy more than its standard requirements for oxygen inspite of the utmost efforts of its ventilatory and circulatory apparatus. This levelfor the goldfish at a given temperature can be determined by finding on the curvesin Figure 4 the tension corresponding to the oxygen consumption under standardconditions at the same temperature as determined from Figure 2. These values arepresented in Table II.
TABLE I
Tensionsofoxygenatvarioustemperaturesbelowwhwh themaximum steadyrateofoxygenuptakeisreducedinyounggoldfishacclimatedtothetemperaturesat
whwh themeasurementsaremade
Incipient limitingTemperature level of oxygen
C. mm.Hg
5 1510 2115 2920 3425 3935 40
TABLE II
Esti,nated oxygen tensions at which young goldfish can take up no more oxygen than will satisfy therequirements of standard metabolism in subjects acclimated @othe tem
perature' at which the estimate is made
The values for the standard metabolic rate in column I were taken from the smooth curvethrough our data in Figure 2.
‘¿�Gardnerand King, 1922.2 Fry, Black and Black, 1947.
The levels of no excess activity given in Table II have, of course, been abstracted from a purely experimental situation, and the worth of such data to theecologist must ultimately depend on proof that they have real significance as valueslimiting the activity of the organism in nature. The greatest uncertainty lies in theassumption that the standard level chosen was a fair appro@cimation of the minimal
I/Q@\@II
III@1
73OXYGEN CONSUMPTION IN GOLDFISH
respiratory requii@ements of the animal. We have not investigated the matter exhaustively, but a comparison is made in Table II with the values given by Gardnerand King (1922) for the asphyxial level of oxygen for goldfish and what for convenience have been termed “¿�residuallevels―given by Fry, Black' and Black (1947).These residual levels are the tensions of oxygen which remain in water in sealedbottlesin which the fishhave been allowed to exhaust the oxygen supply untiltheydied. Thus, since some oxygen transport still goes on after the animals have beenasphyxiated, and since the volume of water in which the fish were confined was smallthese residual values are somewhat below the asphyxial level. Taking the variouscircumstances into consideration, these three sets of data show fair agreement.
Ca
,@0
0
cEcIl
0
@0 24 28 @€¿�40
Temperarur. °C.
FIGURE 5. The relation between temperature and the active and standard levels
of oxygen uptake.
74 F. E. J. FRY AND J. S. HART
(c) The differencebetween tilemaximum and standard levelsof metabolism atvarioustemperatures
Assuming thatthe standard levelof metabolism as measured here isa reasonable approximation of the maintenance metabolism, then the metabolism availablefor activity will be of the order of the difference between the maximum and standardlevels. It willnot be the whole difference,sincewith increasingactivitythe cost
ofventilationand circulationand the otherfunctionsnecessaryto allowthe externalwork to be carriedon will,of course,increase,and some of the differencewillbe
consumed for the increase of these auxiliar@y activities. The relation between temperature and the maximum rate of oxygen uptake at levels where the oxygen tension is not limiting, that is, at levels along the horizontal portions of the curves in
Figure 4,isshown, togetherwith thecurve forstandardmetabolism in Figure 5.
ci.
) a,a,@@r4
aE c.0 :1@
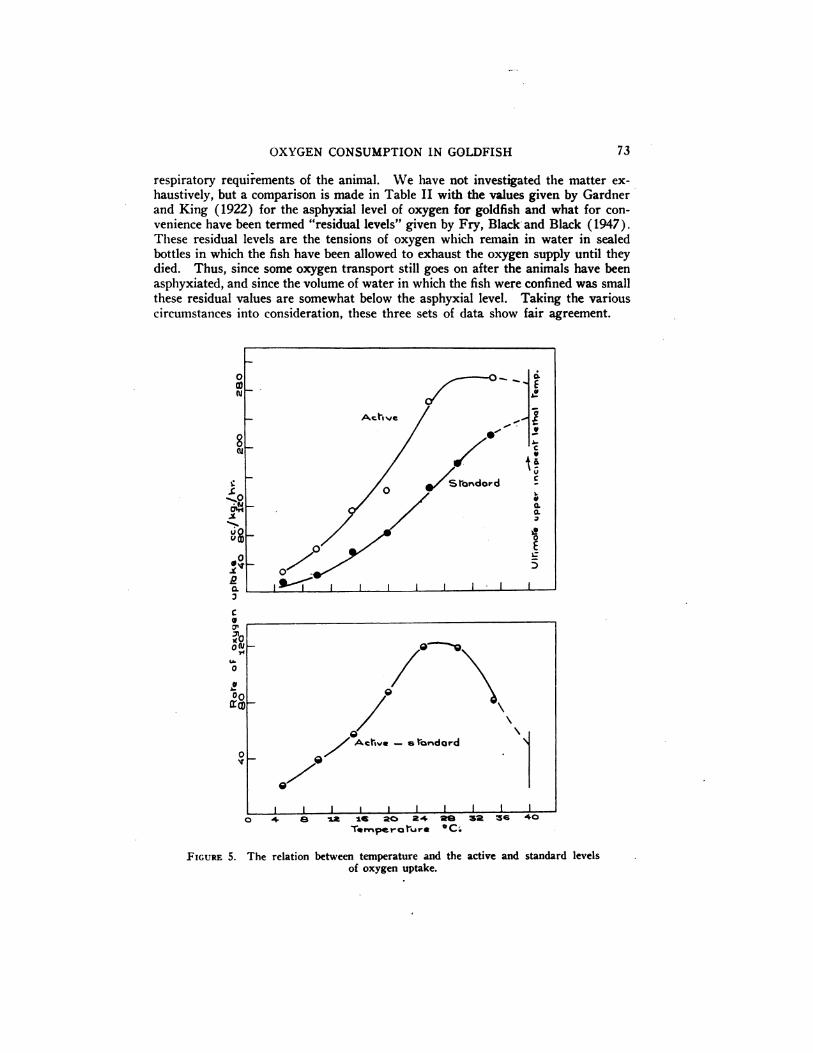
I'
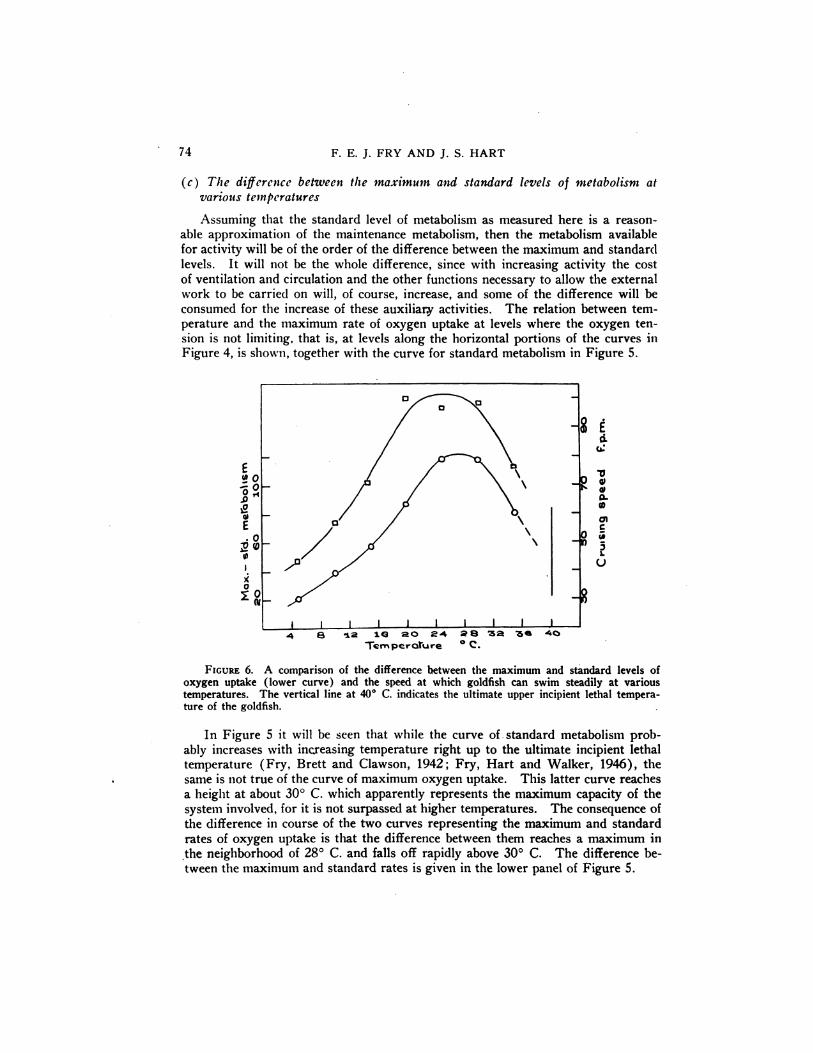
FIGURE 6. A comparison of the difference between the maximum and standard levels ofoxygen uptake (lower curve) and the speed at which goldfish can swim steadily at varioustemperatures. The vertical line at 40°C. indicates the ultimate upper incipient lethal temperature of the goldfish.
In Figure 5 it will be seen that while the curve of. standard metabolism probably increases with increasing temperature right up to the ultimate incipient lethaltemperature (Fry, Brett and Clawson, 1942; Fry, Hart and Walker, 1946), thesame is not true of the curve of maximum oxygen uptake. This latter curve reachesa height at about 30°C. which apparently represents the maximum capacity of thesystem involved,foritisnot surpassedathighertemperatures. The consequence ofthe difference in course of the two curves representing the maximum and standardrates of oxygen uptake is that the difference between them reaches a maximum in
the neighborhood of 28°C. and falls off rapidly above 30°C. The difference between the maximum and standard rates is given in the lower panel of Figure 5.
0
I I I I I I I Ia@4 8 i2 16 20 24 28
Ternperolure °C.
OXYGEN CONSUMPTION IN GOLDFISH 75
If the difference between the maximum and standard rates of metabolism doesapproximate the metabolism available for external work, then it would appear thatthere is an optimum temperature in the neighborhood of 28°C. at which goldfishcan perform the most external work. This deduction from the data on metabolismis supported by observations on the relation of temperature to cruising speed ( Fryand Hart, 1947) . The curve illustrating the relation between temperature and thespeed at which goldfish can swim steadily also appears to show a maximum between20°and 30°C., although somewhatflatter than that for the differencebetweenmaximum and standard metabolism. The curves for cruising speed and the metabolic
difference are compared in Figure 6. Thus, there seems to be the same correlationbetween oxygen consumption and activity over the whole temperature range thatSpoor (1946) demonstrated at 23—25°C.
DISCUSSION
The data presented on the maximum and standard rates of oxygen uptake pointto an explanation of activity-temperature curves which drop at the upper end of thebiokinetic range, which is alternative to the theory of thermal destruction usually inyoked in such cases. The standard metabolism appears to increase with increasingtemperature right up to the ultimate incipient lethal temperature. There is certainlyno evidence of destruction or impairment of respiratory enzymes concerned with thestandard metabolic rate up to a temperature of 35°C. On the other hand, the curvefor maximum metabolism would appear to level off above 30° C. Such levellingoffmight be caused by a destructionof enzymes at highertemperaturesto a degree
which produces a balancebetween the effectsof the increasedtemperature and theabilityof the organism to respond,but some proof of thisassumption isnecessaryifitisgoing tobe offeredas the explanation. Moreover, to explainthe drop in cruis
ingspeedabove 30°C. on thebasisofthermaldestructionofenzymes would then require that the explanation be applied to the maximum metabolic rate alone. However, a simpler explanation would be that the levelling of the maximum rate is because
the capacity of some part of the organism concerned in oxygen transport is reached at
about 30° C. However, whatever may be the explanation of the course of the curve
ofmaximuni5metabolisni,thecorrelationbetween activityand metabolism isnot witheitherofthemetaboliclevelsinvestigatedhere but with the differencebetween them.Or more properly, it is with some function of the difference between the two curveswhich ideally measure the metabolic levels and which our nieasurenients approximateas is indicated by the correlation shown in Figure 6.
With respecttotechniqueitappearsthatthe simplestand most directmethods ofobtainingecologicallysignificantvaluesof oxygen uptake are to measure the maximum rate over a series of varying oxygen tensions down to the asphyxial level, andto measure the standard rate over a range of tensions at which oxygen would not be
the limiting factor even for the maximum rate. In the case of the gold fish, for reasons stated above, carbon dioxide tension has not been considered, but for many otherSspeciesitcannot be so ignored. In many respectshowever, there seems to be nomajor objection to combining the effects of carbon dioxide increase and oxygen de
crease since they are combined in nature, particularly if the experiments are performed in water low in dissolved minerals so that a maximum increase in carbon
dioxide tension will be attained for a given decrease in oxygen. Thus the limiting
76 F. E. J. FRY AND J. S. HART
values for oxygen attained will approach the maximum that would be expected to befound in nature.
SUM MARY
1. Two levels of oxygen uptake, ( 1) the lowest point in the resting metabolismin the daily cycle and (2) the maximum steady rate of oxygen uptake found whenthe fish were stimulated to activity in a rotating chamber, were measured at ternperatures from 5°to 35°C.
2. The standard (resting) rate was measured over levels of oxygen high enoughto avoid any dependence of the rate on oxygen tension. The maximum rate wasmeasured over a series of oxygen tensions down to the asphyxial level.
3. The standard rate continued to increase with temperature up to 35°C., thehighest temperature at which observations were made. The maximum rate wasfound by interpolation to reach its highest value at about 30°C. and to remain steadyor decrease slightly at higher temperatures.
4. The maximum rate of oxygen uptake became dependent upon the oxygentension between 15 and 40 mm. Hg, depending upon the temperature. These estimates were made in a closed system in which there was an accumulation of thecarbon dioxide released in respiration.
5. Oxygen tensions at which the maximum oxygen uptake met only the needs ofthe standard metabolism were estimated to be between 4 and 25 mm. Hg over thetemperature range investigated.
6. At the various temperatures the difference between the maximum and standard metabolic rates is correlated with the rate at which goldfish can swim steadily.
7. It is concluded that the drop in the sustained swimming rate of goldfish attemperaturesfrom 30°to 38°C. isprobably due to a decreasein the metabolismavailable for external work rather than to the thermal destruction of enzymes.
LITERATURE CITED
ALLEE, W. C., AND R. OESTING, 1934. A critical examination of Winkler's method for determining dissolved oxygen in respiration studies with aquatic animals. Physiol. Zoo!.,7: 509—541.
BLACK, E. C., F. E. J. FRY, AND W. J. Scorr, 1939. Maximum rates of oxygen transport for
certain freshwater fish. Anat. Rec., 75: Supp. 80.Bazrr, J. R., 1946. Rate of gain of heat tolerance in ‘¿�goldfish.Univ. Toronto Stud. Biol.
Series 53. Pub. Oat. Fish. Re:. Lab., 64: 21 pp.EGE, R., AND A. KROGH, 1914. On the relation between the temperature and respiratory ex
change in fishes. mt. Rev. Hydrobiol. and Hydrograph., 7: 48—55.FRY, F. E. J., 1947. Effects of the environment on animal activity. Univ. Toronto Stud@ Biol.
Series 55. Pub. Ont. Fish. Re:. Lab., 68: 62 pp.FRY, F. E. J., AND J. S. HART, 1947. The cruising speed of goldfish in relation to water tem
perature. Jr. Fish. Re:. Bd. Canada, 7 (4). In press.FRY, F. E. J., V. S. BLACK, AND E. C. BLACK, 1947. Influence of temperature on the asphyxia
tion of young goldfish (Carassius auratus L.) under various tensions of oxygen andcarbon dioxide. Biol. Bull., 92: 217—224.
FRY, F. E. J., J. R. BRE1-r, AND G. H. CLA@VSON,1942. Lethal limits of temperature for younggoldfish. Rev. Can. de Biol., 1: 50—56.
FRY, F. E. J., J. S. HART, AND K. F. WALKER, 1946. Lethal temperature relations for a
sample of young speckled trout (Salvelinus fontinalis). Univ. Toronto Stud. Biol. Ser.54. Pub. Ont. Fish. Re:. Lab., 66: 5—35.
OXYGEN CONSUMPTION IN GOLDFISH 77
GARDNER,J. A., AND G. KING, 1922. Respiratory exchange in freshwater fish, Part IV. Further comparison of goldfish and trout. Biochein. Jour., 16: 729—735.
GARDNER, J. A., G. KING, AND E. B. POWERS, 1922. The respiratory exchange in freshwaterfish. III. Goldfish. Biochetn. Jour., 16: 523—529.
HENDERSON, Y., 1939. The last thousand feet on Everest. Nature, 143: 921—923.KROGH, A., 1941. The co,nparative physiology of respiratory mechanisms. Univ. of Penn.
Press, Phila.MALOEUF,N. S. R., 1937. Studies on the respiration of animals, I and II. Zeit. f. vergi..
Physiol., 25: 1—28,29-42.SPOOR,W. A., 1946. A quantitative study of the relationship between the activity and oxygen
consumption of the goldfish, and its application to the measurement of respiratorymetabolism in fishes. Biol. Bull., 91: 312—325.
TORYU, Y., 1927. Respiratory exchange in Carassius auratus and the gaseous exchange of theair bladder. Sci. Rept. Tohoku mmp. Univ. L., 3: 87—96.
WELLS, N. A., 1935. The influence of temperature upon the respiratory metabolism of thePacific killifish, Fundulus parvipinnis. Physiol. Zoo!., 8: 196—227.