fti consulting inc
TRANSCRIPT
May 2008
FTI Consulting Inc.

1
Cautionary Note about Forward-Looking Statements
Certain statements made by us in this presentation that are not historical facts or that relate to future plans, events or performances are forward-looking statements within the meaning of the federal securities laws. Our actual results may differ materially from those expressed in any forward-looking statements made by us. Forward-looking statements involve a number of risks of uncertainties including, but not limited to, the risks described under the heading “Risk Factors” in the company’s filings with the Securities and Exchange Commission. All forward-looking statements are qualified by those risk factors. All statements made by us in this presentation are further qualified in all respects by the information disclosed in the company’s filings with the Securities and Exchange Commission. These statements are only predictions. We are under no duty to update or revise any forward looking statements to conform such statements to actual results or events, and do not intend to do so.

2
FTI – Global Leader in a Dynamic Growth Industry
• Unparalleled intellectual capital that solves mission-critical, complex problems
• Proprietary, “Gold Standard” technology products and services
• Disciplined, proven growth strategy
• Industry-leading compensation and retention programs ensure enterprise stability and align FTI’s professionals with shareholders
• Superior economic characteristics with industry-leading margins
($MMs)
33% CAGR
RevenueRevenue
($)
EPS(1)EPS(1)
($MMs)
EBITDA(1)EBITDA(1)
(1) Adjusted for one-time items where applicable
$94
$217
2004 2007
$0.95
2004 2007
32% CAGR
28% CAGR
$427
2004 2007
$1,001 $2.00
“Enterprise Value = Reputation X Results”
3
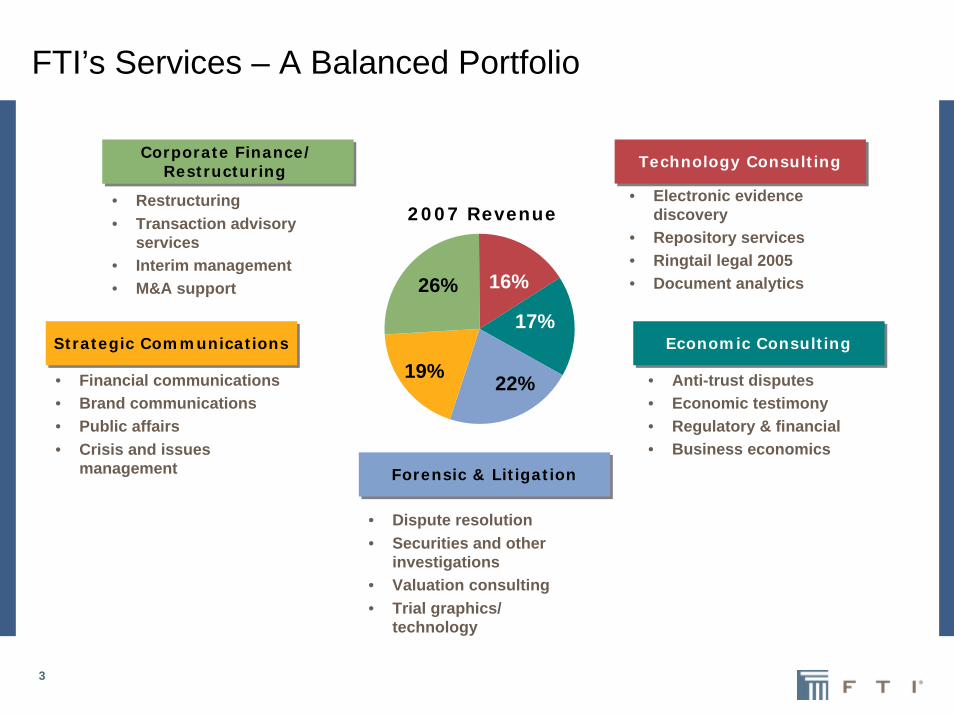
FTI’s Services – A Balanced Portfolio
2007 Revenues (e)
19%
26% 16%
22%
17%
• Restructuring • Transaction advisory
services• Interim management• M&A support
• Dispute resolution• Securities and other
investigations• Valuation consulting• Trial graphics/
technology
• Electronic evidence discovery
• Repository services• Ringtail legal 2005• Document analytics
• Anti-trust disputes• Economic testimony• Regulatory & financial• Business economics
• Financial communications• Brand communications• Public affairs• Crisis and issues
management
Technology ConsultingTechnology Consulting
Economic ConsultingEconomic Consulting
Forensic & LitigationForensic & Litigation
Strategic CommunicationsStrategic Communications
Corporate Finance/Restructuring
Corporate Finance/Restructuring
2007 Revenue
4
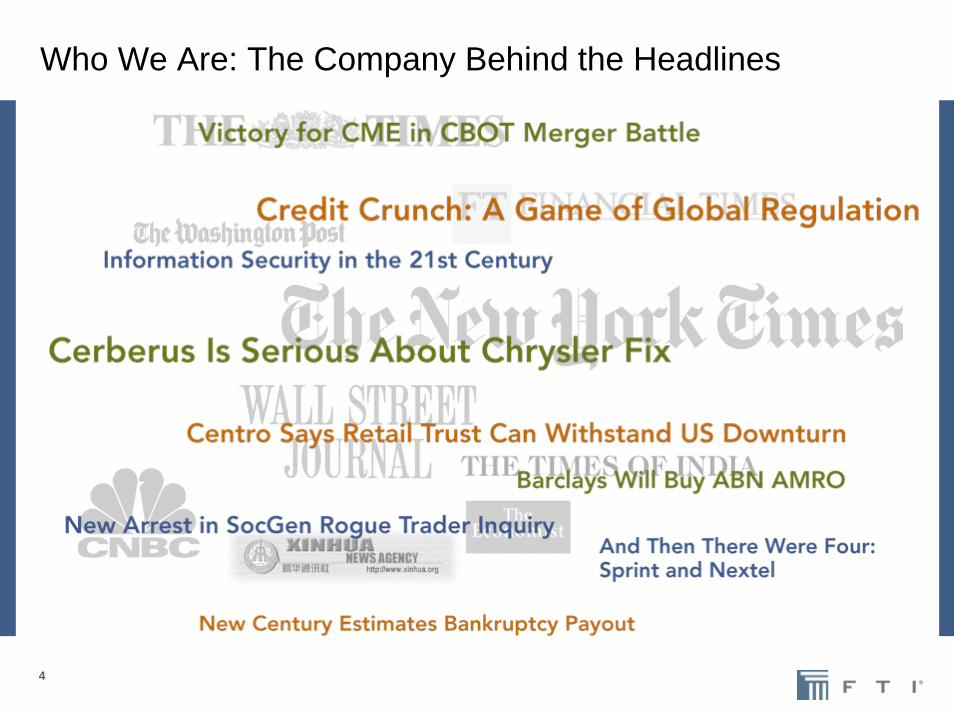
Who We Are: The Company Behind the Headlines
5
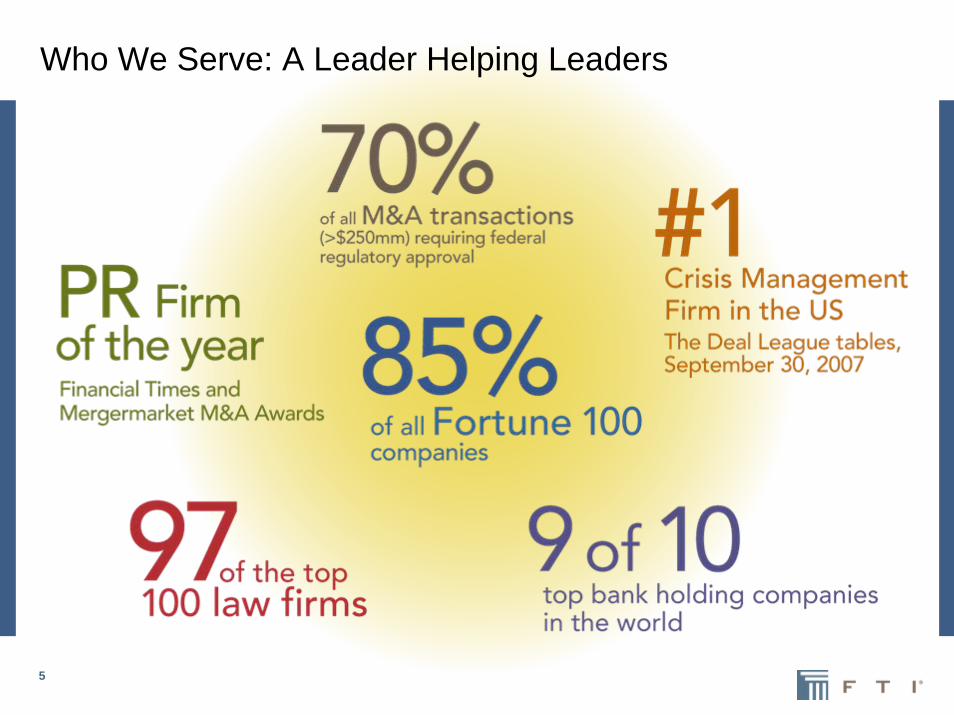
Who We Serve: A Leader Helping Leaders

6
How We Serve Our Clients: Best Intellectual Capital
Former Chief Executives and Political leaders
Nobel Laureates
Certified turnaround professionals
Top Ranking Economists
Former SEC professionals
Interim management professionals
Crisis and reputation specialists
Banking and Securities experts
Certified public accountants
Chartered financial analysts
Corporate investigation specialists
Corporate and financial communications
specialists
FTI’s “SMD” program aligns key professionals with shareholders and results in the industry’s highest retention rates.

7
Why It Matters: Industry-leading Growth and Profitability
$564.0
$534.0 $525.0
$412.0 $402.0
$350
$400
$450
$500
$550
$600
$650
FCN HURN CRAI NCI XPRT
2007 Revenue Per Employee2007 Revenue Per Employee 2007 Operating Margin2007 Operating Margin
18.7%
15.3%
12.4%
9.6%
5.9%
0%
10%
20%
FCN HURN CRAI NCI XPRT
Source: Company 10-Ks

8
FTI’s Market: Strong Demand Throughout Economic Cycles
Secular Drivers:•Technology Solutions•Litigation•Regulatory•Value creation•Risk management•Crisis communications
Secular Drivers:•Technology Solutions•Litigation•Regulatory•Value creation•Risk management•Crisis communications
Drivers in Downturn:•Restructuring•Interim management•Employee communications
Drivers in Downturn:•Restructuring•Interim management•Employee communications
Drivers in Expansion:•Business improvement•Transaction advisory•Economic consulting•Corporate brand marketing
Drivers in Expansion:•Business improvement•Transaction advisory•Economic consulting•Corporate brand marketing
2007
2008
9
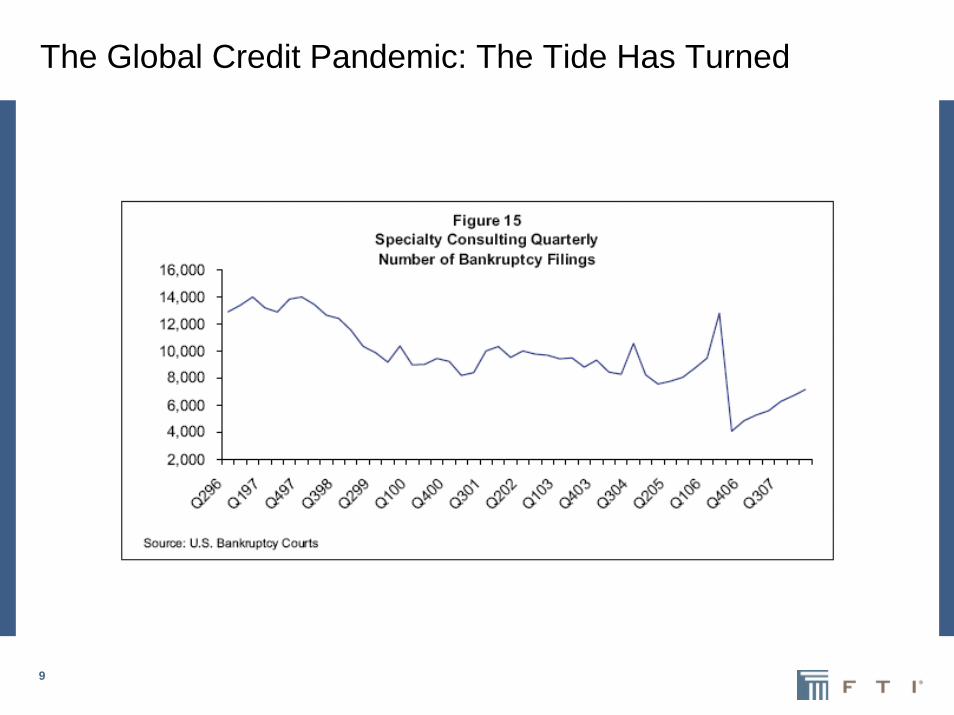
The Global Credit Pandemic: The Tide Has Turned

10
The Global Credit Pandemic: A Major Driver of Growth for Some Time to Come
01234567
Dec-06
Jan-07
Feb-07
Mar-07
Apr-07
May-07
Jun-07
Jul-07
Aug-07
Sep-07
Oct-07
Nov-07
Dec-07
Jan-08
Feb-08
Mar-08
Apr-08
May-08
Jun-08
Jul-08
Aug-08
Sep-08
Oct-08
Nov-08
Dec-08
Jan-09
Feb-09
Global Default Rate (%) on Speculative-Grade Debt
Source: Moody’s
20 Year Average
Moody’sEstimates

11
The Global Credit Pandemic: FTI the Clear Leader in Restructuring

12
Our Solution: We Surround the Global Credit Crisis
Fraud Litigation
Liquidity
Conflicts
IncreasedRegulation
AssetImpairment
UnderperformingBusinesses

13
How We Grow: Strategies to Meet Market Demand
Brand and Reputation
GlobalFootprint
Broadening ServicePortfolio
AcquisitionsG
RO
WTH
STR
ATE
GIE
S
ExplodingMarket
Demand

14
How We Do It: Investing in the Brand and Reputation
Increased investments in corporate sponsorships and thought leadership during 2007
Hedge Fund Leadership ForumYankee Stadium
Hamptons Classic“Life Inside the Fishbowl”Boardroom Event Series
“Under pressure: The changing role of the GC”

15
Where We Do It: Advising Across a Global Economy• We deploy more than 3,000 professionals from every major financial center
to every corner of the globe so that we can serve our clients wherever challenges arise.
United StatesAnnapolisAtlantaBaltimoreBostonBrentwoodCambridgeCharlotteChicagoClevelandDallasDenverDetroitHoustonIndianapolisKing of PrussiaLos AngelesMiamiNashvilleNew YorkOrlandoOrange CountyPhiladelphiaPhoenixPittsburghRockvilleSaddle BrookSalt Lake CitySan FranciscoSeattleTucsonWashington, DCWest Palm Beach
ArgentinaBuenos Aires
AustraliaMelbourneSydney
Kingdom of BahrainManama
BelgiumBrussels
BrazilSão Paulo
ChinaBeijingGuangzhouHong KongShanghai
ColombiaBogotá
FranceParis
GermanyFrankfurt
IrelandDublin
MexicoMexico City
PanamáPanamá City
RussiaMoscow
SingaporeSingapore
South AfricaCape TownJohannesburg
JapanTokyo
United KingdomEpsomLondonManchesterNorthamptonStirling
United Arab Emirates Abu DubaiDubai
16
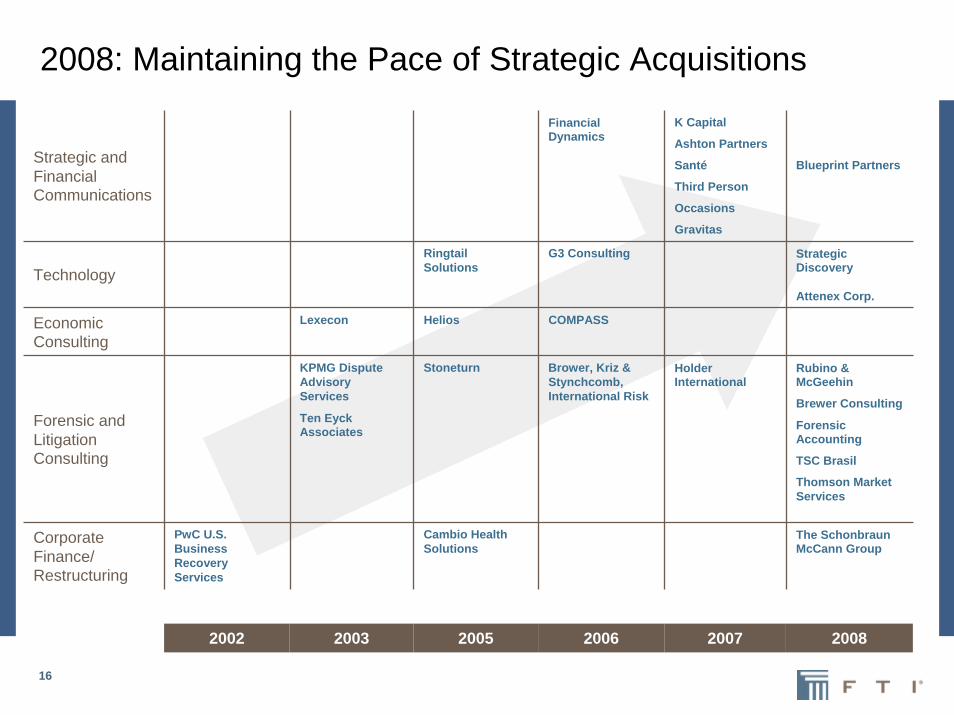
2002 2003 2005 2006 2007 2008
Strategic and Financial Communications
Financial Dynamics
K Capital
Ashton Partners
Santé
Third Person
Occasions
Gravitas
Blueprint Partners
TechnologyRingtail Solutions
G3 Consulting Strategic Discovery
Attenex Corp.
Economic Consulting
Lexecon Helios COMPASS
Forensic and Litigation Consulting
KPMG DisputeAdvisoryServices
Ten Eyck Associates
Stoneturn Brower, Kriz &Stynchcomb, International Risk
Holder International
Rubino & McGeehin
Brewer Consulting
Forensic Accounting
TSC Brasil
Thomson Market Services
Corporate Finance/ Restructuring
PwC U.S.Business Recovery Services
Cambio HealthSolutions
The Schonbraun McCann Group
2008: Maintaining the Pace of Strategic Acquisitions
17
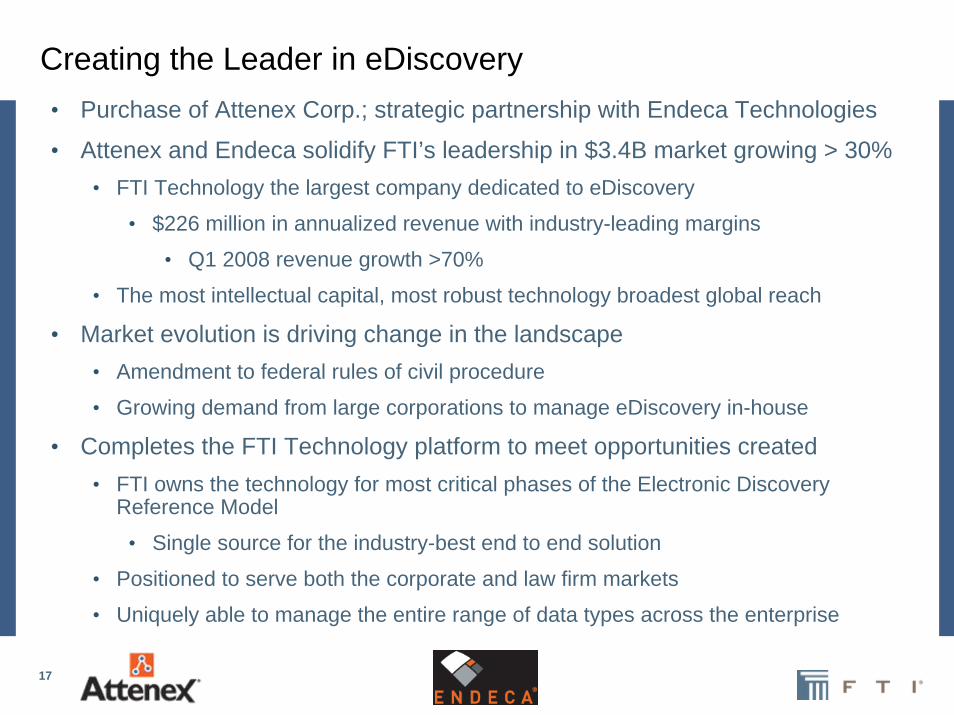
Creating the Leader in eDiscovery• Purchase of Attenex Corp.; strategic partnership with Endeca Technologies
• Attenex and Endeca solidify FTI’s leadership in $3.4B market growing > 30%• FTI Technology the largest company dedicated to eDiscovery
• $226 million in annualized revenue with industry-leading margins
• Q1 2008 revenue growth >70%
• The most intellectual capital, most robust technology broadest global reach
• Market evolution is driving change in the landscape• Amendment to federal rules of civil procedure
• Growing demand from large corporations to manage eDiscovery in-house
• Completes the FTI Technology platform to meet opportunities created• FTI owns the technology for most critical phases of the Electronic Discovery
Reference Model
• Single source for the industry-best end to end solution
• Positioned to serve both the corporate and law firm markets
• Uniquely able to manage the entire range of data types across the enterprise

18
Where We’re Going: “FTI 2012”• Achieved key components of our 2009 Plan in 2007
• Have recently launched “FTI 2012” our plan for the next five years
• Key elements of FTI 2012:
• Annual revenue of $2.5 billion; organic growth + strategic acquisitions
• Broaden service offerings, strengthen expertise in key industries
• EBITDA margins of 25% before 123R expense
• Generate 30-35% of revenue outside the United States
• Maintain a strong Balance Sheet
The Gold Standard for Event-driven Consulting

19
FTI’s Results

20
2007 Results($ in thousands, except per share data)
2007 2006
Revenue $1,001,270 $707,933
Direct cost of revenues 548,407 389,032Selling, general and administrative expense 255,238 178,572 Special charges - 22,972 Amortization of other intangible assets 10,615 11,175
814,260 601,751
Operating income 187,010 106,182
Other income (expense)Interest income 8,173 2,575 Interest expense and other (44,391) (29,405) Litigation settlement gains (losses), net (1,002) (187)
Income before income tax provision 149,790 79,165
Income tax provision 57,669 37,141
Net income 92,121$ 42,024$
Earnings per common share - diluted 2.00$ 1.04
Weighted average common shares outstanding - diluted 45,974 40,526
EBITDA $215,974 $130,367Adj. EBITDA (1) 215,974 153,339
% margin 21.6% 21.7%(1) Before special charges
Year Ended Dec 31,
+ 41.4%
+ 40.8%
21
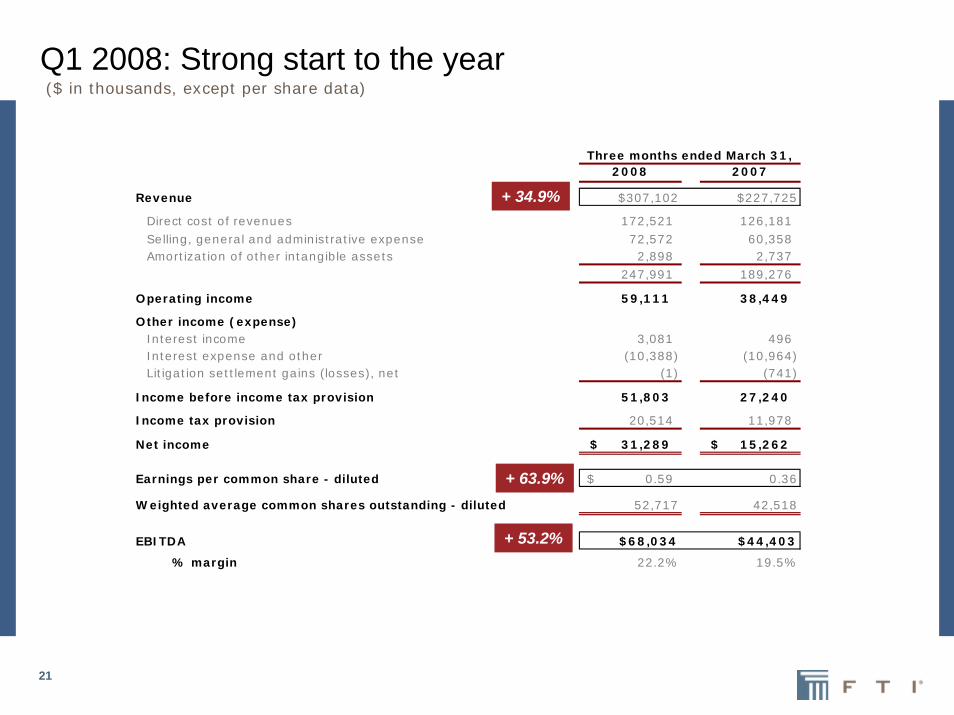
Q1 2008: Strong start to the year($ in thousands, except per share data)
2008 2007
Revenue $307,102 $227,725
Direct cost of revenues 172,521 126,181 Selling, general and administrative expense 72,572 60,358 Amortization of other intangible assets 2,898 2,737
247,991 189,276
Operating income 59,111 38,449
Other income (expense)Interest income 3,081 496 Interest expense and other (10,388) (10,964) Litigation settlement gains (losses), net (1) (741)
Income before income tax provision 51,803 27,240
Income tax provision 20,514 11,978
Net income 31,289$ 15,262$
Earnings per common share - diluted 0.59$ 0.36
Weighted average common shares outstanding - diluted 52,717 42,518
EBITDA $68,034 $44,403
% margin 22.2% 19.5%
Three months ended March 31,
+ 34.9%
+ 53.2%
+ 63.9%
22
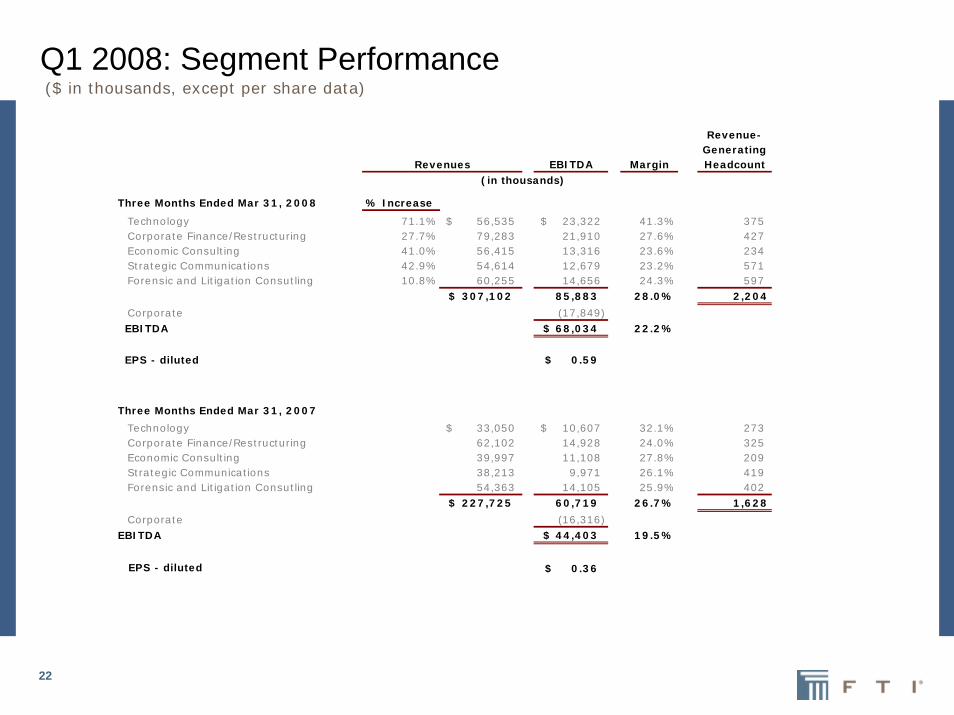
Revenue-Generating
EBITDA Margin Headcount
Three Months Ended Mar 31, 2008 % Increase
Technology 71.1% 56,535$ 23,322$ 41.3% 375 Corporate Finance/Restructuring 27.7% 79,283 21,910 27.6% 427 Economic Consulting 41.0% 56,415 13,316 23.6% 234 Strategic Communications 42.9% 54,614 12,679 23.2% 571 Forensic and Litigation Consutling 10.8% 60,255 14,656 24.3% 597
307,102$ 85,883 28.0% 2,204
Corporate (17,849) EBITDA 68,034$ 22.2%
EPS - diluted 0.59$
Three Months Ended Mar 31, 2007
Technology 33,050$ 10,607$ 32.1% 273 Corporate Finance/Restructuring 62,102 14,928 24.0% 325 Economic Consulting 39,997 11,108 27.8% 209 Strategic Communications 38,213 9,971 26.1% 419 Forensic and Litigation Consutling 54,363 14,105 25.9% 402
227,725$ 60,719 26.7% 1,628
Corporate (16,316) EBITDA 44,403$ 19.5%
EPS - diluted 0.36$
Revenues (in thousands)
Q1 2008: Segment Performance($ in thousands, except per share data)

23
2008 Guidance Maintains the Momentum
$427$540
$708
$1,001
$1,337
2004 2005 2006 2007 2008G
33% CAGR
RevenueRevenue EPS(1)EPS(1)
$0.95
$1.22$1.36
$2.00
2004 2005 2006 2007 2008G
28% CAGR
(1) Adjusted for one-time items where applicable
$2.57
G = Midpoint of 2008 guidance

24
FTI – Global Leader in a Dynamic Growth Industry
• Unparalleled intellectual capital that solves mission-critical, complex
problems
• Proprietary “Gold Standard” technology products and services
• Disciplined, proven growth strategy
• Industry-leading compensation and retention programs insure
enterprise stability and align FTI’s professionals with shareholders
• Superior economic characteristics with industry-leading margins

25
FTI as Trusted Advisor:“Solving the Problems that Keep Directors up at Night”