ftth network economics -...
TRANSCRIPT
In this paper, we present the results obtained bymodeling the capital investments and operations ex-penses incurred for some operator cases, and identifythe key parameters that impact FTTH economics cove-ring these major technologies. We show sensitivity ana-lysis to identify the critical parameters. The methodo-logy and results will enable operators quickly make theright FTTH technology deployment decisions.
1. Introduction
The number of households with fiber-optic networkconnections will grow by nearly 43% worldwide in 2008and will continue to grow at rates above 30% a yearthrough 2012, when the number of fiber-connectedhouseholds will reach nearly 90 mil-lion globally according to a recentreport by Heavy Reading [1]. Henceit is no surprise that almost all thenetwork operators around the worldare evaluating the different FTTH tech-nology options today. Deploying aFTTH network requires significantupfront capital investments and it isabsolutely critical for an operator tobuild a detailed network economicmodel and pick the right technologythat optimizes their capital expen-ses, operations expenses and pay-back period. Service Provider net-work requirements and topologiesvary considerably; hence networkmodeling and solutions need to betailored to specific service providersituations.
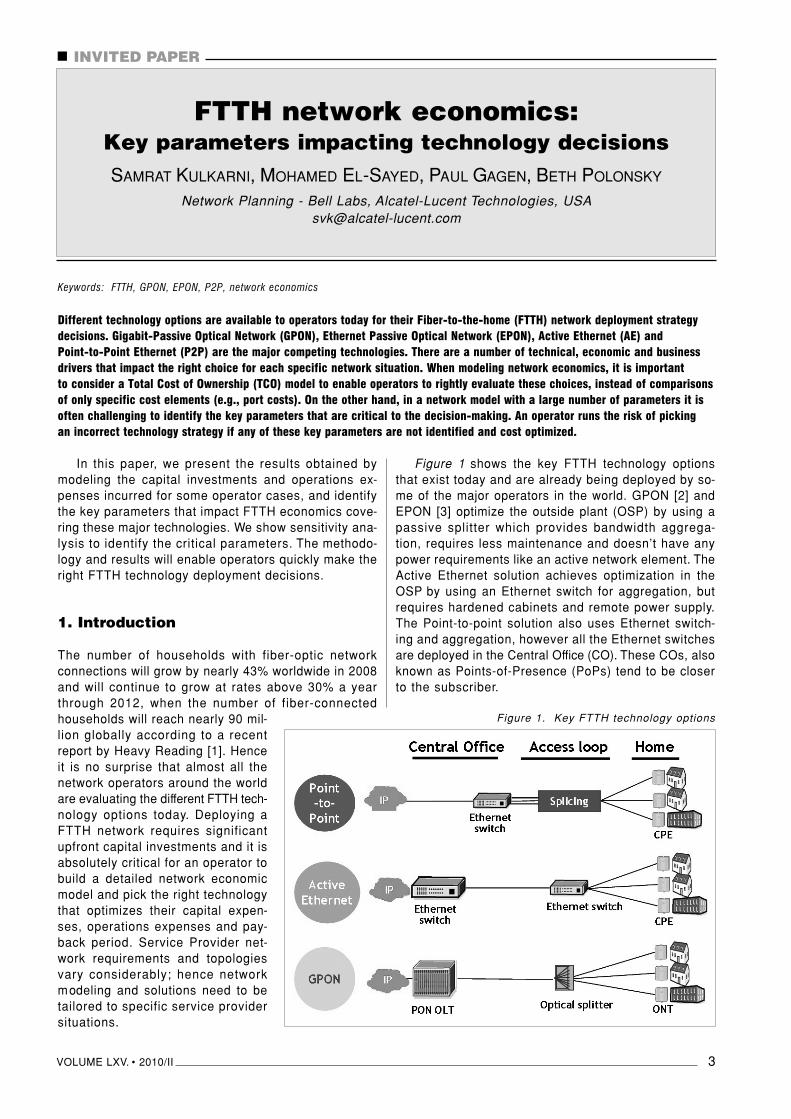
Figure 1 shows the key FTTH technology optionsthat exist today and are already being deployed by so-me of the major operators in the world. GPON [2] andEPON [3] optimize the outside plant (OSP) by using apassive splitter which provides bandwidth aggrega-tion, requires less maintenance and doesn’t have anypower requirements like an active network element. TheActive Ethernet solution achieves optimization in theOSP by using an Ethernet switch for aggregation, butrequires hardened cabinets and remote power supply.The Point-to-point solution also uses Ethernet switch-ing and aggregation, however all the Ethernet switchesare deployed in the Central Office (CO). These COs, alsoknown as Points-of-Presence (PoPs) tend to be closerto the subscriber.
Figure 1. Key FTTH technology options
VOLUME LXV. • 2010/II 3
� INVITED PAPER
FTTH network economics: Key parameters impacting technology decisionsSAMRAT KULKARNI, MOHAMED EL-SAYED, PAUL GAGEN, BETH POLONSKY
Network Planning - Bell Labs, Alcatel-Lucent Technologies, [email protected]
Keywords: FTTH, GPON, EPON, P2P, network economics
Different technology options are available to operators today for their Fiber-to-the-home (FTTH) network deployment strategydecisions. Gigabit-Passive Optical Network (GPON), Ethernet Passive Optical Network (EPON), Active Ethernet (AE) and Point-to-Point Ethernet (P2P) are the major competing technologies. There are a number of technical, economic and businessdrivers that impact the right choice for each specific network situation. When modeling network economics, it is important to consider a Total Cost of Ownership (TCO) model to enable operators to rightly evaluate these choices, instead of comparisons of only specific cost elements (e.g., port costs). On the other hand, in a network model with a large number of parameters it isoften challenging to identify the key parameters that are critical to the decision-making. An operator runs the risk of picking an incorrect technology strategy if any of these key parameters are not identified and cost optimized.

INFOCOMMUNICATIONS JOURNAL
4 VOLUME LXV. • 2010/II
In the next section, we discussthe details of a comprehensive andflexible network cost model thatcompares these FTTH technologyoptions, and quantifies the savingsthrough case studies. This model al-so includes a task-based operationsanalysis. Results of three case stu-dies are presented, and sensitivityanalyses of the results are appliedto identify the key parameters.
2. Modeling framework
The network economic modelingframework includes capital invest-ments (CAPEX) and operations ex-penses (OPEX) optimization for thetechnology options and across scenarios applicableto typical service provider networks. The services re-venues supportable by these access options are assu-med to be common and hence are not included in thismodel Also, the scope is related to cost-elements, anddoes not cover other aspects (such as performance, stan-dards etc).
Typical operator scenarios include: • Type of subscriber:
Single-family residential (SFR), Multi-Dwelling Unit (MDU) and Enterprises.
• Subscriber housing density: Loop lengths from the CO, number of houses per square-km;
• Network build type: Greenfield, Overbuild.• Fiber cost type:
Leased vs. own, one-time fee vs. recurring.• Outside plant construction type:
Aerial, Buried, Conduit, Sewer etc.• Splitting levels:
1-Tier centralized and/or 2-Tier distributed for PON.Typical cost elements are:
• Hardware and software for Central Office (CO),OSP, and Customer Premises Equipment (CPE),active equipment and operating support systems.List prices are prorated based on experiencecurves (market averages and up to 10% annualcost reductions) and equipment discounts (0-50%) for sensitivity analysis.
• Cost of the OSP: feeder, distribution and drop fiber;civil works for the structures, trenches, installationand splicing; cabinets, splitters, fiber managementpoints and patch-panels.
• Power and space/housing costs: Costs to setupactive nodes, realtor fees, provisioning of AC, ongoing energy costs and floor space rental.
• Activation costs such as truck roll to OSP, customer service visit, service activation in CO.
• Other operations cost such as provisioning and maintenance activities.
Figure 2. CAPEX Breakdown at 20% take-rate
3. Case Studies
In this section, we discuss and summarize results fromthree network modeling case studies as below. For allthe three case studies, it can be assumed that the CA-PEX/subscriber and OPEX/subscriber have been optimi-zed for each technology solution by assuming a reaso-nable OSP model and based on the specific scenarioand cost parameters. Then we use sensitivity analysistechniques to identify the key network cost parameters.
3.1 Case Study 1: GPON vs P2P for a dense urban city
This case study compares the costs of deployingGPON and P2P in a dense urban MDU subscriber base.There are close to a million households (HH) passed inan area of roughly 100 square kms. The average size ofan MDU is assumed to be 16HH. A GPON operator has8 CO locations to serve these HH and 200 Fiber Flexibi-lity Points (FFPs) where splitters are located, whilst theP2P operator is deploying 80 new PoPs. The civil worksis assumed to use existing structures such as the sew-er in the city thereby eliminating most of the trenchingand duct costs. In our modeling analysis the take-rateis varied from 0-100%.
Figure 2 shows the P2P and GPON 2-Tier architec-tures and the corresponding CAPEX cost componentsfor a take-rate of 20%. The 2-Tier GPON architectureassumes a splitter in the basement of the building.
It is observed that the bulk of the CAPEX/sub is in thefiber distribution and MDU wiring. The CPE accounts forthe next highest cost component followed by Ethernetswitch cost and the GPON OLT. The remaining networkelements do not contribute significantly to the overallcost.
We also find that GPON provides a saving of about20% compared to P2P at a take-rate of 20%, and the sav-ings are positive over the entire range of take-rates up

FTTH network economics
VOLUME LXV. • 2010/II 5
to 100% (Figure 3). Also 2- Tier GPON is cost-effective by0-10% over 1-Tier GPON and the savings are higher atlower take-rates.
To identify the key cost parameters,we look at the results of a single parame-ter sensitivity analysis (Tornado analy-sis) as shown in Figure 4.
Sensitivity analysis shows, the Top-5CAPEX parameters are:
– Fiber-cost per meter,– GPON CPE cost,– Ethernet switch cost,– Real-estate cost for Ethernet
switches deployed outside the CO,– GPON OLT cost. The remaining parameters have an im-
pact on the overall CAPEX but do not swingthe GPON vs. P2P decision as much.
Figure 4. CAPEX Tornado analysis
The tornado analysis does not cap-ture the interaction between the para-meters. Hence a 1000-iteration Monte-Carlo analysis was performed with a±50% variation in the value of the costparameters with all parameters vari-ed randomly per iteration, and histo-gram of results plotted. The x-axis ofFigure 5 shows the percent savings ofGPON over P2P. Even with this widerange of variation, GPON still provideda significant cost advantage over P2Pmaking it the technology of choice.
Operations Cost Modeling ResultsThe following operations cost ele-
ments are considered in this model.• Unplanned Maintenance:
Repair activity based on equipment quantities andFIT data. Operation tasks include: testing, fault isolationand equipment repair (Truck roll).
Figure 5. CAPEX Monte-Carlo analysis
• Planned Maintenance: Calculated based on equipment
quantity, maintenance interval and ef-fort, equipment clustering and loca-tion density. Fiber maintenance basedon total length of cables and yearlyper meter. Operation tasks include:battery replacement, fan filter repla-cement, drive time and paperwork todocument preventative maintenance,fiber inspection/cleaning and debrisremoval.
• Centralized NOC Staffing: Surveillance staff estimated bas-
ed on total number of active devices.Operation tasks include: 24x7 faultmonitoring, remote diagnostics andtrouble ticket creation.
Figure 3. CAPEX/sub vs. Take-rate

INFOCOMMUNICATIONS JOURNAL
6 VOLUME LXV. • 2010/II
• Differences in Customer Provisioning and DisconnectScenarios:
Cost of connecting/disconnectinga customer based on equipment lo-cations and utilization. Operation Tasksinclude: CPE installation, in-buildingfiber connection, PoP/FFP connections,testing and inventory updates.
• Customer Care: Estimated based on failure inci-
dence (calculated for unplanned ma-intenance) and number of customerimpacts/incidents. Operation Tasks in-clude: customer care call handling.
The OPEX modeling results show a saving of 55-60% for GPON compared to P2P over a wide range oftake-rates (Figure 6). These savings are mainly dueto the higher Right-of-Way (RoW) ex-penses for P2P given the large amountof f iber infrastructure deployed onDay 1.
The Right-of-Way is a yearly recur-ring expense that the operator in thiscase would need to pay to the gover-ning entity to use the civil works in-frastructure while laying out fiber ca-bles.
Typical components of RoW are afixed cost to access the civil works i nthe OSP and in the building, and a v a-riable cost as a function of the numberof cables run. Furthermore, the cost ofmaintenance and management is high-er in P2P compared to GPON becauseof the higher number of fiber-pairs de-ployed.
The sensitivity analysis (Figure 7)shows that the Top-3 OPEX impactingparameters are:
– Right-of-Way charges,– cost of energy (KW/hr),– fiber maintenance costs.A Monte-Carlo analysis was also per-
formed that confirmed the results thatGPON provides significant OPEX savingscompared to P2P, and details are not pre-sented here for brevity.
Also, although this case study look-ed at a dense urban MDU deployment, ithas been found that the same trend interms of the key parameters and GPONsavings are applicable to a single fa-mily residential urban and sub-urban mo-
del with reasonable population densities and operatordeployment scenarios.
Figure 6. OPEX per sub vs. Take-rate
Figure 7. OPEX Sensit ivity Analys is
Figure 8. GPON, AE CAPEX vs. Take-rate

FTTH network economics
VOLUME LXV. • 2010/II 7
3.2 Case Study 2: GPON vs. Active Ethernet for a dense urban city
An operator that has deployed DSLAMsto provide ADSL/VDSL broadband ac-cess to some end users may considerthis scenario when they decide to migra-te to a FTTH last mile, by provisioning fi-ber loops to the cabinet. Also, technolo-gy exists today to install Ethernet cards inan existing (DSLAM) street cabinet. Wecompare the CAPEX/sub and OPEX/subfor this operator to an operator deploy-ing only GPON to serve the fiber sub-scribers.
The same dense urban MDU subscri-ber model as in Case Study 1 is used here.We assume for the Active Ethernet model,buried fiber civil work is needed in thedistribution network only (cabinet to sub)since fiber already exists to the cabinetto backhaul the DSLAM traffic Assumingtypical serving areas of 250-300 per ca-binet, about 4500 cabinets are needed.
Figure 8 shows that Active Ethernethas a saving of about 5% compared toGPON 2-Tier and the savings diminish withincreased take-rate. Given the range ofsavings (<5%), it is argued that neithertechnology is the clear winner in termsof CAPEX/sub.
Figure 9 shows the breakdown of CA-PEX/sub at 20% take-rate. The AE solu-tion has zero housing cost for the PoPsince the OSP cabinets are re-used (unlike in Case Stu-dy 1), and remaining costs balance out. Therefore CA-PEX is not a key differentiator in this case.
Now considering the OPEX/sub as shown in Figure10, we find that GPON provides large savings compa-red to P2P. The OPEX savings for 2-Tier GPON increase
with higher take-rates and are in the range of 5-58% sa-vings annual ly. Therefore, if the operator plans to tar-get for a 30% or higher subscriber take-rate, then GPONshould be the technology of choice.
Figure 11. GPON vs. EPON
network model
Figure 9. GPON vs. AE CAPEX (20% TR)
Figure 10. GPON, AE OPEX/sub vs. Take-rate
INFOCOMMUNICATIONS JOURNAL
8 VOLUME LXV. • 2010/II
We note that this case is really a special case of CaseStudy 1 with the assumption that the Ethernet switch isdeployed in the OSP using a hardenedcabinet instead of a PoP. The relevantkey parameters identified through sen-sitivity analysis in Case Study 1 applyhere as well.
3.3 GPON vs. EPONThis case study is for an operator
deciding between GPON and EPON. Wemodel an operator deploying a networkin an urban city. The model assumes adeployment period of five years (2007-2011). Figure 11 shows the architectu-res for the SFR model which is FTTH,MDU model which assumes Fiber-to-the-Building and VDSL2 inside the building,and enterprises served by fiber (Fiber-to-the-Business).
Each type is modeled independently.The MDU case assumes copper loopsinside the building are used instead offiber all the way. Services bandwidthis assumed to grow from 10 Mbps/yearstarting with 10 Mbps in 2007 to 50 Mbpsin 2011.
Cost items modeled include: activeNE (CO switch, CPE), passive compo-nents (splitter, ODF, fiber) and OPEX(space, power). It can be noted that bothtechnologies use the same OSP infra-structure (civil works etc.) and that costis ignored in this model.
Comparing the CAPEX/sub (Figure12) shows that EPON provides a lowerstart-up cost in the initial years, but re-
quires significant investment infuture years.
• Present Value of Savingsof GPON over EPON =17% (SFR), 19% (MDU)and 30% (Enterprise)
Figure 13 provides a break-down of the key cost elementsfor the SFR case. When the band-width is low (<20 Mbps until 2008),EPON saves on all cost compo-nents. With increased bandwidthhowever, GPON scales better cost-wise whereas EPON needs moreOLT ports, splitters, fibers etc.
This is because of the loweroverheads and higher payloadbit-rates in the GPON technologytoday compared to EPON.
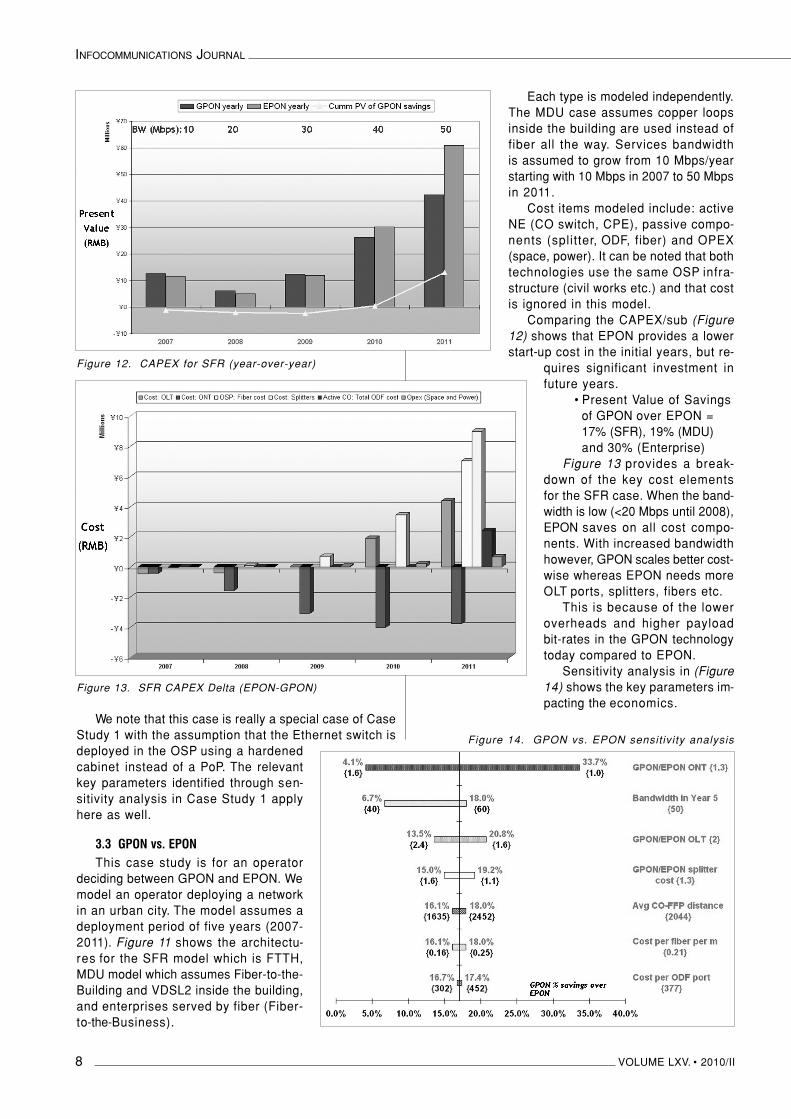
Sensitivity analysis in (Figure14) shows the key parameters im-pacting the economics.
Figure 14. GPON vs. EPON sensitivity analysis
Figure 12. CAPEX for SFR (year-over-year)
Figure 13. SFR CAPEX Delta (EPON-GPON)

FTTH network economics
VOLUME LXV. • 2010/II 9
The Top-2 critical parameters are:– user bandwidth: if BW is below 30 Mbps,
GPON doesn’t save compared to EPON,– GPON/EPON price ratios for the ONT and ONU.
Evaluating these key parameters correctly will ena-ble the operator make the right technology decisionsmoving forward.
4. Conclusions
A detailed analysis of FTTH economics across a rangeof different scenarios and parameters was developedcomparing GPON, EPON, P2P and Active Ethernet. Re-sults for three real-world customer modeling case stu-dies were presented with sensitivity analyses.
They are summarized as follows:
Case Study 1: ( GPON vs. P2P network)Over a wide range of take rates and parameters,
GPON provides lower CAPEX/sub and OPEX/sub com-pared to P2P. This is primarily due to the significant OSPfiber investment needed on Day 1 for P2P.
• Average savings: CAPEX = 20% and OPEX = 55-60%
• 2-Tier GPON is more cost effective than 1-Tier(for MDU) by 0-10%.
• The specific results above apply to an examplecase of an overbuild FTTH network deployment in MDU; our studies show GPON savings apply toan urban/sub-urban SFR deployment case as well.
Sensitivity analysis shows that the Top-5 parame-ters impacting CAPEX are:
– fiber cost per meter,– GPON CPE cost,– Ethernet switch cost,– real-estate/housing cost for Ethernet switches
deployed outside the CO,– GPON OLT cost.
Sensitivity analysis indicates that the Top-3 OPEXparameters are:
– Right-of-Wa y– cost of energy– fiber maintenance.
Case Study 2: (GPON vs. AE network)Here an operator may consider serving FTTH
subscribers directly from the DSLAM chassis. In suchsituations, the economics of Active Ethernet and GPONwill change considerably.
• An Ethernet card in the DSLAM is expected to provide a cost effective solution for FTTH inlow or medium fiber deployment situations (take-rates ~10-20%).
• The CAPEX/sub difference between GPON andAE are small (<5%), but OPEX/sub is a big differentiator. GPON provides OPEX savings from 5-58% with higher savings for increasing take-rates.
• In areas where no DSLAMs are deployed, GPON is expected to be more cost effective ingeneral because of the additional cost of buildingthe OSP cabinets for AE and significant OPEXsavings from a passive outside plant.
Case Study 3: (GPON vs. EPON) EPON provides a lower start-up cost, but requires
significant investment in future years as demonstratedfor all cases. A savings of 17% over EPON was obtain-ed for the urban SFR model, 19% for MDU and 30% forthe Enterprise model. Sensitivity analysis indicated thatthe two key parameters impacting the economics are:
– GPON/EPON ONT and ONU cost ratios,– end year subscriber bandwidth.
Acknowledgments
The authors would like to acknowledge their colleaguesFabien Pinaud and Chen Jing for their contributions
towards the case studies discussed in this paper.
Authors
SAMRAT KULKARNI is a Member of Technical Staffin the Bell Labs Network Planning, Performance andEconomic Analysis Group with Alcatel-Lucent Techno-logies, based in Murray Hill, NJ. He has over 6 yearsof experience in optical transport network modelingand optimization of access and metro networks, spe-cifically in the areas of FTTx transport technologieslike GPON/EPON, xDSL, Active/P2P Ethernet and next-generation SONET/SDH, Ethernet-over-fiber and DWDMtechnologies. He has consulted extensively with ser-vice providers performing network and business mo-deling activities for operators all around the worldwhich includes, providing optimized network designs,product configurations, cost modeling and systemsengineering. His work has also been published injournals like the Bell Labs Technical Journal, and con-ferences such as OFC/NFOEC. He holds a Masters ofScience (MS) in electrical engineering from PurdueUniversity (2001) and also serves as a chair on thelocal IEEE NJ coast Light Wave systems chapter.
MOHAMED EL-SAYED is the manager of the AdvancedNetwork Modeling & Optimization group at Bell LabsResearch, Alcatel-Lucent, in Murray Hill, New Jersey,USA. He has over 25 years of experience in the areaof Telecommunications R&D. He started his career inBell Labs in the early eighties where he was involvedin the architecture and design of packet switchingsystems and networks. He has subsequently contri-buted to many areas in data communication includ-ing TCP/IP, Satellite Communication, Virtual PrivateNetworks, MPLS, VoIP etc. He took on responsibilitiesin a variety of leadership roles in Research, NetworkArchitecture, Systems Engineering, Network Design& Optimization as well as Network Performance. Dr.El-Sayed’s current interests include architecture anddesign of 3G & 4G Wireless networks, IP MultimediaSubsystem (IMS) and Applications, FTTH, IntelligentOptical Networks, IPTV and Next Gen Transport net-works based on Carrier-Grade Ethernet/VPLS andMPLS. He has consulted with executives of many Ser-vice Providers in North America, Europe, Asia and theMiddle East helping them with a variety of questionsrelated to network evolution, technology introductionand network design and optimization. He has publish-ed many papers in professional journals and confe-rences and was a recipient of many Bell Labs, Alca-tel-Lucent and AT&T awards. Dr. El-Sayed holds aPh.D. in Systems Engineering in addition to a B.Sc.and an M. Sc. in Electrical Engineering.

INFOCOMMUNICATIONS JOURNAL
10 VOLUME LXV. • 2010/II
PAUL GAGEN is the Director of Network Design, Ope-rations, and Methods in Bell Labs. He is responsiblefor developing advanced network designs/tools/met-hods applied to a multi-technology, global array ofcustomers’ network projects. These include advan-ced optical, data, broadband, video, and wireless net-works. End-to-end digital video operations and QoSmetrics are among the current investigation topics.Paul has a background in applied research; opticalfiber communications; broadband access includingHFC; product and manufacturing process develop-ment including the Manufacturing Leadership Prog-ram; technical sales for network deployments as theBell Labs Senior Field Rep; and holds twelve patents.He holds a BS and MS degrees in Engineering summacum laude from The Cooper Union and New York Univer-sity respectively, and is an alumnus of the HarvardGraduate School of Business – Program for Manage-ment Development. Paul is located in Holmdel, NJ andis a recent winner of Lucent awards including the BellLabs President’s Gold Award, and Teamwork Awards.
BETH POLONSKY is a member of the Network Ope-rations Planning team with expertise in OperationalModeling, Analysis, and Solution Design. In her cur-rent assignment, she has provided operational ana-lysis for new wireless technologies, converged net-work architectures, and FTTH alternatives. This ana-lysis has supported the proving in of technology forcustomers in the telecom and cable industries. Sheis also responsible for NGN IP network transforma-tion process design and implementation to facilitatesuccessful customer network migration. Over the last
decade, Beth has been involved with many aspectsof network operations software including system ar-chitecture, design, systems engineering and custo-mer support. She has worked on site with severallarge North American Telcos to design and custom-ize OSS solutions to meet their specific needs. In ad-dition, Beth has lab experience integrating OSS sys-tem with various network configurations to prove in-teroperability and feature functionality in support ofcustomer deployments. Beth has a BS degree in Elect-rical Engineering from the University of Connecticutand an MS in Computer Science from the University ofVirginia.
References
[1] FTTH Worldwide Technology Update & Market Forecastby Heavy Reading, Feb 2008.
[2] ITU-T Recommendation G.984.[3] IEEE 802.3ah Ethernet in the First Mile standard.[4] M.K. Weldon and F. X. Zane,
“The Economics of Fiber to the Home Revisited,” Bell Labs Tech. Journal 8:1, pp.181–206, (2003).
Call for PapersProspective authors are invited to submit original research papers for publication
in the upcoming issues of our Infocommunications Journal.
Topics of interests include the following areas:
Data and network security • Digital broadcastingInfocommunication services • Internet technologies and applications
Media informatics • Multimedia systems • Optical communicationsSociety-related issues • Space communications
Telecommunication software • Telecommunications economy and regulationTestbeds and research infrastructures • Wireless and mobile communications
Theoretical and experimentation research results achieved within the framework of European ICT projects are particularly welcome.
From time to time we publish special issues and feature topics so please follow the announcements. Proposals for new special issues and feature topics are welcome.
Our journal is currently published quarterly and the editors try to keep the review and decision process asshort as possible to ensure a timely publication of the paper, if accepted.
As for manuscript preparation and submission, please follow the guidelines published on our website:http://www.hiradastechnika.hu/for_our_authors
Authors are requested to send their manuscripts via electronic mail (preferably)or on a CD by regular mail to the Editor-in-Chief:
Csaba A. SzabóDept. of Telecommunications, Budapest University of Technology and Economics
2 Magyar Tudósok krt., Budapest 1117, HungaryE-mail: [email protected]