fuel cells and hydrogen joint undertaking (fch ju) - trust ... (id... · hydrogen refuelling...
TRANSCRIPT
Knowledge Management Data collection March 2018 Page 1
Fuel cells and Hydrogen Joint Undertaking (FCH JU) - TRUST data collection
Contents
1. Introduction .................................................................................................................................. 2
2. Data collection .............................................................................................................................. 3
Data collection input period .................................................................................................... 3
Reference period ..................................................................................................................... 3
Templates................................................................................................................................. 3
Data providers .......................................................................................................................... 4
Input method ........................................................................................................................... 4
Confidentiality .......................................................................................................................... 4
Data aggregation ...................................................................................................................... 5
3. Data utilisation .............................................................................................................................. 5
Data validation (authorisation) ................................................................................................ 5
Data rejection .......................................................................................................................... 5
Data exploitation...................................................................................................................... 5
Data disclosure ......................................................................................................................... 6
Annex 1: Aggregation level for the items concerned by the various parameter templates ................... 7
Annex 2: Parameter templates ............................................................................................................... 8
Electrolyser – research at stack level or lower ........................................................................ 8
Electrolyser – research at system level .................................................................................... 9
Electrolyser demonstration ................................................................................................... 10
Co-electrolysis - research at stack level or lower .................................................................. 11
Hydrogen production research .............................................................................................. 12
Hydrogen production demonstration .................................................................................... 13
Hydrogen refuelling station research .................................................................................... 14
Hydrogen refuelling station demonstration .......................................................................... 15
Fuel cells – research at stack level or lower........................................................................... 16
Fuel cells – research at system level ...................................................................................... 17
Fuel cell car demonstration ................................................................................................... 18
Fuel cell /plug-in car demonstration ...................................................................................... 19
Fuel cell bus demonstration ................................................................................................... 20
Fuel cell material handling vehicle demonstration ................................................................ 21
Auxiliary power unit demonstration ...................................................................................... 22

Knowledge Management Data collection March 2018 Page 2
Onboard storage tank for compressed gaseous hydrogen .................................................... 23
Stationary, m-CHP .................................................................................................................. 24
Stationary General ................................................................................................................. 25
Fuel cell stack manufacturing ................................................................................................ 26
Diagnostics – electrolysis ....................................................................................................... 27
Diagnostics - fuel cells ............................................................................................................ 28
Pre-Normative Research ........................................................................................................ 29
Education ............................................................................................................................... 30
Purification ............................................................................................................................. 31
1. Introduction The FCH JU finances research and innovation projects aiming at ultimately bringing fuel cells and
hydrogen technologies to market readiness level. To this end, it publishes calls for proposals,
manages proposal evaluations and finally monitors project implementation.
In view of assessing the effectiveness of its research programme and the needs for further
technological developments (to be translated into new calls for proposals), the FCH JU has been
mandated to collect data on the concerned technologies in a systematic and uniform way.
This need was identified early after the set-up of the FCH JU and follows the explicit request of
the FCH JU governing board, reflecting the will of all 3 members of the FCH JU: the European
Commission, Hydrogen Europe, representing the industrial stakeholders and N.ERGHY,
representing the research community.
The data collection is intended to yield comparable data from various projects by
unambiguously setting the relevant
parameters
units
validity date (annual granularity)
Data collection is to be performed, as from 2017, through the TRUST (Technology Reporting
Using Structured Templates) collection platform.
Projects have a contractual obligation to comply with the submission of the requested data
according to article II.10 of FP7 grant agreements (from calls 2008 to 2013) and to dedicated
project deliverables1 for Horizon 2020 projects (from call 2014 onwards).
The expected outcome is a coherent and comprehensive vision of the fuel cells and hydrogen
sector which is critical for its further development and visibility and for fostering political and
financial support
1 Typically labelled “Annual data reporting” deliverables

Knowledge Management Data collection March 2018 Page 3
2. Data collection
Data collection input period The data collection system is intended to be open for data input by the projects for at least 1
months each year, typically in the March-June period. For 2018, the foreseen input timeframe
should be from May to mid-June.
Reference period Data collection should concern project data referring to the calendar year (reference year)
preceding the collection exercise, i.e. for the 2018 data collection exercise, data should be
reported concerning the period from 01/01/2017 to 31/12/2017 (the reference year is 2017).
For projects (a) started or (b) ended in the year preceding the data collection exercise, the
reference period for which data are expected is:
a) Project start date to 31/12 of the previous year
b) 01/01 of the previous year to project end date
Templates Data are to be collected through template questionnaires tailored to the various technologies
and their readiness level, to be answered annually by the funded projects: each project is to be
divided into one or more “research object” defining a specific reporting item within the project
scope. Each of these research objects will be associated to a specific template questionnaire.
The existing template questionnaires are listed below:
Electrolyser – research at stack level or lower
Electrolyser – research at system level
Electrolyser demonstration
Co-electrolysis research at stack or lower
Hydrogen production research
Hydrogen production demonstration
Hydrogen refuelling station research
Hydrogen refuelling station demonstration
Fuel cells – research at stack level or lower
Fuel cells – research at system level
Fuel cell car demonstration
Fuel cell /plug-in car demonstration
Fuel cell bus demonstration
Fuel cell material handling vehicle demonstration
Auxiliary power unit demonstration
On-board storage for compressed gaseous hydrogen
Stationary, µ-CHP
Stationary, non µ-CHP
Fuel cell stack manufacturing
Diagnostics – electrolysis
Diagnostics - fuel cells
Pre-Normative Research
Education

Knowledge Management Data collection March 2018 Page 4
The template questionnaire within the research object is divided into descriptive and
operational parameters.
Descriptive parameters define the item addressed in the questionnaire and allow to set the
scene for which actual results are reported as operational parameters. In principle, descriptive
parameters do not change during the project lifetime, while operational parameters evolve and
will be different from one annual data collection exercise to the next according to progress in
the reference period.
The parameters have been defined in view of allowing a comprehensive overview of the
technology status and include the Key Performance Indicators (KPIs) defined in the FCH JU
Multi-Annual Work Plan (MAWP) addendum.
The parameters requested in each template are listed in Annex 2.
Each project is expected to provide, to the best of its capabilities, a value for every parameter
requested. For each parameter, there is also the possibility (optional) to add a comment if it is
relevant to give additional information.
The filled questionnaire can only be submitted if, for every single parameter, a value or a
comment is provided. This offers the possibility of leaving a parameter unanswered in the case
that there is an impossibility to provide a value, for instance because the parameter is not
relevant to the project or has not yet been obtained. In such cases, the reason should be given
in the comment field.
In general, it will not be acceptable that parameters that are either MAWP KPIs or specified in
the “expected impact” section of the call for proposals to which the project has successfully
applied are marked as irrelevant to the project itself.
Data providers The person with access to the online system is hereby referred to as “data provider”.
If needed, several data providers can be assigned to a same research object .
Please note that the data providers are assigned specifically for each research object, so
different research objects from the same project may have different data providers.
As default, the project coordinator will be assigned as data provider. Changes or additions in
data provider can be requested to [email protected]
Input method The data will be collected online, through a secured connection, in a programme called TRUST.
For each research object, the data provider has the possibility (optional) to enter a generic
comment, e.g. specifying information relevant to the whole set of data concerned, in addition to
the values and comments for the individual parameter.
Confidentiality Each individual parameter in the template questionnaires can be defined by the data provider as
either public or confidential.
Public data will be treated as such and the FCH JU will consider that it can disclose them
accordingly.
Knowledge Management Data collection March 2018 Page 5
Confidential data will be treated with extreme care, avoiding that any related information is
made public in any form that could lead to the identification of its origin. Confidential data will
be visible exclusively by the FCH JU Programme Office.
From 2018, parameters labeled with the prefix 'KPI' (Key Performance Indicator) will be
considered by default public unless justification is provided by the data-provider for the
necessity to keep the data confidential. These data will be used by the FCH JU only for the purpose
of the Annual Programme Review.
More information on data treatment is provided in the section 3.
Data aggregation Research objects in TRUST refer either to single items or a group of equivalent items. This is
defined individually for each project according to its nature, its description of work and the type
of questionnaire concerned. For instance, reporting is expected individually for single hydrogen
refuelling stations, electrolysers or large-scale CHP units, while aggregated data would be
sufficient for a fleet of same vehicles or small CHP units deployed in a given region. An intended
“rule of thumb” on aggregation levels expected according to the template questionnaires is
provided in Annex 1.
3. Data utilisation As already mentioned above, data provided in TRUST will be collected and treated by the FCH JU
Programme Office only.
No raw data will be disclosed publicly unless they are provided as “public”.
Data validation (authorisation) In a first phase after data submission, the data will be validated by the relevant Project Officers
which will authorise or reject the entire form. In this step, the values will be verified in terms of
whether they are realistic, whether there is no clerical mistake (order of magnitude, units,….)
and whether the “confidential” label (if applicable) is justified. The Project Officer will also verify
(and accept/reject) the justifications given for not providing certain parameters.
Data rejection In the case that a research object form is rejected, the data provider will be informed (through
an email notification) with an explanation of the reasons for rejection. The data provider will be
thus asked to revise the value / comment and resubmit the form.
Cost claims related to tasks that would lead to forms that have been rejected may be suspended
until an agreement is found between the FCH JU and the project consortium.
Data exploitation The FCH JU Programme Office will analyse the data obtained to form a view on technology
status.
In comparison with public values obtained through continued technology watch and
international state of the art values, it also aims at assessing the positioning of FCH JU projects
in the global picture.
In time, through comparison of data obtained for different periods, the achievements of the FCH
JU will also be traced in terms of technology progress yielded through the projects financed.

Knowledge Management Data collection March 2018 Page 6
Data disclosure The FCH JU Programme Office is often assisting its members in defining the state of the art or
providing information on project progress.
As is custom already with deliverables and reports, only public data will be disclosed in this
context, unless aggregation of several comparable data is possible to provide anonymised and
unrecognisable output.

Knowledge Management Data collection March 2018 Page 7
Annex 1: Aggregation level for the items concerned by the various
parameter templates The information given below is indicative. The aggregation is always done individually according to
the exact nature of the project and its description of work
Electrolyser – research at stack level or lower: one research object per project
Electrolyser – research at system level: one research object per system
Electrolyser demonstration: one research object per unit
Co-electrolysis: one research object per project
Hydrogen production research: one research object per project
Hydrogen production demonstration: one research object per unit
Co-electrolyser stack or lower: one research object per project
Hydrogen refuelling station research: one research object per project
Hydrogen refuelling station demonstration: one research object per station
Fuel cells – research at stack level or lower: one research object per project or per
stack technology
Fuel cells – research at system level: one research object per system or per
system technology
Fuel cell car demonstration: one research objects for aggregated data per vehicle
model/location (typically this involves several vehicles within a single research object)
Fuel cell /plug-in car demonstration: one research objects for aggregated data per
vehicle model/location (typically this involves several vehicles within a single research
object)
Fuel cell bus demonstration: one research objects for aggregated data per vehicle
model/location (typically this involves several vehicles within a single research object)
Fuel cell material handling vehicle demonstration: one research objects for
aggregated data per vehicle model/location (typically this involves several vehicles
within a single research object)
Auxiliary power unit demonstration: one research object per unit
Onboard storage for compressed gaseous hydrogen: one research object per unit
Stationary, µ-CHP: one research objects for aggregated data per CHP unit
model/location
Stationary, non µ-CHP: one research object per unit
Fuel cell stack manufacturing: one research object per project
Diagnostics – electrolysis: one research object per project
Diagnostics - fuel cells: one research object per project
Pre-Normative Research: one research object per project
Education: one research object per training course
Purification – Under development

Knowledge Management Data collection March 2018 Page 8
Annex 2: Parameter templates The exact parameters, as well as to their exact name and order may vary.
Electrolyser – research at stack level or lower
Descriptive
Technology
Active cell area
Operating temperature
Rated stack durability
Operating pressure
Hydrogen purity
Nominal hydrogen weight capacity
Input voltage
Stack nominal capacity
Rated stack electrical efficiency (HHV, DC
current)
Number of cells in each stack
KPI - Catalyst at the cathode
KPI - Catalyst at the anode
KPI - Stack CAPEX (per kW)
KPI - Est. stack CAPEX (per kW) @
100MW annual production
KPI - Reversible capacity of the Electolyser
(Specific System)
ASR - Active Specific Resistance
Operational
Start date for reporting
End date for reporting
Hours of operation
Hours of operation - cumulative
Quantity of hydrogen produced
Electricity consumed
KPI - Stack electricity consumption for H2
production
Stack Thermal Energy Consumption
Power density
KPI - Current density
Stack availability
Operating time per day
KPI - Cold start ramp time
KPI - Hot idle ramp time
Cell voltage
Transient response time
Stack electrical efficiency (HHV, DC
current)
KPI - Production loss rate for HT
Electolyser
Voltage degradation rate in %/kh
KPI - Efficiency degradation per 1000 h for
LT Electrolyser
KPI- Cathode catalyst loading per W
Cathode catalyst loading per H2 capacity
Anode catalyst loading per H2 capacity
KPI - Anode catalyst loading per W
KPI - Reversible efficiency of the
Electrolyser (Specific System)
Degradation - ASR

Knowledge Management Data collection March 2018 Page 9
Electrolyser – research at system level
Descriptive
Technology
System nominal capacity
Stack nominal capacity
System manufacturer
Stack manufacturer
Stack Thermal Energy Consumption
Rated system lifetime
Rated system electrical efficiency (HHV,
AC current)
Rated stack durability
Rated stack electrical efficiency (HHV, DC
current)
Power usage of auxiliary equipment at
nominal capacity
Power usage of auxiliary equipment - in
standby
Power converter
Operating temperature
Operating pressure
Number of stacks in each stack array
Number of stack arrays
Number of cells in each stack
Nominal hydrogen weight capacity
Nominal hydrogen volume capacity
Maximum overload capacity
Input voltage
Hydrogen purity
System minimum power
Active cell area
KPI - System CAPEX
BoP CAPEX
KPI- Estimated CAPEX of electrolyser @
100MW annual production scale
KPI - Catalyst at the cathode
KPI - Catalyst at the anode
KPI - Reversible capacity of the Electolyser
(Specific System)
Operational
Start date for reporting
End date for reporting
Days of operation
Hours of operation
Stack electrical efficiency (HHV, DC
current)
System electrical efficiency (HHV, AC
current)
KPI - Stack electricity consumption
Maximum overload operation
System energy consumption for H2
compression
Cell voltage
KPI - Current density
System availability
Hours of operation - cumulative
Electricity consumed
KPI - Hot idle ramp time
KPI - Cold start ramp time
Transient response time
Operating profile
Minimum part-load operation observed
Quantity of hydrogen produced
KPI - Production loss rate for HT
Electolyser
KPI - Efficiency degradation per 1000 h for
LT Electrolyser
KPI - Reversible efficiency of the
Electrolyser (Specific System)
Stack availability
KPI - Cathode catalyst loading per W
Cathode catalyst loading per H2 capacity
KPI-Anode catalyst loading per W
Anode catalyst loading per H2 capacity
Power density

Knowledge Management Data collection March 2018 Page 10
Electrolyser demonstration
Descriptive
Country
Town
Postcode
Deployment date
Technology
Electricity origin
Electrolyser manufacturer
Stack manufacturer
KPI - Electrolyser Footprint
Electrolyser price
System minimum power
Stack nominal capacity
Electrolyser Volume
Hydrogen purity
Input voltage
Maximum overload capacity
Nominal hydrogen weight capacity
Nominal power
Operating pressure
Operating temperature
Power converter
Power usage of auxiliary equipment at
nominal capacity
Power usage of auxiliary equipment - in
standby
Rated stack electrical efficiency (HHV, DC
current)
Rated stack durability
Rated system lifetime
Rated system electrical efficiency (HHV,
AC current)
KPI- Estimated CAPEX of electrolyser @
100MW annual production scale
KPI- CAPEX electrolyser
KPI- OPEX @ 10 years
KPI - Catalyst at the cathode
KPI - Catalyst at the anode
KPI - Reversible capacity of the Electolyser
(Specific System)
Operational
Days of operation
Start date for reporting
End date for reporting
Days of operation - cumulative
Cost of the hydrogen produced
Voltage degradation rate in %/kh
Price/cost of electricity
KPI - Availability
Duration of planned maintenance
KPI-Efficiency degradation per 1000 h for
LT electrolysers
KPI-Estimated Efficiency degradation per
1000 h @ 10 year lifespan for LT
electolysers
Energy consumption for H2 compression
KPI- Electricity consumption @ nominal
capacity
Electricity consumed
Fraction of renewable energy input
Hours of operation
Hours of operation - cumulative
Maximum overload operation
Maximum % power for 98% efficiency
Number of safety incidents
Minimum part-load operation
Stack electrical efficiency (HHV, DC
current)
System electrical efficiency (HHV, AC
current)
KPI- OPEX
Thermal Energy Consumption @ nominal
capacity
Transient response time
Quantity of hydrogen produced
KPI - Hot idle ramp time
KPI - Cold start ramp time
KPI - Production loss rate for HT
Electolyser
KPI - Current Density
KPI-Cathode catalyst loading per W
KPI - Anode catalyst loading per W
KPI - Reversible efficiency of the
Electrolyser (Specific System)
KPI - Production loss rate for HT
Electolyser @ 10 year lifespan

Knowledge Management Data collection March 2018 Page 11
Co-electrolysis - research at stack
level or lower Descriptive
Technology for co-electrolysis
Number of cells in each stack
Stack nominal power capacity
Stack lifetime, rated
Input Voltage
KPI - Stack electrical efficiency (rated -
HHV - DC current) - H2
KPI - Stack electrical efficiency (rated -
HHV - DC current) - Syngas
Active Cell Area
KPI - Material at the cathode
KPI - Material at the anode
KPI - co-Electrolysis: Operating pressure
KPI - Capital cost of the stack (per kW)
Estimated capital cost of the stack (per kW)
@ 100MW production
Operating temperature
Methanation process
Methanation catalyst
Design pressure for the methanation step
Design overall process efficiency
Design temperature for the methanation
step
Operational
Start date for reporting
End date for reporting
CO2 source
co-Electrolysis: Hours of operation
co-Electrolysis: Hours of operation -
cumulative
KPI - co-Electrolysis: Quantity of hydrogen
produced
KPI - co-Electrolysis: Quantity of syngas
produced
Stack availability
co-Electrolysis: Electricity consumed
KPI - Stack electrical efficiency (observed -
HHV - DC current)
KPI - Stack: current density
Stack: power density
Stack: initial cell voltage
KPI - Area Specific Resistance
KPI - Degradation - ASR
KPI - Stack: electrical efficiency
degradation per 1000 h
Capital cost of the stack (per kW) @ 100
MW
Methanation yield
Methanation temperature, experimental
Methanation pressure, experimental
Amount of methane produced
KPI - Overall efficiency

Knowledge Management Data collection March 2018 Page 12
Hydrogen production research
Descriptive
Hydrogen production method
Process description
Hydrogen feedstock
Main energy source
Secondary energy input/parasitic losses
Catalyst(s)
Hydrogen purification method
Nominal hydrogen weight capacity
Nominal hydrogen volume capacity
KPI - System carbon yield
KPI - Rated system lifetime
KPI - Est. System CAPEX per kg/day @
mass production
Operational Start date for reporting
End date for reporting
TRL @ start of timeframe
TRL @ end of timeframe
Hours of operation
Hours of operation - cumulative
Catalyst durability, observed
Hot idle ramp time
Cold start ramp time
Operating pressure
Operating temperature
Min. part-load operation, observed
Quantity of hydrogen produced
Conversion efficiency @ start of timeframe
KPI - Efficiency degradation rate
Number of catalyst replacements
H2 purity before purification
Purity of the produced hydrogen after
purification
Number of safety incidents
Est. cost of the hydrogen produced
KPI - System energy use for H2 production
KPI - Reactor Scale
KPI - Reactor production rate

Knowledge Management Data collection March 2018 Page 13
Hydrogen production demonstration
Descriptive
Country
Town
Postcode
Hydrogen production method
Description of the production unit
Manufacturer
Target application
Hydrogen feedstock
Main energy source
Secondary energy input/parasitic losses
Operating pressure
Operating temperature
Deployment date
Catalyst(s)
Hydrogen purification method
Footprint
Volume
Nominal hydrogen weight capacity
Nominal hydrogen volume capacity
KPI - Rated system lifetime
Hydrogen purity
Conversion efficiency @ start of operations
TRL @start of operations
KPI - System CAPEX per kg/day
KPI - Est. System CAPEX per kg/day @
mass production
KPI - System carbon yield
Operational
Start date for reporting
End date for reporting
Hours of operation
Hours of operation - cumulative
Days of operation
Days of operation - cumulative
Operating time per day
Hot idle ramp time
Cold start ramp time
Min. part-load operation, observed
Quantity of hydrogen produced
KPI - Availability
Conversion efficiency @ start of timeframe
Conversion efficiency @ end of timeframe
KPI - Efficiency degradation rate
H2 purity before purification
H2 purity after purification
KPI - System energy use for H2 production
System energy use for H2 compression
Number of safety incidents
TRL @ end of timeframe
Cost of the hydrogen produced
KPI - OPEX
KPI - Reactor production rate
KPI - Reactor Scale

Knowledge Management Data collection March 2018 Page 14
Hydrogen refuelling station research
Descriptive
Hourly capacity
Daily capacity
Number of cars per hour
Number of cars per day
Number of buses per hour
Number of buses per day
Component(s) addressed
Refuelling protocol
Hydrogen supply logistics
On-site H2 production method
Onsite H2 production rate
Renewable feed
Fraction of renewable feed
Storage capacity
State of H2 in storage tank
Nominal pressure of the on-site storage
tank
Noise - compressor
State of the hydrogen at dispensing
Dispensing pressure
CAPEX for the component(s)
CAPEX for the component(s), est. @ mass
prod.
KPI - CAPEX for the HRS
KPI - Est. HRS CAPEX @ mass production
KPI - Lifetime
KPI - Durability
Operational
Start date for reporting
End date for reporting
Station TRL
Vehicles refuelled
Days of operation
Hours of operation
Hours of operation - cumulative
Amount of hydrogen dispensed
Number of H2 refuellings
KPI - Availability - in period
KPI - Mean time between failures (MTBF)
Metering accuracy
System energy consumption for H2
compression
TRL - components
KPI - Cost of hydrogen
Number of safety incidents
KPI -System Energy consumption

Knowledge Management Data collection March 2018 Page 15
Hydrogen refuelling station
demonstration
Descriptive
Country
Town
Postcode
Location type
Station setting
Type of access
HRS manufacturer
Operator
Deployment date
Number of dispensers
Number of nozzles
Storage capacity
Dispensing pressure
Hourly capacity
Daily capacity
Refuelling protocol
Number of cars per hour
Number of cars per day
Number of buses per hour
Number of buses per day
Hydrogen supply logistics
On-site H2 production method
On-site H2 production rate
Renewable feed
Fraction of renewable feed
KPI - CAPEX for the HRS
Price of the HRS
KPI - Lifetime
KPI - Durability
Operational
Start date for reporting
End date for reporting
Vehicles refuelled
Days of operation
Hours of operation
Distance from the H2 production
KPI - Amount of H2 dispensed
KPI - Number of H2 refuellings
Metering accuracy
KPI Availability, in period
KPI - Availability, since start
KPI - Mean time between failures (MTBF)
Downtime, overall
Downtime for scheduled
maintenance/upgrades
Downtime due to the compressor/pump
Downtime due to the hydrogen storage
facility
Downtime due to the refuelling dispensers
Downtime due to electrical components
Downtime due to software issues
Downtime due to the hydrogen supply
Downtime due to other reasons
Number of safety incidents
KPI - Annual maintenance cost
KPI - Cost of renewable hydrogen
Price of hydrogen
KPI - Energy consumption
KPI - Labour
KPI - Cost of hydrogen
KPI - Labour costs

Knowledge Management Data collection March 2018 Page 16
Fuel cells – research at stack level or
lower
Descriptive
Stack manufacturer
Fuel cell technology
Fuel
Number of cells per stack
Capacity of the stack - rated
KPI - Stack durability rated
Purity required for the fuel
Catalyst at the cathode
Catalyst at the anode
Active cell area
KPI - Rated stack electrical efficiency
(LHV)
KPI - Rated stack total efficiency (LHV)
KPI - Stack CAPEX (per kW)
KPI - Est. stack CAPEX (per kW) @ mass
production
Operational
Start date for reporting
End date for reporting
Hours of operation
Hours of operation - cumulative
Operating time per day
Transient response time
Time for cold start to rated power (from
+20°C)
Time for cold start to rated power (from -
20°C)
Operating pressure
Operating temperature
Minimum ambient temperature
Maximum ambient temperature
KPI - Stack availability
Fuel utilisation rate
Electricity produced - Total
KPI - Stack electrical efficiency (LHV) -
observed
KPI - Stack total efficiency (LHV) -
observed
Current density
KPI - Areal power density
Cell voltage
KPI - Degradation rate in %/kh
KPI - PGM catalyst loading - Anode (in
mg/cm2)
KPI - PGM catalyst loading - Anode (in
g/kW)
KPI - PGM catalyst loading - Cathode (in
mg/cm2)
KPI - PGM catalyst loading - Cathode (in
g/kW)
KPI - Stack Durability
KPI - Cell Volumetric power density
Knowledge Management Data collection March 2018 Page 17
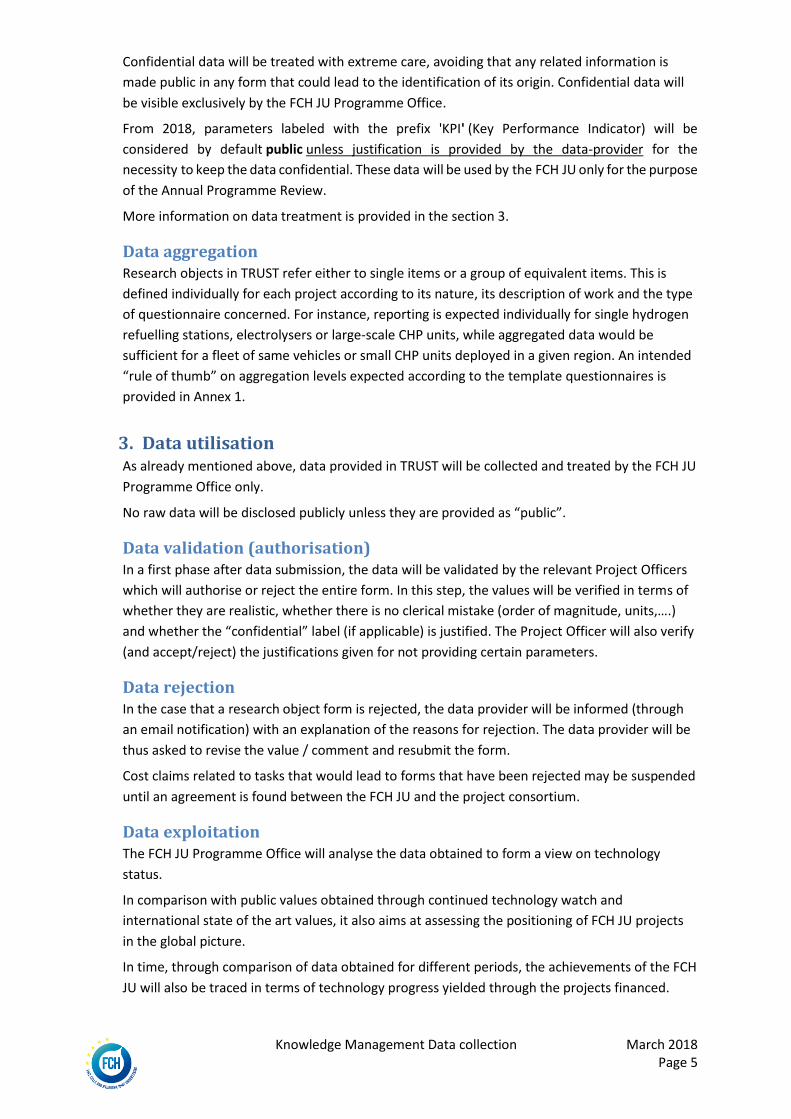
Fuel cells – research at system level
Descriptive
System manufacturer
Stack manufacturer
Fuel cell technology
BoP component of interest
Fuel
Does the FC system include a reformer?
Number of stacks per system
Number of cells per stack
Rated capacity of the FC system
KPI - Rated FC system durability
KPI - Rated stack durability
Purity required for the fuel
Catalyst at the cathode
Catalyst at the anode
Active cell area
Rated system electrical efficiency (LHV)
Rated system total efficiency (LHV)
Rated stack electrical efficiency (LHV)
Rated stack total efficiency (LHV)
KPI - FC system CAPEX
KPI - Est. FC system CAPEX @ mass
production
KPI - Stack CAPEX (per kW)
Est. stack CAPEX (per kW) @ mass
production
KPI - BoP CAPEX
KPI - BoP CAPEX @ mass production
Operational
Start date for reporting
End date for reporting
Fuel utilisation rate
Electricity produced - Total
Useful heat output
System electrical efficiency (LHV) -
observed
System total efficiency (LHV) - observed
Stack electrical efficiency (LHV) - observed
Stack total efficiency (LHV) - observed
Current density
KPI - Areal power density
Cell voltage
KPI - Stack availability
KPI - Cell Volumetric power density
Hours of operation
Hours of operation - cumulative
Operating time per day
Operating pressure
Operating temperature
Minimum ambient temperature
Maximum ambient temperature
KPI - Degradation rate in %/kh
KPI - System availability
KPI - Stack durability
Transient response time
Time for cold start to rated power (from -
20°C)
Time for cold start to rated power (from
+20°C)
KPI - PGM catalyst loading - Cathode (in
mg/cm2)
KPI - PGM catalyst loading - Cathode (in
g/kW)
KPI - PGM catalyst loading - Anode (in
mg/cm2)
KPI - PGM catalyst loading - Anode (in
g/kW)
Knowledge Management Data collection March 2018 Page 18
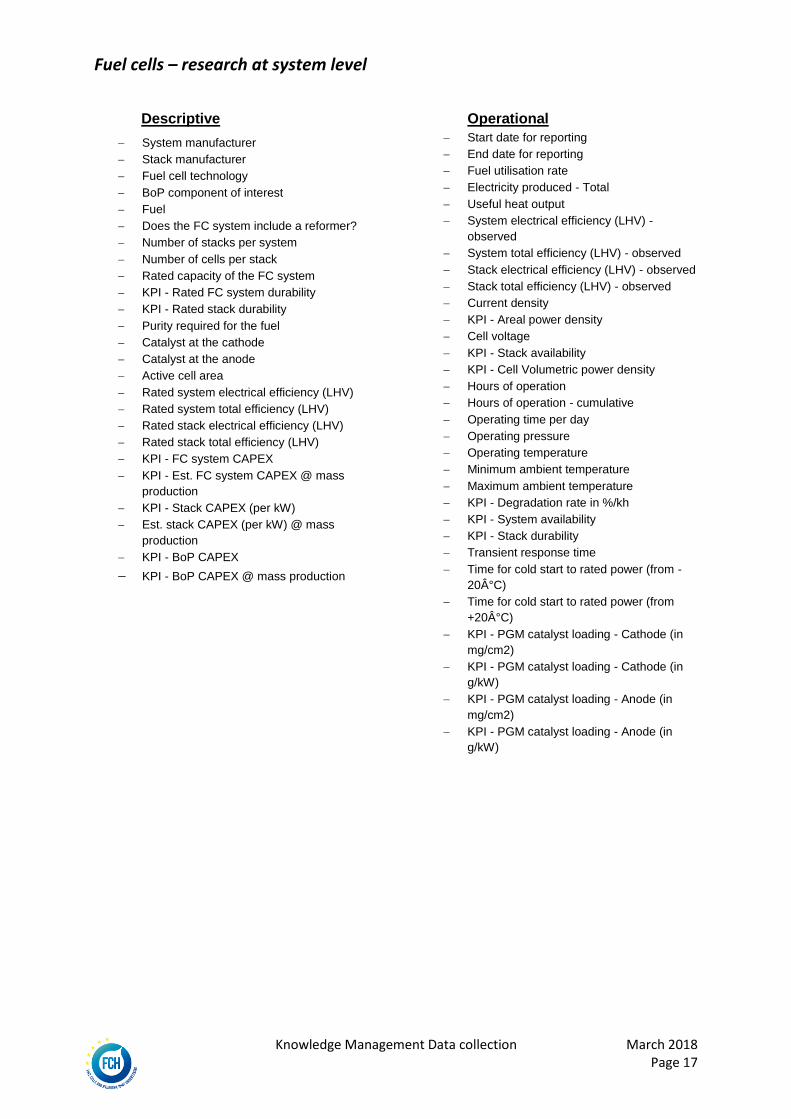
Fuel cell car demonstration
Descriptive
Country
Town or region
Deployment date
Vehicle manufacturer
Vehicle model
Vehicle segment
Production year
Drivetrain power
Drivetrain weight
Range (NEDC)
Maximum speed
Weight
Height
Length
Width
Number of seats
Hydrogen storage capacity
Hydrogen tank pressure rating
KPI - TTW consumption NEDC
KPI - FC Durability
Minimum ambient temperature
Maximum ambient temperature
KPI - Estimated Fuel cell system cost
KPI - Vehicle cost
Vehicle price
KPI - Fuel cell system cost
Est. vehicle cost @ mass prod.
Operational
Start date for reporting
End date for reporting
Number of vehicles
Number of vehicles taken out of service
Hours of operation
Hours of operation - cumulative
KPI - Distance driven
KPI - Distance driven, cumulative (project)
KPI - Distance driven, cumulative (overall)
KPI - Amount of hydrogen fed
KPI - Availability
KPI - FC Durability
Downtime, overall
Downtime for scheduled
maintenance/upgrades
Downtime due to stack issues
Downtime due to peripheric mechanical
components
Downtime due to electrical components
Downtime due to the on-board hydrogen
storage tank
Downtime due to the high voltage battery
Number of safety incidents
KPI - Yearly Maintenance Costs
MDBF

Knowledge Management Data collection March 2018 Page 19
Fuel cell /plug-in car demonstration
Descriptive
Country
Town or region
Deployment date
Manufacturer
Model
Vehicle segment
Production year
Drivetrain power
Drivetrain weight
Range
Hydrogen range
Maximum speed
Weight
Height
Length
Width
Number of seats
Hydrogen storage capacity
Hydrogen tank pressure rating
Battery capacity
KPI- FC Durability
Minimum ambient temperature
Maximum ambient temperature
KPI - Fuel cell system cost
Vehicle cost
Vehicle price
KPI - Estimated Fuel cell system cost
KPI - Est. FC system cost @ mass prod.
Operational
Start date for reporting
End date for reporting
Number of vehicles
Number of vehicles taken out of service
Hours of operation
Hours of operation - cumulative
KPI - Distance driven
KPI - Distance driven, cumulative (project)
KPI - Distance driven, cumulative (overall)
KPI - Amount of hydrogen fed
Number of electric recharges
KPI - Amount of electricity fed
KPI - Availability
MDBF
Downtime, overall
Downtime for scheduled
maintenance/upgrades
Downtime due to stack issues
Downtime due to peripheric mechanical
components
Downtime due to electrical components
Downtime due to the on-board hydrogen
storage tank
Downtime due to the high voltage battery
Number of safety incidents
KPI - Yearly Maintenance cost
KPI- FC Durability
Number of H2 refuellings

Knowledge Management Data collection March 2018 Page 20
Fuel cell bus demonstration
Descriptive
Country
Town or region
Deployment date
Bus manufacturer
Bus model
Production year
Bus operator
Drivetrain power
Number of stacks
Drivetrain weight
Maximum speed
Range (SORT 1)
Range (SORT 2)
Weight
Height
Length
Width
Number of seated passengers
Number of standing passengers
Hydrogen storage capacity
Hydrogen tank pressure rating
KPI - TTW consumption SORT 1
KPI - TTW consumption SORT 2
KPI - Bus durability
KPI - Fuel cell system durability
Minimum ambient temperature
Maximum ambient temperature
Vehicle price
KPI - Bus cost
KPI - Fuel cell system cost
KPI - Est. FC system cost @ mass prod.
Est. bus cost @ mass prod.
Operational
Start date for reporting
End date for reporting
Number of buses
Number of buses taken out of service
Hours of operation
Hours of operation - cumulative
KPI - Distance driven
KPI - Distance driven, cumulative (project)
KPI - Distance driven, cumulative (overall)
MDBF
Stack durability
Number of stacks reaching EoL
Distance driven with same stack until EoL
KPI - Amount of hydrogen fed
KPI - Availability
Downtime, overall
Downtime for scheduled
maintenance/upgrades
Downtime due to stack issues
Downtime due to peripheric mechanical
components
Downtime due to electrical components
Downtime due to the on-board hydrogen
storage tank
Downtime due to the high voltage battery
Number of safety incidents
KPI- Yearly maintenance cost
Max Distance driven with same stack until
EoL
Min Distance driven with same stack until
EoL
Knowledge Management Data collection March 2018 Page 21
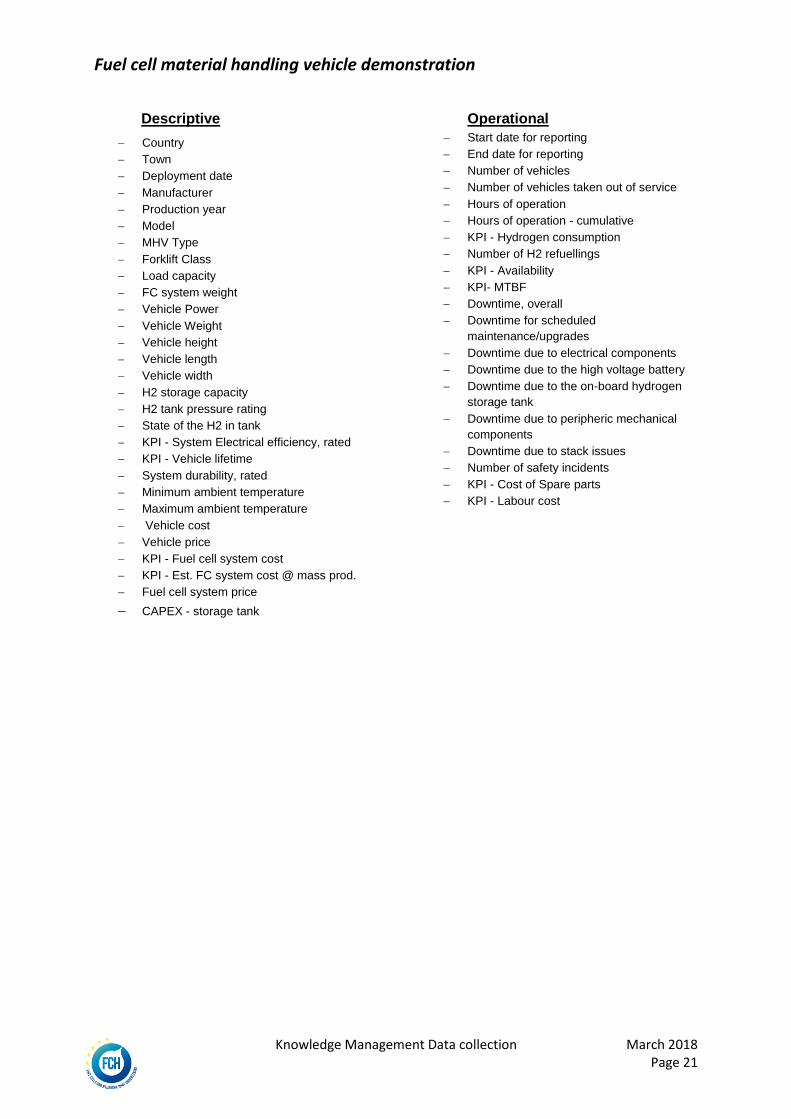
Fuel cell material handling vehicle demonstration
Descriptive
Country
Town
Deployment date
Manufacturer
Production year
Model
MHV Type
Forklift Class
Load capacity
FC system weight
Vehicle Power
Vehicle Weight
Vehicle height
Vehicle length
Vehicle width
H2 storage capacity
H2 tank pressure rating
State of the H2 in tank
KPI - System Electrical efficiency, rated
KPI - Vehicle lifetime
System durability, rated
Minimum ambient temperature
Maximum ambient temperature
Vehicle cost
Vehicle price
KPI - Fuel cell system cost
KPI - Est. FC system cost @ mass prod.
Fuel cell system price
CAPEX - storage tank
Operational
Start date for reporting
End date for reporting
Number of vehicles
Number of vehicles taken out of service
Hours of operation
Hours of operation - cumulative
KPI - Hydrogen consumption
Number of H2 refuellings
KPI - Availability
KPI- MTBF
Downtime, overall
Downtime for scheduled
maintenance/upgrades
Downtime due to electrical components
Downtime due to the high voltage battery
Downtime due to the on-board hydrogen
storage tank
Downtime due to peripheric mechanical
components
Downtime due to stack issues
Number of safety incidents
KPI - Cost of Spare parts
KPI - Labour cost

Knowledge Management Data collection March 2018 Page 22
Auxiliary power unit demonstration
Descriptive
Country
APU Vehicle
APU deployment date
APU unit manufacturer
APU stack manufacturer
Fuel cell technology
APU fuel
APU system power
Stack power
APU Weight
APU Volume
APU Noise
APU operating pressure
APU operating temperature
Minimum ambient temperature
Maximum ambient temperature
KPI - Fuel Cell system durability
Stack durability
KPI - Rated system electrical efficiency
(LHV)
KPI - Rated system total efficiency (LHV)
Rated stack electrical efficiency (LHV)
Rated stack total efficiency (LHV)
KPI - APU CAPEX
Time for break-even, current CAPEX
Time for break-even, projected CAPEX
Est. APU CAPEX @ mass production
Operational
Start date for reporting
End date for reporting
Hours of operation
Hours of operation - cumulative
Average duration of each operation
Time for cold start (-20°C)
Time for cold start (+20°C)
Amount of fuel fed to the APU
KPI - System electrical efficiency (LHV),
observed
KPI - System total efficiency (LHV),
observed
Stack electrical efficiency (LHV), observed
Stack total efficiency (LHV), observed
Total electricity produced
Useful heat output
APU availability
Mean time between failures (MTBF)
CO2 emissions
SOx emissions
NOx emissions
Number of safety incidents
OPEX

Knowledge Management Data collection March 2018 Page 23
Onboard storage tank for compressed gaseous hydrogen
Descriptive
State of H2 in storage tank
Tank type
Storage tank material
Internal lining material
Internal tank volume
External tank volume
Deployment date
Minimum working pressure
Nominal working pressure
Minimum temperature - rated
Maximum temperature - rated
KPI - Tank price
KPI - CAPEX for Storage tank
KPI - Estimated storage tank CAPEX @ mass
production
KPI - Volumetric capacity
KPI - Gravimetric capacity
Operational Start date for reporting
End date for reporting
Proven durability of the storage tank
KPI - Est. lifetime of storage tank
Number of cycles
Type of cycle applied
Peak hydrogen charging rate
Type of cycle applied

Knowledge Management Data collection March 2018 Page 24
Stationary, m-CHP
Descriptive
Country
Deployment date
Manufacturer
Model
Stage of development
Certification
Stack manufacturer
Technology
Fuel cell module (sub)components
Other sub-systems offered in the m-CHP unit
Rated electrical capacity of the FC module
Rated thermal capacity of the FC module
KPI - Fuel Cell Volume
Stack operating temperature
Start-up time
Transient response time
Part load operation electrical efficiency - 30%
Part load operation electrical efficiency - 50%
KPI - Lifetime of the m-CHP unit
KPI - stack durability
KPI - Reliability
Rated electrical efficiency (LHV) of the FC
module
Rated thermal efficiency (LHV) of the FC module
CO emissions at rated conditionsNOx emissions
at rated conditions
SOx emissions at rated conditions
Sound power level at rated condition
KPI - Hydrogen tolerance
KPI - CAPEX
Installation costs
Estimated Cost of spare parts
Est. CAPEX @ mass production
Operating profile
Operational
Start date for reporting
End date for reporting
Number of m-CHP units
deployed
Fuel
Hours of operation
Hours of operation -
cumulative
Days of operation
Fuel cell module max.
cumulative hours of
operation
Operating profile
Electricity produced
Useful heat output
Energy content of natural
gas consumed
KPI - Availability
Best availability
Fuel cell module max.
cumulative hours of
operation
Number of safety incidents
KPI - Operational and
maintenance costs (OPEX)
KPI - Number of stack
replacements

Knowledge Management Data collection March 2018 Page 25
Stationary General
Descriptive
Country
Town or region
Postcode
End user
Deployment date
Manufacturer
Model
Stack manufacturer
Technology
Stationary application
Fuel
Does the fuel cell system include a fuel
reformer?
Number of stacks
Electrical power of stacks
Rated system electrical capacity
Rated system thermal capacity
KPI - Rated system electrical efficiency
(LHV)
KPI - Rated system thermal efficiency
(LHV)
Description
KPI - Lifetime of the fuel cell system
KPI - Stack durability
KPI - Reliability
Start-up time
Transient response time
Part load operation electrical efficiency -
30%
Part load operation electrical efficiency -
50%
KPI - Hydrogen tolerance
CO emissions at rated conditions
NOx emissions at rated conditions
SOx emissions at rated conditions
Sound power level at rated condition
KPI - CAPEX
Est. system CAPEX (per kW) @ mass
production
System installation costs
Estimated Cost of spare parts
KPI - Land use / footprint
Operational
Start date for reporting
End date for reporting
Hours of operation
Days of operation
Hours of operation - cumulative
Energy input from fuel
Electricity produced
Useful heat output
KPI - Availability
Efficiency degradation rate
Power degradation rate
Number of safety incidents
Number of stack replacements
Fuel
Fuel price
KPI - Operational and maintenance costs
(OPEX)

Knowledge Management Data collection March 2018 Page 26
Fuel cell stack manufacturing
Descriptive
Reference process: description
Fuel cell technology
Target application
Reference process: Stack weight
Reference process: Stack volume
Reference process: Stack nominal capacity
Reference process: Active cell area
KPI - Reference process: Electrical efficiency
KPI - Reference process: Durability
KPI - Reference process: Degradation rate
KPI - Reference process: prod. rate
(stacks/yr)
Reference process: specifications criteria
Reference process: Percent in-specification
Reference process: quality testing duration
KPI - Reference process: production scrap
rate
KPI - Reference process: Nr staff per stack
KPI - Reference process: Nr staff per MW
Reference process: footprint
KPI - Reference process: energy per stack
KPI - Reference process: energy per MW
KPI - Reference process: OPEX per stack
KPI - Reference process: CAPEX
Operational
Start date for reporting
End date for reporting
Project process: description
Project process: Stack weight
Project process: Stack volume
Project process: Stack nominal capacity
Project process: Active cell area
KPI - Project process: Electrical efficiency
KPI - Project process: Durability
KPI - Project process: Prod. Rate (stacks/yr)
Project process: specifications criteria
Project process: Percent in-specification
Project process: Quality testing duration
Project process: production scrap rate
KPI - Project process: nr staff per stack
KPI - Project process: nr staff per MW
Project process: footprint
KPI - Project process: Energy per stack
KPI - Project process: Energy per MW
Project process: OPEX per stack
KPI - Project process: CAPEX

Knowledge Management Data collection March 2018 Page 27
Diagnostics – electrolysis
Descriptive
Diagnostic/control tool description
Property measured by the tool
Information derived
Does the tool measure the degradation?
Power usage of the tool
Association to prognostics for residual
lifetime?
KPI - Tool CAPEX
Electrolyser (system) manufacturer
Electrolyser system technology
H2 production rate, nominal - daily weight
Electrolyser nominal power
KPI - System durability - rated
Stack manufacturer
Stack capacity - rated
KPI - Stack durability - rated
Capital cost of the electrolyser system
Operational
Start date for reporting
End date for reporting
Stack hours of operation
System hours of operation
Tool hours of operation
KPI - System electrical efficiency at start
KPI - System electrical efficiency at end
KPI - Est. improvement of degradation rate
KPI - Improvement of mean time between
failures (MTBF)
KPI - Availability improvement
KPI - Predicted system durability
KPI - Predicted stack durability
Est. improvement of system lifetime
Est. improvement of stack lifetime
Number of faults detected
Number of failures detected
Detection rate - total
Detection rate - H2 in O2 stream or vice
versa
Detection rate - breaks/leakages
Detection rate - delamination
Detection rate - other issues
KPI - Diagnosis/monitoring tool availability
Tool operational costs per kg H2
Est. electrolyser system OPEX reduction
per kWh

Knowledge Management Data collection March 2018 Page 28
Diagnostics - fuel cells
Descriptive
Diagnostic/control tool description
Property measured by the tool
Information derived
Does the tool measure the degradation?
Power usage of the tool
Association to prognostics for residual
lifetime?
KPI - Tool CAPEX
Fuel cell system manufacturer
Fuel cell system technology
Fuel cell application
Fuel
Fuel cell system capacity
Fuel cell system durability - rated
Stack manufacturer
Stack capacity - rated
KPI - Stack durability, rated
Capital cost of the fuel cell system
Operational
Start date for reporting
End date for reporting
Stack hours of operation
System hours of operation
Tool hours of operation
System electrical efficiency at start
System electrical efficiency at end
KPI - Est. improvement of degradation rate
KPI - MTBF improvement
KPI - Availability improvement
KPI - Predicted System durability
KPI - Predicted Stack durability
Est. improvement of system lifetime
Est. improvement of stack lifetime
Number of faults detected
Number of failures detected
Detection rate - total
Detection rate - fuel starvation
Detection rate - air starvation
Detection rate - flooding and dehydration
Detection rate - changes in fuel
composition
Detection rate - sulphur poisoning
Detection rate - breaks and/or leakages
Detection rate - to delamination
Detection rate - other issues
KPI - Diagnosis/monitoring tool availability
Tool -OPEX per kWh
Est. FC system operational costs reduction
per kWh

Knowledge Management Data collection March 2018 Page 29
Pre-Normative Research
Descriptive
KPI - Gap in knowledge addressed
Project objective
FCH JU pillar
Approach
Target RCS
Target organisation
Target tech/working group
Other RCS addressing the issue tackled by
the project
Foreseen means
Collaborations outside EU28
Operational
Start date for reporting
End date for reporting
Newly detected relevant RCS activities
Progress vs knowledge gap
Is consortium involved first-hand in
standardisation bodies?
Standard developing organisation(s)
contacted
KPI - Number of meetings with standard
developing organisations
Number of workshops with standard
developing organisations
KPI - Number of reports sent to standard
developing organisations
Regulatory bodies contacted to date
KPI - Number of meetings with regulatory
organisations
Number of workshops with regulatory
organisations
KPI - Number of reports sent to regulatory
organisations
KPI - Number of peer reviewed
publications
KPI - Number of patents
KPI - Number of oral presentations @
scientific seminars/conferences
KPI - Nr of posters at scientific
seminars/conferences
KPI - Have the project results been
integrated in any RCSs?
When (year) do you expect project results
to be integrated in any RCS?

Knowledge Management Data collection March 2018 Page 30
Education
Descriptive
Training course: name & brief description
Training topic(s)
Training target group(s)
Training type
Training material
Training lanugage(s)
Training attendance method
Training duration
Is there a passing test/exam?
Awarding of a diploma/certification
Training website
Operational
Start date for reporting
End date for reporting
KPI - Number of people trained in
reference period
KPI - Total number of people trained in
project
Training location(s) in reference period
Training location(s) in the project
KPI - Trainees per country in the reference
period
KPI - Trainees per country in the project
KPI - Nr of diplomas/certificates issued in
reference period
KPI - Nr of diplomas/certificates issued in
the project

Knowledge Management Data collection March 2018 Page 31
Purification
Under development...