fuel cells & industrial batteries · fuel cells include a range of technologies that produce...
TRANSCRIPT
FUEL CELLS & INDUSTRIAL BATTERIESResearch Brief
Sustainable Industry Classification System™ (SICS™) #RR0104
Research Briefing Prepared by the
Sustainability Accounting Standards Board®
December 2015
www.sasb.org© 2015 SASB™

I N D U S T R Y B R I E F | F U E L C E L L S & I N D U S T R I A L B A T T E R I E S
FUEL CELLS & INDUSTRIAL BATTERIES
Research Brief SASB’s Industry Brief provides evidence for the disclosure topics in the Fuel Cells & Industrial Batteries
industry. The brief opens with a summary of the industry, including relevant legislative and regulatory
trends and sustainability risks and opportunities. Following this, evidence for each disclosure topic (in
the categories of Environment, Social Capital, Human Capital, Business Model and Innovation, and
Leadership and Governance) is presented. SASB’s Industry Brief can be used to understand the data
underlying SASB Sustainability Accounting Standards. For accounting metrics and disclosure guidance,
please see SASB’s Sustainability Accounting Standards. For information about the legal basis for SASB
and SASB’s standards development process, please see the Conceptual Framework.
SASB identifies the minimum set of disclosure topics likely to constitute material information for
companies within a given industry. However, the final determination of materiality is the onus of the
company.
Related Documents
• Fuel Cells & Industrial Batteries Sustainability Accounting Standards
• Industry Working Group Participants
• SASB Conceptual Framework
INDUSTRY LEAD
Henrik R. Cotran
CONTRIBUTORS
Andrew Collins
Bryan Esterly
Anton Gorodniuk
Jerome Lavigne-Delville
Nashat Moin
Himani Phadke
Arturo Rodriguez
Jean Rogers
Quinn Underriner
Gabriella Vozza
SASB, Sustainability Accounting Standards Board, the SASB logo, SICS, Sustainable Industry
Classification System, Accounting for a Sustainable Future, and Materiality Map are trademarks and
service marks of the Sustainability Accounting Standards Board.

Table of Contents
Introduction . . . . . . . . . . . . . . . . . . . . . . . . . . . . . . . . . . . . . . . . . . . . . . . . . . . . . . . . . . . . . . . . . . . . . . . . . . . . . 1
Industry Summary . . . . . . . . . . . . . . . . . . . . . . . . . . . . . . . . . . . . . . . . . . . . . . . . . . . . . . . . . . . . . . . . . . . . . . . . . 2
Legislative And Regulatory Trends In The Fuel Cells & Industrial Batteries Industry . . . . . . . . . . . . . . . . . . . . . . . . . 4
Sustainability-Related Risks and Opportunities . . . . . . . . . . . . . . . . . . . . . . . . . . . . . . . . . . . . . . . . . . . . . . . . . . . . 6
Environment . . . . . . . . . . . . . . . . . . . . . . . . . . . . . . . . . . . . . . . . . . . . . . . . . . . . . . . . . . . . . . . . . . . . . . . . . . . . . 7
Energy Management . . . . . . . . . . . . . . . . . . . . . . . . . . . . . . . . . . . . . . . . . . . . . . . . . . . . . . . . . . . . . . . . . . . . 7
Human Capital . . . . . . . . . . . . . . . . . . . . . . . . . . . . . . . . . . . . . . . . . . . . . . . . . . . . . . . . . . . . . . . . . . . . . . . . . . . 9
Workforce Health & Safety . . . . . . . . . . . . . . . . . . . . . . . . . . . . . . . . . . . . . . . . . . . . . . . . . . . . . . . . . . . . . . 10
Business Model and Innovation . . . . . . . . . . . . . . . . . . . . . . . . . . . . . . . . . . . . . . . . . . . . . . . . . . . . . . . . . . . . . . 12
Product Efficiency . . . . . . . . . . . . . . . . . . . . . . . . . . . . . . . . . . . . . . . . . . . . . . . . . . . . . . . . . . . . . . . . . . . . . 13
Product End-of-life Management . . . . . . . . . . . . . . . . . . . . . . . . . . . . . . . . . . . . . . . . . . . . . . . . . . . . . . . . . . 16
Leadership and Governance . . . . . . . . . . . . . . . . . . . . . . . . . . . . . . . . . . . . . . . . . . . . . . . . . . . . . . . . . . . . . . . . 19
Materials Sourcing . . . . . . . . . . . . . . . . . . . . . . . . . . . . . . . . . . . . . . . . . . . . . . . . . . . . . . . . . . . . . . . . . . . . . 19
Appendix
Representative Companies : Appendix I . . . . . . . . . . . . . . . . . . . . . . . . . . . . . . . . . . . . . . . . . . . . . . . . . . . . . 24
Evidence for Sustainability Disclosure Topics : Appendix IIA . . . . . . . . . . . . . . . . . . . . . . . . . . . . . . . . . . . . . . 25
Evidence of Financial Impact for Sustainability Disclosure : Appendix IIB . . . . . . . . . . . . . . . . . . . . . . . . . . . . . 26
Sustainability Accounting Metrics : Appendix III . . . . . . . . . . . . . . . . . . . . . . . . . . . . . . . . . . . . . . . . . . . . . . . 27
Analysis of SEC Disclosures : Appendix IV . . . . . . . . . . . . . . . . . . . . . . . . . . . . . . . . . . . . . . . . . . . . . . . . . . . 28
References
I N D U S T R Y B R I E F | F U E L C E L L S & I N D U S T R I A L B A T T E R I E S

I N D U S T R Y B R I E F | F U E L C E L L S & I N D U S T R I A L B A T T E R I E S | 1
INTRODUCTION
As one of the industries in the Renewable
Resources & Alternative Energy sector, the Fuel
Cells & Industrial Batteries industry plays an
important role in the global shift toward cleaner
energy and reducing environmental and social
impacts. While the industry is relatively new and
therefore small, it is growing at double-digit rates.
Its long-term viability and success depend on its
ability to compete with conventional sources of
energy in various applications and, first and
foremost, on a cost basis.
While renewable energy is more sustainable than
fossil fuel-based and nuclear energy, companies in
the Fuel Cells & Industrial Batteries industry are
not inherently sustainable. To ensure long-term
sustainable growth, companies in the industry
need to manage several issues. The heavy reliance
on certain materials may hinder the industry’s
ability to scale if a supplier is at risk. By
minimizing the reliance on critical materials, as
well as securing their supply, companies can
become cost-competitive. On the other side of the
equation, technological advancements in
products’ energy efficiency could propel the
utilization of fuel cells and industrial batteries,
significantly contributing to the total mix of clean
energy.
Management (or mismanagement) of certain
sustainability issues, therefore, has the potential
to affect company valuation through impacts on
profits, assets, liabilities, and cost of capital.
Investors obtain a more holistic and comparable
view of performance when fuel cells and
industrial batteries companies report metrics on
the material sustainability risks and opportunities
that could affect value in the near and long term
in their regulatory filings. This would include both
positive and negative externalities and the non-
financial forms of capital that the industry relies
on for value creation.
SUSTAINABILITY DISCLOSURE TOPICS
ENVIRONMENT
• Energy Management
HUMAN CAPITAL
• Workforce Health & Safety
BUSINESS MODEL AND INNOVATION
• Product Efficiency
• Product End-of-life Management
LEADERSHIP AND GOVERNANCE
• Materials Sourcing
In developing this brief and determining
disclosure topics and accounting metrics for
the Fuel Cells & Industrial Batteries industry,
SASB used a “pure play” definition of the
industry, covering the manufacturing of fuel
cells and batteries used in light automotive
vehicle applications, as well as non-industrial
batteries for personal consumer use in
separate standards: Auto Parts and Household
& Personal Products.
Therefore, depending on the specific activities
and operations of fuel cells and industrial
batteries manufacturers, sustainability topics
and accounting metrics associated with Auto
Parts and Household & Personal Products
industries also may be relevant to consider.
NOTE ON INDUSTRY STRUCTURE

I N D U S T R Y B R I E F | F U E L C E L L S & I N D U S T R I A L B A T T E R I E S | 2
Specifically, performance on the following
sustainability issues will drive competitiveness
within the Fuel Cells & Industrial Batteries
industry:
• Reducing the amount of energy
consumed in manufacturing and testing;
• Ensuring worker health and safety,
particularly from exposure to toxic
materials;
• Advancing the efficiency and performance
characteristics of products;
• Minimizing product lifecycle impacts
through innovation in product design and
business practices; and
• Managing the supply chain, including
managing risks associated with the
sourcing of sensitive or critical materials.
INDUSTRY SUMMARY
The Fuel Cells & Industrial Batteries industry is
composed of companies that manufacture fuel
cells for energy production and energy storage
equipment such as batteries for primarily
industrial or utility-scale purposes.I Industry
players design, build, and sell fuel cells and
industrial batteries that have a range of different
material inputs, including natural gas, lead,
lithium, and other rare earth and critical materials.
For the purposes of this brief, the industry does
not include fuel cells or batteries used in light
automotive vehicle applications or non-industrial
batteries for personal consumer use.
Manufacturers in this industry primarily sell
business-to-business products to companies for
varied energy-generation and -storage
applications and intensities, from commercial
business applications to large-scale energy
projects for utilities.
I Industry composition is based on the mapping of the Sustainable Industry Classification System (SICSTM) to the Bloomberg Industry
Fuel cells include a range of technologies that
produce electricity through electrochemical
processes combining hydrogen and oxygen. Fuel
cells can often operate on multiple fuel types,
such as hydrogen, natural gas, propane, and
methanol. Some of the main fuel cell technologies
are alkaline fuel cell (AFC), proton exchange
membrane (PEM), direct methanol fuel cell
(DMFC), molten carbonate fuel cell (MCFC),
phosphoric acid fuel cell (PAFC), and solid oxide
fuel cell (SOFC).1 Each type of fuel cell has a
unique chemistry and operating characteristics
that define the application it is best suited for. For
example, fuel cells such as PEM and DMFC, which
operate at low temperatures and are lightweight,
are used for mobile and small-scale applications,
such as powering forklifts and defense vehicles.2
In contrast, MCFC and PAFC fuel cells operate at
higher temperatures and are better suited for
stationary power generation, such as primary and
backup power sources for commercial
applications with higher energy needs, including
utilities and universities.3
The industrial batteries segment is slightly more
mature than the fuel cells segment. However,
new types of technologies and niche applications
continue to emerge. Among the major industrial-
scale battery chemistry types are lithium-, lead-,
and nickel-based systems.4 As with fuel cells, each
battery’s various characteristics (such as power
output and runtime) determine its application.5
Lithium-based batteries typically have higher
specific energy in watt-hours per kilogram
(Wh/kg) and higher specific power in watts per
kilogram (W/kg), thereby providing longer
runtimes and better power delivery than do lead
and nickel batteries.6 Lithium batteries are ideally
suited for smaller applications such as defense
vehicles and industrial machinery. In contrast, lead
acid batteries have much lower levels of specific
Classification System (BICS). A list of representative companies appears in Appendix I.

I N D U S T R Y B R I E F | F U E L C E L L S & I N D U S T R I A L B A T T E R I E S | 3
energy and specific power.7 However, the price
point of lead acid batteries often gives them a
competitive advantage.8 As of 2013,
approximately 80 percent of the total installed
capacity of industrial batteries (for stationary and
motive applications) was based on lead-acid
technology.9
Industrial batteries can be used in military and
defense applications, medical applications, and
security metering, transportation, telematics, and
other industrial segments.10 Industrial batteries for
stationary use typically operate at low, steady
power over a longer period of time than do
smaller consumer batteries and are often
configured to meet large backup power demands.
The Fuel Cells & Industrial Batteries industry is
relatively small, with only four publicly traded
companies in the United States. Companies listed
on U.S. exchanges or traded over the counter are
primarily headquartered in the U.S. (though some
are domiciled in France and China) but have
global operations and sell products to a global
marketplace. The largest companies listed on U.S.
exchanges are EnerSys, FuelCell Energy, Plug
Power, and Ultralife Corporation.11 In 2014
EnerSys generated 51 percent of its revenue from
the Americas, 39 percent from Europe, and 10
percent from Asia.12 In fiscal year (FY) 2015, sales
outside the U.S. grew to about 60 percent of its
revenue.13 Similarly, almost 70 percent of FuelCell
Energy’s 2014 revenue came from South Korea,
where the Renewable Portfolio Standards (RPS)
that took effect in 2012 require an increase of
renewable power generation from 2 to 10 percent
by 2022. The U.S. market accounted for just
under 30 percent of revenue.14 Plug Power
generated all its revenue from the U.S. in 2014.15
The global fuel cell and industrial batteries
manufacturing market is valued at approximately
$27 billion.16 Companies listed on U.S. exchanges
generate approximately $2.8 billion from the
industry.17 Even though countries such as China
have increased their battery manufacturing
capabilities, U.S. battery manufacturers still
benefit from cutting-edge technologies, and
exports are predicted to continue to increase.18
Considering the growing demand in European
and Asian markets, several U.S. companies
opened manufacturing facilities abroad to be
closer to their customers.19
The industrial batteries segment is the largest in
the industry, based on reported segment
revenues, followed by fuel cell manufacturing.20
While the fuel cell and lithium-based battery
segments are still in the early stages of growth,
consolidation in the industrial batteries segment
indicates that the segment is in a mature lifecycle
stage. EnerSys is the top company in this industry
and has acquired multiple foreign companies over
the past five years to expand its reach.21 Larger
operations and vertically integrated production
allow companies like EnerSys to benefit from a
lower per-unit production cost. This makes them
less susceptible to fluctuating input prices and
gives them a competitive advantage over smaller
companies and new entrants to the industry.
While the 2014 operating margin for the
dominant company, EnerSys, was 7.9 percent, the
three other public companies—FuelCell Energy,
Plug Power, and Ultralife—had negative margins.
The net income margin for EnerSys was 6.1
percent, whereas the industry median was
negative 3.2 percent.22 Although the industry has
seen steady growth in both segments over the
past few years, the industry-wide margins show
that companies are not yet profitable across the
board. Low profitability could be due in part to
high operating costs and high capital
expenditures toward continued research and
development (R&D).

I N D U S T R Y B R I E F | F U E L C E L L S & I N D U S T R I A L B A T T E R I E S | 4
The industrial batteries segment of this industry is
expected to experience relatively slow growth
over the next few years, given the rising prices of
raw material inputs, including lead, zinc, and
other nonferrous metal products.23 However, the
level of technological change is considered to be
high, as companies compete to create more
efficient, safer, and more environmentally friendly
alternatives. Capital-intensive and niche sub-
segments such as backup batteries for
photovoltaic applications and batteries for
medical applications will likely continue to grow
at a more rapid pace as the technology further
evolves to suit market needs for specialized and
high-value products.
The fuel cell segment is expected to continue to
grow across all sub-segments, with especially
strong growth in the stationary use category to
meet continued demands for backup and remote
power. Specifically, there has been a recent
increase in demand for fuel cells in international
markets (South Korea, Latin America, the
Caribbean, Indonesia, India, the Middle East,
Africa, Japan, and China).24 This is driven in part
by government policy. In South Korea, for
example, the RPS mandate that clean and
renewable power generation must increase to 10
percent of total power generation by 2022 (up
from 2 percent in 2012).25 The fuel cell segment
of the industry grew by 30 percent in 2013, with
shipments of nearly 200 megawatts of systems.
Fuel Cell Today predicts that the size of the
industry will be measured in gigawatts within the
next five years.26
II This section does not purport to contain a comprehensive review of all regulations related to this industry but is intended to
LEGISLATIVE AND REGULATORY TRENDS IN THE FUEL CELLS & INDUSTRIAL BATTERIES INDUSTRY
Regulations in the U.S. and abroad represent the
formal boundaries of companies’ operations and
are often designed to address the social and
environmental externalities that businesses can
create. Beyond formal regulation, industry
practices and self-regulatory efforts act as quasi-
regulation and also form part of the social
contract between business and society. In this
section, SASB provides a brief summary of key
regulations and legislative efforts related to this
industry, focusing on social and environmental
factors. SASB also describes self-regulatory efforts
on the part of the industry, which could serve to
preempt further regulation.II
The Fuel Cells & Industrial Batteries industry is
subject to heavy regulation by multiple federal,
state, local, and foreign regulatory standards,
including those related to human and
environmental health and safety laws, the
management and disposal of hazardous
substances, and the use of key materials.
As mentioned in the Industry Summary, national
and foreign regulations aimed at curbing
greenhouse gas (GHG) and other emissions and
increasing the amount of clean of renewable
power generation play an important role in
demand for fuel cells and industrial batteries. The
Clean Air Act (CAA) of the U.S. Environmental
Protection Agency (EPA) regulates air emissions
from stationary and mobile sources, while
government-instituted cap-and-trade systems
governing emissions of nitrogen oxides (NOx),
sulfur oxides (SOx), and carbon dioxide (CO2) exist
in a growing number of regions. The E.U.
highlight some ways in which regulatory trends are impacting the industry.
I N D U S T R Y B R I E F | F U E L C E L L S & I N D U S T R I A L B A T T E R I E S | 5
emissions trading system is the largest
international system for trading emissions
allowances, and its goal is to reduce emissions of
covered sectors by 21 percent by 2020 from 2005
levels. The cap-and-trade program of the
California Air Resources Board (ARB) targets the
reduction of GHG emissions from major state
facilities. The California program has also officially
linked with the Quebec Ministry of Sustainable
Development to co-host a joint cap-and-trade
auction and is also working with the Western
Climate Initiative to integrate this program into
other regions.27 Furthermore, the Regional
Greenhouse Gas Initiative is a nine-state program
within the U.S Northeast to reduce CO2 emissions
from the power sector. China has already
launched seven regional pilot cap-and-trade
programs and also recently confirmed that a
nationwide cap-and-trade program will be
introduced in 2016.28
Fuel cell and industrial battery customers are
under increasing pressure to reduce their
environmental footprints through improvements
that range from corporate to utility-scale
modifications. This pressure may come from
emissions-related regulations, such as the cap-
and-trade programs noted above, or from
increasing pressure by peers and reporting
schemes, including the Global Reporting Initiative
and the Carbon Disclosure Project, to set
transparent corporate standards and reductions
for GHG emissions. This trend could help give
products in the Fuel Cells & Industrial Batteries
industry a competitive advantage if end users can
employ them to lower their total GHG footprint.
Several tax incentive programs at both federal and
state levels, in addition to stimulus funds, are
already in place to help promote the development
and expansion of energy generation and storage
projects. The federal investment tax credit
provides corporate tax credits for a wide range of
renewable technologies, including fuel cells and
combined heat and power (CHP) systems.29
California’s Self-Generation Incentive Program is
one of the longest-running and most successful
examples of a statewide initiative to promote
distributed energy generation.30 Moreover, the
American Recovery and Reinvestment Act (ARRA)
of 2009 stimulates investment into a range of
clean energy projects, including smart grid,
carbon capture and storage technologies, and
other energy efficiency and renewable energy
projects. More than $31 billion has been invested
through ARRA.31
The EPA’s Resource Conservation and Recovery
Act (RCRA) regulates the industry’s management
of hazardous waste. RCRA regulations affect the
generation, transport, treatment, storage, and
disposal of such waste.32 In addition, the
Comprehensive Environmental Response,
Compensation, and Liability Act of 1980,
commonly referred to as Superfund, establishes
legal responsibility for the environmental
remediation of contaminated sites.33
The Emergency Planning and Community Right-
to-Know Act of 1986 requires that U.S. industrial
facilities, including those that produce fuel cells
and batteries, report toxics released into the air,
land, and water annually to the EPA in the Toxics
Release Inventory (TRI). TRI substances represent
possible chronic and acute human health risks and
adverse environmental impacts.34
The industry is also required to adhere to specific
health and safety standards for its employees. In
the U.S., these standards are enforced by the
Occupational Safety and Health Administration
(OSHA) of the U.S. Department of Labor. The
department currently regulates exposure to
approximately 500 hazardous substances.35 In
some instances, companies must additionally
establish their own exposure criteria for the

I N D U S T R Y B R I E F | F U E L C E L L S & I N D U S T R I A L B A T T E R I E S | 6
thousands of other hazardous substances not
addressed by OSHA.
Furthermore, companies in this industry are
specifically impacted by the Dodd-Frank Wall
Street Reform and Consumer Protection Act of
2010 and subsequent rules adopted by the U.S.
Securities and Exchange Commission (SEC). Under
the Dodd-Frank Act, companies are required to
publicly disclose their use of conflict minerals if
those materials are “necessary to the functionality
or production of a product” that the company
manufactures or contracts to be manufactured.
These minerals include tantalum, tin, gold, and
tungsten originating in the Democratic Republic
of the Congo (DRC) or neighboring countries.36
The industry is facing increasing concern over the
end-of-life management of products. Fuel cell and
battery producers need to comply with region-
specific producer manufacturing and take-back
laws such as the E.U. Directive on Waste Batteries
and Accumulators. The directive is aimed at
reducing the amount of mercury, cadmium, lead,
and other metals in the environment by
minimizing their use and treating and reusing old
batteries. Under this regulation, producers have a
duty to take back discarded industrial batteries
from any end-user free of charge and to tell end-
users how they can return these batteries.37
Other such regulations include the E.U.’s Directive
on End-of-life Vehicles, Japan’s 2002 End-of-life
Recycling Law, South Korea’s 2007 Act for
Resources Recycling of Electrical and Electronic
Equipment and Vehicles, and the upcoming
implementation of China’s Restriction of
Hazardous Substances program. With an
increasing demand for product transparency in
the U.S. and other regions, similar regulations
could expand to new jurisdictions in the future.
Broadly speaking, environmental and human
health regulations are becoming increasingly strict
in most markets, and regulations may impact the
industry across operations, supply chains, and end
markets.
SUSTAINABILITY-RELATED RISKS AND OPPORTUNITIES
Industry drivers and recent regulations suggest
that traditional value drivers will continue to
impact financial performance. However,
intangible assets such as social, human, and
environmental capitals, company leadership and
governance, and the company’s ability to innovate
to address these issues are likely to increasingly
contribute to financial and business value.
Broad industry trends and characteristics are
driving the importance of sustainability
performance in the Fuel Cells & Industrial
Batteries industry:
• Environmental and social
externalities: The production of, and
end-of-life for, fuel cells and industrial
batteries can create negative
environmental and social externalities.
This includes improper disposal of
hazardous materials at the end-of-life of
fuel cells and batteries, the use of rare
earth metals and conflict minerals as
inputs to production, and health and
safety hazards for workers. As a result,
regulations could lower the demand for,
or constrain the supply of, critical inputs
for fuel cells and industrial batteries.
Regulations could also increase costs
associated with worker health and safety
and product end-of-life management.
• Resource scarcity: Fuel cell and industrial
battery manufacturing is a materials-
intensive process that is impacted by the
growing resource scarcity and increasing
prices of critical materials.

I N D U S T R Y B R I E F | F U E L C E L L S & I N D U S T R I A L B A T T E R I E S | 7
As described above, the regulatory and legislative
environment surrounding the Fuel Cell &
Industrial Batteries industry emphasizes the
importance of sustainability management and
performance. Specifically, recent trends suggest a
regulatory emphasis on reducing environmental
impacts and improving health and safety, which
will serve to align the interests of society with
those of investors.
The following section provides a brief description
of each sustainability issue that is likely to have
material financial implications for companies in
the Fuel Cells & Industrial Batteries industry. This
includes an explanation of how the issue could
impact valuation and evidence of actual financial
impact. Further information on the nature of the
value impact, based on SASB’s research and
analysis, is provided in Appendix IIA and IIB.
Appendix IIA also provides a summary of the
evidence of investor interest in the issues. This is
based on a systematic analysis of companies’ 10-K
and 20-F filings, shareholder resolutions, and
other public documents, which highlights the
frequency with which each topic is discussed in
these documents. The evidence of interest is also
based on the results of consultation with experts
participating in an industry working group (IWG)
convened by SASB. The IWG results represent the
perspective of a balanced group of stakeholders,
including corporations, investors or market
participants, and public interest intermediaries.
The industry-specific sustainability disclosure
topics and metrics identified in this brief are the
result of a yearlong standards development
process, which takes into account the
aforementioned evidence of interest, evidence of
financial impact discussed in detail in this brief,
inputs from a 90-day public comment period, and
additional inputs from conversations with industry
or issue experts.
A summary of the recommended disclosure
framework and accounting metrics appears in
Appendix III. The complete SASB standards for the
industry, including technical protocols, can be
downloaded from www.sasb.org. Finally,
Appendix IV provides an analysis of the quality of
current disclosure on these issues in SEC filings by
the leading companies in the industry.
ENVIRONMENT
The environmental dimension of sustainability
includes corporate impacts on the environment.
This could be through the use of natural resources
as inputs to the factors of production (e.g., water,
minerals, ecosystems, and biodiversity) or
environmental externalities and harmful releases
in the environment, such as air and water
pollution, waste disposal, and GHG emissions.
The Fuel Cells & Industrial Batteries industry
utilizes energy as a key input for manufacturing
and testing products. This energy consumption
contributes to the indirect release of GHG
emissions, which can lead to climate change. At
the same time, energy expenditures can represent
a large portion of a company’s cost of operations,
making energy consumption an important issue to
manage.
Energy Management
Most of the energy consumption in the Fuel Cells
& Industrial Batteries industry takes place during
the manufacturing and testing processes. As
detailed in the Evidence section below, purchased
electricity can represent a major share of the
energy in the industry.38 Major uses of electricity
in this industry vary depending on the type of
component being manufactured and tested for
efficiency in labs. The automated and manual
processes involved all require energy.

I N D U S T R Y B R I E F | F U E L C E L L S & I N D U S T R I A L B A T T E R I E S | 8
Fossil fuel–based energy production and
consumption contribute to significant
environmental impacts, including climate change
and pollution, which have the potential to
indirectly yet significantly impact the operations
of fuel cell and industrial battery companies.
Factors related to sustainability, such as GHG
emissions pricing, incentives for energy efficiency
and renewable energy, and risks associated with
nuclear energy and its increasingly limited license
to operate, are leading to a rise in the cost of
conventional energy sources while making
alternative sources cost-competitive. Therefore, it
is becoming increasingly important for companies
in energy-intensive industries to manage their
overall energy efficiency, their reliance on
different types of energy and the associated risks,
and their access to alternative energy sources.
By improving the efficiency of the manufacturing
process and exploring alternative energy sources,
including using their own products to power their
facilities, fuel cell and industrial battery companies
can reduce both their indirect environmental
impacts and their operating expenses. These
reductions can improve profit margins and, in
turn, can help improve the commercial viability of
this industry’s products.
Company performance in this area can be
analyzed in a cost-beneficial way through the
following direct or indirect performance metrics
(see Appendix III for metrics with their full detail):
• Total energy consumed, percentage grid
electricity, percentage renewable.
Evidence
Manufacturing and R&D require significant energy
consumption to power cooling, ventilation,
lighting, and product testing systems.39 The
majority of the companies traded in the U.S.,
including over the counter, have negative net
operating margins.40 Therefore, it will be
particularly important for fuel cell and industrial
battery manufacturers to control energy costs
while the industry proves the commercial viability
of large-scale projects at competitive price points.
According to data from the 2011 Annual Survey
of Manufacturers, conducted by the U.S. Census
Bureau, for the “storage battery manufacturing”
segment (2007 NAICS code 335911), purchased
electricity constituted 3.5 percent of value added
and 3.3 percent of the total cost of materials.41
This was greater than the average for all U.S.
manufacturing facilities included in the survey,
where purchased electricity was 2.3 percent of
value added and 1.6 percent of the total cost of
materials. This indicates that the industry is more
exposed to rising or volatile energy costs and grid
disturbances, particularly given the low and
negative profit margins (a negative 3.2 percent
median net income margins for the industry).
Overall, storage battery manufacturing facilities in
the U.S. purchased 2.3 billion kilowatt-hours
(kWh) of electricity for heat and power, which
accounted for $112 million of operating expenses.
The relative cost of purchased fuels is lower than
that of purchased electricity for this segment.42
One of the main challenges for the industry
(particularly the fuel cell segment) is to prove the
commercial viability of large-scale projects.
Initiatives aimed at reducing energy consumption
can have a positive impact on operational
efficiency and margins. This could help companies
pass through cost savings and lower the price of
fuel cells and batteries, improving their
commercial viability.
A number of the top companies in the industry,
including EnerSys, FuelCell Energy, Plug Power,
and Ultralife, cite concerns about increasing
energy costs in their annual SEC filings. Ultralife
reported the following concerns in its FY2013

I N D U S T R Y B R I E F | F U E L C E L L S & I N D U S T R I A L B A T T E R I E S | 9
Form 10-K: “We use various utilities to provide
heat, light and power to our facilities. As energy
costs rise, we continue to seek ways to reduce
these costs and will initiate energy-saving projects
at times to assist in this effort. It is possible,
however, that rising energy costs may have an
adverse effect on our financial results.”43
With electricity costs increasing, companies in the
industry are trying to reduce their reliance on grid
electricity by taking steps to decrease or offset
their energy expenses. Furthermore, many are
implementing or piloting their own energy-
generation and storage technologies to reduce
overall grid dependence and associated emissions.
For example, Highway Holdings is trying to
minimize high electricity expenses at its
manufacturing facilities in China by installing
more meters and shifting its production schedule
to lower-cost periods.44 Highway Holdings claims
it has experienced electricity shortages, as well as
increased energy prices, because of the rapid
growth of China’s economy, which has adversely
affected the cost of operations.45
FuelCell Energy’s FY2014 Form 10-K described the
following strategies aimed at improving its energy
efficiency in manufacturing: “We have a tri-
generation fuel cell power plant at our North
American manufacturing plant, efficiently
generating power and heat for the facility and
hydrogen for the manufacturing process. From a
sustainability standpoint, on-site tri-generation
avoids the use of a combustion-based boiler for
heat and its associated emissions and reduces
pollutants from the diesel truck needed for
hydrogen delivery, reducing our carbon footprint
and benefiting the surrounding community.”46
Furthermore, companies such as Plug Power have
chosen to use their own fuel cell technology for
primary and backup power generation at their
manufacturing facilities to reduce their corporate
footprint.47 Plug Power has also opted to purchase
Green-e certified renewable energy credits as a
means of offsetting its own environmental
footprint while supporting the development of
new renewable generation capacity.48
Value Impact
Energy management is likely to have a chronic
impact on value though operational costs. Fuel
cell and industrial battery manufacturers that
invest in process innovation aimed at reducing
electricity consumption and that implement
alternative sources of energy are likely to improve
their operational efficiency in the medium to long
term.
Furthermore, a reduced reliance on traditional
sources of energy and a greater share of
purchased or self-generated electricity from
renewable or alternative energy sources indicate a
company’s ability to mitigate its environmental
footprint and its exposure to energy cost increases
or volatility driven by sustainability impacts. This
could help lower companies’ cost of capital as
well as improve the commercial viability of their
products, contributing to revenue growth.
The probability and magnitude of these impacts
could increase in the future as emerging
governmental regulations on environmental
impacts continue to drive energy cost increases.
HUMAN CAPITAL
Human capital addresses the management of a
company’s human resources (employees and
individual contractors), as a key asset to delivering
long-term value. It includes factors that affect the
productivity of employees, such as employee
engagement, diversity, and incentives and
compensation, as well as the attraction and
retention of employees in highly competitive or
constrained markets for specific talent, skills, or
I N D U S T R Y B R I E F | F U E L C E L L S & I N D U S T R I A L B A T T E R I E S | 10
education. It also addresses the management of
labor relations in industries that rely on economies
of scale and compete on the price of products
and services. Lastly, it includes the management
of the health and safety of employees and the
ability to create a safety culture within companies
that operate in dangerous working environments.
Fuel cell and industrial battery manufacturing
poses inherent dangers to employees. Exposure to
hazardous chemicals, electrical hazards, explosive
materials, heavy machinery, and pressurized
equipment poses physical risks. Implementing a
safety culture is critical to proactively guard
against accidents or other incidents with negative
environmental and social impacts. A company’s
ability to protect employee health and safety and
to create a culture of safety for employees at all
levels of the organization can directly influence
the results of its operations.
Workforce Health & Safety
Fuel cell and industrial battery manufacturing
workers may be exposed to hazardous substances
or accidents that can have chronic or acute health
impacts, sometimes resulting in fatalities. While
injury rates are generally low in the industry,
relative to others, companies have faced
regulatory action from violations of health and
safety standards, some of which have been repeat
violations. Companies can also face litigation as a
result of fatalities or chronic health impacts from
working in fuel cell and battery manufacturing
facilities.
Chronic health impacts can develop as a result of
repeated or prolonged exposure to hazardous
substances. Since lead is a key component in
many traditional batteries and is absorbed into
the body by ingestion or inhalation, battery plant
workers can be subject to lead toxicity, which can
have a variety of physical and mental health
impacts.49 Beyond exposure to hazardous
substances, acute incidents might also include
fires and explosions, freeze burns, and electrical
hazards.50
Companies that employ best practices, such as
providing health and safety training, protective
gear, improved ventilation, and regular
monitoring, can increase workforce health and
safety performance. Business practices that
emphasize a strong safety culture are also
important to achieving sustained, improved
performance on this issue. Through these efforts,
companies can minimize regulatory and litigation
risks that could affect long-term value.
Company performance in this area can be
analyzed in a cost-beneficial way through the
following direct or indirect performance metrics
(see Appendix III for metrics with their full detail):
• Total recordable injury and fatality rates;
and
• Discussion of efforts to assess, monitor,
and reduce exposure of workforce to
human health hazards.
Evidence
In the manufacture of industrial batteries,
companies process, store, and dispose of large
amounts of hazardous materials, such as lead and
acid. As a result, employees’ health and safety
may be at risk, and therefore companies in the
industry are subject to stricter laws governing this
issue.51
Some companies in the industry may have
operational facilities in countries where local
employee safety laws may be less strict. For
example, according to the EnerSys FY2015 Form
10-K, more than half the company’s
manufacturing capacity is located outside the
U.S.52 FuelCell Energy has manufacturing facilities

I N D U S T R Y B R I E F | F U E L C E L L S & I N D U S T R I A L B A T T E R I E S | 11
in the U.S., South Korea, and Germany.53
Multinational operations require companies to
comply with local regulations, although U.S.
investors may expect companies to perform to
higher standards of employee health and safety.
To reduce the risk of incidents, companies
including EnerSys, Exide Industries, and Saft
Groupe certify their global facilities to health and
safety standards such as Occupational Health and
Safety Assessment Series (OHSAS) 18001.54
OSHA’s Hazard Communication Standard requires
chemical manufacturers and importers to report
physical and health hazards of chemicals to
employees and companies in the supply chain.55
OSHA enforces permissible limits for exposure to
concentrations of hazardous substances in the air
or in contact with skin.56
However, OSHA has largely focused on acute
health impacts from accidents and immediate
process safety, while risks from long-term
exposure to hazardous substances have received
less attention. Existing OSHA standards allow
workers to have blood lead levels up to 60 μ
grams per deciliter (g/dL) before they have to be
removed from work areas because of significant
lead exposure.57 However, the California
Department of Public Health (CDPH), among
others, has suggested that these regulations are
not stringent enough because they were based on
scientific information that is more than 35 years
old.58 The CDPH has proposed an alternative
exposure limit of 20 μg/dL, which is still under
consideration.59 New regulatory initiatives such as
these, in both developed and developing
countries, could increase future regulatory risks
for fuel cell and battery companies, particularly
with a greater understanding of health impacts
for industry workers.
The EPA research indicates a causal relationship
between low-level lead exposure and high blood
pressure, heart disease, and male reproductive
issues.60 A study also determined that there is
likely a causal relationship between low-level lead
exposure and a decrease in brain functions such
as learning and memory, as well as psychological
effects.61 More severe cases of lead poisoning can
cause anemia, nerve and kidney damage,
convulsions, or even death.62
EnerSys is one example of a company that was
found to be in serious violation of regulations and
was repeatedly fined by OSHA for exposing
workers who recycle lead batteries to
concentrations of lead beyond the permissible
limits. A serious violation occurs when there is
“substantial probability that death or serious
physical harm could result from a hazard about
which the employer knew or should have
known.”63 In 2011, EnerSys received a fine of
$77,000 at its Frisco, Texas, battery recycling
facility for not implementing engineering and
work practice controls to prevent worker exposure
to hazardous concentrations of lead. EnerSys also
repeatedly exceeded lead-exposure limits at its
Fort Smith, Arkansas, facility in 2008, with
penalties of $36,600, and at its Laureldale,
Pennsylvania, facility in 2009, with penalties of
$52,400.64 While individual penalties are small,
fines for repeated violations could have a chronic
impact on company value, not only by directly
eroding already weak profit margins but also by
lowering worker morale and productivity and
increasing long-term employee health care
expenses.
EnerSys highlighted the costs of associated
compliance risks in its FY2013 Form 10-K: “Our
ongoing compliance with environmental, health
and safety laws, regulations and permits could
require us to incur significant expenses, limit our
ability to modify or expand our facilities or
continue production and require us to install
additional pollution control equipment and make
I N D U S T R Y B R I E F | F U E L C E L L S & I N D U S T R I A L B A T T E R I E S | 12
other capital improvements. In addition, private
parties, including current or former employees,
could bring personal injury or other claims against
us due to the presence of, or exposure to,
hazardous substances used, stored or disposed of
by us or contained in our products.”65
Exide Technologies, a battery maker that had
been in business for 125 years, filed for
bankruptcy in 2013 after California environmental
regulators shut down one of its lead-recycling
plants.66 The California Department of Toxic
Substances and Control ordered Exide to suspend
operations at the recycling plant because of
noncompliance with state health standards.
Specifically, there were allegations of hazardous
wastes such as arsenic and lead being released
into the soil and air in amounts that exceeded
public health regulations, posing potential health
risks to workers and the neighboring
community.67 While this incident was not the only
reason Exide filed for bankruptcy, the company
estimates that the closure of the California
recycling plant cost it $24 million in earnings
before taxes, interest, depreciation, and
amortization.68
In addition to costs associated with violations,
companies are also at risk of litigation and
additional health costs for employees. Forty-three
workers recently sued a Saft battery factory for
prolonged exposure to cadmium, and at least
twice that number of workers may have been
affected.69
Value Impact
Performance on worker health and safety can
affect the operational efficiency and cost structure
of fuel cell and industrial battery companies. In
particular, violations of health and safety
standards could result in monetary and
nonmonetary penalties and additional costs of
corrective actions, with an impact on net profits.
Adverse legal rulings against a company as a
result of employee lawsuits related to both
regulated and unregulated but known hazardous
substances and/or workplace accidents could
create contingent liabilities. In instances where
casualty liability coverage may not be sufficient, a
company may take losses that could reduce
operating expenses.
Performance on health and safety is also
important in foreign operations, regardless of
whether local regulations are as stringent as those
in the U.S., as it could affect the company’s
reputation and ability to expand operations in the
long term. Negative reputational effects can be
particularly damaging for nascent segments of the
industry, such as fuel cells, especially as they
attempt to provide “clean” sources of energy.
Generally, poor safety records can have a chronic
negative impact on reputation and can lower the
value of intangible assets.
The impact of this issue is likely to become more
significant over the medium to long term, as the
quality and availability of data on health hazards
improve and companies face new regulations or
the inclusion of new chemicals in existing
regulations. Therefore, the probability and
magnitude of these impacts are likely to increase
in the future.
BUSINESS MODEL AND INNOVATION
This dimension of sustainability is concerned with
the impact of environmental and social factors on
innovation and business models. It addresses the
integration of environmental and social factors in
the value-creation process of companies,
including resource efficiency and other innovation
in the production process. It also includes product
innovation and efficiency and responsibility in the
design, use-phase, and disposal of products. It

I N D U S T R Y B R I E F | F U E L C E L L S & I N D U S T R I A L B A T T E R I E S | 13
includes management of environmental and social
impacts on tangible and financial assets—either a
company’s own or those it manages as the
fiduciary for others.
In the Fuel Cells & Industrial Batteries industry,
business model and innovation issues focus on the
responsibility of producers to reduce the lifecycle
impacts of a product (particularly through reuse
and recycling at the end-of-life stage) and
improve the energy efficiency in the use phase.
Emerging environmental and social trends, along
with increased regulatory requirements and
scrutiny, are creating new innovation and
business opportunities for companies in the
industry. Such innovation directly impacts the
total cost of owning, disposing of, and
(potentially) manufacturing fuel cells and
industrial batteries. Companies’ intellectual capital
can be used to create innovative products that
address the material environmental and social
impacts discussed above, which are otherwise
created by this industry over the product lifecycle.
Product Efficiency
As the global regulatory environment continues to
evolve and to mandate lower emission and
increased use of renewable energy, companies in
the industry may play an important role in helping
their clients comply with these regulations. While
fuel cells and batteries may be inherently cleaner
and more efficient than traditional sources of
energy, firms may still improve characteristics of
their products through design decisions and win a
competitive advantage in capturing a larger share
of this growing market. Both customer demand
and regulatory requirements are increasing for
energy-efficient products with lower
environmental impacts and lower total cost of
ownership. The widespread adoption of fuel cell
technologies, in particular, may be limited
because of their high costs relative to competing
energy sources. Therefore, design decisions in the
Fuel Cells & Industrial Batteries industry that drive
energy and thermal efficiency and enhance
storage capacities can lower barriers to adoption.
Together, these factors are driving fuel cell and
industrial battery manufacturers to improve their
products’ use-phase charging and thermal
efficiency. Improved efficiencies could help lower
total costs of ownership for customers. As the
rate of adoption of fuel cells and industrial
batteries increases, it will become even more
important to ensure that product design is
maximized for efficient energy production or
storage. As noted in the Industry Summary,
different types of fuel cells and batteries are more
suitable for different applications, such as
stationary versus motive. However, companies can
continue to innovate to improve the efficiency of
these products in order to meet demand and
capture additional market share.
In particular, advances in battery technology to
increase storage capabilities and improve charging
efficiencies, while lowering costs, are critical for
the integration of renewable energy technologies
into the grid. Market demand for such battery
types is expected to increase dramatically in the
next few years. Fuel cell and industrial battery
manufacturers that are able to improve efficiency
in the use phase will be able to satisfy growing
demand, pressured by stricter environmental
regulations, high energy costs, and customer
preferences.
Company performance in this area can be
analyzed in a cost-beneficial way through the
following direct or indirect performance metrics
(see Appendix III for metrics with their full detail):
• Average storage capacity of batteries, by
product application and technology type;
• Average energy efficiency of fuel cells as
electrical efficiency and thermal efficiency,

I N D U S T R Y B R I E F | F U E L C E L L S & I N D U S T R I A L B A T T E R I E S | 14
by product application and technology
type;
• Average battery efficiency as coulombic
efficiency, by product application and
technology type;
• Average operating lifetime of fuel cells, by
product application and technology type;
and
• Average operating lifetime of batteries, by
product application and technology type.
Evidence
According to industry analysts, one of the major
barriers to greater fuel cell adoption is their high
cost relative to that of incumbent energy
generation sources.70 Companies that innovate to
improve product energy efficiencies to lower the
cost of their product, as well as decrease their
customer’s cost of ownership, will likely increase
their market share.
Companies can lower a product’s cost of
ownership through thermal efficiencies within
product offerings. A typical high-temperature fuel
cell system consumes only 70 to 80 percent of its
fuel. FuelCell Energy is researching a CHP system
that will better utilize excess heat to increase
overall system efficiency by more than 75 percent.
This will reduce its customers’ utility costs by an
estimated 25 percent.71 General Electric’s research
organization is working on a utility-scale fuel cell
that currently turns 65 percent of the usable
energy from natural gas into electricity. The
company expects to increase the energy efficiency
to 95 percent using waste heat from the
process.72
By configuring its power plants for CHP, FuelCell
Energy can deliver up to 90 percent system
efficiency, depending on the application. This is a
significant improvement over the efficiency of the
company’s Direct FuelCell power plants and the
hybrid applications and advanced configurations,
which deliver electrical efficiency of 47 and 60
percent, respectively. The company also provides
a High Efficiency Fuel Cell configuration, which
utilizes heat energy to generate additional
electricity from each unit of fuel, with an electrical
efficiency of approximately 60 percent.73
According to EnerSys, upgrading propane-
powered lift trucks to electric-powered ones can
lower annual fuel costs by $6,300 per vehicle as
well as reduce truck maintenance and increase
productivity (lift and travel speeds) by 20
percent.74 Electric-powered trucks not only reduce
operating expenses for customers but also
eliminate a significant amount of CO2 emissions,
which are likely to be important determinants of
demand.
These types of innovations require significant
capital investments for companies. For example,
FuelCell Energy spent $35 million on research and
development in 2014, roughly 19 percent of its
total revenue that year.75
Battery technology is projected to undergo major
innovations and price reductions over the next
decade.76 Navigant Research predicts that the
market for next-generation batteries will grow
from $164 million in 2014 to more than $2.5
billion in 2023.77 Those companies manufacturing
products that can deliver the most energy
efficiency to their clients are likely to capture a
larger share of this market and obtain a pricing
power through competitive advantage.
Much of the industry growth will come from
tackling grid-integration issues for renewable
energy sources such as wind and solar. Currently,
much of the needed technology is not
economically viable.78 For example, battery
technology needs to find a cost-effective method
to address intermittency. Wind and solar
resources are not always available, so for these
technologies to scale up, energy needs to be
I N D U S T R Y B R I E F | F U E L C E L L S & I N D U S T R I A L B A T T E R I E S | 15
stored so that it can be deployed at peak times.
Batteries will need to cost-effectively store utility-
scale electricity for hours, not just the minutes
currently economically viable for smoothing out
small-scale demand fluctuations.79
There also needs to be significant price decreases
to accompany the innovation in energy storage
densities and efficiencies. Battery storage will
have to cost around $100/kWh to make storing
utility-scale energy viable. Currently, costs for this
type of technology are hovering around
$700/kWh.80 However, industry researchers
project that these necessary advances will take
place: Navigant Research forecasts 21.8 GW of
energy storage systems will be installed globally
between 2013 and 2023, representing a
significant market opportunity.81 Greentech
Media, a renewable energy research group,
projects that 720 MW of distributed energy
storage will be deployed in the U.S. alone
between 2014 and 2020. This would represent a
34 percent compound annual growth rate.82
China BAK Battery, in its FY2013 Form 10-K,
disclosed the inherent risks associated with rapid
technological shifts and the importance of
remaining competitive through product
innovation: “Accordingly, our significant
investment in our R&D infrastructure may not
bear fruit. On the other hand, our competitors
may improve their technologies or even achieve
technological breakthroughs that would render
our products obsolete or less marketable.”83
Companies in this segment of the industry must
invest heavily in R&D to remain competitive.
Ultralife spent $7.2 million in 2012 and $5.9
million in 2013 on R&D.84 This represents 7
percent and 7.5 percent, respectively, of their
revenue in those years.85
Innovations are also occurring in small-scale
battery storage. In 2014, Flux Power developed a
lithium-ion battery for forklifts, which it claims
significantly outperforms the industry standard
lead-acid battery. The company claims the battery
is capable of more than 2,000 charge cycles, as
opposed to the standard 500 charge cycles for
lead-acid batteries, and can last up to 25 percent
longer between charges.86 These types of
innovations significantly decrease a customer’s
cost of ownership. Companies that are successful
in offering these innovative types of products will
gain market share.
Innovation may be related not only to improving
performance characteristics of products but also
to inventing new applications for fuel cells and
industrial batteries. For example, FuelCell Energy
developed a new battery that utilizes emissions
from coal- or gas-fired power plants instead of
ambient air. The technology can destroy
approximately 70 percent of smog-producing
pollutants, such as NOx, and capture up to 90
percent of carbon emissions. At the same time,
the new battery’s power output has been
increased by 80 percent, for only about a 30
percent increase in costs, which is less than the
DOE’s target of $40/ton.87 In 2015 the DOE
selected FuelCell Energy for a cost-sharing carbon
capture project, sponsored by the National Energy
Technology Laboratory, with an outlay of $23.7
million. In the second phase of the project, 700
tons of CO2 per day is expected to be captured
and 648,000 kWh of “ultra-clean” power per day
to be generated.88
According to FuelCell Energy’s statement on its
2015 third quarter earnings call, both utility and
energy companies have expressed broad interest
in this technology. Plant operators may capitalize
on their investment by selling generated
electricity. Another advantage is the ability to
install it incrementally, which helps to cost-
efficiently reduce emissions. FuelCell Energy is
currently in discussions regarding carbon capture

I N D U S T R Y B R I E F | F U E L C E L L S & I N D U S T R I A L B A T T E R I E S | 16
with “several of the top U.S. utilities,” which may
help the company to expand its market share in
this segment.89
Value Impact
With rising energy costs and attention focused on
reducing global GHG emissions, there is
increasing market demand for energy storage and
supply technologies that reduce the total cost of
ownership for customers, help customers reduce
their environmental footprint, and enable greater
integration of renewable energy technologies into
the grid.
Companies that invest their R&D resources in
improving their products’ storage capabilities and
energy efficiencies will both contribute to
lowering environmental impacts as well as enjoy a
competitive advantage by lowering customers’
total cost of ownership and enabling them to
meet their GHG reduction targets. This can drive
greater market share and revenue growth for
innovative companies that improve their products’
environmental attributes. Breakthrough
technologies in this regard could dramatically
lower companies’ risk profile and cost of capital.
The probability and magnitude of impacts from
this issue are likely to increase over time as
alternative energy technologies become more
cost-competitive and GHG emissions reduction
increases in urgency.
Product End-of-life Management
As the rate of adoption for fuel cells and
industrial batteries increases and more products
reach the end of life, it will become increasingly
important to ensure that product design is
maximized for end-of-life management and
materials efficiency. Fuel cells and batteries
contain hazardous materials, which, at the end of
life of these products, can leach into the
environment if products are improperly disposed
of. This can pose significant human health and
environmental risks, with possible regulatory
impacts for companies in some regions. While
recycling or reuse of batteries and fuel cells is
critical to minimizing these impacts, such
processes themselves pose hazards to workers at
recycling plants and neighboring communities, as
mentioned above in the topic on Workforce
Health & Safety.
Effective design for disassembly and reuse or
recycling will be a key element for ramping up
these recovery rates in order to reduce the
lifecycle impacts of fuel cells and batteries and
mitigate the strain of new production on natural
resources. The role of fuel cell and industrial
battery manufacturers is therefore critical in the
process of designing products for reuse,
modularity, and/or recycling. Companies can also
create take-back programs and/or work with
trusted third-party recycling companies to ensure
safe disposal and reuse of their products.
Proper management of the issue can reduce
negative environmental impacts from the industry
value chain. The emergence of several laws
regarding the end-of-life phase of batteries has
recently heightened the importance of the issue,
creating potential added costs of managing risks
as well as opportunities through regulatory
incentives. Furthermore, given input price
volatility and resource constraints, fuel cell and
industrial battery companies that are able to
develop take-back and recycling systems and
reuse some of the recovered materials in
manufacturing are likely to improve their long-
term operational efficiency and improve their risk
profile.
Company performance in this area can be
analyzed in a cost-beneficial way through the
I N D U S T R Y B R I E F | F U E L C E L L S & I N D U S T R I A L B A T T E R I E S | 17
following direct or indirect performance metrics
(see Appendix III for metrics with their full detail):
• Percentage of products sold that are
recyclable or reusable;
• Weight of end-of-life material recovered,
percentage of recovered materials that
are recycled; and
• Discussion of approach to manage use,
reclamation, and disposal of hazardous
materials.
Evidence According to industry analysts, the major barrier
for fuel cell adoption is “high capital costs and
the low costs of incumbents.”90 The relatively
high cost of fuel cells is due, in part, to the
expensive material inputs for manufacturing fuel
cell products. Companies that can reduce input
costs through innovative design and supply chain
efficiency for the reuse and recycling of their
products could therefore gain a competitive
advantage by passing through lower costs to their
customers.
Recycling rates and amounts of materials
recovered from this industry vary by country.
Europe currently recycles 1,000 to 2,000 metric
tons of lithium-ion batteries every year. However,
the European Association for Advanced
Rechargeable Batteries estimates that recycling
rates could reach 10,000 metric tons a year within
the next decade.91
Companies that work to recycle and reuse
products and develop cleaner energy-generating
and storage processes can take advantage of
stimulus incentives such as 2009’s ARRA.92 East
Penn Manufacturing Company is an example of a
battery company with fully integrated recycling
facilities that received a $32.5 million grant from
the U.S. Department of Energy, as part of ARRA,
to expand its production facilities.93 Through the
use of vertically integrated recycling facilities, East
Penn Manufacturing is able to provide a full-
service product take-back offering to its
customers while also securing key inputs for
future products. The company’s lead smelter and
refinery recycles virtually 100 percent of every
lead-acid battery component brought to the
facility, avoiding hazardous acid disposal and risks
through reuse.94
Platinum is considered to be a key material whose
costs and limited availability are reducing the
widespread development of fuel cells (particularly
PEM cells).95 It is estimated that approximately 46
grams of platinum are needed to power a 50 kW
fuel cell. This would cost approximately $2,200,
according to recent price estimates,96 as platinum
is a precious metal that is considered to be a
limited resource and is found only in South Africa
and Russia. Fuel cells and other demands for
platinum are expected to raise these prices even
higher as the market continues to expand. Given
the price and resource constraints of platinum,
some estimate that a fuel cell–leasing scenario
could help reduce the up-front price of platinum
by as much as 40 percent because of improved
recovery processes.97
In addition to cost savings and improved
competitiveness, having an effective product
design and programs for recycling and take-back
can help companies proactively mitigate risks from
expanding regulations related to product end of
life. As discussed earlier in the Legislative and
Regulatory Trends section, under the E.U.
Directive for Waste Batteries and Accumulators,
producers have a duty to take back discarded
industrial batteries from any end-user free of
charge. In assessing the economic impacts of this
directive, the E.U. Commission estimated that
collection and recycling costs represented 1.5 to
25 percent of a battery’s sale price, depending on
the type of battery and on specific collection
targets. The E.U. Commission also estimated that

I N D U S T R Y B R I E F | F U E L C E L L S & I N D U S T R I A L B A T T E R I E S | 18
in a scenario of shared responsibility, where costs
would be distributed between producers, public
authorities, and retailers, costs paid by producers
would vary between 1.5 and 5.5 euro cents per
unit sold.98
Fuel cell power plants may create various
environmental externalities at the end of their
lifecycle if not decommissioned properly. In its
FY2014 Form 10-K, FuelCell Energy stated that
the company refurbishes and reuses certain parts
of its power plants at the end of their useful lives,
supporting the “cradle-to-cradle” concept: “The
balance of plant has an operating life of twenty to
twenty-five years, at which time metals such as
steel and copper can be reclaimed for scrap
value.”99 These practices may reduce not only
regulatory risks associated with environmental
and social externalities but also the cost of
production and the exposure to volatile metal
prices.
With the increasing focus on lifecycle
environmental impacts of products within the U.S.
and other regions, similar regulations, like the
New York State Rechargeable Battery Recycling
law, could expand to new jurisdictions in the
future, creating additional regulatory risks for
companies. Some companies in the industry have
started providing investors with disclosure around
this issue in their annual SEC filings. For example,
in its FY2013 Form 10-K, Ultralife stated that it is
committed to responsible product stewardship
and ongoing compliance with domestic and
international battery recycling laws. The company
also mentioned that it continued “to evaluate the
impact of these regulations, and actual costs
could differ from [their] current estimates and
additional laws could be enacted by these and
other states which entail greater costs of
compliance.”100 Specifically, Ultralife is subject to
compliance with the E.U. Directive for Waste
Batteries and Accumulators and is required to
meet mandated targets for collection and
recycling of batteries. The directive also sets rules
on the labeling of batteries and their removability
from equipment to facilitate their reuse and safe
disposal.101
Value Impact
Product end-of-life issues can affect the cost
structure and revenue expansion of companies
over time. They can also potentially lead to acute
impacts on cash flows through regulatory
penalties or the introduction of new regulations
on end-of-life management.
While product and business model innovations to
improve the recyclability, recycling or reuse of
products can lead to additional R&D expenses in
the short term, such innovations can drive
competitiveness and revenue growth in the
medium term. In addition, recovery and recycling
of critical materials can help manufacturers of fuel
cells and industrial batteries achieve significant
cost savings and insulate themselves from the risk
of rising prices or the unavailability of key
materials. Companies with effective end-of-life
management and recycling programs could face
lower costs of capital given their lower supply
risks.
Stricter regulations around end-of-life
management require higher recyclability and
recycling rates of fuel cells and batteries. These
regulations can affect demand and increase
compliance costs for companies in this industry.
Noncompliance with regulations may lead to civil
penalties and extraordinary expenses.
The percentage of recyclable products indicates
how well companies are positioned to respond to
increased demand for these products. The usage
by weight of recycled or remanufactured materials
in products indicates a company’s performance in
operational and resource efficiency.

I N D U S T R Y B R I E F | F U E L C E L L S & I N D U S T R I A L B A T T E R I E S | 19
The probability and magnitude of impacts from
this issue are likely to increase in the medium
term with more stringent and new end-of-life
regulations being introduced and with increasing
supply constraints and higher prices of key input
materials.
LEADERSHIP AND GOVERNANCE
As applied to sustainability, governance involves
the management of issues that are inherent to the
business model or common practice in the
industry and are in potential conflict with the
interest of broader stakeholder groups
(government, community, customers, and
employees). They therefore create a potential
liability or, worse, a limitation or removal of
license to operate. This includes regulatory
compliance, lobbying, and political contributions.
It also includes risk management, safety
management, supply chain and resource
management, conflict of interest, anti-competitive
behavior, and corruption and bribery.
Fuel cell and industrial battery companies rely on
increasingly complex and geographically diverse
supply chains for critical material inputs,
magnifying the risks of supply disruptions. Rapid
industry growth and, therefore, increasing
demand for critical materials is likely to create
additional environmental and social externalities
that could pose additional supply risks to
companies. Effective materials sourcing practices
that mitigate supply risks will play an increasingly
important role in creating shareholder value in the
industry, as the supply chain and regulatory
environments are constantly shifting.
Materials Sourcing
Manufacturing certain types of industrial batteries
and fuel cells requires an available supply of
materials such as lithium, cobalt, nickel, and
platinum. In some applications, gold, tantalum,
and tin may be necessary to their functionality or
production. Access to these materials is critical for
the continuous development and scaling of clean
energy technologies like fuel cells and industrial
batteries.
Limited global resources of these materials, as
well as their concentration within particular
countries that may have poor governance
structures or are the subject of geopolitical
tensions, expose fuel cell and industrial battery
companies to the risk of supply chain disruptions
and input price increases or volatility. Moreover, a
company’s reputation can be damaged if it uses
gold, tantalum, tin, or other minerals originating
from conflict zones.
The use of such minerals from certain conflict
zones also exposes fuel cell and industrial battery
companies to regulatory risks associated with the
Dodd-Frank Act (see the Legislative and
Regulatory Trends section above for details). To
the extent that a fuel cell or industrial battery
manufacturer, foreign or domestic, files reports
with the SEC and considers tin, tantalum,
tungsten, or gold (3TG) as “necessary to the
functionality or production” of its products, the
company is required to provide disclosures around
the origin of the minerals in accordance with act’s
conflict minerals provision.102 This requires active
monitoring of the supply chain.
Companies face pressure from legislators,
nongovernmental organizations, and peers to
track and eliminate the use of tin, tantalum,
tungsten, and gold responsible for conflict in the
DRC. The limited availability of suppliers that can
provide certified conflict-free minerals presents
supply constraint risks to companies in the
industry, as well as puts upward pressure on
material prices.
I N D U S T R Y B R I E F | F U E L C E L L S & I N D U S T R I A L B A T T E R I E S | 20
While lithium battery manufacturing is likely to
currently account for the industry’s largest
volume, as well as variety, of critical materials—
including lithium, nickel, and cobalt—used in
manufacturing, the innovation and growth in fuel
cell technology could contribute to the rising
demand for platinum. Although platinum is
usually used in much lower quantities, it is a
significantly more expensive metal than lithium,
cobalt, and nickel per unit of weight.
As the market for fuel cells and industrial
batteries expands, there will likely be an increase
in demand for critical and conflict-free minerals.
Moreover, competition from other industries that
utilize the same critical materials and/or employ
fuel cell and battery technologies is likely to
exacerbate supply risks. Fuel cell and industrial
battery companies with strong supply chain
standards and the ability to adapt to increasing
resource scarcity will be better positioned to
protect shareholder value. Innovations at the
design phase to reduce dependence on some of
these materials will help lower risk. Companies
that are able to limit the use of critical and
conflict materials, as well as secure their supply of
the materials they do use, will not only minimize
environmental and social externalities related to
extraction but also protect themselves from supply
disruptions, volatile input prices, and reputational
and regulatory risks.
Company performance in this area can be
analyzed in a cost-beneficial way through the
following direct or indirect performance metrics
(see Appendix III for metrics with their full detail):
• Percentage of materials costs for critical
materials;
• Percentage of tungsten, tin, tantalum,
and gold smelters within the supply chain
that are verified conflict-free; and
• Discussion of the management of risks
associated with the use of critical
materials and conflict minerals.
Evidence
According to the RAND National Defense
Research Institute, a high percentage of material
resources critical to U.S. manufacturing is
imported. In a 2013 RAND report focusing on
materials for which the dominant producer is
outside the U.S., the U.S. has appreciable net
imports, and dominant producers have shortfalls
in quality of governance, the materials identified
as critical include lithium, nickel, cobalt, tungsten,
and tantalum, all of which are used in certain
types of fuel cells or batteries. The report notes
that almost 53 percent of cobalt reserves are
located in the DRC; 37.4 percent of lithium is
produced in Chile, and more than 50 percent of
global lithium reserves are located in Bolivia.103
Russia, Indonesia, and Philippines control 42.4
percent of nickel reserves; Brazil, Mozambique,
and Rwanda account for more 60 percent of
tantalum production; and China alone has 85.8
percent of global tungsten reserves. Some of
these countries impose production controls and
export restrictions such as quotas and tariffs,
which, in light of increasing demand for these
materials, have had a significant impact on price
and availability. For example, between 2010 and
2011 the price of rare earth metals doubled. In
extreme cases (as with lanthanum and cerium, for
example) the price of materials rose by up to 900
percent.104
Platinum is another metal for which reserves and
production are concentrated within a few
geographic locations. It is a key resource that is
used in the production of fuel cells and can pose
sourcing risks. According to the British Geological
Survey, the Bushveld Complex in South Africa
accounts for approximately 90 percent of global
platinum resources and 80 percent of global
I N D U S T R Y B R I E F | F U E L C E L L S & I N D U S T R I A L B A T T E R I E S | 21
production of the metal. The British Geological
Survey expects demand for platinum, and possibly
palladium, which is a platinum group metal
(PGM), to be driven primarily by growth in the
fuel cell sector, where PGMs are used as catalysts.
As demand for platinum increases, such a high
concentration of production could represent
serious risks to companies in the industry. In the
late 2000s, South African platinum production
declined as a result of unscheduled maintenance
shutdowns, geological problems, and labor
disputes. Undersupply caused a deficit of 375,000
ounces of platinum in 2008 and resulted in a
significant increase in the price of the material.105
Plug Power has identified platinum as a key
resource in its PEM fuel cell, noting, “Platinum is
a scarce natural resource and we are dependent
upon a sufficient supply of this commodity. Any
shortages could adversely affect our ability to
produce commercially viable fuel cell systems and
significantly raise our cost of producing our fuel
cell systems.”106
In the Fuel Cells & Industrial Batteries industry,
lithium and lithium-ion battery manufacturing
account for the largest amount by volume of
critical materials used. Lithium, nickel, and cobalt
are the primary metals utilized by these
companies. The segment has been growing at
double-digit rates, and this growth is expected to
continue. Automotive applications account for
approximately 70 percent of the lithium-ion
batteries segment by revenue.107 Ramping up the
production of electric vehicles (as well as other
clean energy technologies) is likely to present a
risk to manufacturers of fuel cells and industrial
batteries, as it significantly increases the
competition for critical materials.
In 2014, electric car manufacturer Tesla revealed
its plans for developing a gigafactory that would
manufacture lithium-ion batteries to power its
vehicles. The company estimates that it will
produce enough batteries to power 500,000 Tesla
vehicles by 2020.108 Goldman Sachs estimates that
Tesla’s gigafactory would use up to 17 percent of
the existing lithium supply.109
Although lithium reserves are geographically
concentrated, with 70 percent of the
economically accessible supply coming from
Argentina, Bolivia, and Chile, experts see a lower
risk of supply constraints compared with those for
nickel and cobalt, as these countries have
“differing political agendas” and are not expected
to impose export restrictions.110 But the political
situation could change in the future, posing a risk
to the lithium supply. Several years ago, President
Evo Morales of Bolivia (a country that has 73
million metric tons of lithium reserves), claimed
that the reserves were going to be nationalized as
a permanent reserve of the state.111 With
increasing demand for lithium and only a few key
producers dominating the market, the price of
lithium increased almost tenfold, rising from $350
per ton to nearly $3,000 between 2005 and
2010.112 Demand from companies like Tesla
continues to put upward pressure on the price of
lithium. In 2015, one ton of lithium carbonate
sells from anywhere between $6,500 and
$7,000.113
A 2011 study by PricewaterhouseCoopers
demonstrates the importance of managing critical
materials constraints for companies in renewable
energy and automobile industries, among others.
In the report, platinum and lithium are included as
“energy critical” elements, as identified by the
American Physical Society, because of their
importance for fuel cells and batteries
manufacturing.114
While nickel reserves are not as concentrated in a
single county, some producing countries may
impose restrictions affecting the market for the

I N D U S T R Y B R I E F | F U E L C E L L S & I N D U S T R I A L B A T T E R I E S | 22
metal. For example, in 2014, a ban on nickel
exports from Indonesia resulted in a price increase
from $13,000 a ton to $21,000.115
As mentioned earlier, the DRC controls significant
reserves of cobalt. According to the CIA World
Factbook, the DRC is characterized by “an
uncertain legal framework, corruption and a lack
of transparency.”116
In the DRC and certain other regions of the world,
the mining and sale of conflict minerals such as
tantalum, tin, tungsten, and gold, in addition to
cobalt and other minerals, provides funding for
armed conflicts, and the mining is carried out
under conditions that violate human rights. Some
electronic components in fuel cells and industrial
batteries use such minerals, thus exposing the
companies in this industry not only to regulatory
risk associated with the conflict minerals rule of
the Dodd-Frank Act but also to input price
volatility and reputational risks.117 Besides control
over a significant share of cobalt supply, the DRC
accounts for 6 to 8 percent of global tin
production, 15 to 20 percent (or 8.6 percent in
2009, according to the U.S. Geological Survey) of
tantalum, and 2 to 4 percent of the global
tungsten supply. Global input prices of 3TG have
shown high volatility, sometimes related to the
conflict in the DRC. A 31 percent increase in tin
prices in 2008 coincided with a rebel offensive
against the DRC’s primary tin-trading center. The
price of tantalum, a mineral used in electronics
that are a part of various fuel cell and battery
components, rose from $110 per kilogram in
2011 to nearly $300 in 2012 because of supply
constraints and rising demand.118
To mitigate the risks of potential supply disruption
and eliminate the use of materials produced in
war zones, Tesla sources its cobalt from the
Philippines and is looking into developing cobalt
mining in the U.S.119
There is mounting evidence of interest from
companies and investors in the use of conflict
minerals. Major players in the industry, such as
EnerSys, Ultralife, and Arotech Corporation,
already provide disclosure on this issue to
investors in their Forms 10-K and SD.120 For
example, Arotech Corp stated, “These new
requirements [disclosure requirements under the
Dodd-Frank Act] could affect the pricing, sourcing
and availability of minerals used in the
manufacture of our products. There will be
additional costs associated with complying with
the disclosure requirements, such as costs related
to determining the source of any conflict minerals
used in our products.”121
EnerSys’s Conflict Minerals Report states that
metals tin, tantalum, and gold are commonly used
in circuit boards, resistors, capacitors, and
transformers that are needed to manufacture
battery chargers.122 In its FY2014 Form 10-K,
EnerSys stated that compliance with the Dodd-
Frank Act disclosure requirements may have an
impact on the sourcing and availability of minerals
used in manufacturing its products. According to
the company, only a limited number of suppliers
may be able to provide conflict-free metals, which
presents availability and price risks. Compliance
costs may also increase as regulations become
more stringent.123
The SEC estimates that it will cost the companies
subject to filing reports with the agency a total of
$3 billion to $4 billion in the first year of reporting
and at least $200 million each year afterward to
comply.124 This cost will be spread across roughly
6,000 companies from multiple industries.125
As mentioned in the Industry Summary, to ensure
its long-term feasibility, the Fuel Cells & Industrial
Batteries industry needs to reduce costs of goods
sold and develop more efficient and cost-
competitive products. In the past decade, fuel cell

I N D U S T R Y B R I E F | F U E L C E L L S & I N D U S T R I A L B A T T E R I E S | 23
manufacturers have had some success in these
efforts. According to the DOE’s Office of Energy
Efficiency and Renewable Energy, the cost of
automotive fuel cell technology has fallen by
more than 50 percent since 2006 and by more
than 30 percent since 2008. Some of this cost
reduction can be attributed to minimizing the
amount of platinum used. The platinum content
of fuel cell catalysts was reduced by five times.126
Despite these successes, fuel cell manufacturers
face continuing challenges regarding their use of
platinum, as discussed earlier. According to the
chief engineer for General Electric’s Power
Conversion division, the low availability and high
cost of platinum are the main obstacles
preventing fuel cells from expanding as a mass-
market technology.127
Fuel cell companies may protect themselves from
price volatility and potential supply shortages by
recovering and recycling platinum. Up to 90
percent of platinum can be recycled at a fuel cell’s
end of life.128 The importance and financial
benefits of platinum recovery and recycling are
discussed in the Product End-of-life Management
topic above. Evolution in technology could further
reduce the amount of platinum needed to provide
catalytic activity in fuel cells. A recent research
paper from the Georgia Institute of Technology
discusses a new fabrication technique that could
increase platinum’s utilization efficiency by a
factor of seven, substantially reducing the amount
of metal required.129 Materials efficiency strategies
(such as those discussed in the previous topic), as
well as developing technologies that minimize the
amount of platinum used or that substitute it with
less expensive and more abundant materials,
could help fuel cells manufacturers gain a
competitive advantage.
Value Impact
Failure to effectively manage the sourcing of key
materials and to efficiently use them can result in
higher input costs or insufficient supply. This
could lead to lost revenue due to production
disruptions and affect operational efficiency.
Companies that do not verify sourcing or avoid
the use of conflict minerals may also face
regulatory compliance costs and reputational
risks, which could damage intangible assets and
long-term growth.
The increasing scarcity or unavailability of certain
key materials used by fuel cell and industrial
battery companies, as well as the price volatility of
such materials, can increase the risk profile and
cost of capital of those companies that rely
heavily on such materials and are unable to
source them effectively. Using critical materials
and conflict minerals more efficiently and
investing in R&D and capital expenditures to find
alternatives to them can mitigate the impacts of
such price increases and supply constraints.
As the Fuel Cells & Industrial Batteries industry
scales in size and the use of these key materials
becomes more prevalent, the industry is likely to
become more exposed to risks related to critical
and conflict minerals. Together with increasing
supply-demand gaps for such materials, this is
likely to increase the probability and magnitude of
impacts on company value in the medium term.
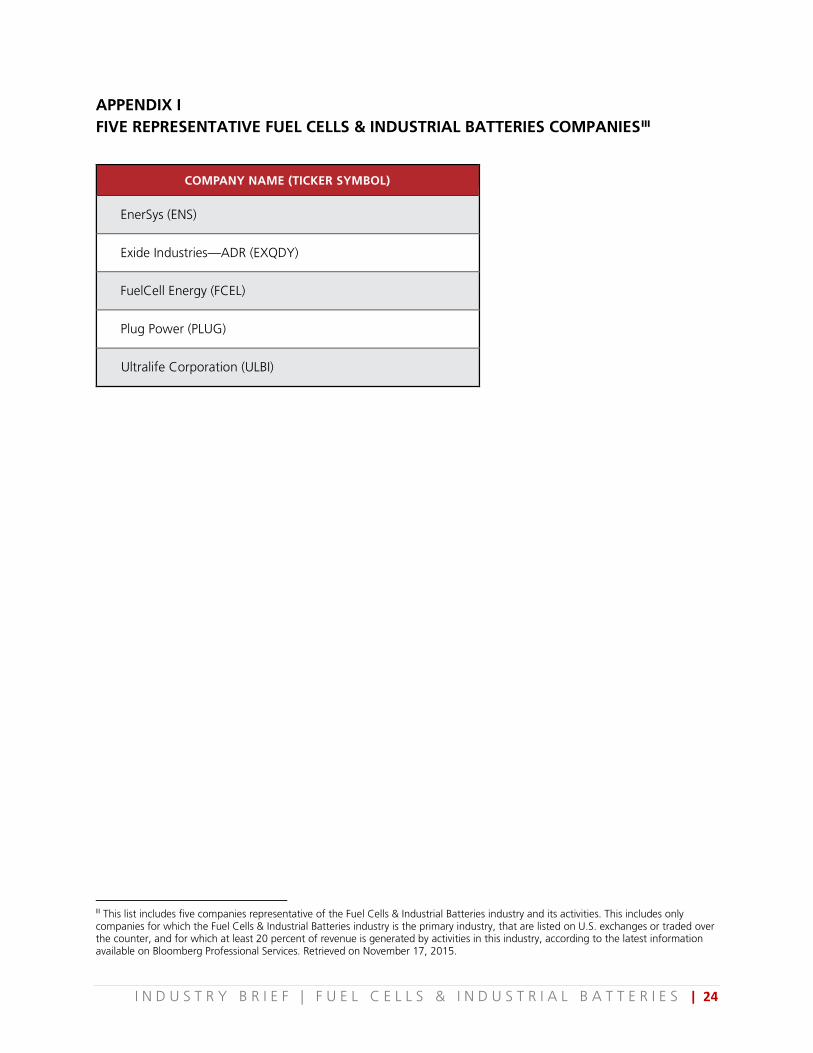
I N D U S T R Y B R I E F | F U E L C E L L S & I N D U S T R I A L B A T T E R I E S | 24
APPENDIX I FIVE REPRESENTATIVE FUEL CELLS & INDUSTRIAL BATTERIES COMPANIESIII
III This list includes five companies representative of the Fuel Cells & Industrial Batteries industry and its activities. This includes only companies for which the Fuel Cells & Industrial Batteries industry is the primary industry, that are listed on U.S. exchanges or traded over the counter, and for which at least 20 percent of revenue is generated by activities in this industry, according to the latest information available on Bloomberg Professional Services. Retrieved on November 17, 2015.
COMPANY NAME (TICKER SYMBOL)
EnerSys (ENS)
Exide Industries—ADR (EXQDY)
FuelCell Energy (FCEL)
Plug Power (PLUG)
Ultralife Corporation (ULBI)

25I N D U S T RY B R I E F | F U E L C E L L S & I N D U S T R I A L B AT T E R I E S
APPENDIX IIA: Evidence for Sustainability Disclosure Topics
Sustainability Disclosure Topics
EVIDENCE OF INTERESTEVIDENCE OF
FINANCIAL IMPACTFORWARD-LOOKING IMPACT
HM (1-100)
IWGsEI
Revenue & Cost
Asset & Liabilities
Cost of Capital
EFIProbability & Magnitude
Exter- nalities
FLI% Priority
Energy Management 75* 88 2 High • • Medium • Yes
Workforce Health & Safety 25 82 4t Medium • • Medium • Yes
Product Efficiency 88* 100 1 High • • High • • Yes
Product End-of-life Management 50 94 3 High • • Medium • Yes
Materials Sourcing 38 76 4t Medium • • • High • Yes
HM: Heat Map, a score out of 100 indicating the relative importance of the topic among SASB’s initial list of 43 generic sustainability issues. Asterisks indicate “top issues.” The score is based on the frequency of relevant keywords in documents (i.e., 10-Ks, 20-Fs, shareholder resolutions, legal news, news articles, and corporate sustainability reports) that are available on the Bloomberg terminal for the industry’s publicly listed companies. Issues for which keyword frequency is in the top quartile are “top issues.”
IWGs: SASB Industry Working Groups
%: The percentage of IWG participants that found the disclosure topic likely to constitute material information for companies in the industry. (-) denotes that the issue was added after the IWG was convened.
Priority: Average ranking of the issue in terms of importance. 1 denotes the most important issue. (-) denotes that the issue was added after the IWG was convened.
EI: Evidence of Interest, a subjective assessment based on quantitative and qualitative findings.
EFI: Evidence of Financial Impact, a subjective assessment based on quantitative and qualitative findings.
FLI: Forward Looking Impact, a subjective assessment on the presence of a material forward-looking impact.

26I N D U S T RY B R I E F | F U E L C E L L S & I N D U S T R I A L B AT T E R I E S
APPENDIX IIB: Evidence of Financial Impact for Sustainability Disclosure Topics
Evidence of
Financial Impact
REVENUE & EXPENSES ASSETS & LIABILITIES RISK PROFILE
Revenue Operating Expenses Non-operating Expenses Assets Liabilities
Cost of Capital
Industry Divestment
RiskMarket Share New Markets Pricing Power
Cost of Revenue
R&D CapExExtra-
ordinary Expenses
Tangible Assets
Intangible Assets
Contingent Liabilities & Provisions
Pension & Other
Liabilities
Energy Management • • •
Workforce Health & Safety • • •
Product Efficiency • • • • •
Product End-of-life Management • • • • •
Materials Sourcing • • • • •
H IGH IMPACTMEDIUM IMPACT

I N D U S T R Y B R I E F | F U E L C E L L S & I N D U S T R I A L B A T T E R I E S | 27
APPENDIX III SUSTAINABILITY ACCOUNTING METRICS—FUEL CELLS & INDUSTRIAL BATTERIES
TOPIC ACCOUNTING METRIC CATEGORY UNIT OF
MEASURE CODE
Energy Management
Total energy consumed, percentage grid electricity, percentage renewable
Quantitative Gigajoules (GJ), Percentage (%)
RR0104-01
Workforce Health & Safety
(1) Total recordable injury rate (TRIR) and (2) fatality rate Quantitative Rate RR0104-02
Discussion of efforts to assess, monitor, and reduce exposure of workforce to human health hazards
Discussion and Analysis
n/a RR0104-03
Product Efficiency
Average storage capacity of batteries, by product application and technology type Quantitative
Specific energy (Wh/kg) RR0104-04
Average energy efficiency of fuel cells as (1) electrical efficiency and (2) thermal efficiency, by product application and technology type
Quantitative Percentage (%) RR0104-05
Average battery efficiency as coulombic efficiency, by product application and technology type
Quantitative Percentage (%) RR0104-06
Average operating lifetime of fuel cells, by product application and technology type
Quantitative Hours (h) RR0104-07
Average operating lifetime of batteries, by product application and technology type
Quantitative Number of cycles
RR0104-08
Product End-of-life Management
Percentage of products sold that are recyclable or reusable Quantitative Percentage (%) by weight RR0104-09
Weight of end-of-life material recovered, percentage of recovered materials that are recycled
Quantitative Metric tons (t), Percentage (%) RR0104-10
Discussion of approach to manage use, reclamation, and disposal of hazardous materials
Discussion and Analysis n/a RR0104-11
Materials Sourcing
Percentage of materials costs for items containing critical materials Quantitative Percentage (%) RR0104-12
Percentage of tungsten, tin, tantalum, and gold smelters within the supply chain that are verified conflict-free Quantitative Percentage (%) RR0104-13
Discussion of the management of risks associated with the use of critical materials and conflict minerals
Discussion and Analysis n/a RR0104-14
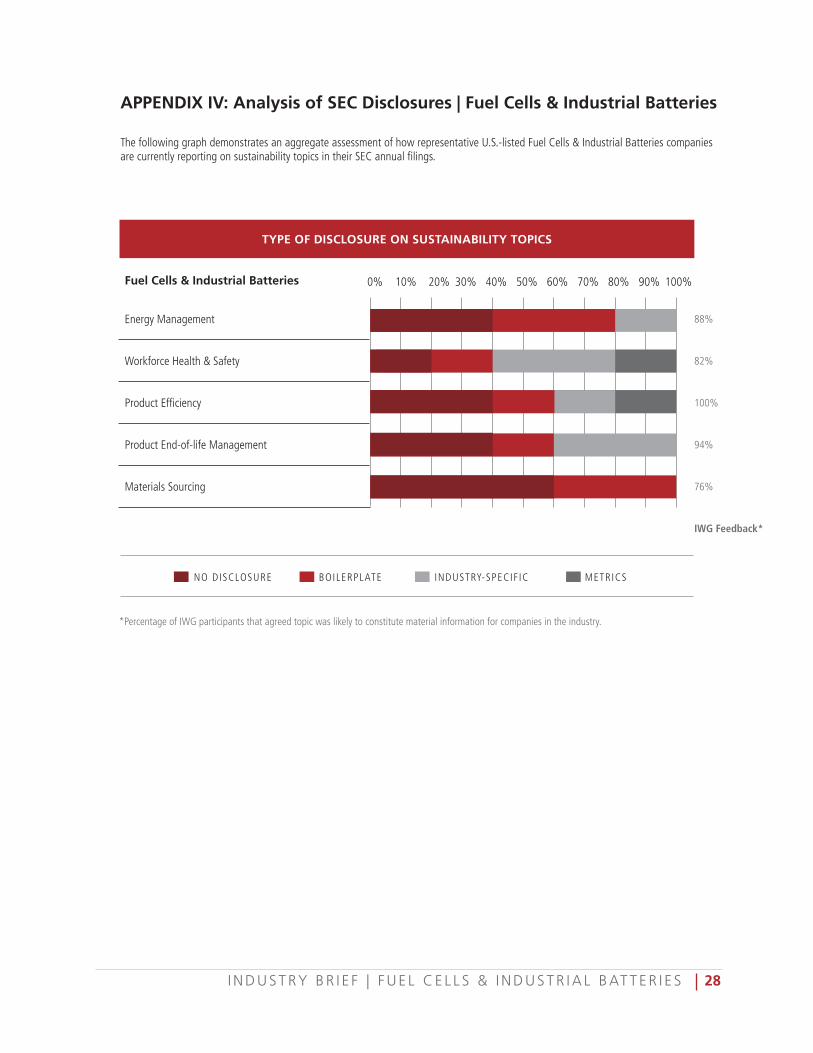
28I N D U S T RY B R I E F | F U E L C E L L S & I N D U S T R I A L B AT T E R I E S
APPENDIX IV: Analysis of SEC Disclosures | Fuel Cells & Industrial Batteries
The following graph demonstrates an aggregate assessment of how representative U.S.-listed Fuel Cells & Industrial Batteries companies are currently reporting on sustainability topics in their SEC annual filings.
Fuel Cells & Industrial Batteries
Energy Management
Workforce Health & Safety
Product Efficiency
Product End-of-life Management
Materials Sourcing
0% 10% 20% 30% 40% 50% 60% 70% 80% 90% 100%
TYPE OF DISCLOSURE ON SUSTAINABILITY TOPICS
NO DISCLOSURE BOILERPLATE INDUSTRY-SPECIF IC METRICS
88%
82%
100%
94%
76%
IWG Feedback*
*Percentage of IWG participants that agreed topic was likely to constitute material information for companies in the industry.
I N D U S T R Y B R I E F | F U E L C E L L S & I N D U S T R I A L B A T T E R I E S | 29
REFERENCES
1 “Types of Fuel Cells,” Fuel Cells 2000, accessed December 12, 2014, http://www.fuelcells.org/base.cgim?template=types_of_fuel_cells. 2 Ibid. 3 Ibid. 4 “BU-103: Global Battery Markets,” Battery University, accessed January 20, 2015, http://batteryuniversity.com/learn/article/global_battery_markets. 5 Ibid. 6 Ibid. 7 Ibid. 8 Vishal Sapru, “Opportunities in the Stationary Lead Acid Batteries Market,” Energy and Power Systems, May–June 2012, accessed January 20, 2015, http://www.batterypoweronline.com/main/markets/batteries/opportunities-in-the-stationary-lead-acid-batteries-market. 9 “Battery Energy Storage for Smart Grid Applications,” EUROBAT, May 2013, accessed January 20, 2015, http://www.eurobat.org/sites/default/files/eurobat_smartgrid_publication_may_2013_0.pdf. 10 “About Ultralife,” Ultralife, accessed January 29, 2015, http://ultralifecorporation.com/aboutus/. 11 Author’s calculation based on data from Bloomberg Professional service, accessed September 24, 2015, using Equity Screen (EQS) for companies listed on U.S. exchanges that generate at least 20 percent of revenue from their Fuel Cells & Industrial Batteries segment and for which Fuel Cells & Industrial Batteries is a primary SICS industry. 12 Bloomberg Professional Service, accessed September 24, 2015, using ENS Equity FA GEO <GO> command. 13 EnerSys, FY2015 Form 10-K for the Period Ending March 31, 2015 (filed May 27, 2015), p. 22. 14 Author’s calculation based on data from FuelCell Energy, FY2014 Form 10-K for the Period Ending October 31, 2014 (filed January 9, 2015), p. 82. 15 Plug Power, FY2014 Form 10-K for the Period Ending December 31, 2014 (filed March 17, 2015), p. F-35. 16 Author’s calculation based on data from Bloomberg Professional service, accessed September 24, 2015, using the BICS <GO> command. The data represents global revenues of companies listed on global exchanges and traded over the counter (OTC) from the Fuel Cells & Industrial Batteries industry, using Levels 4 and 5 of the Bloomberg Industry Classification System. 17 Author’s calculation based on data from Bloomberg Professional service, accessed September 24, 2015, using Equity Screen (EQS) for U.S.-listed companies and those traded primarily over the counter (OTC) that generate at least 20 percent of revenue from their Fuel Cells & Industrial Batteries segment and for which Fuel Cells & Industrial Batteries is a primary SICS industry. 18 Brittany Carter, “Battery Manufacturing in the US,” IBISWorld, November 2014. 19 EnerSys, FY2015 Form 10-K for the Period Ending March 31, 2015 (filed May 27, 2015), p. 22; FuelCell Energy, FY2014 Form 10-K for the Period Ending October 31, 2014 (filed January 9, 2015), p. 13. 20 Author’s calculation based on data from Bloomberg Professional service, accessed September 24, 2015, using the BICS <GO> command. The data represents global revenues of companies listed on global exchanges and traded over the counter (OTC) from the Fuel Cells & Industrial Batteries industry, using Levels 4 and 5 of the Bloomberg Industry Classification System. 21 Carter, “Battery Manufacturing in the US.” 22 Author’s calculation based on data from Bloomberg Professional service, accessed September 24, 2015 using Equity Screen (EQS) for U.S.-listed companies and those traded primarily over the counter (OTC) that generate at least 20 percent of revenue from their Fuel Cells & Industrial Batteries segment and for which Fuel Cells & Industrial Batteries is a primary SICS industry. 23 Carter, “Battery Manufacturing in the US.” 24 “2013 Fuel Cell Technologies Market Report,” U.S. Department of Energy, accessed November 2014. 25 FuelCell Energy, FY2013 Form 10-K for the Period Ending October 21, 2013 (filed January 6, 2014). 26 Fuel Cell Today, “The Fuel Cell Today Industry Review 2013,” July 2013, http://www.fuelcelltoday.com/media/1889744/fct_review_2013.pdf.

I N D U S T R Y B R I E F | F U E L C E L L S & I N D U S T R I A L B A T T E R I E S | 30
27 “Joint Auctions: Background,” California Air Resources Board, accessed December 15, 2014, http://www.arb.ca.gov/cc/capandtrade/auction/joint_auctions.htm. 28 Kathy Chen and Stian Reklev, “China’s National Carbon Market to Start in 2016—Official,” Reuters, August 31, 2014, accessed December 29, 2014, http://www.reuters.com/article/2014/08/31/china-carbontrading-idUSL3N0R107420140831. 29 “Business Energy Investment Tax Credit (ITC),” Database of State Incentives for Renewables and Efficiency (DSIRE), March 3, 2014, accessed January 22, 2015, http://www.dsireusa.org/incentives/incentive.cfm?Incentive_Code=US02F&re=1&ee=1. 30 “About the Self-Generation Incentive Program,” California Public Utilities Commission, accessed January 22, 2015, http://www.cpuc.ca.gov/PUC/energy/DistGen/sgip/aboutsgip.htm. 31 “Recovery Act,” Energy.gov, accessed November 2, 2015, http://www.energy.gov/recovery-act. 32 “History of RCRA,” U.S. Environmental Protection Agency, accessed December 29, 2014, http://www.epa.gov/epawaste/laws-regs/rcrahistory.htm. 33 “Laws, Policies, and Guidance: CERCLA,” U.S. Environmental Protection Agency, accessed December 29, 2014, http://www.epa.gov/superfund/policy/index.htm. 34 “Emergency Planning and Community Right-to-Know Act,” U.S. Environmental Protection Agency, June 27, 2012, accessed January 25, 2015, http://www.epa.gov/agriculture/lcra.html. 35 “Permissible Exposure Limits (PELs),” OSHA, U.S. Department of Labor, 2014, accessed January 2, 2015, https://www.osha.gov/dsg/topics/pel/. 36 “SEC Adopts Rule for Disclosing Use of Conflict Minerals,” U.S. Securities and Exchange Commission, 2012, accessed December 12, 2014, http://www.sec.gov/News/PressRelease/Detail/PressRelease/1365171484002#.VIqjtXs9XIU. 37 “Waste Batteries: Producer Responsibility,” accessed December 11, 2014, https://www.gov.uk/waste-batteries-producer-responsibility#industrial-battery-producer-register. 38 Plug Power, Plug Power Sustainability Report, 2007, http://static.globalreporting.org/report-pdfs/2008/a66e2857516465ce95379d6a88daeea7.pdf. 39 Ibid. 40 Author’s calculation based on data from Bloomberg Professional service, accessed December 16, 2014, using Equity Screen (EQS) for U.S.-listed companies and those traded primarily over the counter (OTC) that generate at least 20 percent of revenue from their Fuel Cells & Industrial Batteries segment and for which Fuel Cells & Industrial Batteries is a primary SICS industry. 41 Author’s calculation based on data from “Annual Survey of Manufactures: General Statistics—Statistics for Industry Groups and Industries, 2011,” U.S. Census Bureau, released December 17, 2013, accessed December 19, 2014. 42 Ibid. 43 Ultralife Corp., FY2013 Form 20-F for the Period Ending December 31, 2013 (filed March 14, 2014). 44 Highway Holdings Company, FY2013 Form 20-F for the Period Ending March 31, 2013 (filed June 30, 2014). 45 Ibid. 46 FuelCell Energy, FY2014 Form 10-K for the Period Ending October 31, 2014 (filed January 9, 2015), p. 43. 47 Plug Power, Plug Power Sustainability Report, 2007, http://static.globalreporting.org/report-pdfs/2008/a66e2857516465ce95379d6a88daeea7.pdf. 48 Ibid. 49 Carter, “Battery Manufacturing in the US.” 50 “Green Job Hazards: Hydrogen Fuel Cells,” OSHA, accessed January 2, 2015, https://www.osha.gov/dep/greenjobs/hydrogen.html. 51 EnerSys, FY2015 Form 10-K for the Period Ending March 31, 2015 (filed May 27, 2015), p. 7. 52 Ibid., p. 22. 53 FuelCell Energy, FY2014 Form 10-K for the Period Ending October 31, 2014 (filed January 9, 2015), p. 13. 54 Data from internal review of filings of companies in the Fuel Cells & Industrial Batteries industry. 55 “OSHA’s Hazard Communication Standard [CFR 1910. 1200],” Chemicalspill.org, http://www.chemicalspill.org/ChemicalsWorkPlace/osha.html.
I N D U S T R Y B R I E F | F U E L C E L L S & I N D U S T R I A L B A T T E R I E S | 31
56 “Permissible Exposure Limits,” OSHA, U.S. Department of Labor, 2014, accessed January 2, 2015, https://www.osha.gov/dsg/topics/pel/. 57 Ibid. 58 Occupational Lead Poisoning Prevention Program, “Revising the Workplace Lead Standards: At-a-Glance,” February 2014, http://www.cdph.ca.gov/programs/olppp/documents/LeadStdRev-At-A-Glance.pdf. 59 Ibid. 60 Ibid. 61 Ibid. 62 Ingfei Chen, “Outdated Lead Exposure Regulations Threaten Thousands of American Workers,” Scientific American, September 17, 2013, http://www.scientificamerican.com/article/outdated-lead-standards/. 63 “US Department of Labor’s OSHA Cites Georgia-based Exide Technologies for Exposing Workers to Dangerous Levels of Lead at Frisco, Texas, Facility,” OSHA, U.S. Department of Labor, August 4, 2011, accessed January 2, 2015, https://www.osha.gov/pls/oshaweb/owadisp.show_document?p_table=NEWS_RELEASES&p_id=20439. 64 Ibid. 65 EnerSys, FY2013 Form 10-K for the Period Ending March 31, 2014 (filed May 28, 2014). 66 Steven Church, “Exide Files for Bankruptcy after Losing Wal-Mart Business,” Bloomberg, June 10, 2013, accessed January 10, 2015, http://www.bloomberg.com/news/2013-06-10/exide-technologies-files-for-bankruptcy-in-delaware.html. 67 Jessica Garrison and Kim Christensen, “ Vernon Plant Closed Over Toxics,” LA Times, April 25, 2013, accessed December 11, 2015, http://articles.latimes.com/2013/apr/25/local/la-me-exide-arsenic-20130425. 68 Church, “Exide Files for Bankruptcy after Losing Wal-Mart Business.” 69 Benoit Caurette, “Cadmium à la Saft: le combat des contaminés,” Charente Libre, November 28, 2012, accessed January 22, 2015, http://www.charentelibre.fr/2012/11/28/cadmium-les-contamines-en-ordre-de-bataille,1127025.php. 70 P. Danko, “Hydrogen Fuel Cells Could Face Cost Roadblock,” EarthTechling, January 13, 2013, accessed January 12, 2015, http://earthtechling.com/2013/01/hydrogen-fuel-cell-future-facing-a-cost-roadblock/. 71 U.S. Department of Energy, “Ultra Efficient Combined Heat, Hydrogen, and Power System,” U.S. Department of Energy, August 2011, http://www.fuelcellenergy.com/assets/Combined-Heat-Hydrogen-and-Power.pdf. 72 Martin LaMonica, “GE Claims Fuel Cell Breakthrough, Starts Pilot Production,” IEEE Spectrum, July 25, 2014, accessed February 4, 2015, http://spectrum.ieee.org/energywise/green-tech/fuel-cells/ge-claims-fuel-cell-breakthrough-starts-pilot-production. 73 FuelCell Energy, FY2014 for the Period Ending October 31, 2014 (filed January 9, 2015), pp. 1–12. 74 “The Power of Innovation,” EnerSys, 2015. 75 Author’s calculation from data from Bloomberg Professional service accessed February 4, 2015, using the BI FA <GO> command. 76 “Next-Generation Advanced Batteries,” Navigant Research, 2014, accessed February 4, 2014, http://www.navigantresearch.com/research/next-generation-advanced-batteries. 77 “Advanced Batteries for Utility Scale Energy Storage Applications Will Surpass $2.5 Billion in Annual Revenue by 2023, Forecasts Navigant Research,” Navigant Research, February 18, 2014, accessed February 4, 2015, http://www.reuters.com/article/2014/02/18/co-navigant-research-idUSnBw185579a+100+BSW20140218. 78 Andrew Burger, “Demand for Grid Scale Energy Storage Grows,” October 2, 2014, accessed February 4, 2015, http://www.triplepundit.com/2014/10/demand-grid-scale-energy-storage-grows/. 79 Kevin Bullis, “New Battery Material Could Help Wind and Solar Power Go Big,” MIT Technology Review, January 8, 2014, accessed February 4, 2015, http://www.technologyreview.com/news/523251/new-battery-material-could-help-wind-and-solar-power-go-big/. 80 Ibid. 81 “Energy Storage for Wind and Solar Integration,” Navigant Research, 2013, accessed February 4, 2015, http://www.navigantresearch.com/research/energy-storage-for-wind-and-solar-integration. 82 Mike Munsell, “Commercial Energy Storage Market to Surpass 720WM by 2020,” Greentech Media, February 6, 2014, accessed February 4, 2015, http://www.greentechmedia.com/articles/read/Commercial-Energy-Storage-Market-to-Surpass-720-MW-by-2020. 83 ChinaBak Battery, Inc., FY2013 Form 10-K for the Period Ending September 30, 2013 (filed January 14, 2014), p. 15.

I N D U S T R Y B R I E F | F U E L C E L L S & I N D U S T R I A L B A T T E R I E S | 32
84 Ultralife, Corp., FY2013 Form 10-K for the Period Ending December 31, 2013 (filed March 14, 2014), p. 11. 85 Author’s calculation from data from Bloomberg Professional service accessed February 4, 2015, using the BI FA <GO> command. 86 “Innovative Lithium Energy Storage Solutions,” Flux Power Holdings, June 2014, pp. 5–6. 87 “Carbon Capture,” FuelCell Energy, Advanced Technologies, accessed October 1, 2015, http://www.fuelcellenergy.com/advanced-technologies/carbon-capture/. 88 “FuelCell Energy Selected for Carbon Capture Project by DOE,” Zacks Equity Research, September 2, 2015, accessed October 1, 2015, http://www.zacks.com/stock/news/188750/fuelcell-energy-selected-for-carbon-capture-project-by-doe. 89 FuelCell Energy, Q3 2015 Earnings Call, accessed via Bloomberg Professional Service. 90 Danko, “Hydrogen Fuel Cells Could Face Cost Roadblock.” 91 Mar Anderson, “Potential Hazards at Both Ends of the Lithium-ion Life Cycle,” March 1, 2013, accessed January 2, 2014, http://spectrum.ieee.org/green-tech/fuel-cells/potential-hazards-at-both-ends-of-the-lithiumion-life-cycle. 92 “Recovery Act,” U.S. Department of Energy, accessed January 20, 2015, http://www.energy.gov/recovery-act. 93 Carter, “Battery Manufacturing in the US.” 94 East Penn Manufacturing Co., “One Powerful Package Backed by One Powerful Company,” East Penn Manufacturing Co., Inc., June 2011, http://72.10.52.249/pdf/line_card/dekadifference.pdf. 95 F. Nores-Pondal et al., “Pt Recycling and Synthesis of New Catalysts for Its Reutilization in PEM Fuel Cells,” Electrochemical Society, accessed January 14, 2015, http://ma.ecsdl.org/content/MA2012-01/40/1527.full.pdf. 96 Ibid. 97 Ibid. 98 European Commission—Environment, “Impact Assessment on Selected Policy Options for Revision of the Battery Directive,” accessed February 4, 2015, http://ec.europa.eu/environment/waste/batteries/pdf/eia_batteries_final.pdf. 99 FuelCell Energy, FY 2014 Form 10-K for the Period Ending October 31, 2014 (filed January 9, 2015). 100 Ultralife Corp, FY2013 Form 10-K for the Period Ending December 31, 2013 (filed March 14, 2014). 101 Ultralife Corp, FY 2014 Form 10-K for the Period Ending December 31, 2014 (filed March 11, 2015). 102 “SEC Adopts Rule for Disclosing Use of Conflict Minerals,” U.S. Securities and Exchange Commission, 2012, accessed December 12, 2014, http://www.sec.gov/News/PressRelease/Detail/PressRelease/1365171484002#.VIqjtXs9XIU. 103 Jean Friedman-Rudovsky, “For Lithium Car Batteries, Bolivia Is in the Driver's Seat,” Time, January 22, 2009, accessed November 11, 2015, http://content.time.com/time/world/article/0,8599,1872561,00.html. 104 Richard Silberglitt, James T. Bartis, Brian G. Chow, David L. An, and Kyle Brady, “Critical Materials Present Danger to U.S. Manufacturing”, RAND National Defense Research Institute, 2013, http://www.rand.org/content/dam/rand/pubs/research_reports/RR100/RR133/RAND_RR133.pdf. 105 “Platinum,” British Geological Survey, Natural Environment Research Council, September 2009. 106 Plug Power, FY2013 Form 10-K for the Period Ending December 31, 2013 (filed March 31, 2014). 107 Brittany Carter, “Lithium Battery Manufacturing,” Industry Report OD4499, IBISWorld, February 2015. 108 Jack Kaskey and Simon Casey, “Tesla to Use North American Material Amid Pollution Worry,” Bloomberg, March 31, 2014, accessed November 11, 2015, http://www.bloomberg.com/news/articles/2014-03-28/tesla-to-use-north-american-material-amid-pollution-worry. 109 David Z. Morris, “The Era of the Electric Car Promises a Lithium Mining Boom, but New Lithium Startups Are Floundering,” Here’s Why,” Fortune, April 26, 2015, accessed November 11, 2015, http://fortune.com/2015/04/26/lithium-mining/. 110 Jason Deign, “Why Lithium Isn’t the Big Worry for Lithium-ion Batteries,” GreenTechMedia, June 23, 2015, accessed November 11, 2015, http://www.greentechmedia.com/articles/read/Why-Lithium-Isnt-the-Big-Worry-for-Li-ion. 111 Jean Friedman-Rudovsky, “For Lithium Car Batteries, Bolivia Is in the Driver's Seat,” Time, January 22, 2009, accessed January 11, 2015, http://content.time.com/time/world/article/0,8599,1872561,00.html. 112 Eitan Haddok, “Salt ’n Power: A First Look at the Lithium Flats of Bolivia,” Scientific American, March 18, 2010, accessed January 11, 2015, http://www.scientificamerican.com/article/lithium-flats-of-bolivia/. 113 Matt Badiali, “Demand Is Going Crazy for Lithium… Here Are Two of the Best Ways to Invest,” Crux, October 19, 2015, accessed November 18, 2015, http://thecrux.com/a-stealth-bull-market-is-starting-in-this-critical-metal-here-are-the-two-best-ways-to-invest/.

I N D U S T R Y B R I E F | F U E L C E L L S & I N D U S T R I A L B A T T E R I E S | 33
114 “Minerals and Metals Scarcity in Manufacturing: The Ticking Time Bomb,” PricewaterhouseCoopers, December 2011, accessed January 11, 2015, http://www.pwc.com/en_GX/gx/sustainability/researchinsights/assets/impact-of-minerals-metals-scarcity-on-business.pdf. 115 Jason Deign, “Why Lithium Isn’t the Big Worry for Lithium-Ion Batteries,” GreenTechMedia, June 23, 2015, accessed November 11, 2015, http://www.greentechmedia.com/articles/read/Why-Lithium-Isnt-the-Big-Worry-for-Li-ion. 116 “Democratic People's Republic of the Congo,” The World Factbook, U.S. Central Intelligence Agency, continually updated, accessed December 10, 2015, https://www.cia.gov/library/publications/the-world-factbook/geos/cg.html. 117 EnerSys, Conflict Minerals Report for the Period Ended December 31, 2014 (filed June 1, 2015). 118 Chelsea Craven, “Why US Tantalum Imports—and Prices—Are Skyrocketing,” Metal Miner, April 2013, accessed January 10, 2015. http://agmetalminer.com/2013/04/03/why-us-tantalum-imports-andprices-are-skyrocketing/. 119 Jack Kaskey and Simon Casey, “Tesla to Use North American Material Amid Pollution Worry”, Bloomberg, March 31, 2014, accessed November 11, 2015, http://www.bloomberg.com/news/articles/2014-03-28/tesla-to-use-north-american-material-amid-pollution-worry. 120 EnerSys, FY2013 Form 10-K for the Period Ending March 31, 2014 (filed May 28, 2014); Ultralife, FY2013 Form 10-K for the Period Ending December 31, 2013 (filed March 14, 2014); Arotech Corp., FY2013 Form 10-K for the Period Ending December 31, 2013 (filed March 31, 2014). 121 Arotech Corp., FY2013 Form 10-K for the Period Ending December 31, 2013 (filed March 31, 2014). 122 EnerSys, Conflict Minerals Report for the Period Ended December 31, 2014 (filed June 1, 2015). 123 EnerSys, FY 2015 Form 10-K for the Period Ending March 31, 2015 (filed May 27, 2015). 124 Jim Low, “Dodd-Frank and the Conflict Minerals Rule,” KPMG, 2012, accessed January 11, 2015, http://www.kpmg.com/US/en/IssuesAndInsights/ArticlesPublications/dod d-frank-series/Documents/dodd-frank-and-conflict-minerals-rule-q4.pdf. 125 Ibid. 126 “Fuel Cell Technologies Office Accomplishments and Progress,” Department of Energy, Office of Energy Efficiency and Renewable Energy, accessed November 11, 2015, http://energy.gov/eere/fuelcells/fuel-cell-technologies-office-accomplishments-and-progress. 127 “No Future for Hydrogen Fuel Cell Vehicles Due to Platinum Shortage, Says General Electric,” Ecomento, March 31, 2014, accessed October 5, 2015, http://ecomento.com/2014/03/31/no-future-for-hydrogen-fuel-cell-vehicles-due-to-platinum-shortage-says-general-electric/. 128 Ibid. 129 “Ultra-Thin Hollow Nanocages Could Reduce Platinum Use in Fuel Cell Electrodes,” Georgia Tech, July 23, 2015, accessed October 5, 2015, http://www.news.gatech.edu/2015/07/23/ultra-thin-hollow-nanocages-could-reduce-platinum-use-fuel-cell-electrodes.

SUSTAINABILITY ACCOUNTING STANDARDS BOARD®
1045 Sansome Street, Suite 450
San Francisco, CA 94111
415.830.9220
www.sasb.org
ISBN#: 978-1-940504-69-8
The content made available in this publication is copyrighted by the Sustainability Accounting Standards Board. All rights reserved. You agree to only use the content made available to you for non-commercial, informational or scholarly use within the organization you indicated you represent to keep intact all copyright and other proprietary notices related to the content. The content made available to you may not be further disseminated, distributed, republished or reproduced, in any form or in any way, outside your organization without the prior written permission of the Sustainability Accounting Standards Board. To request permission, please contact us at [email protected].