fuel from waste - catalytic degradation of plastic waste … · fuel from waste - catalytic...
TRANSCRIPT
Fuel from Waste - Catalytic degradation of plastic
waste to
liquid fuels
Agnieszka Ćwik
Thesis to obtain the Master of Science Degree in
Energy Engineering and Management
Examination Committee
Chairperson: Prof. José Alberto Caiado Falcão de Campos
Supervisors: Professor Maria Amelia Lemos , Prof. Teresa Grzybek
Member of the Committee: Prof. João Bordado, Prof. Maria de Fatima Montemor
February, 2014

2
3
Fuel from Waste - Catalytic degradation of plastic
waste to
liquid fuels
Ćwik Agnieszka
Supervisors: Professor Maria Amelia Nortadas Duarte de Almeida Lemos
Professor Francisco Manuel da Silva Lemos
Professor Teresa Grzybek
February, 2014

4

5
Acknowledgments
I would like to thank to Professor Amelia Lemos and Professor Francisco Lemos for the great
contributions to knowledge and guidance important for the preparation of this work. I really appreciate
their help, support and attention I had during this research work.
I would also like to acknowledge Professor Teresa Grzybek for her help, patience and
motivation, despite of the distance.
Therefore I would like to thank all people for encouragement and support during my research
work, special thanks to David and Andre. Also, I want to express my gratitude to other ‘Clean Coal’
Students for the motivation to finish this thesis.
At the end I would also mentioned my parents, thank them for their support and
encouragement in each step of working on this thesis.
To all of them, I would like to say my deepest thanks.

6
7
Acknowledgments
This thesis is based on work conducted within the KIC InnoEnergy Master School, in the MSc
programme Clean Coal Technologies. This programme is supported financially by the KIC
InnoEnergy. The author also received financial support from KIC InnoEnergy, which is gratefully
acknowledged.
KIC InnoEnergy is a company supported by the European Institute of Innovation and Technology
(EIT), and has the mission of delivering commercial products and services, new businesses,
innovators and entrepreneurs in the field of sustainable energy through the integration of higher
education, research, entrepreneurs and business companies. Shareholders in KIC InnoEnergy are
leading industries, research centres, universities and business schools from across Europe.
www.kic-innoenergy.com
The MSc programme Clean Coal Technologies is a collaboration of:
AGH University of Science and Technology, Kraków, Poland,
SUT Silesian University of Technology, Gliwice, Poland
IST Instituto Superior Tecnico, Lisbon, Portugal

8
9
Abstract
In this work, thermal and catalytic degradation of polypropylene with, and without additives
are analyzed using thermogravimetry (TG) and differential scanning calorimetry (DSC) methods under
a nitrogen atmosphere.
During the first part of the experiments the thermal pyrolysis of both types of polypropylene
was carried out using non-isothermal conditions, with different heating rates.
In the second part of the experiments the catalytic pyrolysis of the same polypropylenes was
analyzed using 3 groups of catalysts:
- zeolites, namely HZSM-5, HY, Beta and H-Beta
- vermiculites with supported metals, namely silver, zirconium, alumina and copper,
- montmorillonites, including Mt6OAlCu, K10 + Cu2+ and K10 Al Ag+.
From the results obtained, the zeolites were the most effective catalysts for the reduction of
the temperature of degradation. Montmorillonites were also somewhat effective for the polyolefin
pyrolysis. In contrast, vermiculites, particularly those with metal supported, showed an apparent
inactivity proving to be ineffective in the reduction of the temperature degradation.
The simultaneous use of the signals from the TG and DSC helped to develop a kinetic model
that is able to describe runs performed for the thermal degradation of both types of polypropylene.
Fitting this model to the experimental results allowed the estimation of several kinetic and
thermodynamics parameters associated with the degradation of polypropylene.
KEYWORDS: Polypropylene, kinetic modelling, thermal and catalytic degradation, differential
scanning calorimetry (DSC), thermogravimetry (TG), plastics, pyrolysis.

10
11
Resumo
Neste trabalho, são analisadas a degradação térmica e catalítica de polipropileno com e sem
aditivos utilizando a técnica de termogravimetria (TG) e o método de varrimento diferencial de
calorimetria (DSC), numa atmosfera de azoto.
Durante a primeira parte de experimentações foi efectuada a pirólise térmica de ambos os
tipos de polipropileno, em condições isotérmicas, com taxas de aquecimento diferentes.
Na segunda parte do trabalho, procedeu-se à análise da pirólise catalítica do polipropileno,
usando 3 grupos de catalisadores:
- Zeólitos, nomeadamente HZSM-5, HY, Beta e Beta-H;
- Vermiculites com metais de suporte, tais como a prata, o zircónio, alumina e cobre;
- Montmorillonites, incluindo Mt6OAlCu, K10+ Cu2
+ e K10 Al Ag
+ .
A partir dos resultados obtidos, os Zeólitos foram o catalisador mais eficaz para a redução da
temperatura de degradação. As Montmorillonites também foram precisos para a pirólise de
poliolefinas. Por outro lado, as Vermiculites, particularmente aqueles com metal suportado,
mostraram uma aparente inatividade e pouca eficácia na redução da degradação da temperatura.
O uso simultâneo dos sinais do TG e DSC ajudou no desenvolvimento de um modelo cinético
capaz de descrever a degradação térmica de ambos os tipos de polipropileno. Este modelo, depois
de aperfeiçoado, foi combinado com os resultados experimentais e capaz de estimar vários
parâmetros termodinâmicos e da cinética da reacção.

12

13
NOMENCLATURE
PP – Polypropylene PE – Polyethylene PVC – Polyvinylchloride PS – Polystyrene PET - Polyethylene Terephthalate MSW - Municipal Solid Waste DSC - Differential Scanning Calorimetry TA - Thermal Analysis TG – Thermogravimetry TGA - Thermogravimetric Analysis DFT - Density Functional Theory DTG - Derivative thermogravimetry Sext - External surface area N - Number of C-C bonds per unit mass n - Carbon atoms k(T) - Corresponding temperature-dependent rate constant Tref - Reference temperature chosen within the range of significant weight loss (573 K in this case) Ea - Apparent activation energy kref - Kinetic constant at the reference temperature (Tref) m - Weight of the sample Cp - Average heat capacity ΔHC-C - Average C-C bond enthalpy ΔHvap - Average vaporization enthalpy per unit mass k - Kinetic constant rate
n - Order of the reaction in respect to the polymer
m0 - Initial mass
14
X - Ratio between the solid weight loss at a given time and the initial solid weigh
Xmax - Maximum conversion that can be achieved
Tdegrad. - Degradation temperature
k0 - Pre-exponential factor
R - Universal gas constant (0.008314 kJ mol-1K-1).
ΔH - Reaction enthalpy,
VAP ΔH - Vaporization enthalpy
Cp - Heat capacity
ΔHf - Standard molar enthalpy of formation
15
General Index
CHAPTER 1. Introduction ..................................................................................................................... 21
1.1 Motivation and Objectives .................................................................................................... 21
1.2 Polymers ................................................................................................................................ 22
1.2.1 Polymers Classification .................................................................................................. 22
1.2.2 Plastic Consumption ...................................................................................................... 24
1.3 Environmental impact of plastic waste ................................................................................. 25
1.3.1 The economic and environmental factors .................................................................... 25
1.4 Depolymerisation of Polypropylene ...................................................................................... 26
1.4.1 Pyrolysis of Polypropylene ............................................................................................ 26
1.4.2 Thermogravimetric (TG) and Differential Scanning Calorimetric (DSC) analysis .......... 33
1.5 Catalysts ................................................................................................................................ 34
1.5.1 Zeolites .......................................................................................................................... 34
1.5.2 Vermiculites ................................................................................................................... 36
1.5.3 Montmorillonites ........................................................................................................... 38
CHAPTER 2. EXPERIMENTAL PROCEDURES AND APPARATUS .............................................................. 41
2.1 Polymer Materials ................................................................................................................. 41
2.2 Catalyst Materials .................................................................................................................. 41
2.2.1 Original catalysts specifications ................................................................................. 42
2.2.2 Preparation and Characterization ................................................................................ 42
2.3 Acid strength distribution ...................................................................................................... 43
2.4 General Gases specifications ................................................................................................. 45
2.5 Thermogravimetric (TG) and Differential Scanning Calorimetric (DSC) analysis ................. 45
2.5.1 Sample preparation ...................................................................................................... 45
2.5.2 Temperature Profile .................................................................................................. 45
2.5.3 Equipment .................................................................................................................. 46
CHAPTER 3. THERMAL PYROLYSIS OF POLYPROPYLENE ....................................................................... 49
3.1 Polypropylene with additives ................................................................................................ 50
3.1.1 Dynamic conditions at three different heating rates .................................................... 50
3.1.2 DSC/TG analysis ............................................................................................................. 50
3.2 Polypropylene without additives samples ............................................................................ 57
3.2.1 Dynamic conditions at three different heating rates ................................................... 57
3.3 Effect of polypropylene type ................................................................................................ 61
16
3.3.1 Degradation temperature ............................................................................................ 61
CHAPTER 4. CATALYTIC PYROLYSIS OF POLYPROPYLENE ..................................................................... 63
4.1 Vermiculites ........................................................................................................................... 64
4.1.1 DSC/TG analysis ............................................................................................................. 64
4.2 Zeolites .................................................................................................................................. 69
4.2.1 DSC/TG analysis ............................................................................................................. 69
4.3 Montmorillonites................................................................................................................... 73
4.3.1 DSC/TG analysis. ............................................................................................................ 73
4.4. Deactivation Studies. ............................................................................................................ 76
4.4.1 DSC/TG analysis. ........................................................................................................... 77
CHAPTER 5. Final Conclusions ............................................................................................................. 79
5.1 Achieved Results ................................................................................................................... 79
5.2 Future Trends ........................................................................................................................ 80
Bibliography ........................................................................................................................................... 81
APPENDIX A. DATA ANALYSIS ................................................................................................................ 86
17
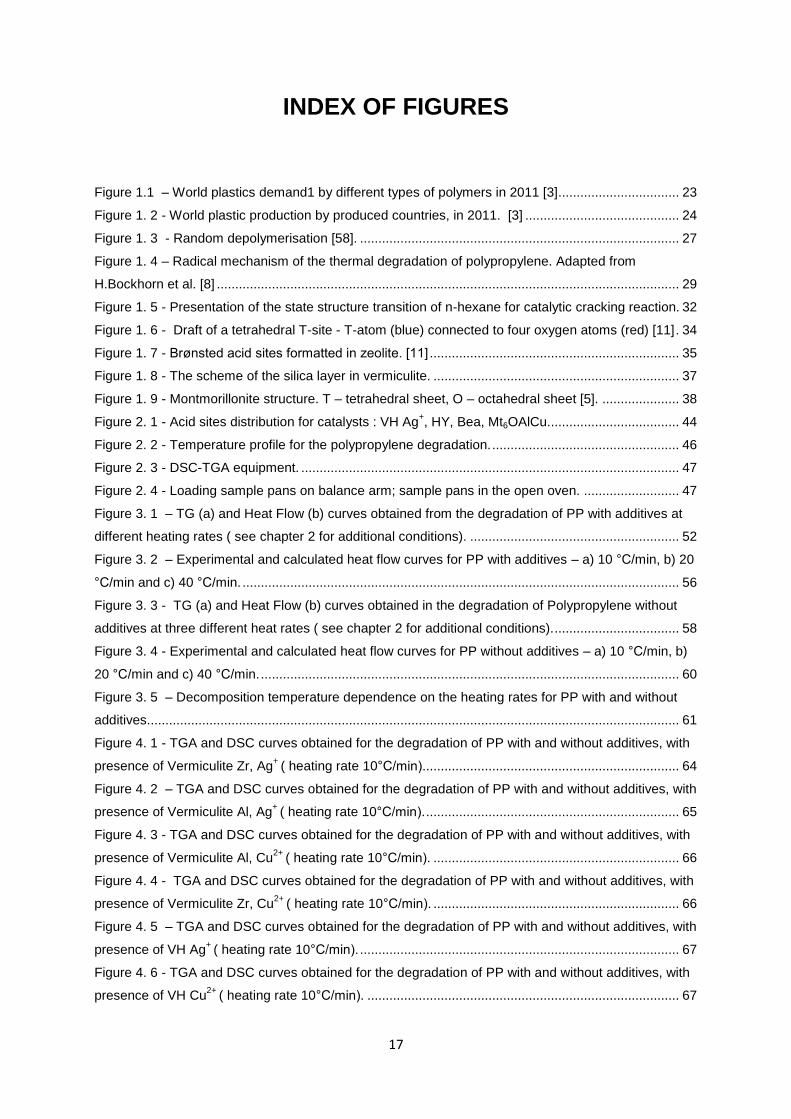
INDEX OF FIGURES
Figure 1.1 – World plastics demand1 by different types of polymers in 2011 [3]................................. 23
Figure 1. 2 - World plastic production by produced countries, in 2011. [3] .......................................... 24
Figure 1. 3 - Random depolymerisation [58]. ....................................................................................... 27
Figure 1. 4 – Radical mechanism of the thermal degradation of polypropylene. Adapted from
H.Bockhorn et al. [8] .............................................................................................................................. 29
Figure 1. 5 - Presentation of the state structure transition of n-hexane for catalytic cracking reaction. 32
Figure 1. 6 - Draft of a tetrahedral T-site - T-atom (blue) connected to four oxygen atoms (red) [11] . 34
Figure 1. 7 - Brønsted acid sites formatted in zeolite. [11] .................................................................... 35
Figure 1. 8 - The scheme of the silica layer in vermiculite. ................................................................... 37
Figure 1. 9 - Montmorillonite structure. T – tetrahedral sheet, O – octahedral sheet [5]. ..................... 38
Figure 2. 1 - Acid sites distribution for catalysts : VH Ag+, HY, Bea, Mt6OAlCu.................................... 44
Figure 2. 2 - Temperature profile for the polypropylene degradation. ................................................... 46
Figure 2. 3 - DSC-TGA equipment. ....................................................................................................... 47
Figure 2. 4 - Loading sample pans on balance arm; sample pans in the open oven. .......................... 47
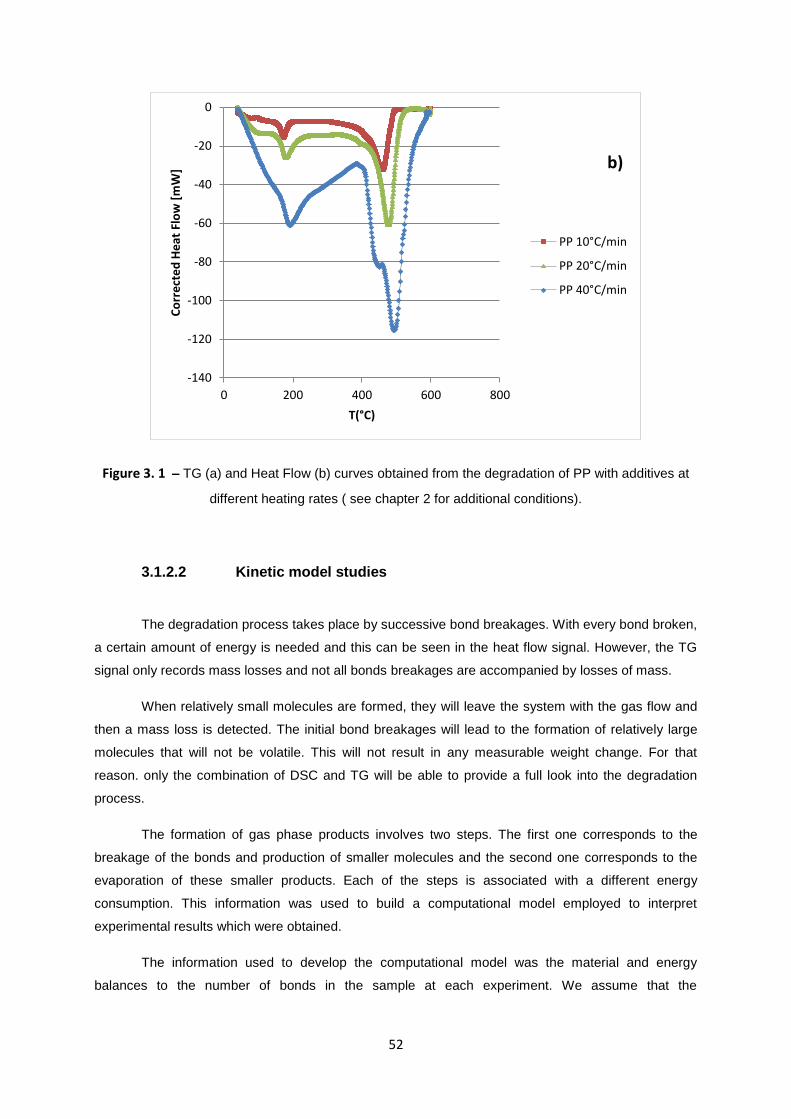
Figure 3. 1 – TG (a) and Heat Flow (b) curves obtained from the degradation of PP with additives at
different heating rates ( see chapter 2 for additional conditions). ......................................................... 52
Figure 3. 2 – Experimental and calculated heat flow curves for PP with additives – a) 10 °C/min, b) 20
°C/min and c) 40 °C/min. ....................................................................................................................... 56
Figure 3. 3 - TG (a) and Heat Flow (b) curves obtained in the degradation of Polypropylene without
additives at three different heat rates ( see chapter 2 for additional conditions). .................................. 58
Figure 3. 4 - Experimental and calculated heat flow curves for PP without additives – a) 10 °C/min, b)
20 °C/min and c) 40 °C/min. .................................................................................................................. 60
Figure 3. 5 – Decomposition temperature dependence on the heating rates for PP with and without
additives................................................................................................................................................. 61
Figure 4. 1 - TGA and DSC curves obtained for the degradation of PP with and without additives, with
presence of Vermiculite Zr, Ag+
( heating rate 10°C/min)...................................................................... 64
Figure 4. 2 – TGA and DSC curves obtained for the degradation of PP with and without additives, with
presence of Vermiculite Al, Ag+
( heating rate 10°C/min). ..................................................................... 65
Figure 4. 3 - TGA and DSC curves obtained for the degradation of PP with and without additives, with
presence of Vermiculite Al, Cu2+
( heating rate 10°C/min). ................................................................... 66
Figure 4. 4 - TGA and DSC curves obtained for the degradation of PP with and without additives, with
presence of Vermiculite Zr, Cu2+
( heating rate 10°C/min). ................................................................... 66
Figure 4. 5 – TGA and DSC curves obtained for the degradation of PP with and without additives, with
presence of VH Ag+
( heating rate 10°C/min). ....................................................................................... 67
Figure 4. 6 - TGA and DSC curves obtained for the degradation of PP with and without additives, with
presence of VH Cu2+
( heating rate 10°C/min). ..................................................................................... 67
18
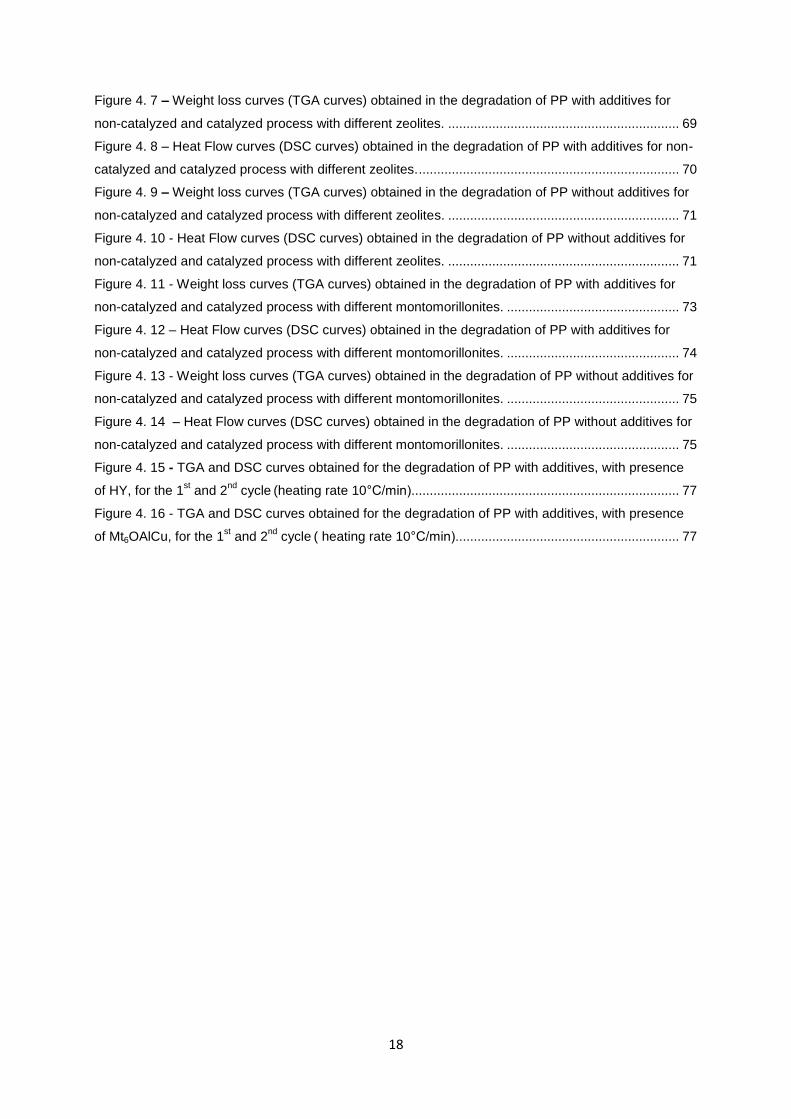
Figure 4. 7 – Weight loss curves (TGA curves) obtained in the degradation of PP with additives for
non-catalyzed and catalyzed process with different zeolites. ............................................................... 69
Figure 4. 8 – Heat Flow curves (DSC curves) obtained in the degradation of PP with additives for non-
catalyzed and catalyzed process with different zeolites. ....................................................................... 70
Figure 4. 9 – Weight loss curves (TGA curves) obtained in the degradation of PP without additives for
non-catalyzed and catalyzed process with different zeolites. ............................................................... 71
Figure 4. 10 - Heat Flow curves (DSC curves) obtained in the degradation of PP without additives for
non-catalyzed and catalyzed process with different zeolites. ............................................................... 71
Figure 4. 11 - Weight loss curves (TGA curves) obtained in the degradation of PP with additives for
non-catalyzed and catalyzed process with different montomorillonites. ............................................... 73
Figure 4. 12 – Heat Flow curves (DSC curves) obtained in the degradation of PP with additives for
non-catalyzed and catalyzed process with different montomorillonites. ............................................... 74
Figure 4. 13 - Weight loss curves (TGA curves) obtained in the degradation of PP without additives for
non-catalyzed and catalyzed process with different montomorillonites. ............................................... 75
Figure 4. 14 – Heat Flow curves (DSC curves) obtained in the degradation of PP without additives for
non-catalyzed and catalyzed process with different montomorillonites. ............................................... 75
Figure 4. 15 - TGA and DSC curves obtained for the degradation of PP with additives, with presence
of HY, for the 1st and 2
nd cycle
(heating rate 10°C/min)......................................................................... 77
Figure 4. 16 - TGA and DSC curves obtained for the degradation of PP with additives, with presence
of Mt6OAlCu, for the 1st and 2
nd cycle
( heating rate 10°C/min)............................................................. 77
19
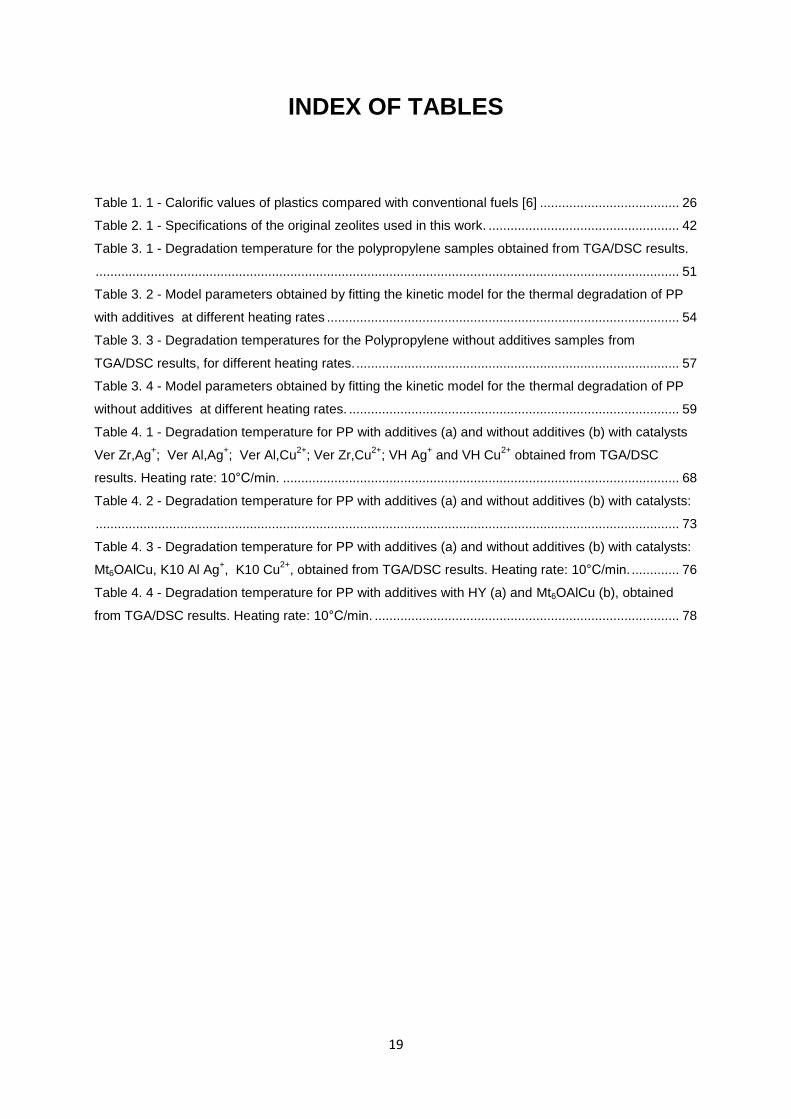
INDEX OF TABLES
Table 1. 1 - Calorific values of plastics compared with conventional fuels [6] ...................................... 26
Table 2. 1 - Specifications of the original zeolites used in this work. .................................................... 42
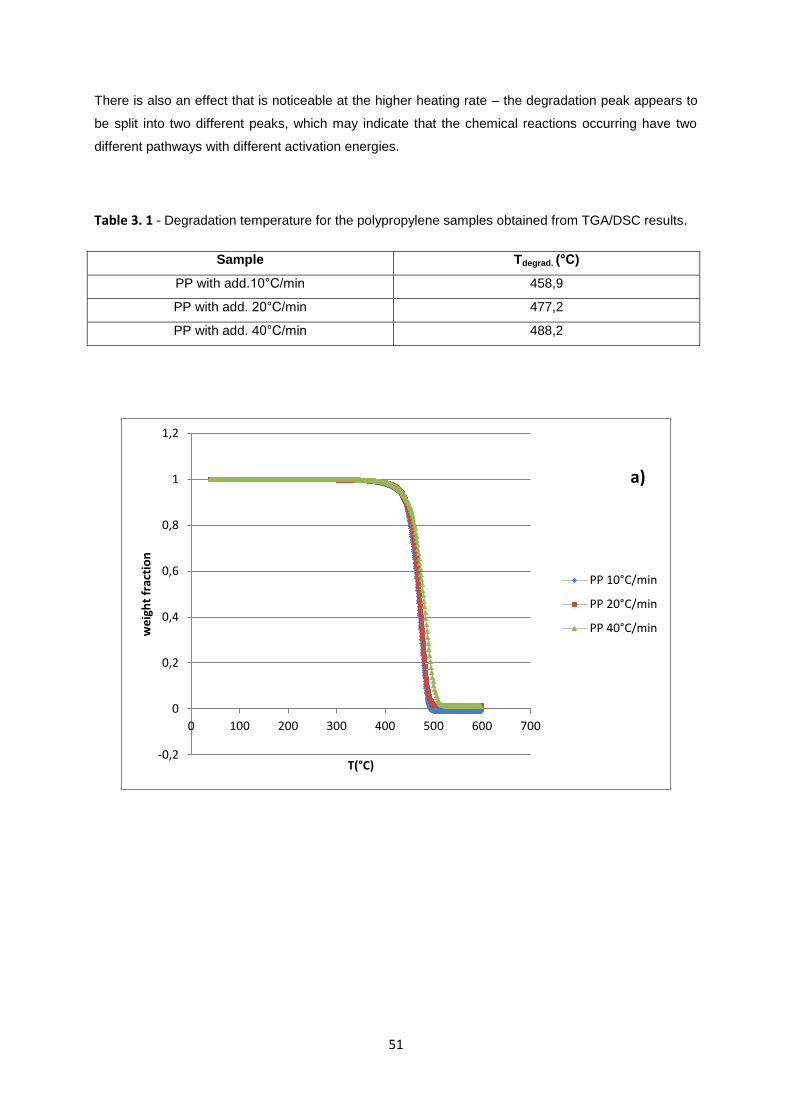
Table 3. 1 - Degradation temperature for the polypropylene samples obtained from TGA/DSC results.
............................................................................................................................................................... 51
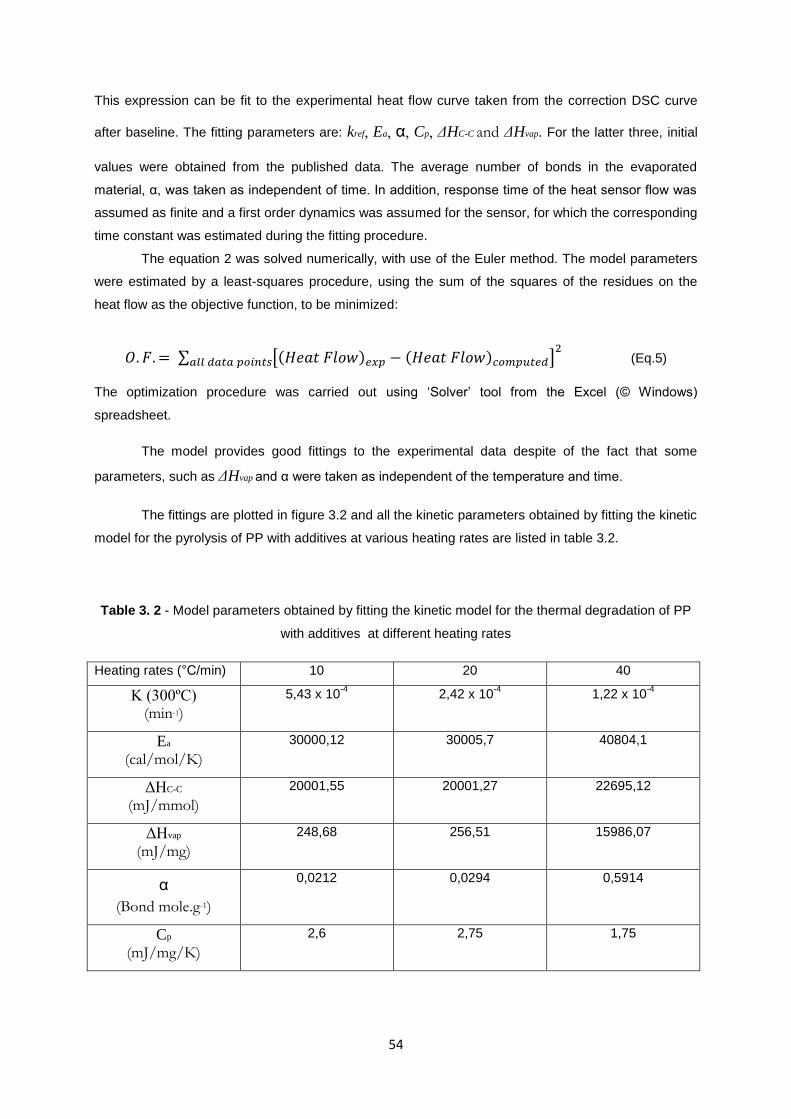
Table 3. 2 - Model parameters obtained by fitting the kinetic model for the thermal degradation of PP
with additives at different heating rates ................................................................................................ 54
Table 3. 3 - Degradation temperatures for the Polypropylene without additives samples from
TGA/DSC results, for different heating rates. ........................................................................................ 57
Table 3. 4 - Model parameters obtained by fitting the kinetic model for the thermal degradation of PP
without additives at different heating rates. .......................................................................................... 59
Table 4. 1 - Degradation temperature for PP with additives (a) and without additives (b) with catalysts
Ver Zr,Ag+; Ver Al,Ag
+; Ver Al,Cu
2+; Ver Zr,Cu
2+; VH Ag
+ and VH Cu
2+ obtained from TGA/DSC
results. Heating rate: 10°C/min. ............................................................................................................ 68
Table 4. 2 - Degradation temperature for PP with additives (a) and without additives (b) with catalysts:
............................................................................................................................................................... 73
Table 4. 3 - Degradation temperature for PP with additives (a) and without additives (b) with catalysts:
Mt6OAlCu, K10 Al Ag+, K10 Cu
2+, obtained from TGA/DSC results. Heating rate: 10°C/min. ............. 76
Table 4. 4 - Degradation temperature for PP with additives with HY (a) and Mt6OAlCu (b), obtained
from TGA/DSC results. Heating rate: 10°C/min. ................................................................................... 78

20
21
CHAPTER 1. Introduction
1.1 Motivation and Objectives
Polypropylenes and polyethylenes, two of the major polyolefins in the market of
plastics, are some of the main chemical substances produced worldwide. Production of
polyethylene and polypropylene accounts for about 50% of all manufactured synthetic polymers.
With the threat of ending fuel resources, it is important to find other alternative sources of energy
and to provide a better use for the hydrocarbons obtained from oil. Recycling of polyolefins can be
part of the possible solutions.
In this work, there are two major objectives. The first one is the study of the pyrolysis
of polypropylene, as a good alternative for management of these plastic wastes. The second one
is the study of the influence of three types of catalysts on the plastic’s degradation.
In the first part of this work possible catalysts suitable to improve degradation of
plastics are studying: lowering the pyrolysis temperature and resulting in better quality products.
The second part of the research is made based on influence of catalysts on
polypropylene degradation process.
Both thermal and catalytic degradation of waste polyolefins leads to hydrocarbons
production, that can be used as blending component in fuels.
A kinetic model is also be used to allow a more detailed picture of the evolution of the reaction,
based on TG and DSC scans.
22
1.2 Polymers
Polymers are natural or synthetic molecules that are composed of a large number of smaller
moities, monomers, which have reacted to form a long chain. The most basic polymers are made from
the same monomers – the name of this substance is made by adding prefix ‘Poly’ to the name of the
monomer. For example, the polymer obtained from propylene is poly(propylene), in common usage
the brackets are omitted.
In today’s world most of the polymers used are synthetic. They are produced by reactions of
polymerization involving the formation of chemical bonds between the monomer molecules to give rise
a long-chain polymer. There is also the possibility to synthesized polymers from different monomers.
Products of this reactions are called copolymers, with the starting molecules referred to as
comonomers [1,2].
1.2.1 Polymers Classification
Polymers are usually classified by two mayor criteria: according to their thermal
behavior and to the polymerization mechanism. From the polymer recycling point of view, this
classification is important because the most suitable method of degradation for a given polymer is
related to the properties of the molecule.
In common usage, the term ‘plastic’ is considered equivalent to the term polymer.
Nevertheless, all plastics are polymers, but not all polymeric materials are plastics. Polymers can be
divided into three different groups : a) elastomers (rubbers), b) plastics and c) fibers. This classification
is made based on their physical features, elastic modulus and degree of elongation.
There are five high volume groups of plastics : polyethylene (low density PE-LD, linear
low density PE-LLD and high density polyethylene PE-HD), polypropylene (PP), polyvinyl chloride
(PVC), polystyrene (solid-PS, expandable-EPS), polyethylene terephthalate (PET) and polyutherane
(PUR) [3]. Counted together, they constitute 80% of all the plastic demand in the world in
2011.Plastics have a wide variety of combinations of properties. Some are very rigid and brittle, while
others are flexible, exhibiting both elastic and plastic deformations when stressed and sometimes
experiencing considerable deformation before fracture. The biggest market shares belong to
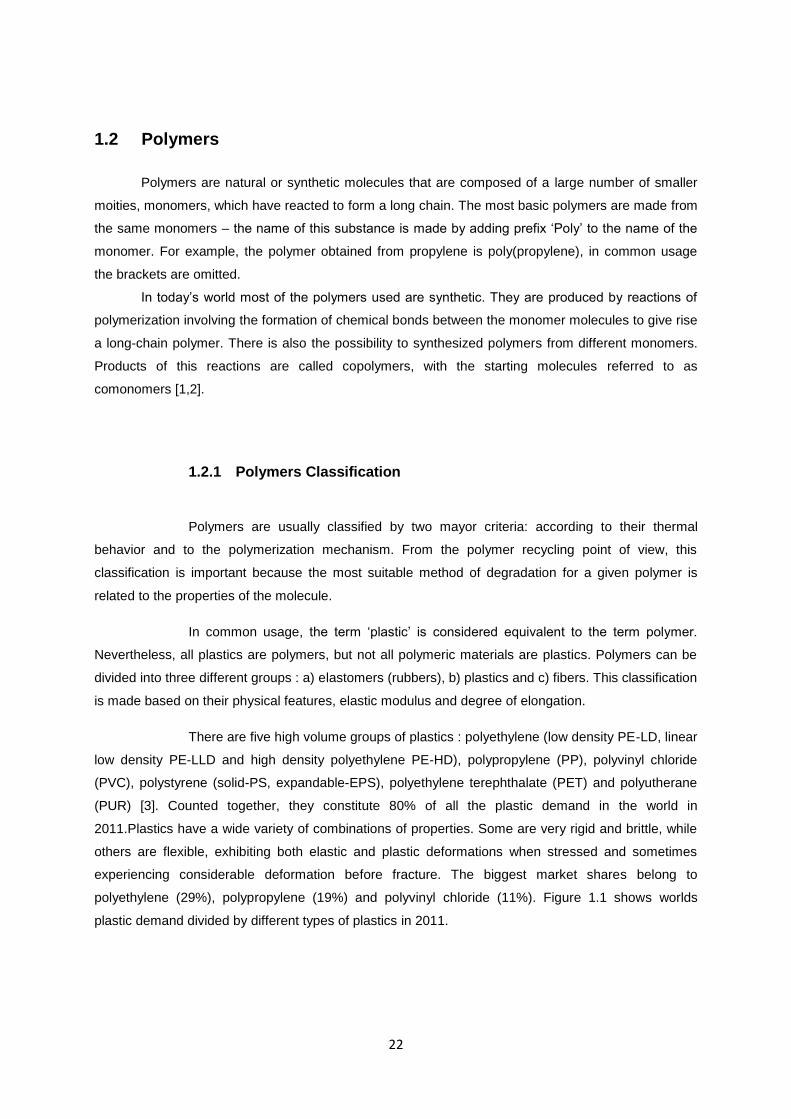
polyethylene (29%), polypropylene (19%) and polyvinyl chloride (11%). Figure 1.1 shows worlds
plastic demand divided by different types of plastics in 2011.
23
Figure 1.1 – World plastics demand by different types of polymers in 2011 [3]
Polypropylene
does not present stress-cracking problems and offers excellent electrical and chemical resistance at
higher temperatures. While the properties of PP are similar to those of polyethylene, there are specific
differences. These include a lower density, higher softening point (polypropylene has melting point at
160 °C, while polyethylene softness at 100 °C) and higher rigidity and hardness.
In this work all of the experiments will be carried-out on two different samples of polypropylene: with
and without additives. Additives are intentionally introduced to enhance of modify some of the plastic’s
properties and, thus, render the polymer more serviceable. Typical additives include filler materials,
plasticizers, stabilizers, colorants and flame retardants.
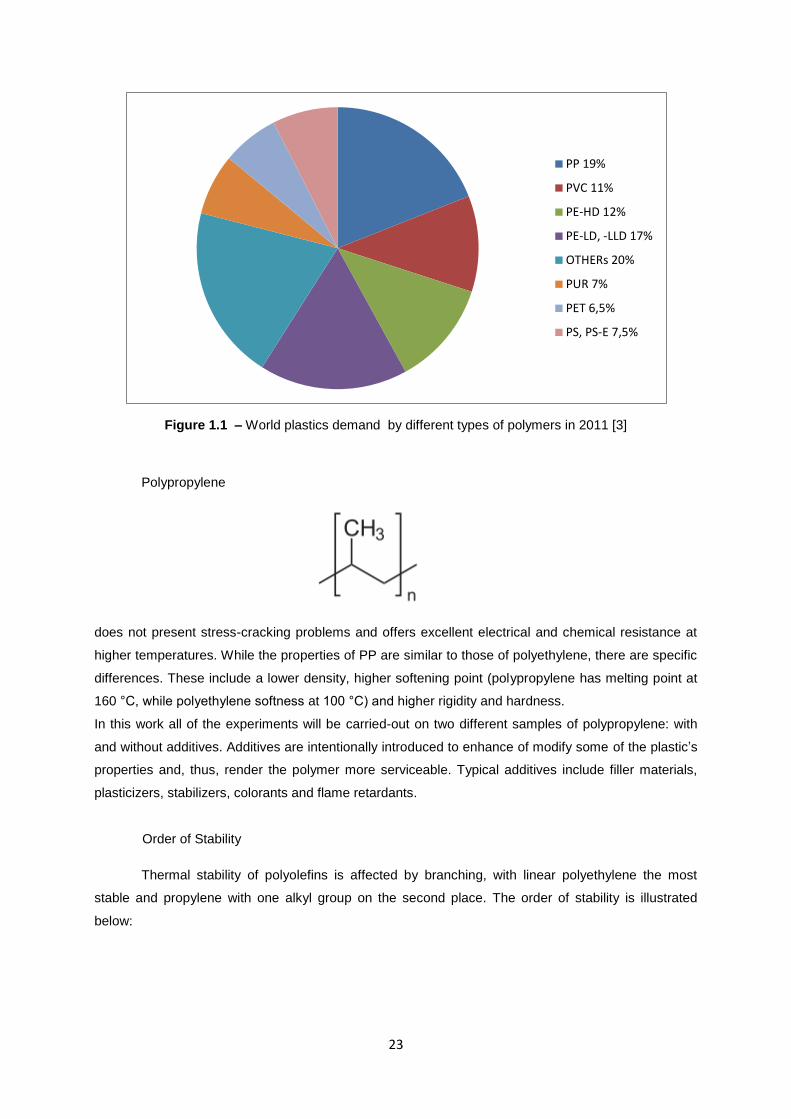
Order of Stability
Thermal stability of polyolefins is affected by branching, with linear polyethylene the most
stable and propylene with one alkyl group on the second place. The order of stability is illustrated
below:
PP 19%
PVC 11%
PE-HD 12%
PE-LD, -LLD 17%
OTHERs 20%
PUR 7%
PET 6,5%
PS, PS-E 7,5%
24
Taken from Beyler and Hirshler, 2001 [4]
Where R is hydrocarbon group larger than a methyl group.
1.2.2 Plastic Consumption
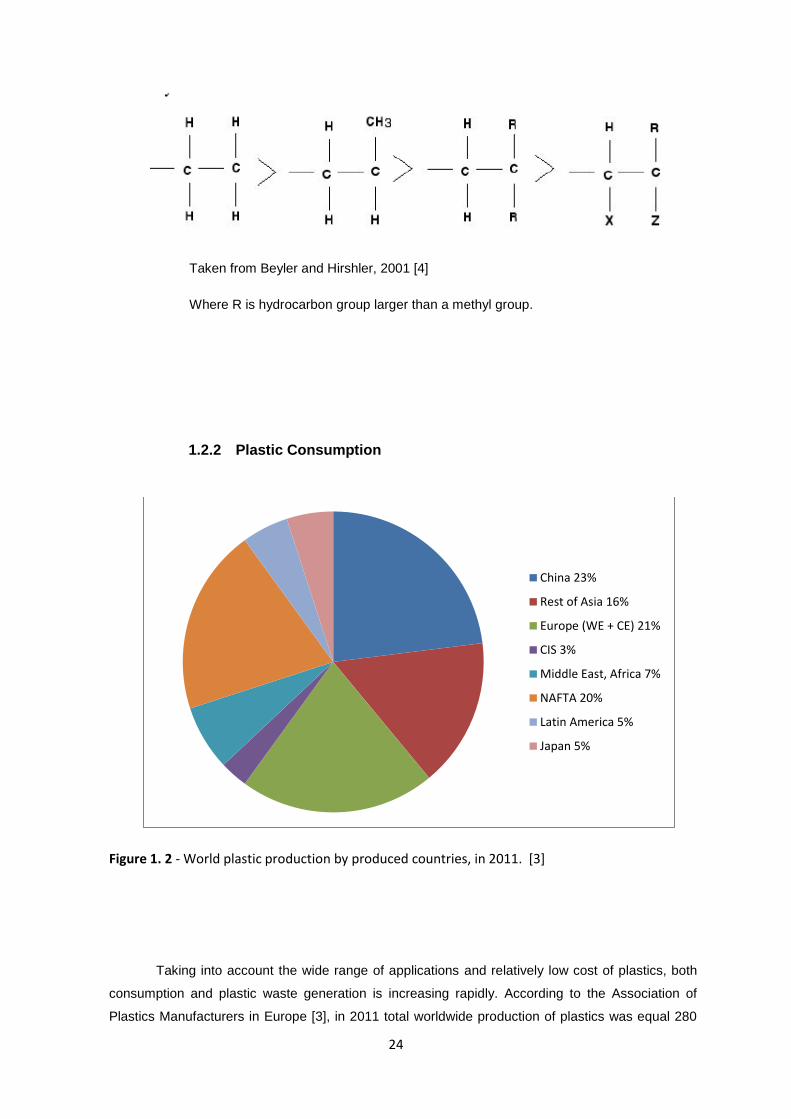
Figure 1. 2 - World plastic production by produced countries, in 2011. [3]
Taking into account the wide range of applications and relatively low cost of plastics, both
consumption and plastic waste generation is increasing rapidly. According to the Association of
Plastics Manufacturers in Europe [3], in 2011 total worldwide production of plastics was equal 280
China 23%
Rest of Asia 16%
Europe (WE + CE) 21%
CIS 3%
Middle East, Africa 7%
NAFTA 20%
Latin America 5%
Japan 5%
25
million tones, with 21% produced in Europe, being Germany is major producer ( 12 million tons),
followed by Italy ( 7 million tons), France ( 5 million tons) and Spain ( 3,8 million tons) (see Figure
1.2.)
1.3 Environmental impact of plastic waste
The most common Municipial Solid Waste (MSW) methods to manage plastic waste are
recycling, when possible, incineration and landfilling. The latter method are considered to produce a
negative impact on the environment since, due to its chemical inertness and low biodegrability. it
requires substantial time for plastics to break down in the landfills and so it occupies a large space of
the landscape. From another point of view, there are incineration methods in which energy is
recovered, but this methods produce mayor amounts of toxic substances which are harmful to
ambient.
Recycling and reuse of plastics has the benefit of decreasing the quantity of plastic wastes
which ends up in landfills. Still, the overall recovery of plastics for recycling is relatively small. In
accordance with Association of Plastics Manufacturers in Europe (APME) [3], in 2011 of the 58 million
tons of plastics used in Europe 25,1 million tons were recovered and 14,9 million tons were reused
(59%), through recycling or energy recovery. Remaining 20,2 million tons were sent to the disposal
facilities (41 %).
1.3.1 The economic and environmental factors
There is a need to develop new sustainable answers for plastics management than
incineration and disposal at landfills. Plastic waste recycling can provide an opportunity to collect and
dispose plastic waste in environmentally friendly way, and also it could be converted into resource of
energy Both thermal and catalytic degradation of polymers are hopeful alternatives which allow plastic
conversion into gaseous and liquid hydrocarbons.
From an economical point of view, used plastics are considered to be an important source of
chemicals, mainly hydrocarbons, and an energy source. The calorific value of the hydrocarbons from
polymers are similar to values obtained from fuel oils and even higher than coal (see table 1.1) [4].
26
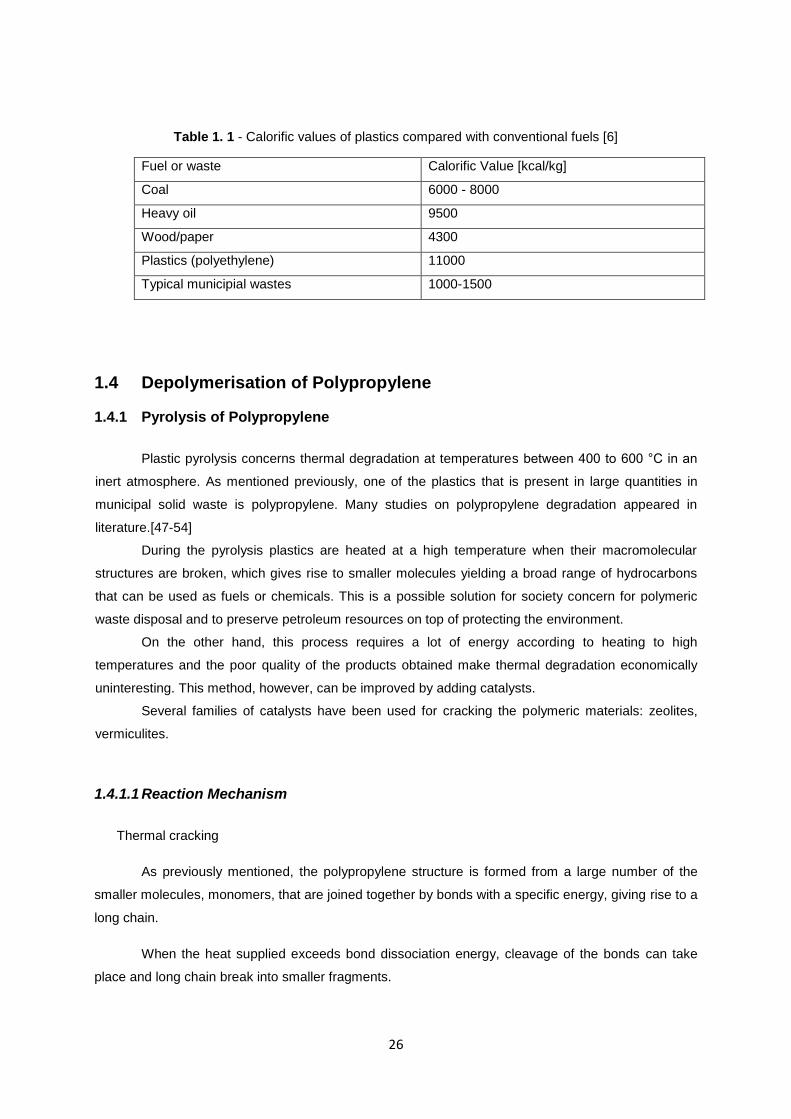
Table 1. 1 - Calorific values of plastics compared with conventional fuels [6]
Fuel or waste Calorific Value [kcal/kg]
Coal 6000 - 8000
Heavy oil 9500
Wood/paper 4300
Plastics (polyethylene) 11000
Typical municipial wastes 1000-1500
1.4 Depolymerisation of Polypropylene
1.4.1 Pyrolysis of Polypropylene
Plastic pyrolysis concerns thermal degradation at temperatures between 400 to 600 °C in an
inert atmosphere. As mentioned previously, one of the plastics that is present in large quantities in
municipal solid waste is polypropylene. Many studies on polypropylene degradation appeared in
literature.[47-54]
During the pyrolysis plastics are heated at a high temperature when their macromolecular
structures are broken, which gives rise to smaller molecules yielding a broad range of hydrocarbons
that can be used as fuels or chemicals. This is a possible solution for society concern for polymeric
waste disposal and to preserve petroleum resources on top of protecting the environment.
On the other hand, this process requires a lot of energy according to heating to high
temperatures and the poor quality of the products obtained make thermal degradation economically
uninteresting. This method, however, can be improved by adding catalysts.
Several families of catalysts have been used for cracking the polymeric materials: zeolites,
vermiculites.
1.4.1.1 Reaction Mechanism
Thermal cracking
As previously mentioned, the polypropylene structure is formed from a large number of the
smaller molecules, monomers, that are joined together by bonds with a specific energy, giving rise to a
long chain.
When the heat supplied exceeds bond dissociation energy, cleavage of the bonds can take
place and long chain break into smaller fragments.
27
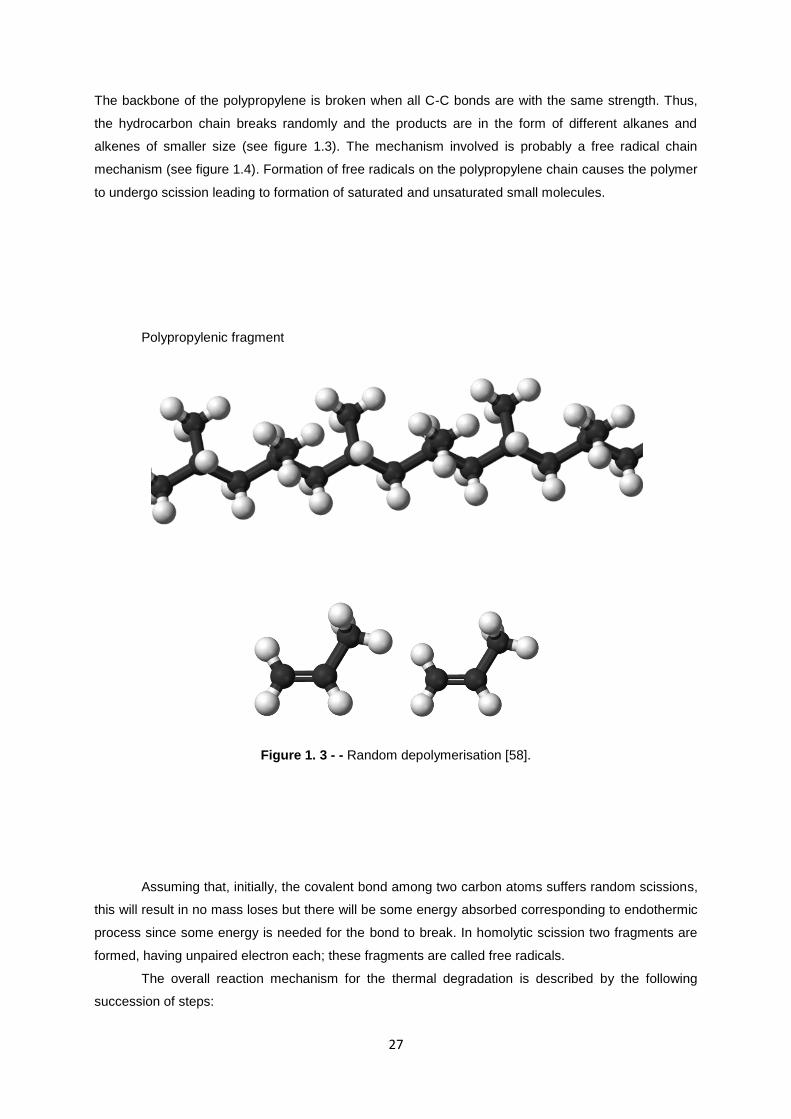
The backbone of the polypropylene is broken when all C-C bonds are with the same strength. Thus,
the hydrocarbon chain breaks randomly and the products are in the form of different alkanes and
alkenes of smaller size (see figure 1.3). The mechanism involved is probably a free radical chain
mechanism (see figure 1.4). Formation of free radicals on the polypropylene chain causes the polymer
to undergo scission leading to formation of saturated and unsaturated small molecules.
Polypropylenic fragment
Figure 1. 3 - - Random depolymerisation [58].
Assuming that, initially, the covalent bond among two carbon atoms suffers random scissions,
this will result in no mass loses but there will be some energy absorbed corresponding to endothermic
process since some energy is needed for the bond to break. In homolytic scission two fragments are
formed, having unpaired electron each; these fragments are called free radicals.
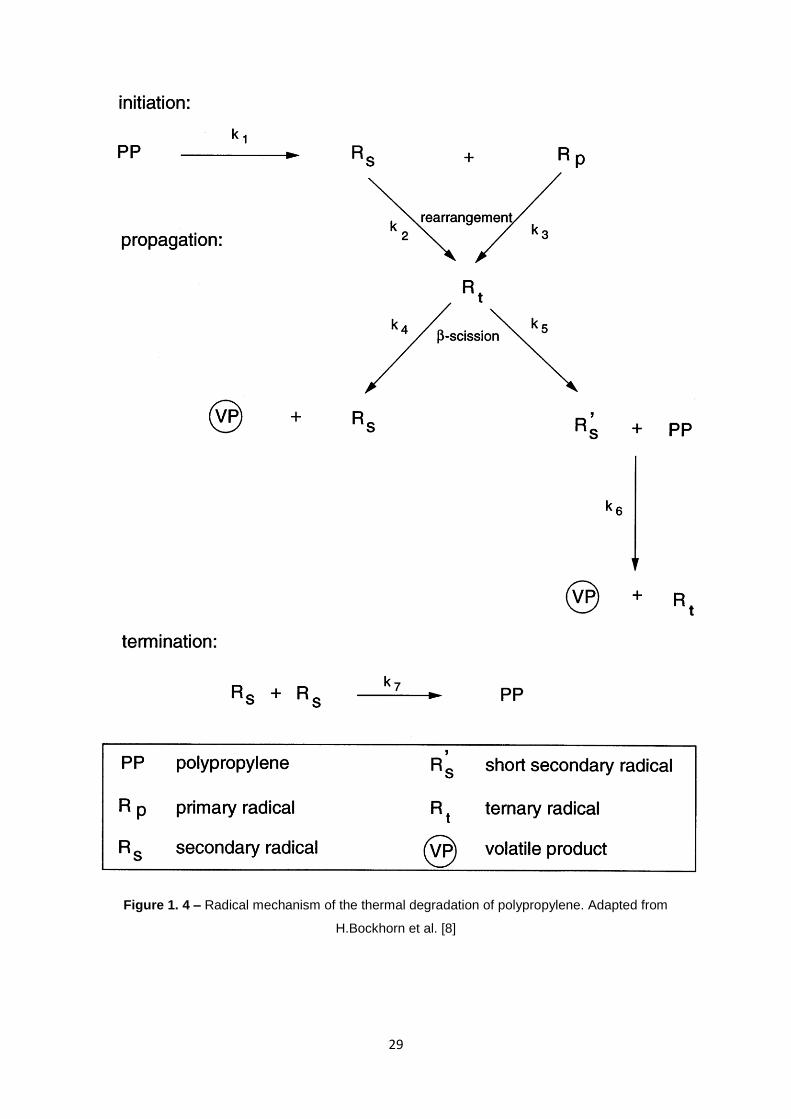
The overall reaction mechanism for the thermal degradation is described by the following
succession of steps:
28
Initiation occurring at random scission of the polymer chain and forming primary
radicals Rp (1)
Propagation leads to the release of olefinic monomeric parts formed from primary
radicals by β-scission and producing predominantly propene (2)
Hydrogen chain transfer reaction may happen as intermolecular or intramolecular
(depending on low or high temperatures) processes.
The intramolecular hydrogen transfers leads to more stable secondary radicals. The
subsequent β-scission of secondary radicals cooperates with the propagation step of the radical chain
mechanism since a new primary radical is formed in this process. In addition, during this process C-C
bond homolysis the formation of olefins occurs.
Furthermore, secondary radicals may also be formed through hydrogen abstraction by an
intermolecular transfer reaction among a primary radical and a polymeric fragment. In this reaction,
formation of alkane occurs.
Termination happens in a bimolecular mode with the coupling of two primary
radicals.
29
Figure 1. 4 – Radical mechanism of the thermal degradation of polypropylene. Adapted from
H.Bockhorn et al. [8]

30
Catalytic cracking
As mentioned before, the catalysts have significant role in pyrolysis process. Pyrolysis in the
presence of a catalyst usually requires less energy than it is needed in the non-catalytic process.
Consequently, the catalysts allows the reduction of the processing temperature that leads to a
decrease in energy consumption; at the same time it improves the output quality and the
corresponding yield (both gas and liquid hydrocarbons used as fuels).
Comparing to thermal degradation, which usually occurs via free radical mechanism, catalytic
degradation occurs by carbocations, which consist of hydrocarbon ions carrying a single positive
charge.
As an example, the mechanism of catalytic pyrolysis of polyethylene was proposed by
Buekens and mainly, this process evolves: (1) initiation, involving a carbenium ion formation by proton
addition to unsaturated bond or an hydride abstraction from a saturated one; (2) propagation, where
chain cleavage yields an oligomer fraction by β-scission; (3) isomerizaton; (4) aromatization.
1. Initiation: occurring on some defect sites of the polymer chain. For example, an olefinic
linkage could be converted into an on-chain carbenium by adding a proton.
Next, the polymer chain is broken through β-scission.
This step of degradation may also take place through random hydride ion abstraction by low-
molecular-weight carbenium ions (R+). After that, the formed on-chain carbenium ion undergoes β-
scission.
31
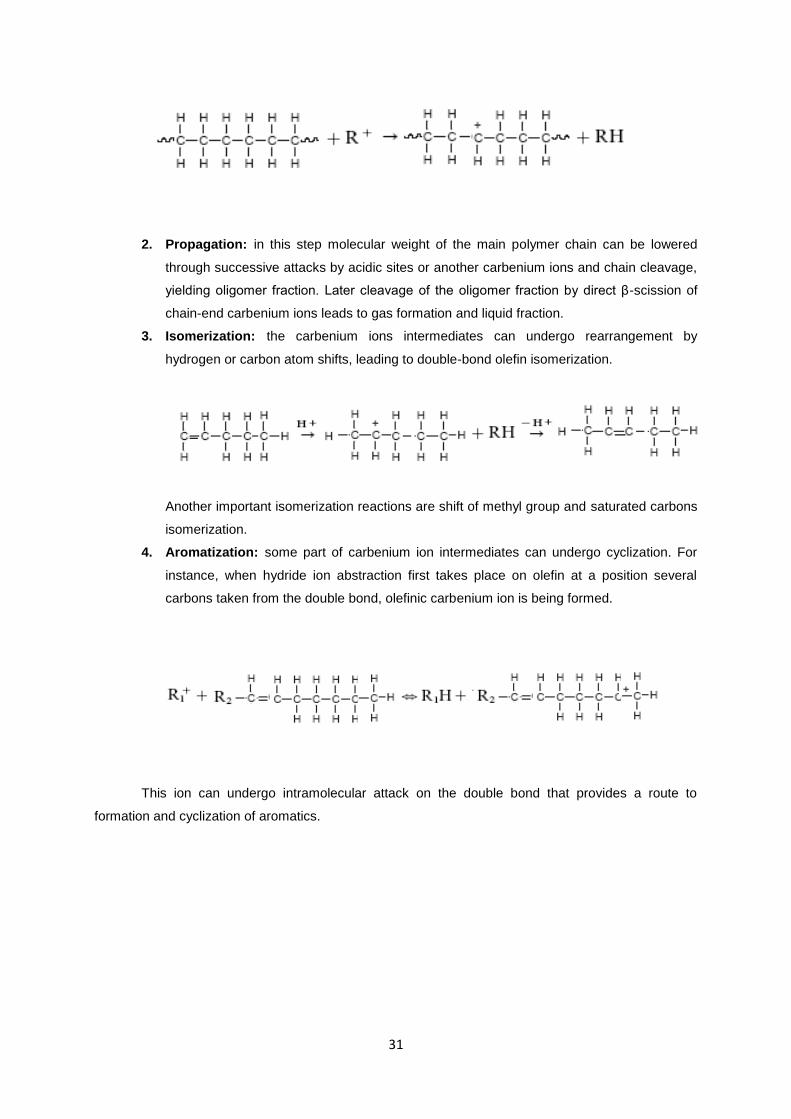
2. Propagation: in this step molecular weight of the main polymer chain can be lowered
through successive attacks by acidic sites or another carbenium ions and chain cleavage,
yielding oligomer fraction. Later cleavage of the oligomer fraction by direct β-scission of
chain-end carbenium ions leads to gas formation and liquid fraction.
3. Isomerization: the carbenium ions intermediates can undergo rearrangement by
hydrogen or carbon atom shifts, leading to double-bond olefin isomerization.
Another important isomerization reactions are shift of methyl group and saturated carbons
isomerization.
4. Aromatization: some part of carbenium ion intermediates can undergo cyclization. For
instance, when hydride ion abstraction first takes place on olefin at a position several
carbons taken from the double bond, olefinic carbenium ion is being formed.
This ion can undergo intramolecular attack on the double bond that provides a route to
formation and cyclization of aromatics.
32
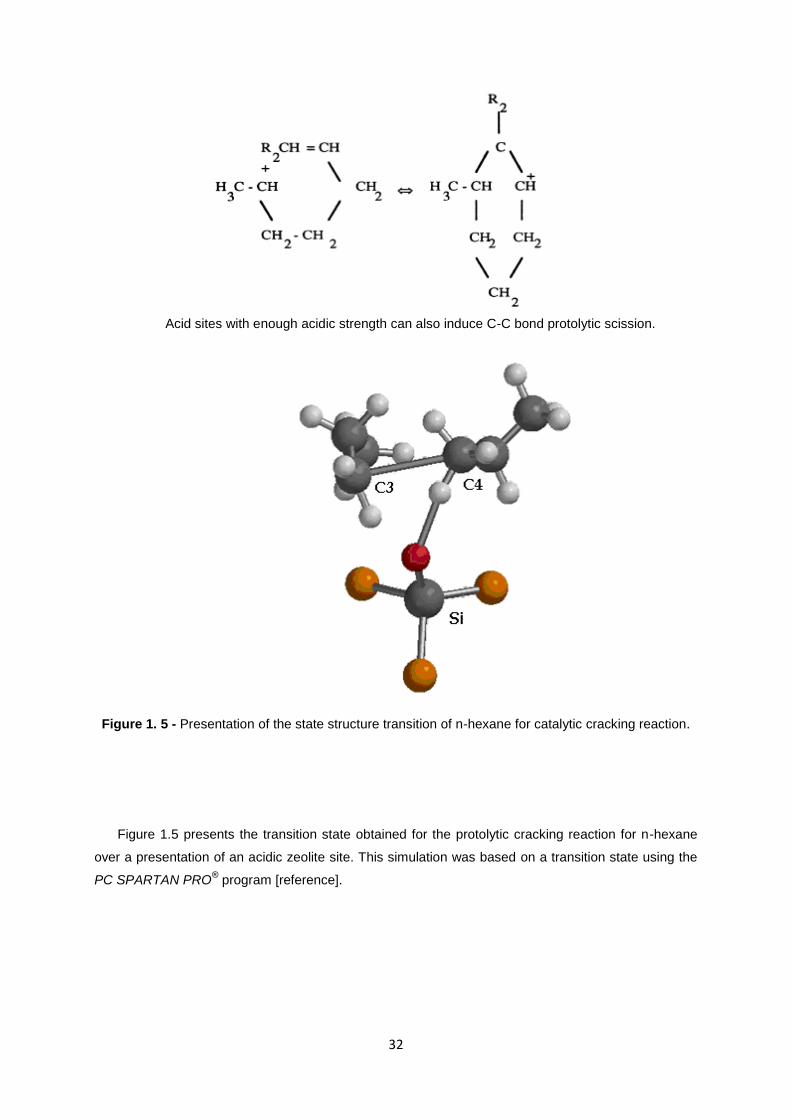
Acid sites with enough acidic strength can also induce C-C bond protolytic scission.
Figure 1. 5 - Presentation of the state structure transition of n-hexane for catalytic cracking reaction.
Figure 1.5 presents the transition state obtained for the protolytic cracking reaction for n-hexane
over a presentation of an acidic zeolite site. This simulation was based on a transition state using the
PC SPARTAN PRO® program [reference].
33
Kinetic studies
To gain an overall understanding of the reaction processes, it is important to know the kinetics
of degradation using kinetic modeling modeling [27-36] and gas phase product analysis.
[21,22,23,24,25,26]
Nevertheless, since the process mechanism is very complex and depends on many factors,
kinetic parameters of polypropylene pyrolysis presented in the literature are significantly different. The
reason for differences between these values are connected to the diversity of mathematical
expressions adapted as kinetic equations and kinetic analysis methods applied in different studies.
Also, the use of different types of material samples (influence of the average molecular weight and
molecular weight distribution) and operating conditions (temperature, pressure, heating rates etc.).
This results in a variation of reaction order found by many researches with the objective of elucidating
the pyrolysis kinetics of polypropylene between 0 and 1.[55-57]
1.4.2 Thermogravimetric (TG) and Differential Scanning Calorimetric (DSC) analysis
There are many technologies and reactors [37-44] than can be used to pursue the reaction,
but due to the nature of the pyrolysis, thermogravimetric analysis (TGA) is widely considered as a
useful technique to study the degradation processes and its kinetics.
However, with TGA the reaction is only detected after it has occurred, when the products are
becoming small enough to evaporate into the gas phase leading to the decrease of observed polymer
mass. Taking this into account, the kinetic models used to described the process are basically based
on the weight loss analysis curves obtained during thermal gravimetric analysis of the polymeric
samples. A similar objection can be raised when only the gas-phase products are analyzed. Anyhow,
it is possible to follow the reaction from the start, since each bond of polymer that is broken consumes
some amount of energy. By measuring the heat flow into the sample during the reaction (for example
using DSC), it is possible to measure the rate of breaking bonds even if this leads to species that are
still too heavy to evaporate and do not produce any significant mass losses and, thus, cannot be seen
in the TG signal.
Example of the studies that use DSC technique was performed by Conesa [36] and
Marcilla [45,46] who have written the energy balance for the sample in the apparatus but applied
different approaches to describe the various heat consumption terms.
34
1.5 Catalysts
1.5.1 Zeolites
Zeolites are crystalline aluminosilicates with composition expressed by the formula
Mx/n(AlO2)x(SiO2)y.zH2O
Where: M stands for the compensating cation with palence n, z is the water contained in the zeolite,
x+y represents number of tetrahedrous SiO4 and AlO4- and y/x is the atomic ratio Si/Al, which can
chang)e from the minimum value of 1 to infinite (in accordance with Loewenstein rule).
Describing the structure of zeolites, there is a extensive three-dimensional framework where
oxygen atoms links the tetrahedral sites. This resulting in microporous structure, with a big probability
of channels and cavities being formed. As a consequence each type of zeolite has a different
structure.
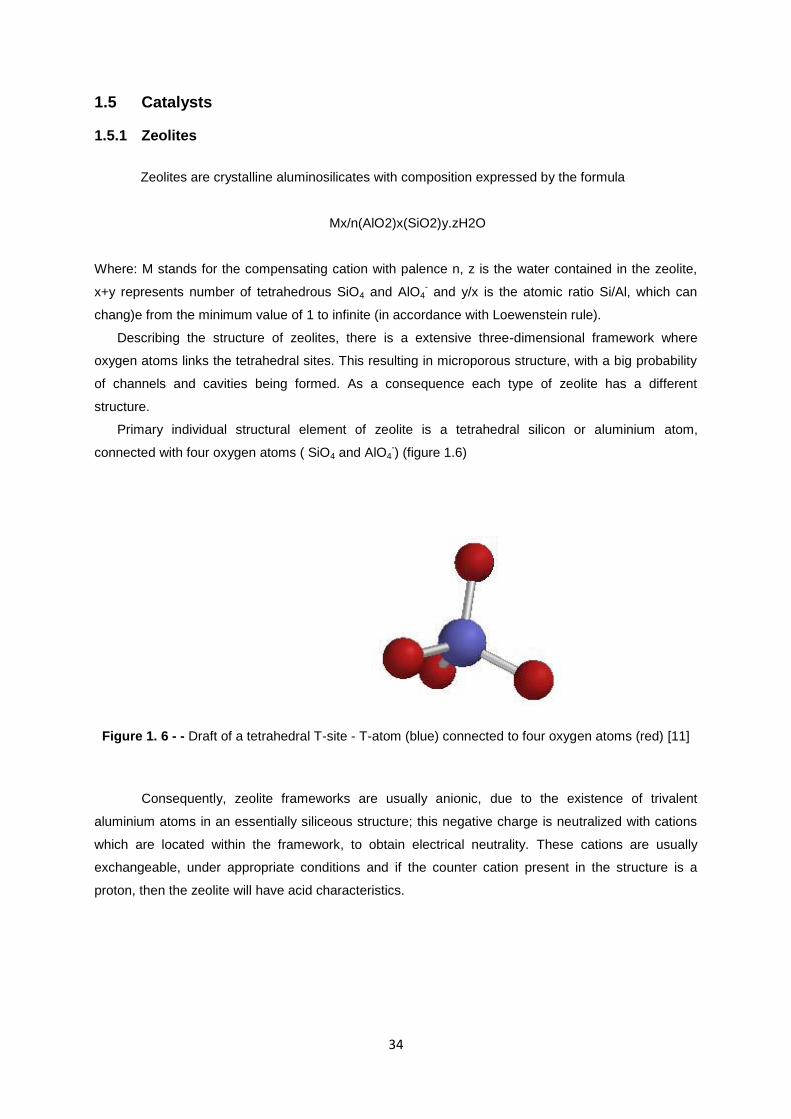
Primary individual structural element of zeolite is a tetrahedral silicon or aluminium atom,
connected with four oxygen atoms ( SiO4 and AlO4-) (figure 1.6)
Figure 1. 6 - - Draft of a tetrahedral T-site - T-atom (blue) connected to four oxygen atoms (red) [11]
Consequently, zeolite frameworks are usually anionic, due to the existence of trivalent
aluminium atoms in an essentially siliceous structure; this negative charge is neutralized with cations
which are located within the framework, to obtain electrical neutrality. These cations are usually
exchangeable, under appropriate conditions and if the counter cation present in the structure is a
proton, then the zeolite will have acid characteristics.
35
Acidity of zeolites
In acid zeolites, the activity is determined by the Brønsted and Lewis sites, mainly because the
presence of aluminium in the zeolite framework.
To describe the acidity of zeolites is necessary to distinguish the nature and strength of the
acid sites. Hydroxyl groups are typically associated with Brønsted acid sites while the tri-coordinate
aluminium and the cationic species correspond to Lewis sites.
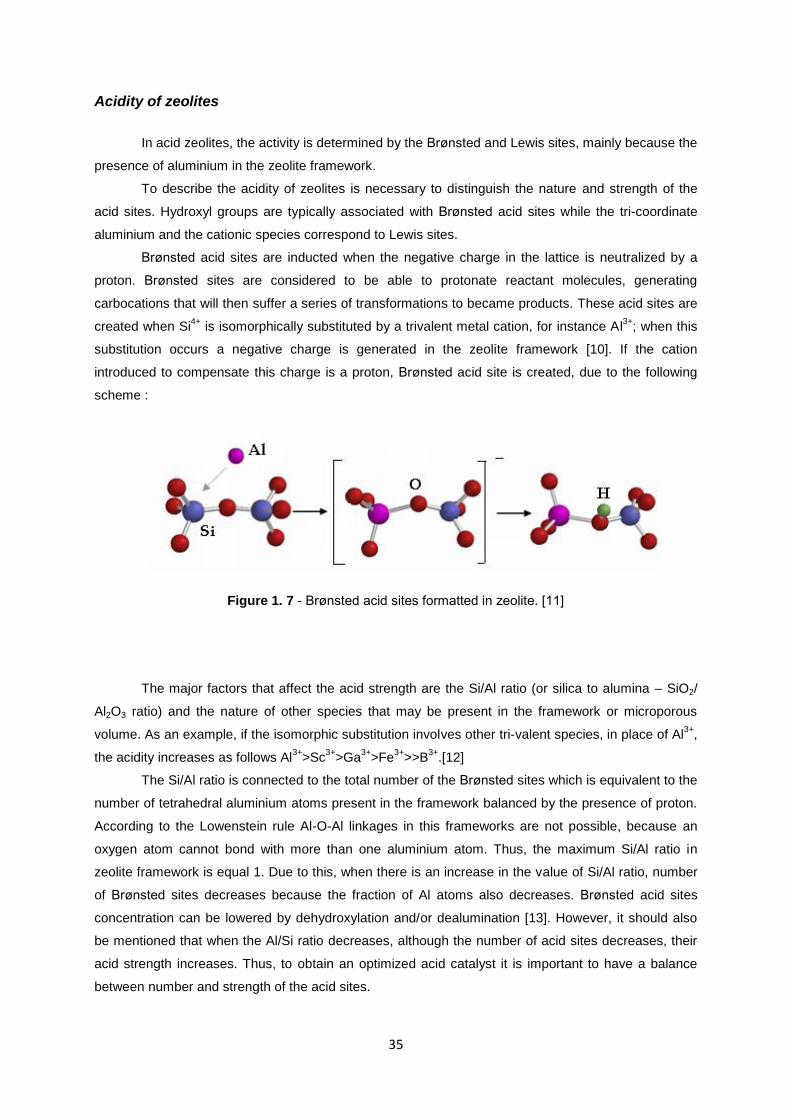
Brønsted acid sites are inducted when the negative charge in the lattice is neutralized by a
proton. Brønsted sites are considered to be able to protonate reactant molecules, generating
carbocations that will then suffer a series of transformations to became products. These acid sites are
created when Si4+
is isomorphically substituted by a trivalent metal cation, for instance Al3+
; when this
substitution occurs a negative charge is generated in the zeolite framework [10]. If the cation
introduced to compensate this charge is a proton, Brønsted acid site is created, due to the following
scheme :
Figure 1. 7 - Brønsted acid sites formatted in zeolite. [11]
The major factors that affect the acid strength are the Si/Al ratio (or silica to alumina – SiO2/
Al2O3 ratio) and the nature of other species that may be present in the framework or microporous
volume. As an example, if the isomorphic substitution involves other tri-valent species, in place of Al3+
,
the acidity increases as follows Al3+
>Sc3+
>Ga3+
>Fe3+
>>B3+
.[12]
The Si/Al ratio is connected to the total number of the Brønsted sites which is equivalent to the
number of tetrahedral aluminium atoms present in the framework balanced by the presence of proton.
According to the Lowenstein rule Al-O-Al linkages in this frameworks are not possible, because an
oxygen atom cannot bond with more than one aluminium atom. Thus, the maximum Si/Al ratio in
zeolite framework is equal 1. Due to this, when there is an increase in the value of Si/Al ratio, number
of Brønsted sites decreases because the fraction of Al atoms also decreases. Brønsted acid sites
concentration can be lowered by dehydroxylation and/or dealumination [13]. However, it should also
be mentioned that when the Al/Si ratio decreases, although the number of acid sites decreases, their
acid strength increases. Thus, to obtain an optimized acid catalyst it is important to have a balance
between number and strength of the acid sites.
36
However, there are other kinds of acid sites present in zeolites, Lewis sites which are
generated by the presence of cationic species. In the case of zeolites, the Lewis acidity may be
associated to extraframework alumina species (EFAL) and to aluminium species that are removed
from the framework during high temperature hydrothermal treatments. [14]
Lewis acid sites can be associated with different surface species: Al(OH)2+ , Al(OH)
2+ , AlO
+,
[Al2O2OH]+, [Al2O]
4+, AlOOH, Al(OH)3 and Si
+ may be observed in the zeolite structure [11,12].
1.5.2 Vermiculites
Vermiculite is the geological name given to a group of hydrated laminar minerals which are
aluminum-iron magnesium silicates. They have the appearance of mica, and can be found in various
parts of the world. When processed for horticultural use, the mineral is subjected to intense heat,
expanding it into accordion-shaped granules with countless layers of thin plates.[15]
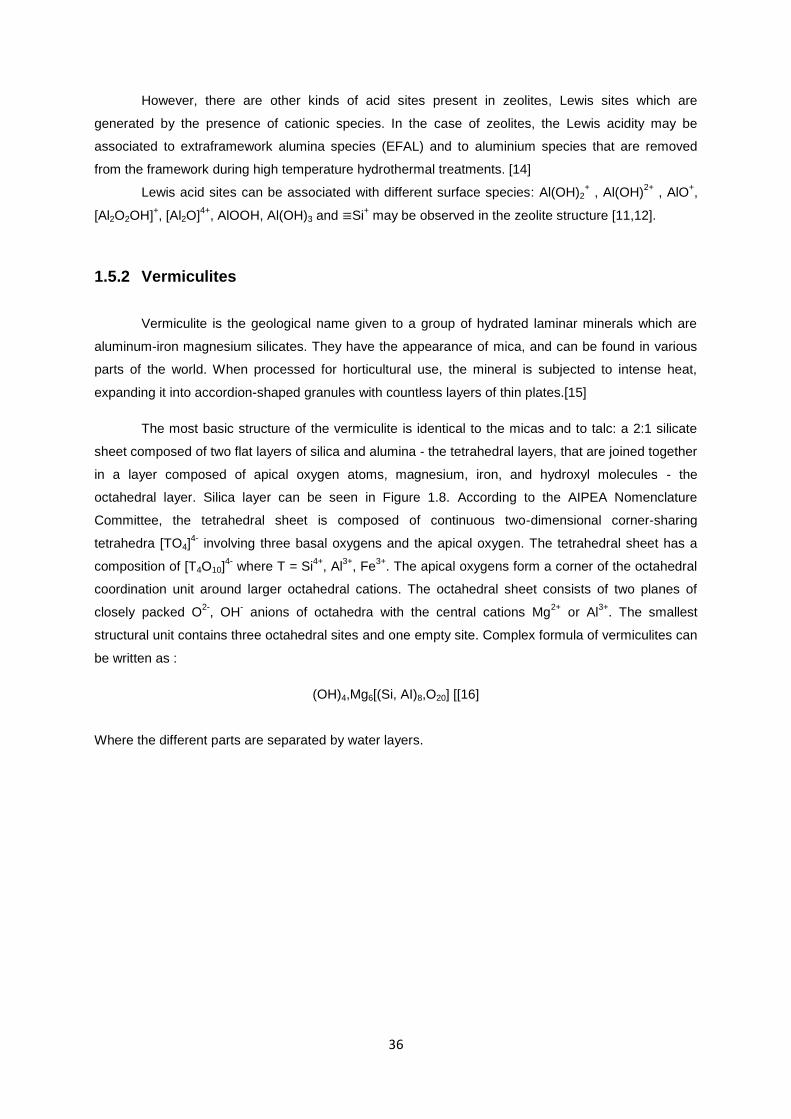
The most basic structure of the vermiculite is identical to the micas and to talc: a 2:1 silicate
sheet composed of two flat layers of silica and alumina - the tetrahedral layers, that are joined together
in a layer composed of apical oxygen atoms, magnesium, iron, and hydroxyl molecules - the
octahedral layer. Silica layer can be seen in Figure 1.8. According to the AIPEA Nomenclature
Committee, the tetrahedral sheet is composed of continuous two-dimensional corner-sharing
tetrahedra [TO4]4-
involving three basal oxygens and the apical oxygen. The tetrahedral sheet has a
composition of [T4O10]4-
where T = Si4+
, Al3+
, Fe3+
. The apical oxygens form a corner of the octahedral
coordination unit around larger octahedral cations. The octahedral sheet consists of two planes of
closely packed O2-
, OH- anions of octahedra with the central cations Mg
2+ or Al
3+. The smallest
structural unit contains three octahedral sites and one empty site. Complex formula of vermiculites can
be written as :
(OH)4,Mg6[(Si, AI)8,O20] [[16]
Where the different parts are separated by water layers.
37
Figure 1. 8 - The scheme of the silica layer in vermiculite.
The vermiculite structure includes water interlamellar layers that are subjected to the hydration
and dehydration processes. The hydration properties are controlled by the interlayer cations Mg2+
and
minor amounts of Ca2+
, Na+, and K
+. The cation radius and charge influence the degree of hydration
state in the interlayer and the stacking layer sequences. The hydration state of vermiculite is defined
by the number of water layers in the interlayer space. The basal space of Mg-vermiculite was
measured as 0.902 nm for zero-water layer, 1.150 nm for one-water layer and 1.440 nm for two water
layer hydration state.
Typically, the pH of the vermiculites is close to neutral, but in some cases, with the presence
of associate carbonate compounds, the reaction is alkaline. Thus, the pH of vermiculite can change
within a range from 6 to above 9.5. Also, depending on how this mineral is processed (exfoliated or
expanded), the pH of the expanded particles can also change.
Vermiculites vary in their chemical composition, and this influences their morphology, surface
acidity and cation exchange capacity. Many of them contain significant amounts of transition metal
cations, for example iron, which is a typical component of vermiculites. To increase the acidity of
vermiculites, which is a very desirable property in polymer degradation reactions, an acid-activation
has to be performed. Acid treatment produces an increase in surface area and acidity. During this
operation exchangeable cations are replaced with H ions, and leaching of Al and other cations out of
both octahedral and tetrahedral sites occurs, but leaving the SiO4 groups intact largely. The detailed
preparation of catalysts from vermiculites is described in chapter 2. [17]
38
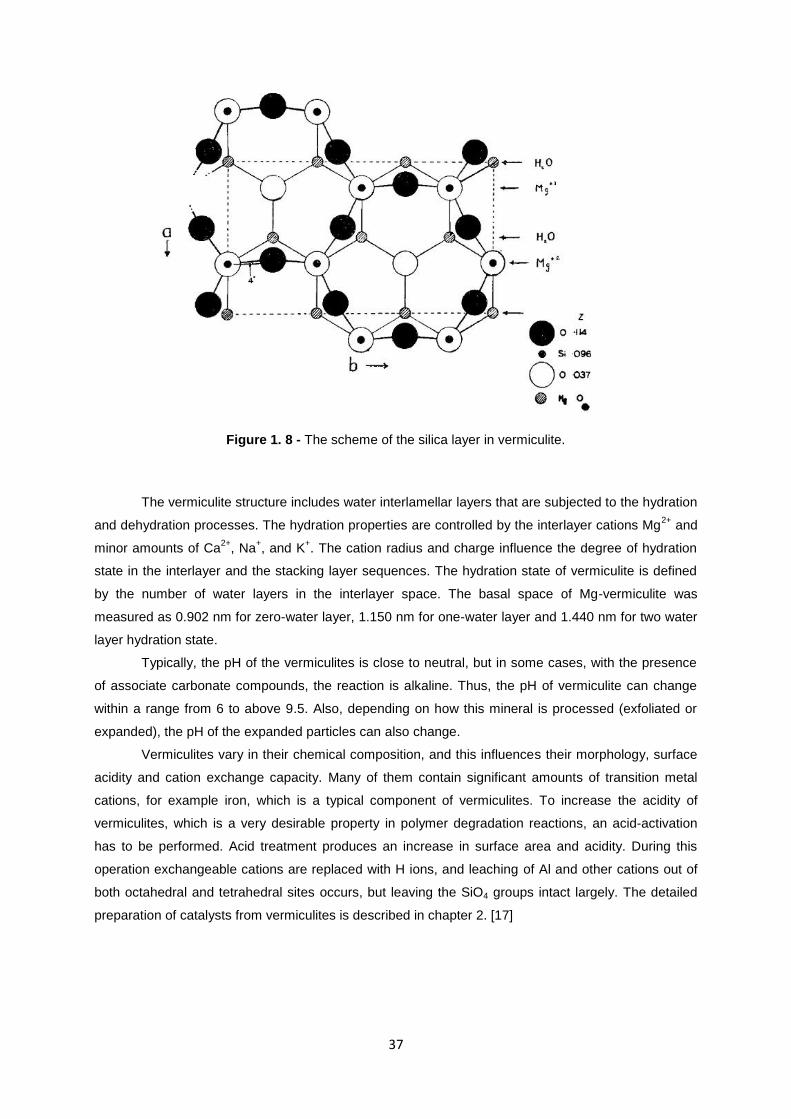
1.5.3 Montmorillonites
Montmorillonites are clay minerals broadly used in industrial processes, because of their
properties: large specific surface area and high thermal stability. In this work montmorillonites,
extracted from bentonite, were used. They belong to the smectities group and have packing of 2:1,
consisting of two silica tetrahedral sheets with central alumina octahedral sheet (as it can be seen in
figure 1.9). Oxygen atoms bind to these sheets. The layers are continous in a and b axis directions
and are stacked one above other in c direction; the degree of order dependent on the smectite clay
mineral kind. There can be moderately isomorphic substitutions varying on the kind of mineral.
Figure 1. 9 - Montmorillonite structure. T – tetrahedral sheet, O – octahedral sheet [5].
Bentonite is obtained from the substitution of Al3+
for Mg2+
in the octahedral layer [19],
resulting in the following molecular formula :
Mx+ (Si8)
IV(Al4-x Mgx)
VI O20(OH)4
Where: M+
is the interchangable cation.
The parameters of montmorillonite (surface area and high termal stability) are related to the
changes produced in the crystal structure by isomorphic substitutions. These substitutions take places
both in a tetrahedral and octahedral layers, producing a negative charge density in the crystal
structure. Also, some treatments, that modify this structure of crystals, for example cation exchanges,

39
thermal and mechanical treatments can add some other properties such as compression strength,
swelling degree, resistance to degradation, etc. [18]
All of these properties have a significant importance in industrial processes. In oil industry,
montmorillonites are used as absorbents to remove pollutants in suspension from products in the
fractional distillation of crude.
Similar to vermiculites, acid treatment changes some properties of montmorillonities. It
extends the surface and alters the pore size distribution by removing aluminium and other ions from
the octahedral layer. Activation with hydrochloric acid also modifies the clays surface by replacing the
exchangeable ions with hydrogen and aluminium. [20]

40
41
CHAPTER 2. EXPERIMENTAL PROCEDURES AND APPARATUS
This chapter describes methods and techniques used to study the degradation of
polypropylene. Firstly, there is a specification of the polymer and the catalyst material used. Secondly,
the method interposed in the Thermogravimetric (TG) and Differential Scanning Calorimetric (DSC)
analysis accompanied with the method for analyzing gas products from TGA and DSC apparatus
during the polymer degradation will be reviewed.
2.1 Polymer Materials
The materials used in this work were both polypropylene with and without additives, kindly
supplied by Borealis. Polypropylene with additives in powder form had, according to the supplier,
molecular weight Mw~290 000 (α=Mw/Mn~20); and show melt flow indexes MFI5=0.39/10min;
MFI21=11.8g/10min; MFI21/MFI5= 30 while the polypropylene without additives samples were in form
of pellets and show a molecular weight, Mw~376 000 (Mw/Mn~23).
2.2 Catalyst Materials
1) Zeolites
HZSM – 5
HY
BEA
H-BEA
2) Vermiculites
Transition metals supported in vermiculites as catalysts, namely zirconium, alumina, copper
and silver.
3) Montmorillonites
Mt6OAlCu
K10 + Cu2+
K10 Al Ag+
42
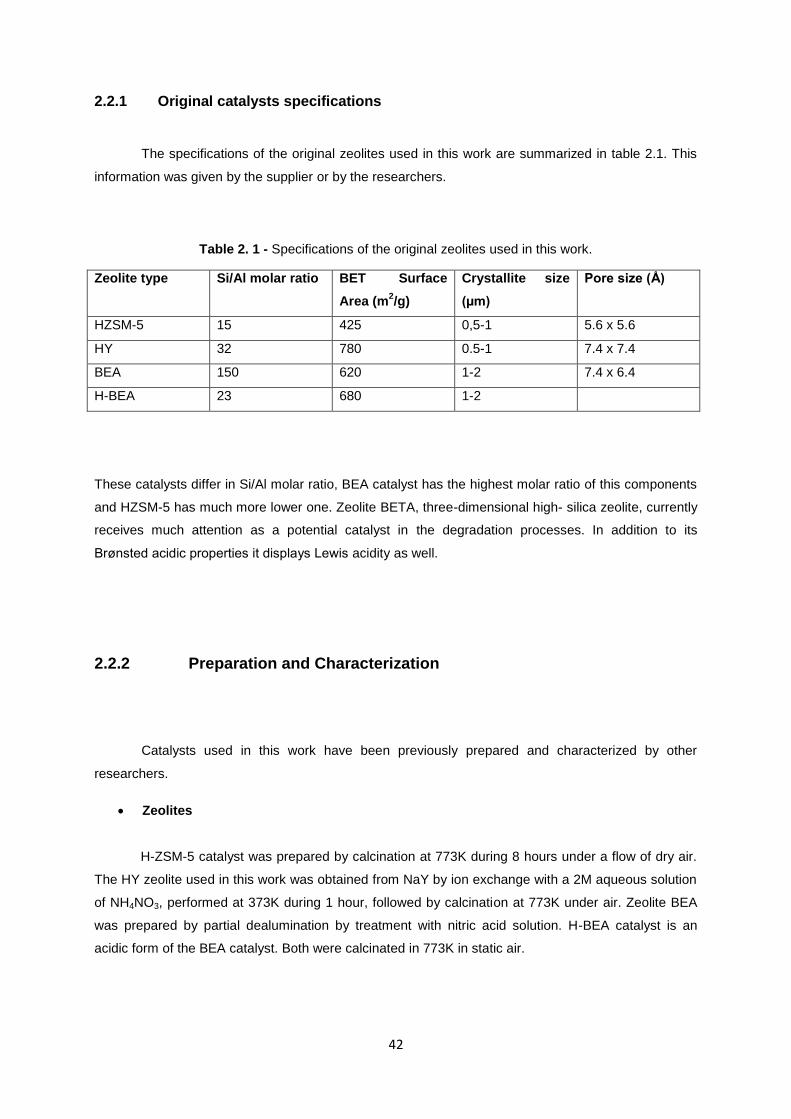
2.2.1 Original catalysts specifications
The specifications of the original zeolites used in this work are summarized in table 2.1. This
information was given by the supplier or by the researchers.
Table 2. 1 - Specifications of the original zeolites used in this work.
Zeolite type Si/Al molar ratio BET Surface
Area (m2/g)
Crystallite size
(µm)
Pore size (Å)
HZSM-5 15 425 0,5-1 5.6 x 5.6
HY 32 780 0.5-1 7.4 x 7.4
BEA 150 620 1-2 7.4 x 6.4
H-BEA 23 680 1-2
These catalysts differ in Si/Al molar ratio, BEA catalyst has the highest molar ratio of this components
and HZSM-5 has much more lower one. Zeolite BETA, three-dimensional high- silica zeolite, currently
receives much attention as a potential catalyst in the degradation processes. In addition to its
Brønsted acidic properties it displays Lewis acidity as well.
2.2.2 Preparation and Characterization
Catalysts used in this work have been previously prepared and characterized by other
researchers.
Zeolites
H-ZSM-5 catalyst was prepared by calcination at 773K during 8 hours under a flow of dry air.
The HY zeolite used in this work was obtained from NaY by ion exchange with a 2M aqueous solution
of NH4NO3, performed at 373K during 1 hour, followed by calcination at 773K under air. Zeolite BEA
was prepared by partial dealumination by treatment with nitric acid solution. H-BEA catalyst is an
acidic form of the BEA catalyst. Both were calcinated in 773K in static air.
43
Vermiculites
Vermiculite from Brazil was used as a starting material. The particle size fraction < 40 μm was
obtained by milling in a planetary mill for 20 min and sieving by a sieve with a pore size of less than 40
μm.
Vermiculites with transition metals : Cu2+
,Zr2+
and Ag+
were prepared by introducing 5 % of the
adequate metal by incipient wetness impregnation.
Samples V/Ag and V/Cu were prepared from vermiculite (V) and the 0.1M aqueous solution
AgNO3 and 0.1 M Cu(NO3)2, respectively, at the ratio of 1:10 (grams of vermiculite: millilitre of
solution), and the suspension was shaken for 24 hours.
Catalyst VH Cu+
was prepared by acid activation with 20% hydrochloric acid for 60 min. Next,
5 % of copper was introduced by incipient wetness impregnation. The same way were the VH Ag+
prepared, but instead of copper, 5% of silver was introduced.
Montmorillonites
Mt6OAlCu catalyst is a sample of montmorillonite extracted with bentonite. It was activated for 60
min with 20% hydrochloric acid. Next, it was supported by aqua hydroxo aluminum cations and 5%
copper was introduced by incipient wetness impregnation.
KlO Cu2+
it is a commercial acid-activated montmorillonite catalyst, supplied by Aldrich company.
In this catalyst, 5% of the copper were introduced by incipient wetness impregnation.
KlO Al Ag is also commercial acid-activated catalyst supplied by Aldrich. It was prepared by aqua
hydroxo aluminium cations and 5% of silver was introduced by incipient wetness impregnation.
2.3 Acid strength distribution
The acid strength of the several catalysts, representatives of each group was determined by
temperature-programed desorption (TPD) of ammonia.
The catalyst samples were saturated with ammonia by placing them in a container with an
ammonium solution; this solution staturated the atmosphere within the vessel with gaseous ammonia
and was kept at 40 ºC for 12 hours.
After saturation, the desorption experiments were carried out in a DSC/TG apparatus, using a
quartz pan. Samples were heated up to 600 °C with a heating rate equal 10°C. Blank experiments,
were no ammonia was adsorbed were also performed in order to obtain baselines.
44
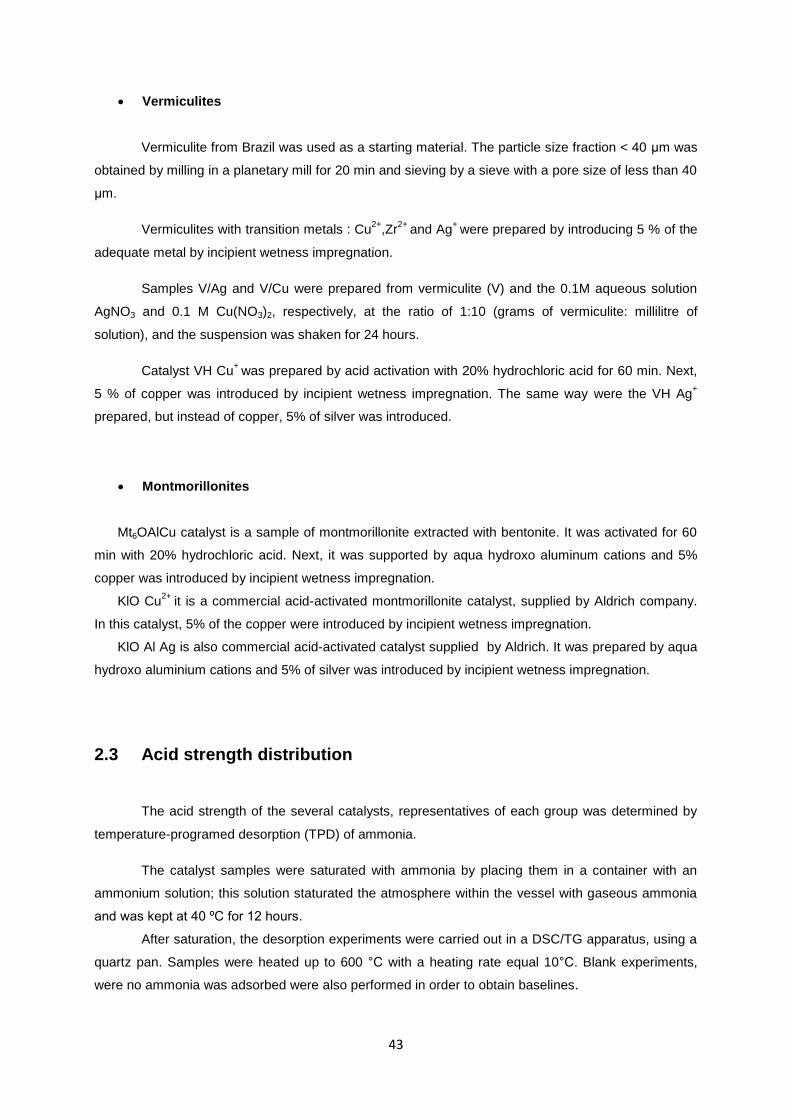
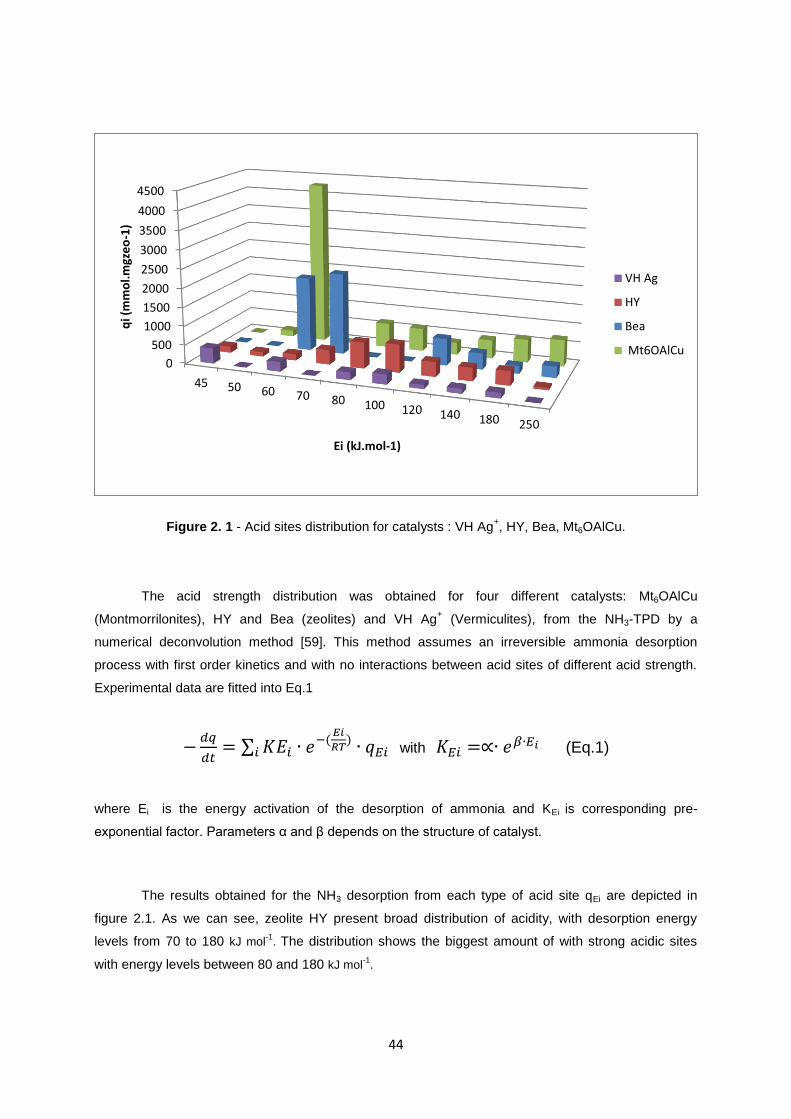
Figure 2. 1 - Acid sites distribution for catalysts : VH Ag+, HY, Bea, Mt6OAlCu.
The acid strength distribution was obtained for four different catalysts: Mt6OAlCu
(Montmorrilonites), HY and Bea (zeolites) and VH Ag+ (Vermiculites), from the NH3-TPD by a
numerical deconvolution method [59]. This method assumes an irreversible ammonia desorption
process with first order kinetics and with no interactions between acid sites of different acid strength.
Experimental data are fitted into Eq.1
∑
with (Eq.1)
where Ei is the energy activation of the desorption of ammonia and KEi is corresponding pre-
exponential factor. Parameters α and β depends on the structure of catalyst.
The results obtained for the NH3 desorption from each type of acid site qEi are depicted in
figure 2.1. As we can see, zeolite HY present broad distribution of acidity, with desorption energy
levels from 70 to 180 kJ mol-1
. The distribution shows the biggest amount of with strong acidic sites
with energy levels between 80 and 180 kJ mol-1
.
0
500
1000
1500
2000
2500
3000
3500
4000
4500
45 50 60 70 80 100 120 140 180 250
qi (
mm
ol.
mgz
eo
-1)
Ei (kJ.mol-1)
VH Ag
HY
Bea
Mt6OAlCu

45
In figure 2.1 distributions for other catalysts are also depicted. Vermiculite VH Ag+ has very
small amount of strong acidic sites and only some weak acidic sites, with desorption energy level
equal to about 60 kJ mol-1
. Catalyst Mt6OAlCu shows a broad distribution of acidity, with desorption
levels from 80 to 250 kJ mol-1
. It also presents a large amount of weak acidic sites with desorption energy 60 kJ
mol-1
.
Another zeolite, Bea, shows similar results to the HY. It has significant values of strong acidic sites with
energy levels from 120 to 250 kJ mol-1
, as well as a big values of weaker acidic sites, with desorption energy
levels equal 60-70 kJ mol-1
. High values of the desorption energies at levels 50 – 70 kJ mol-1
for the Mt6OAlCu
and Bea catalysts can be explained due to the fact that there was some quantities of water which were also
desorbed, apart to NH3.
2.4 General Gases specifications
Nitrogen Air Liquide (>99.995%)
Hydrogen Air Liquide (>99.9990%)
2.5 Thermogravimetric (TG) and Differential Scanning
Calorimetric (DSC) analysis
2.5.1 Sample preparation
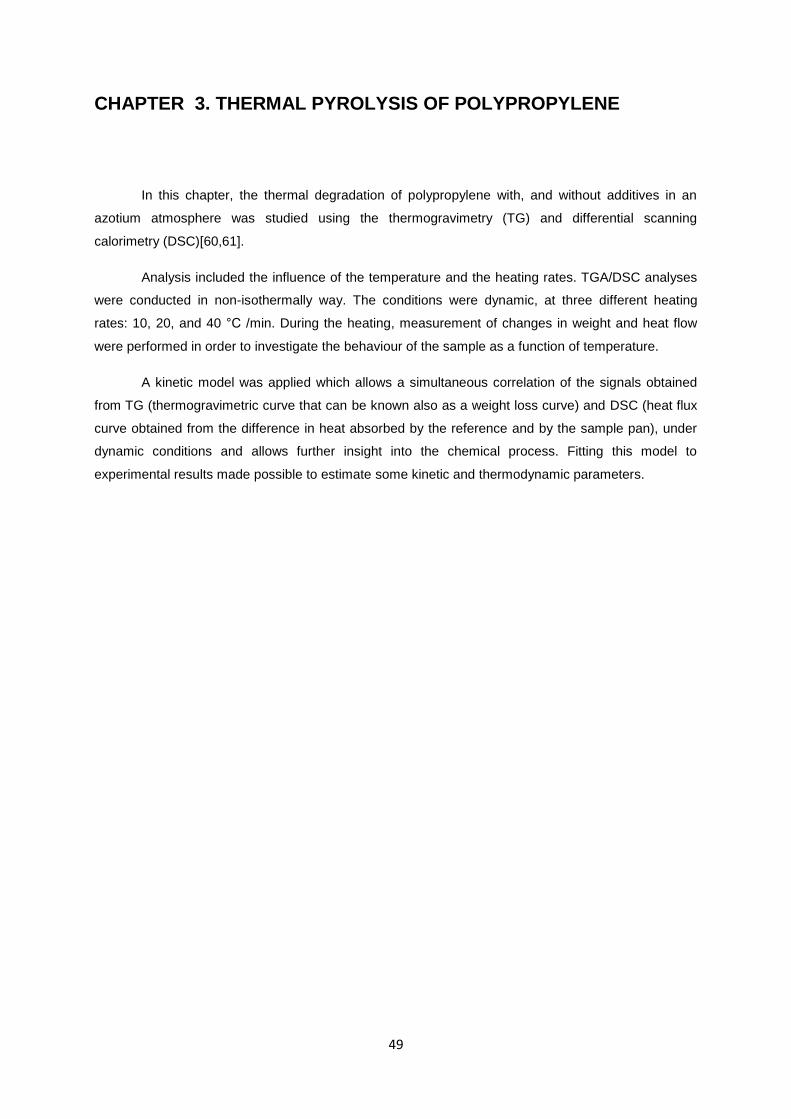
All of the TG/DSC experiments were carried-out in a TA Instruments SDT 2960 simultaneous
DSC-TGA apparatus. Before the runs, nitrogen flow was maintained through the system for 30 min to
purge all the air from it. This flow rate was maintained during the experiments.
The PP samples, pure or along with the catalysts were placed in quartz TG pan and the
thermal degradation was analyzed. The PP/catalyst mixture was prepared at room temperature in
order to obtain 15-25 mg of mixture. The quantity of catalyst used was approximately 1-3mg,
depending on the experiment.
2.5.2 Temperature Profile
The first part of the experiments was carried out using dynamic conditions, by raising the
temperature with different heating rates. The runs were performed under nitrogen with continuous flow
rate 80ml/min, with various heating rates: 10,20 and 40 °C/min. The temperature was going up from
46
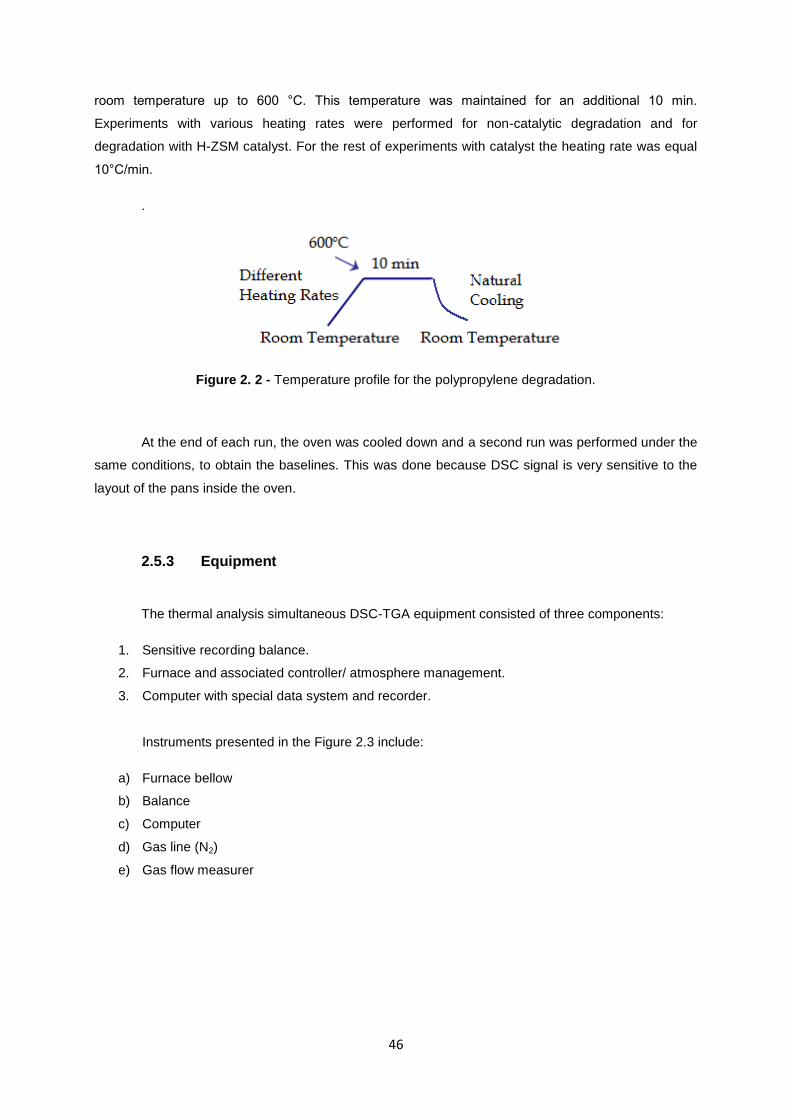
room temperature up to 600 °C. This temperature was maintained for an additional 10 min.
Experiments with various heating rates were performed for non-catalytic degradation and for
degradation with H-ZSM catalyst. For the rest of experiments with catalyst the heating rate was equal
10°C/min.
.
Figure 2. 2 - Temperature profile for the polypropylene degradation.
At the end of each run, the oven was cooled down and a second run was performed under the
same conditions, to obtain the baselines. This was done because DSC signal is very sensitive to the
layout of the pans inside the oven.
2.5.3 Equipment
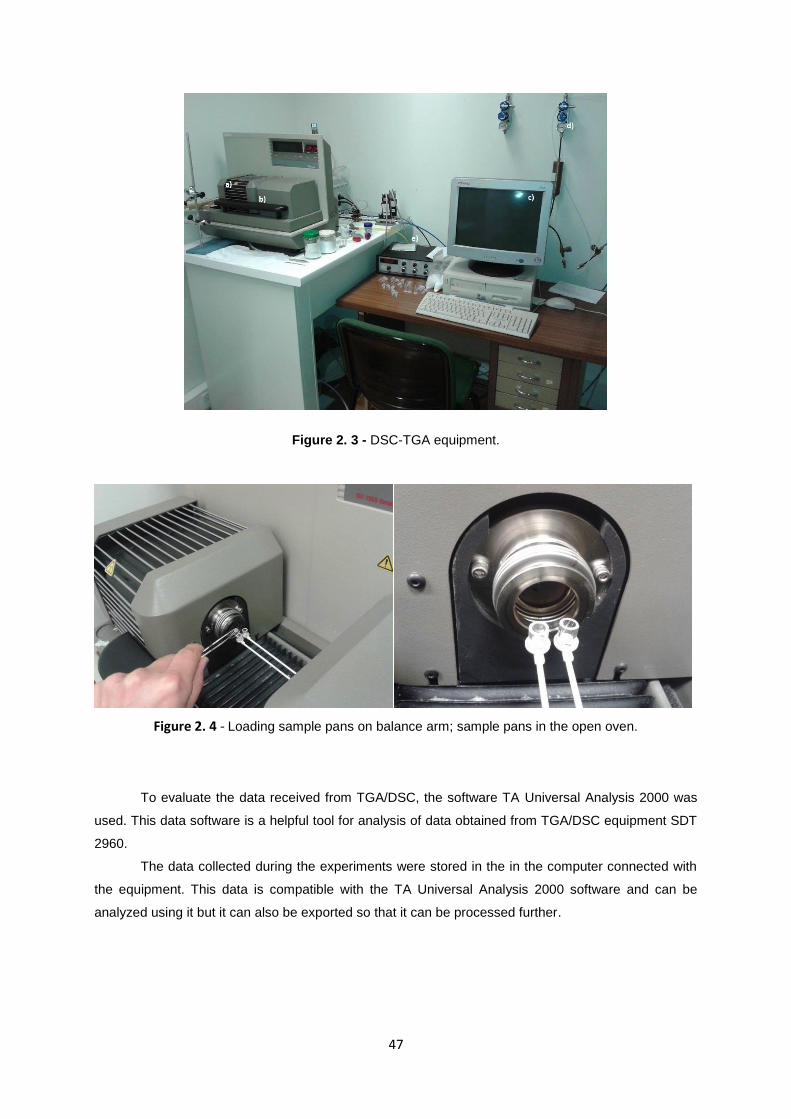
The thermal analysis simultaneous DSC-TGA equipment consisted of three components:
1. Sensitive recording balance.
2. Furnace and associated controller/ atmosphere management.
3. Computer with special data system and recorder.
Instruments presented in the Figure 2.3 include:
a) Furnace bellow
b) Balance
c) Computer
d) Gas line (N2)
e) Gas flow measurer
47
Figure 2. 3 - DSC-TGA equipment.
Figure 2. 4 - Loading sample pans on balance arm; sample pans in the open oven.
To evaluate the data received from TGA/DSC, the software TA Universal Analysis 2000 was
used. This data software is a helpful tool for analysis of data obtained from TGA/DSC equipment SDT
2960.
The data collected during the experiments were stored in the in the computer connected with
the equipment. This data is compatible with the TA Universal Analysis 2000 software and can be
analyzed using it but it can also be exported so that it can be processed further.

48
49
CHAPTER 3. THERMAL PYROLYSIS OF POLYPROPYLENE
In this chapter, the thermal degradation of polypropylene with, and without additives in an
azotium atmosphere was studied using the thermogravimetry (TG) and differential scanning
calorimetry (DSC)[60,61].
Analysis included the influence of the temperature and the heating rates. TGA/DSC analyses
were conducted in non-isothermally way. The conditions were dynamic, at three different heating
rates: 10, 20, and 40 °C /min. During the heating, measurement of changes in weight and heat flow
were performed in order to investigate the behaviour of the sample as a function of temperature.
A kinetic model was applied which allows a simultaneous correlation of the signals obtained
from TG (thermogravimetric curve that can be known also as a weight loss curve) and DSC (heat flux
curve obtained from the difference in heat absorbed by the reference and by the sample pan), under
dynamic conditions and allows further insight into the chemical process. Fitting this model to
experimental results made possible to estimate some kinetic and thermodynamic parameters.
50
3.1 Polypropylene with additives
3.1.1 Dynamic conditions at three different heating rates
3.1.2 DSC/TG analysis
The results obtained from the DSC/TG analysis on PP with additives sample for four different
heating rates are shown in figure 3.1. Picture (Figure 3.1b) shows the curve corresponding to the DSC
signal with two endothermic peaks. The first one corresponds to the melting of the polypropylene
sample, which occurs at 170 °C/min and has no significant weight change, as it can be seen in Figure
3.1a. The second endothermic peak occurs at higher temperatures and is related with polymer
degradation. This peak is accompanied by a weight loss. The start of the second DSC signal is due to
the energy which is given to the sample when the bonds in the polymer begin to break. This breakage
of the bonds in the polypropylene produces increasingly lighter products that will become sufficiently
small to be volatile at the temperature of reaction and will evaporate from the pan, leading to the easily
observed mass losses as well as to additional consumption of energy.
The temperature at which polypropylene with additives suffers thermal degradation when
using heating rates between 10 and 40 C/min are in the range of 458 to 488°C . The list with all
temperatures at which the maximum rate of heat consumption occurs for this process are presented in
table 3.1 for the different heating rates.
With increasing heating rates, all the temperature maxima shift towards higher temperatures
(see both table 3.1 and figure 3.3), because of a variety of factors and in accordance with other
experimental observations. The most important one is related to a kinetic effects. In a single run along
with the temperature increasing, the rate of chemical and physical processes taking place also
increase in an exponential form, which leads to an increase in heat and mass loss rates.
Nevertheless, when sufficient material is transformed, the decrease in the amount of available species
compensates this increase in the reaction rate, which leads to the maximum observed in the rate
curves. This maximum shifts to higher temperatures as the heating rate is increased, because at
higher heating rates there is less time for the reaction to occur, and the depletion of the reactants
takes place at higher temperatures.
Seeing that the rate of the reaction increases faster in the case of the higher heating rates, in
figure 3.3b it is possible to observe that the highest peak corresponds to the highest heating rate used
(40°C ), as well that the lowest peak corresponds to the lowest heating rate (10 °C/min).
The effect of the heat transfer may also become more important when the heating rates
increases, as well as the dynamics of the equipment may also become more important for very high
heating rates. When the heating rate is too high, the sample temperature might not be linear with the
increase of the furnace temperature.
51
There is also an effect that is noticeable at the higher heating rate – the degradation peak appears to
be split into two different peaks, which may indicate that the chemical reactions occurring have two
different pathways with different activation energies.
Table 3. 1 - Degradation temperature for the polypropylene samples obtained from TGA/DSC results.
Sample Tdegrad. (°C)
PP with add.10°C/min 458,9
PP with add. 20°C/min 477,2
PP with add. 40°C/min 488,2
-0,2
0
0,2
0,4
0,6
0,8
1
1,2
0 100 200 300 400 500 600 700
we
igh
t fr
acti
on
T(°C)
PP 10°C/min
PP 20°C/min
PP 40°C/min
a)
52
Figure 3. 1 – TG (a) and Heat Flow (b) curves obtained from the degradation of PP with additives at
different heating rates ( see chapter 2 for additional conditions).
3.1.2.2 Kinetic model studies
The degradation process takes place by successive bond breakages. With every bond broken,
a certain amount of energy is needed and this can be seen in the heat flow signal. However, the TG
signal only records mass losses and not all bonds breakages are accompanied by losses of mass.
When relatively small molecules are formed, they will leave the system with the gas flow and
then a mass loss is detected. The initial bond breakages will lead to the formation of relatively large
molecules that will not be volatile. This will not result in any measurable weight change. For that
reason. only the combination of DSC and TG will be able to provide a full look into the degradation
process.
The formation of gas phase products involves two steps. The first one corresponds to the
breakage of the bonds and production of smaller molecules and the second one corresponds to the
evaporation of these smaller products. Each of the steps is associated with a different energy
consumption. This information was used to build a computational model employed to interpret
experimental results which were obtained.
The information used to develop the computational model was the material and energy
balances to the number of bonds in the sample at each experiment. We assume that the
-140
-120
-100
-80
-60
-40
-20
0
0 200 400 600 800
Co
rre
cte
d H
eat
Flo
w [
mW
]
T(°C)
PP 10°C/min
PP 20°C/min
PP 40°C/min
b)
53
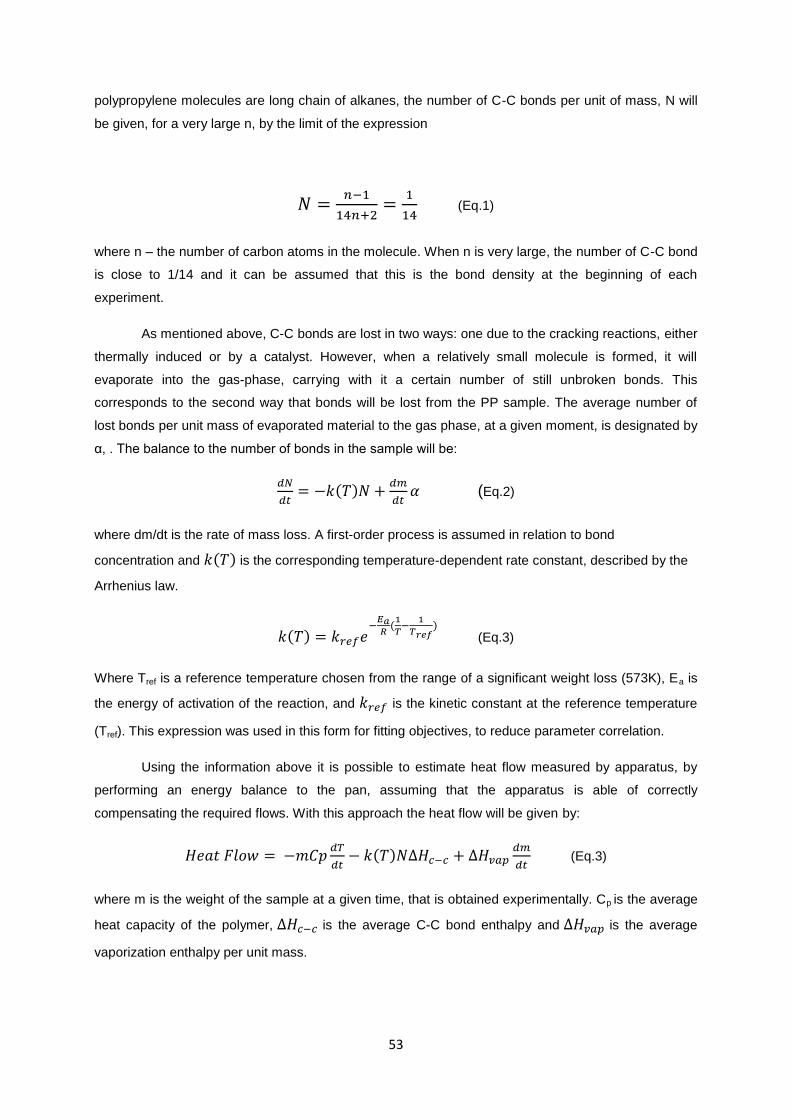
polypropylene molecules are long chain of alkanes, the number of C-C bonds per unit of mass, N will
be given, for a very large n, by the limit of the expression
(Eq.1)
where n – the number of carbon atoms in the molecule. When n is very large, the number of C-C bond
is close to 1/14 and it can be assumed that this is the bond density at the beginning of each
experiment.
As mentioned above, C-C bonds are lost in two ways: one due to the cracking reactions, either
thermally induced or by a catalyst. However, when a relatively small molecule is formed, it will
evaporate into the gas-phase, carrying with it a certain number of still unbroken bonds. This
corresponds to the second way that bonds will be lost from the PP sample. The average number of
lost bonds per unit mass of evaporated material to the gas phase, at a given moment, is designated by
α, . The balance to the number of bonds in the sample will be:
(Eq.2)
where dm/dt is the rate of mass loss. A first-order process is assumed in relation to bond
concentration and is the corresponding temperature-dependent rate constant, described by the
Arrhenius law.
(Eq.3)
Where Tref is a reference temperature chosen from the range of a significant weight loss (573K), Ea is
the energy of activation of the reaction, and is the kinetic constant at the reference temperature
(Tref). This expression was used in this form for fitting objectives, to reduce parameter correlation.
Using the information above it is possible to estimate heat flow measured by apparatus, by
performing an energy balance to the pan, assuming that the apparatus is able of correctly
compensating the required flows. With this approach the heat flow will be given by:
(Eq.3)
where m is the weight of the sample at a given time, that is obtained experimentally. Cp is the average
heat capacity of the polymer, is the average C-C bond enthalpy and is the average
vaporization enthalpy per unit mass.
54
This expression can be fit to the experimental heat flow curve taken from the correction DSC curve
after baseline. The fitting parameters are: kref, Ea, α, Cp, ΔHC-C and ΔHvap. For the latter three, initial
values were obtained from the published data. The average number of bonds in the evaporated
material, α, was taken as independent of time. In addition, response time of the heat sensor flow was
assumed as finite and a first order dynamics was assumed for the sensor, for which the corresponding
time constant was estimated during the fitting procedure.
The equation 2 was solved numerically, with use of the Euler method. The model parameters
were estimated by a least-squares procedure, using the sum of the squares of the residues on the
heat flow as the objective function, to be minimized:
∑ [ ] (Eq.5)
The optimization procedure was carried out using ‘Solver’ tool from the Excel (© Windows)
spreadsheet.
The model provides good fittings to the experimental data despite of the fact that some
parameters, such as ΔHvap and α were taken as independent of the temperature and time.
The fittings are plotted in figure 3.2 and all the kinetic parameters obtained by fitting the kinetic
model for the pyrolysis of PP with additives at various heating rates are listed in table 3.2.
Table 3. 2 - Model parameters obtained by fitting the kinetic model for the thermal degradation of PP
with additives at different heating rates
Heating rates (°C/min) 10 20 40
K (300ºC) (min-1)
5,43 x 10⁻⁴
2,42 x 10⁻⁴
1,22 x 10⁻⁴
Ea
(cal/mol/K)
30000,12 30005,7 40804,1
ΔHC-C
(mJ/mmol)
20001,55 20001,27 22695,12
ΔHvap
(mJ/mg)
248,68 256,51 15986,07
α
(Bond mole.g-1)
0,0212 0,0294 0,5914
Cp
(mJ/mg/K)
2,6 2,75 1,75
55
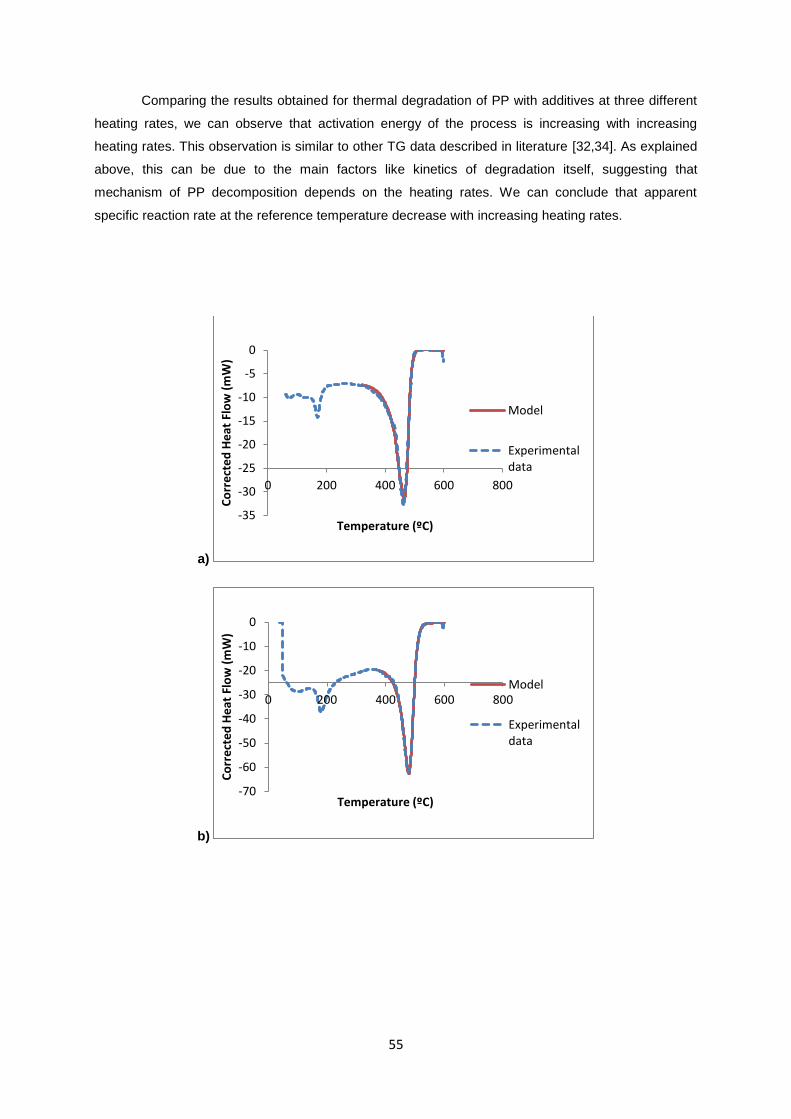
Comparing the results obtained for thermal degradation of PP with additives at three different
heating rates, we can observe that activation energy of the process is increasing with increasing
heating rates. This observation is similar to other TG data described in literature [32,34]. As explained
above, this can be due to the main factors like kinetics of degradation itself, suggesting that
mechanism of PP decomposition depends on the heating rates. We can conclude that apparent
specific reaction rate at the reference temperature decrease with increasing heating rates.
a)
b)
-35
-30
-25
-20
-15
-10
-5
0
0 200 400 600 800
Co
rre
cte
d H
eat
Flo
w (
mW
)
Temperature (ºC)
Model
Experimentaldata
-70
-60
-50
-40
-30
-20
-10
0
0 200 400 600 800
Co
rre
cte
d H
eat
Flo
w (
mW
)
Temperature (ºC)
Model
Experimentaldata
56
c)
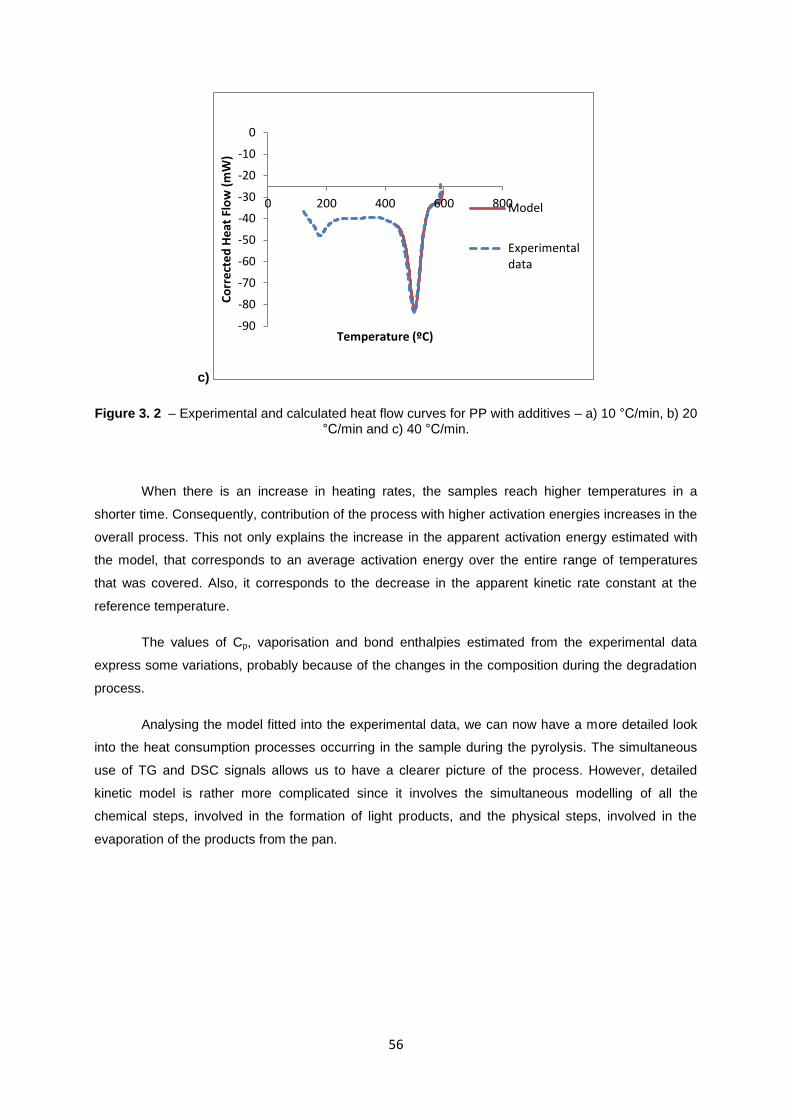
Figure 3. 2 – Experimental and calculated heat flow curves for PP with additives – a) 10 °C/min, b) 20
°C/min and c) 40 °C/min.
When there is an increase in heating rates, the samples reach higher temperatures in a
shorter time. Consequently, contribution of the process with higher activation energies increases in the
overall process. This not only explains the increase in the apparent activation energy estimated with
the model, that corresponds to an average activation energy over the entire range of temperatures
that was covered. Also, it corresponds to the decrease in the apparent kinetic rate constant at the
reference temperature.
The values of Cp, vaporisation and bond enthalpies estimated from the experimental data
express some variations, probably because of the changes in the composition during the degradation
process.
Analysing the model fitted into the experimental data, we can now have a more detailed look
into the heat consumption processes occurring in the sample during the pyrolysis. The simultaneous
use of TG and DSC signals allows us to have a clearer picture of the process. However, detailed
kinetic model is rather more complicated since it involves the simultaneous modelling of all the
chemical steps, involved in the formation of light products, and the physical steps, involved in the
evaporation of the products from the pan.
-90
-80
-70
-60
-50
-40
-30
-20
-10
0
0 200 400 600 800
Co
rre
cte
d H
eat
Flo
w (
mW
)
Temperature (ºC)
Model
Experimentaldata
57
3.2 Polypropylene without additives samples
3.2.1 Dynamic conditions at three different heating rates
3.2.1.1 DSC/TG analysis
The thermogravimetric analysis (TGA) and heat flow (DSC) curves for the pyrolysis of the
samples of polypropylene without additives were tested for three different heating rates : 10, 20 and
40 °C/min. The results obtained are shown in figure 3.3. Decomposition of PP without additives in this
range of heating rates vary from 459 °C to 494,7°C ( see details in Table 3.3).
An single weight loss step characterizes the weight loss curves for this type of PP for different
heating rates. The same comment was made for the weight loss curves obtained for PP with additives
samples.
There is also an increase of the maximum of the heat flow curves to higher temperatures with the
increasing heating rate (figure 3.3 and table 3.3), the reason is the same as one discussed in the
previous subsection for PP with additives.
Another conclusion is that the highest area of the peaks corresponds to the highest heating
rate (40 °C/min), and the smaller peak corresponds to the lowest heating rate used during the
experiment (10 °C/min). With the lower heating rates there are two big differences when compare it
with the higher heating rates: the weight loss start at lower temperatures and complete thermal
decomposition occurs at lower temperatures. Also, using lower heating rates the complete time
needed for the process is longer.
For the PP without additives decomposition starts at temperatures between: 459 °C, and the
end of decomposition occurs at 494,7°C, for the heating rates in range 10-40 °C/min.
Table 3. 3 - Degradation temperatures for the Polypropylene without additives samples from TGA/DSC
results, for different heating rates.
Sample Tdegrad. (°C)
PP without add. 10°C/min 459
PP without add. 20°C/min 477,9
PP without add. 40°C/min 494,7

58
Figure 3. 3 - TG (a) and Heat Flow (b) curves obtained in the degradation of Polypropylene without
additives at three different heat rates ( see chapter 2 for additional conditions).
3.1.2.2 Kinetic model studies
As it was previously done in the case of thermal degradation of PP with additives the data
obtained from the TG and DSC analysis recorded during thermal decomposition of PP without
additives for the three heating rates, 10,20 and 40 °C/min, were used for estimation of the kinetic and
thermodynamic parameters for the model shown above.
-0,2
0
0,2
0,4
0,6
0,8
1
1,2
0 200 400 600 800
we
igh
t fr
acti
on
T (°C)
PP 10 °C/min
PP 20 °C/min
PP 40 °C/min
a)
-70
-60
-50
-40
-30
-20
-10
0
0 200 400 600 800
Co
rre
cte
d H
eat
Flo
w [
mW
]
T (°C)
PP 10 °C/min
PP 20°C/min
PP 40°C/min
b)
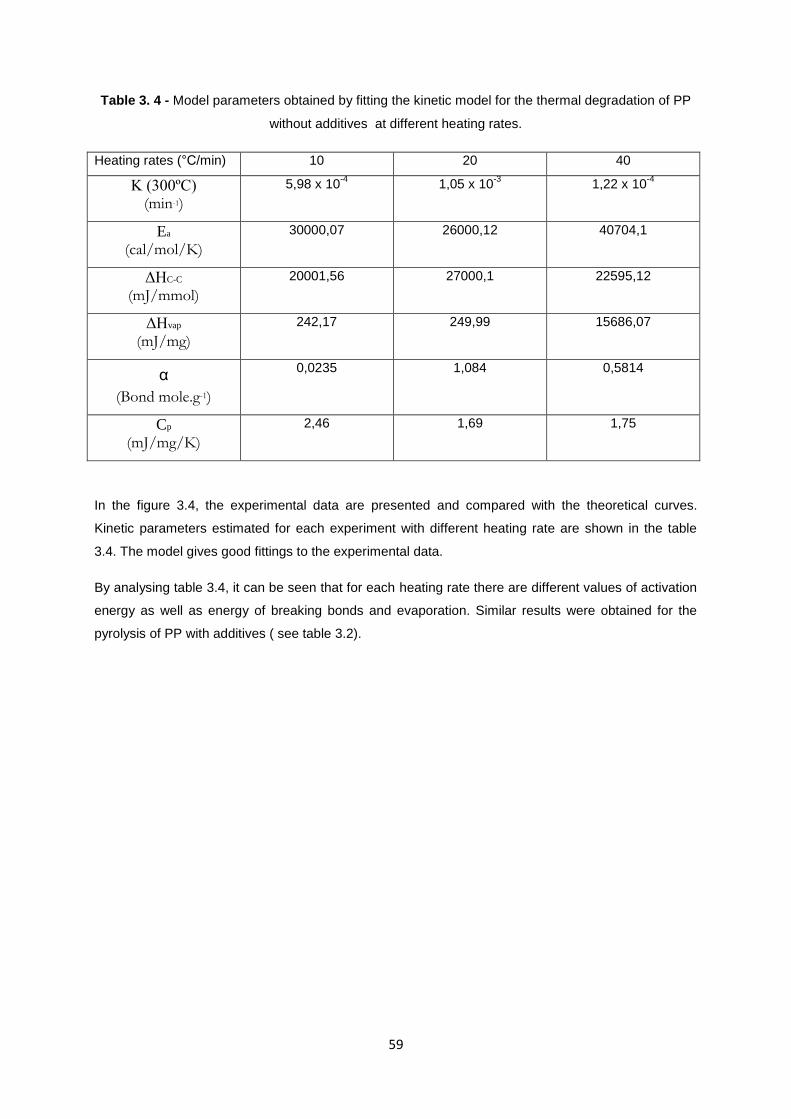
59
Table 3. 4 - Model parameters obtained by fitting the kinetic model for the thermal degradation of PP
without additives at different heating rates.
Heating rates (°C/min) 10 20 40
K (300ºC) (min-1)
5,98 x 10⁻⁴
1,05 x 10⁻³
1,22 x 10⁻⁴
Ea
(cal/mol/K)
30000,07 26000,12 40704,1
ΔHC-C
(mJ/mmol)
20001,56 27000,1 22595,12
ΔHvap
(mJ/mg)
242,17 249,99 15686,07
α
(Bond mole.g-1)
0,0235 1,084 0,5814
Cp
(mJ/mg/K)
2,46 1,69 1,75
In the figure 3.4, the experimental data are presented and compared with the theoretical curves.
Kinetic parameters estimated for each experiment with different heating rate are shown in the table
3.4. The model gives good fittings to the experimental data.
By analysing table 3.4, it can be seen that for each heating rate there are different values of activation
energy as well as energy of breaking bonds and evaporation. Similar results were obtained for the
pyrolysis of PP with additives ( see table 3.2).
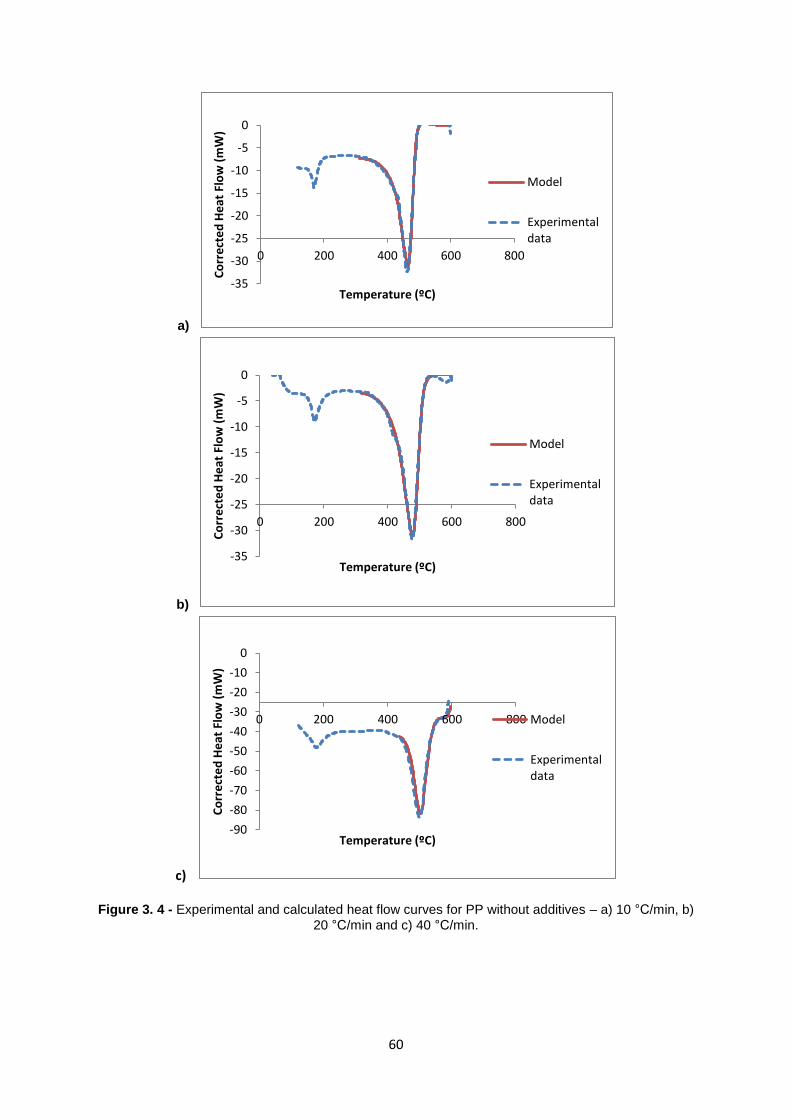
60
a)
b)
c)
Figure 3. 4 - Experimental and calculated heat flow curves for PP without additives – a) 10 °C/min, b)
20 °C/min and c) 40 °C/min.
-35
-30
-25
-20
-15
-10
-5
0
0 200 400 600 800
Co
rre
cte
d H
eat
Flo
w (
mW
)
Temperature (ºC)
Model
Experimentaldata
-35
-30
-25
-20
-15
-10
-5
0
0 200 400 600 800
Co
rre
cte
d H
eat
Flo
w (
mW
)
Temperature (ºC)
Model
Experimentaldata
-90
-80
-70
-60
-50
-40
-30
-20
-10
0
0 200 400 600 800
Co
rre
cte
d H
eat
Flo
w (
mW
)
Temperature (ºC)
Model
Experimentaldata
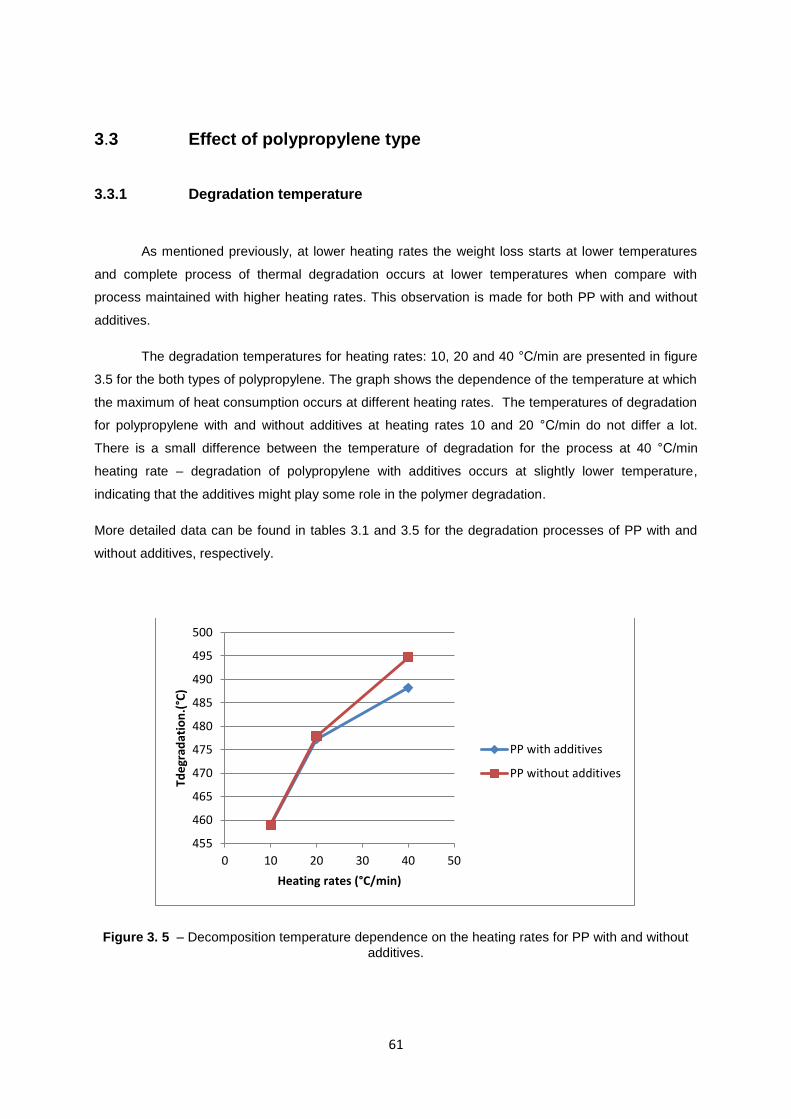
61
3.3 Effect of polypropylene type
3.3.1 Degradation temperature
As mentioned previously, at lower heating rates the weight loss starts at lower temperatures
and complete process of thermal degradation occurs at lower temperatures when compare with
process maintained with higher heating rates. This observation is made for both PP with and without
additives.
The degradation temperatures for heating rates: 10, 20 and 40 °C/min are presented in figure
3.5 for the both types of polypropylene. The graph shows the dependence of the temperature at which
the maximum of heat consumption occurs at different heating rates. The temperatures of degradation
for polypropylene with and without additives at heating rates 10 and 20 °C/min do not differ a lot.
There is a small difference between the temperature of degradation for the process at 40 °C/min
heating rate – degradation of polypropylene with additives occurs at slightly lower temperature,
indicating that the additives might play some role in the polymer degradation.
More detailed data can be found in tables 3.1 and 3.5 for the degradation processes of PP with and
without additives, respectively.
Figure 3. 5 – Decomposition temperature dependence on the heating rates for PP with and without
additives.
455
460
465
470
475
480
485
490
495
500
0 10 20 30 40 50
Tde
grad
atio
n.(
°C)
Heating rates (°C/min)
PP with additives
PP without additives

62

63
CHAPTER 4. CATALYTIC PYROLYSIS OF POLYPROPYLENE
This chapter describes the results obtained for the catalytic degradation of polypropylene,
using simultaneously Thermogravimetry (TG) and Differential Scanning Calorimetry (DSC) analysis.
Experiments are divided accordingly to the families of catalysts used: Vermiculites,
Montmorillonites and Zeolites for the two first families all of experiments were carried-out with a
heating rate 10°C, and for the group of zeolites the results were also obtained for 20 and 40 °C/min
heating rates.
In the first part, there will be study on influence of Vermiculites on both type of polypropylene,
comparing process to the thermal degradation without any catalysts. Influence of presence of
transition metals also will be studied.
In the next part, there will be study on montomorillonities influence on degradation process on
polypropylene with and without additives. Three catalysts chosen to study were: Mt6OAlCu, K10 with
transited copper and K10 with alumina and silver.
The last family of catalyst studied were the Zeolites, with four different catalysts: HZSM – 5 , HY, BEA
and H-BEA.
At the end of chapter 4, activity of two the best representatives of families was further studied
on pyrolysis of polypropylene with additives.
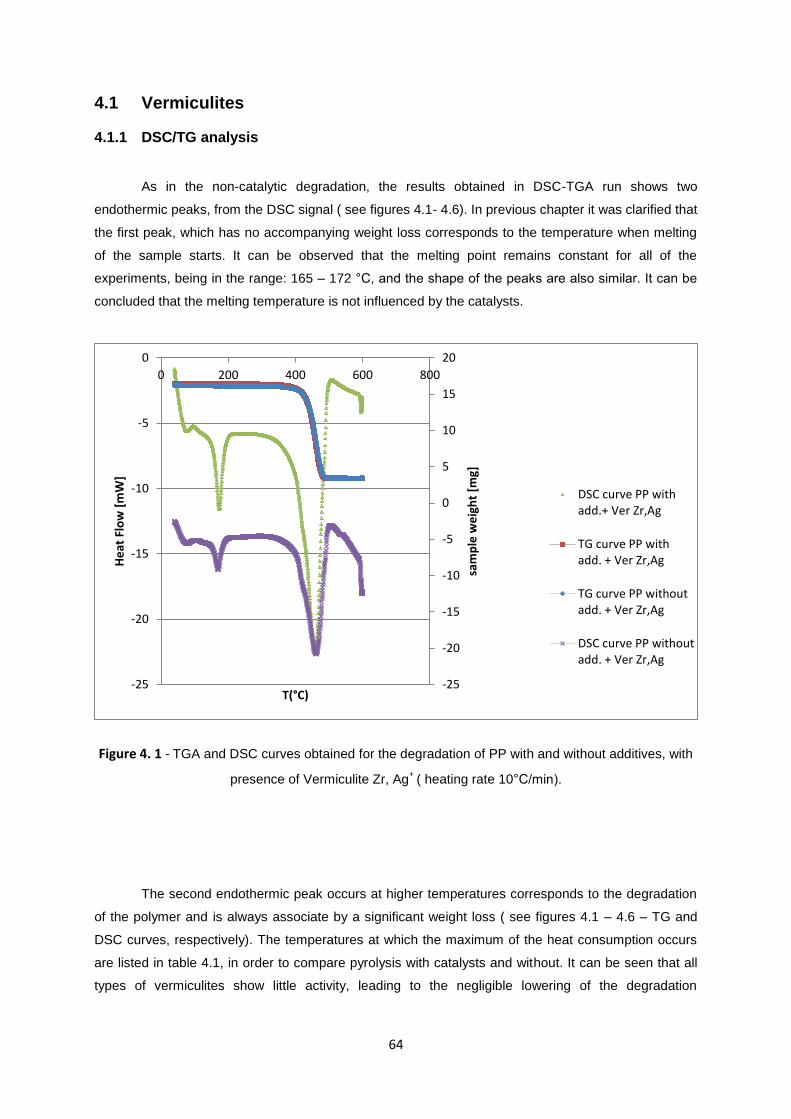
64
4.1 Vermiculites
4.1.1 DSC/TG analysis
As in the non-catalytic degradation, the results obtained in DSC-TGA run shows two
endothermic peaks, from the DSC signal ( see figures 4.1- 4.6). In previous chapter it was clarified that
the first peak, which has no accompanying weight loss corresponds to the temperature when melting
of the sample starts. It can be observed that the melting point remains constant for all of the
experiments, being in the range: 165 – 172 °C, and the shape of the peaks are also similar. It can be
concluded that the melting temperature is not influenced by the catalysts.
Figure 4. 1 - TGA and DSC curves obtained for the degradation of PP with and without additives, with
presence of Vermiculite Zr, Ag+
( heating rate 10°C/min).
The second endothermic peak occurs at higher temperatures corresponds to the degradation
of the polymer and is always associate by a significant weight loss ( see figures 4.1 – 4.6 – TG and
DSC curves, respectively). The temperatures at which the maximum of the heat consumption occurs
are listed in table 4.1, in order to compare pyrolysis with catalysts and without. It can be seen that all
types of vermiculites show little activity, leading to the negligible lowering of the degradation
-25
-20
-15
-10
-5
0
5
10
15
20
-25
-20
-15
-10
-5
0
0 200 400 600 800
sam
ple
we
igh
t [m
g]
He
at F
low
[m
W]
T(°C)
DSC curve PP withadd.+ Ver Zr,Ag
TG curve PP withadd. + Ver Zr,Ag
TG curve PP withoutadd. + Ver Zr,Ag
DSC curve PP withoutadd. + Ver Zr,Ag
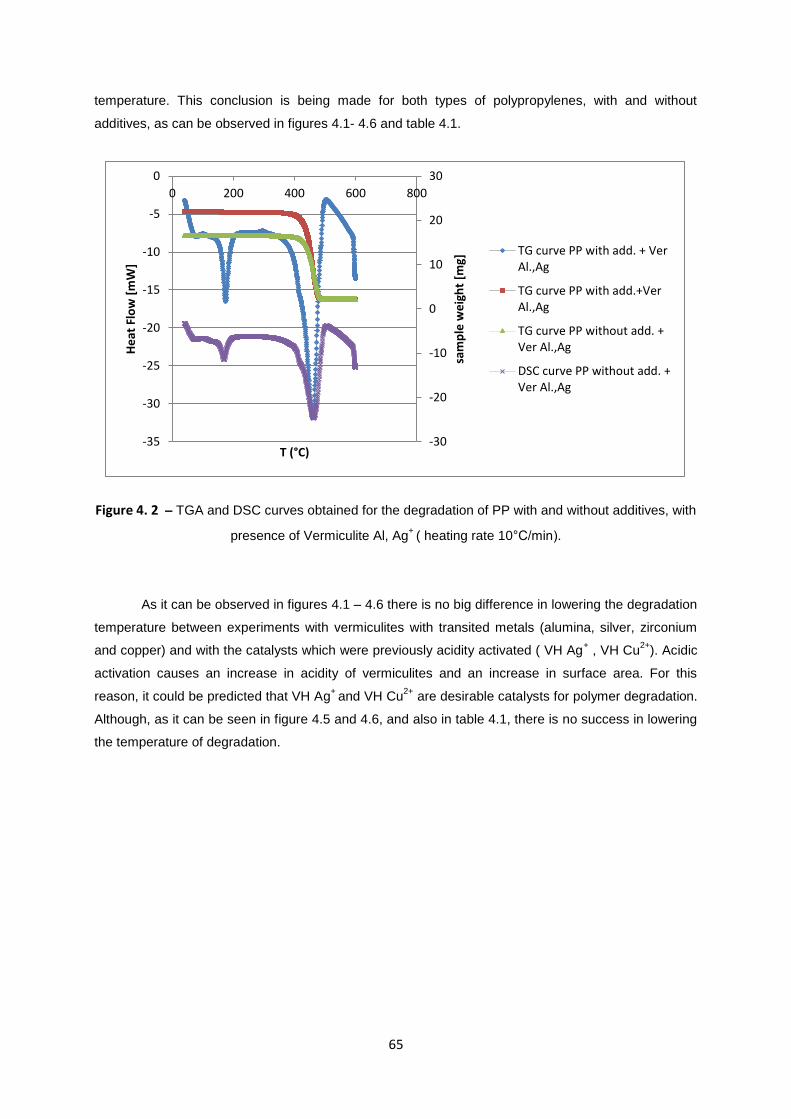
65
temperature. This conclusion is being made for both types of polypropylenes, with and without
additives, as can be observed in figures 4.1- 4.6 and table 4.1.
Figure 4. 2 – TGA and DSC curves obtained for the degradation of PP with and without additives, with
presence of Vermiculite Al, Ag+
( heating rate 10°C/min).
As it can be observed in figures 4.1 – 4.6 there is no big difference in lowering the degradation
temperature between experiments with vermiculites with transited metals (alumina, silver, zirconium
and copper) and with the catalysts which were previously acidity activated ( VH Ag+ , VH Cu
2+). Acidic
activation causes an increase in acidity of vermiculites and an increase in surface area. For this
reason, it could be predicted that VH Ag+
and VH Cu2+
are desirable catalysts for polymer degradation.
Although, as it can be seen in figure 4.5 and 4.6, and also in table 4.1, there is no success in lowering
the temperature of degradation.
-30
-20
-10
0
10
20
30
-35
-30
-25
-20
-15
-10
-5
0
0 200 400 600 800
sam
ple
we
igh
t [m
g]
He
at F
low
[m
W]
T (°C)
TG curve PP with add. + VerAl.,Ag
TG curve PP with add.+VerAl.,Ag
TG curve PP without add. +Ver Al.,Ag
DSC curve PP without add. +Ver Al.,Ag
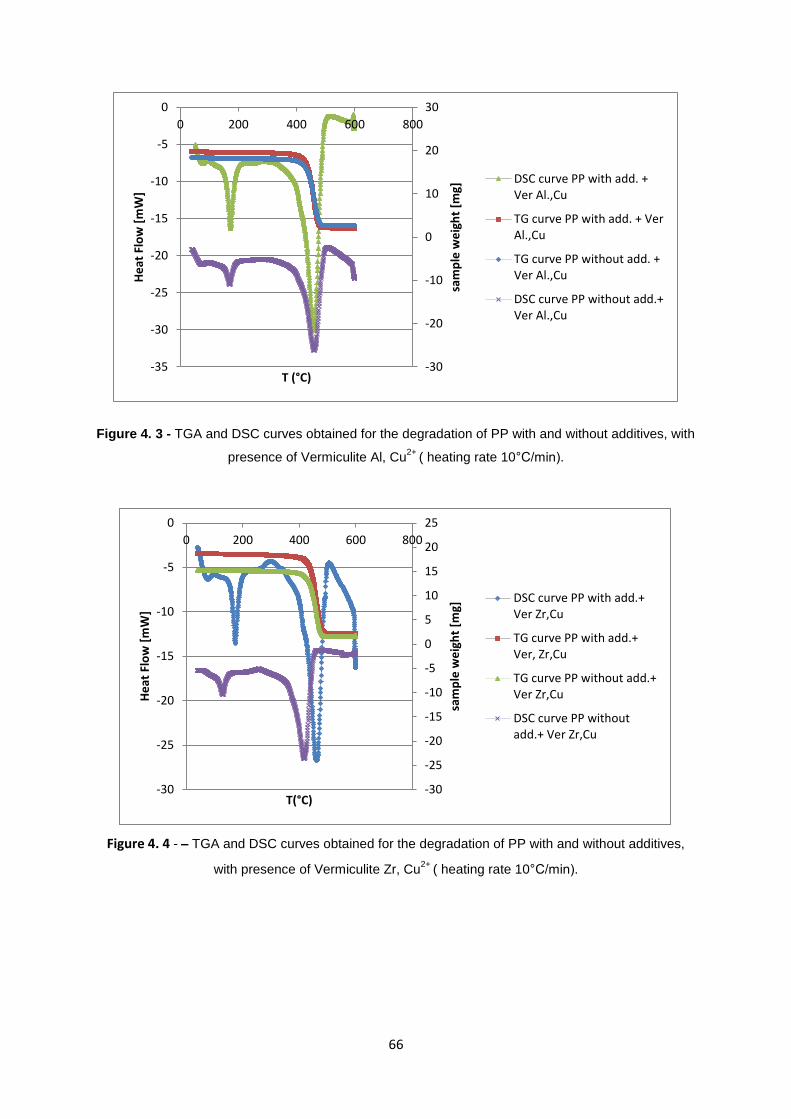
66
Figure 4. 3 - TGA and DSC curves obtained for the degradation of PP with and without additives, with
presence of Vermiculite Al, Cu2+
( heating rate 10°C/min).
Figure 4. 4 - – TGA and DSC curves obtained for the degradation of PP with and without additives,
with presence of Vermiculite Zr, Cu2+
( heating rate 10°C/min).
-30
-20
-10
0
10
20
30
-35
-30
-25
-20
-15
-10
-5
0
0 200 400 600 800
sam
ple
we
igh
t [m
g]
He
at F
low
[m
W]
T (°C)
DSC curve PP with add. +Ver Al.,Cu
TG curve PP with add. + VerAl.,Cu
TG curve PP without add. +Ver Al.,Cu
DSC curve PP without add.+Ver Al.,Cu
-30
-25
-20
-15
-10
-5
0
5
10
15
20
25
-30
-25
-20
-15
-10
-5
0
0 200 400 600 800
sam
ple
we
igh
t [m
g]
He
at F
low
[m
W]
T(°C)
DSC curve PP with add.+Ver Zr,Cu
TG curve PP with add.+Ver, Zr,Cu
TG curve PP without add.+Ver Zr,Cu
DSC curve PP withoutadd.+ Ver Zr,Cu
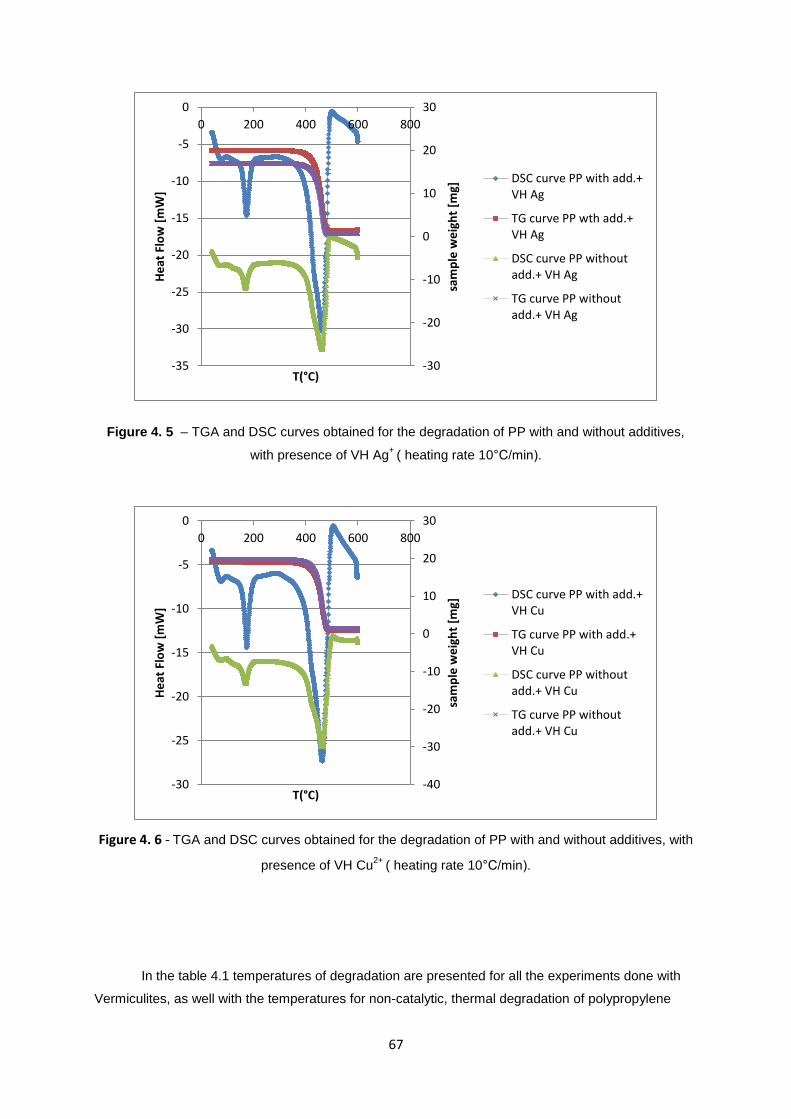
67
Figure 4. 5 – TGA and DSC curves obtained for the degradation of PP with and without additives,
with presence of VH Ag+
( heating rate 10°C/min).
Figure 4. 6 - TGA and DSC curves obtained for the degradation of PP with and without additives, with
presence of VH Cu2+
( heating rate 10°C/min).
In the table 4.1 temperatures of degradation are presented for all the experiments done with
Vermiculites, as well with the temperatures for non-catalytic, thermal degradation of polypropylene
-30
-20
-10
0
10
20
30
-35
-30
-25
-20
-15
-10
-5
0
0 200 400 600 800
sam
ple
we
igh
t [m
g]
He
at F
low
[m
W]
T(°C)
DSC curve PP with add.+VH Ag
TG curve PP wth add.+VH Ag
DSC curve PP withoutadd.+ VH Ag
TG curve PP withoutadd.+ VH Ag
-40
-30
-20
-10
0
10
20
30
-30
-25
-20
-15
-10
-5
0
0 200 400 600 800
sam
ple
we
igh
t [m
g]
He
at F
low
[m
W]
T(°C)
DSC curve PP with add.+VH Cu
TG curve PP with add.+VH Cu
DSC curve PP withoutadd.+ VH Cu
TG curve PP withoutadd.+ VH Cu
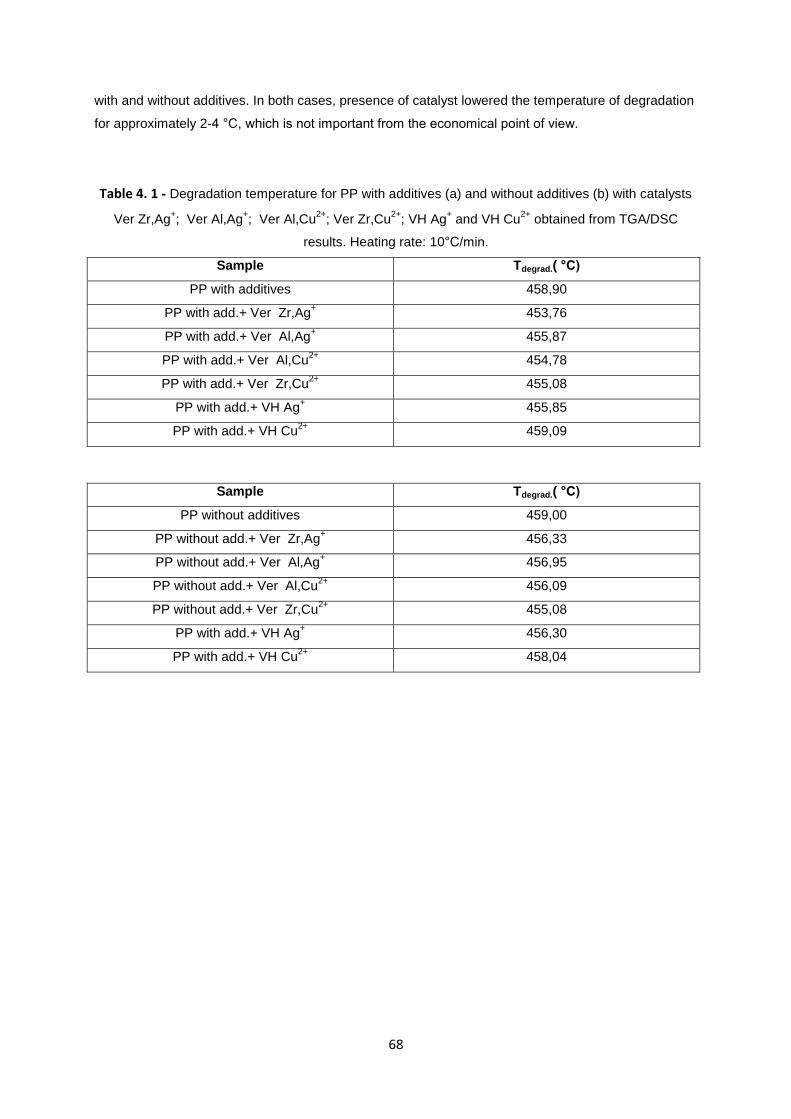
68
with and without additives. In both cases, presence of catalyst lowered the temperature of degradation
for approximately 2-4 °C, which is not important from the economical point of view.
Table 4. 1 - Degradation temperature for PP with additives (a) and without additives (b) with catalysts
Ver Zr,Ag+; Ver Al,Ag
+; Ver Al,Cu
2+; Ver Zr,Cu
2+; VH Ag
+ and VH Cu
2+ obtained from TGA/DSC
results. Heating rate: 10°C/min.
Sample Tdegrad.( °C)
PP with additives 458,90
PP with add.+ Ver Zr,Ag+
453,76
PP with add.+ Ver Al,Ag+
455,87
PP with add.+ Ver Al,Cu2+
454,78
PP with add.+ Ver Zr,Cu2+
455,08
PP with add.+ VH Ag+
455,85
PP with add.+ VH Cu2+
459,09
Sample Tdegrad.( °C)
PP without additives 459,00
PP without add.+ Ver Zr,Ag+
456,33
PP without add.+ Ver Al,Ag+
456,95
PP without add.+ Ver Al,Cu2+
456,09
PP without add.+ Ver Zr,Cu2+
455,08
PP with add.+ VH Ag+
456,30
PP with add.+ VH Cu2+
458,04
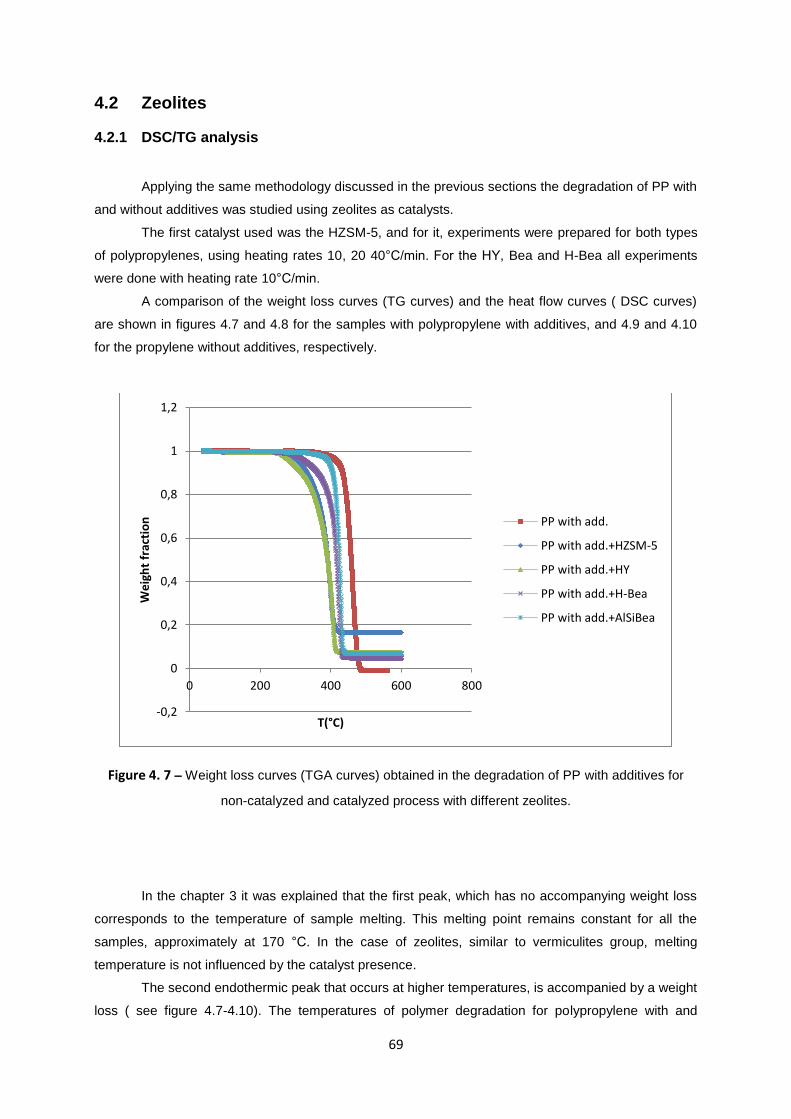
69
4.2 Zeolites
4.2.1 DSC/TG analysis
Applying the same methodology discussed in the previous sections the degradation of PP with
and without additives was studied using zeolites as catalysts.
The first catalyst used was the HZSM-5, and for it, experiments were prepared for both types
of polypropylenes, using heating rates 10, 20 40°C/min. For the HY, Bea and H-Bea all experiments
were done with heating rate 10°C/min.
A comparison of the weight loss curves (TG curves) and the heat flow curves ( DSC curves)
are shown in figures 4.7 and 4.8 for the samples with polypropylene with additives, and 4.9 and 4.10
for the propylene without additives, respectively.
Figure 4. 7 – Weight loss curves (TGA curves) obtained in the degradation of PP with additives for
non-catalyzed and catalyzed process with different zeolites.
In the chapter 3 it was explained that the first peak, which has no accompanying weight loss
corresponds to the temperature of sample melting. This melting point remains constant for all the
samples, approximately at 170 °C. In the case of zeolites, similar to vermiculites group, melting
temperature is not influenced by the catalyst presence.
The second endothermic peak that occurs at higher temperatures, is accompanied by a weight
loss ( see figure 4.7-4.10). The temperatures of polymer degradation for polypropylene with and
-0,2
0
0,2
0,4
0,6
0,8
1
1,2
0 200 400 600 800
We
igh
t fr
acti
on
T(°C)
PP with add.
PP with add.+HZSM-5
PP with add.+HY
PP with add.+H-Bea
PP with add.+AlSiBea
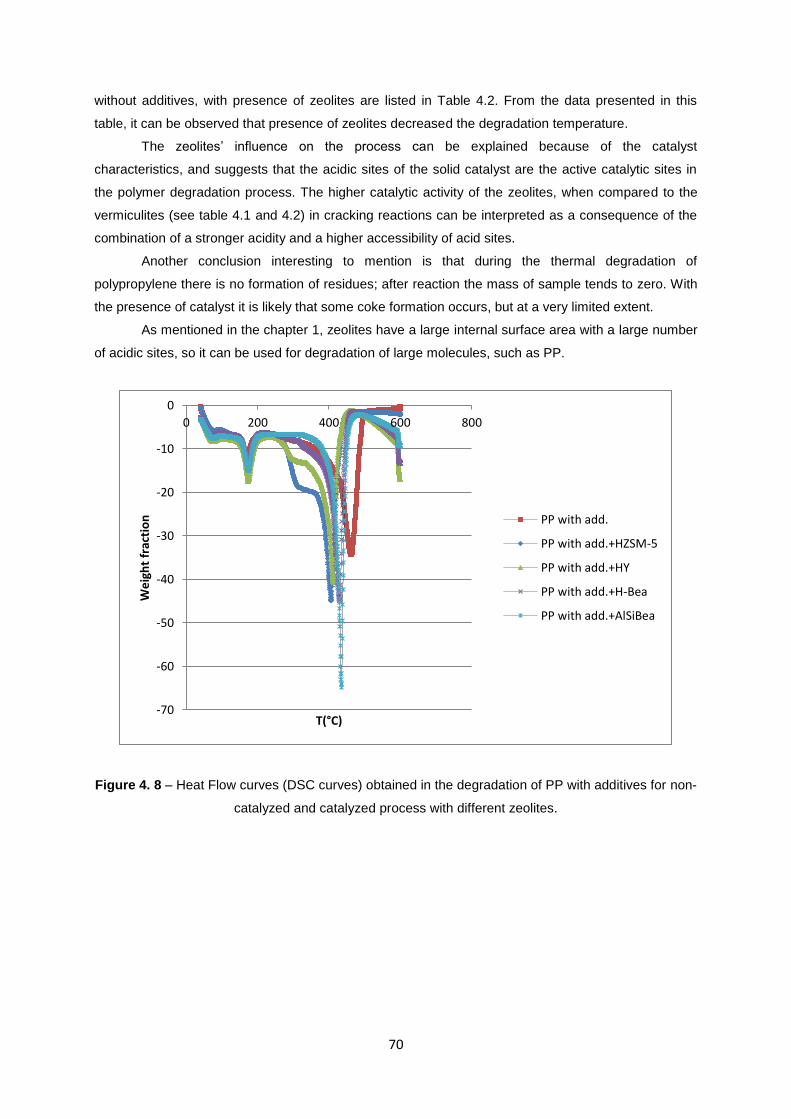
70
without additives, with presence of zeolites are listed in Table 4.2. From the data presented in this
table, it can be observed that presence of zeolites decreased the degradation temperature.
The zeolites’ influence on the process can be explained because of the catalyst
characteristics, and suggests that the acidic sites of the solid catalyst are the active catalytic sites in
the polymer degradation process. The higher catalytic activity of the zeolites, when compared to the
vermiculites (see table 4.1 and 4.2) in cracking reactions can be interpreted as a consequence of the
combination of a stronger acidity and a higher accessibility of acid sites.
Another conclusion interesting to mention is that during the thermal degradation of
polypropylene there is no formation of residues; after reaction the mass of sample tends to zero. With
the presence of catalyst it is likely that some coke formation occurs, but at a very limited extent.
As mentioned in the chapter 1, zeolites have a large internal surface area with a large number
of acidic sites, so it can be used for degradation of large molecules, such as PP.
Figure 4. 8 – Heat Flow curves (DSC curves) obtained in the degradation of PP with additives for non-
catalyzed and catalyzed process with different zeolites.
-70
-60
-50
-40
-30
-20
-10
0
0 200 400 600 800
We
igh
t fr
acti
on
T(°C)
PP with add.
PP with add.+HZSM-5
PP with add.+HY
PP with add.+H-Bea
PP with add.+AlSiBea

71
Figure 4. 9 – Weight loss curves (TGA curves) obtained in the degradation of PP without additives for
non-catalyzed and catalyzed process with different zeolites.
Figure 4. 10 - Heat Flow curves (DSC curves) obtained in the degradation of PP without additives for
non-catalyzed and catalyzed process with different zeolites.
-0,2
0
0,2
0,4
0,6
0,8
1
1,2
0 200 400 600 800
we
igh
t fr
acti
on
T(°C)
PP without add.
PP without add.+HZSM-5
PP without add.+HY
PP witout add.+H-BEA
PP without add.+ALSiBea
-60
-50
-40
-30
-20
-10
0
10
0 100 200 300 400 500 600 700
He
at F
low
[m
W]
T(°C)
PP without add.
PP without add.+HZSM-5
PP without add.+HY
PP witout add.+H-BEA
PP without add.+ALSiBea
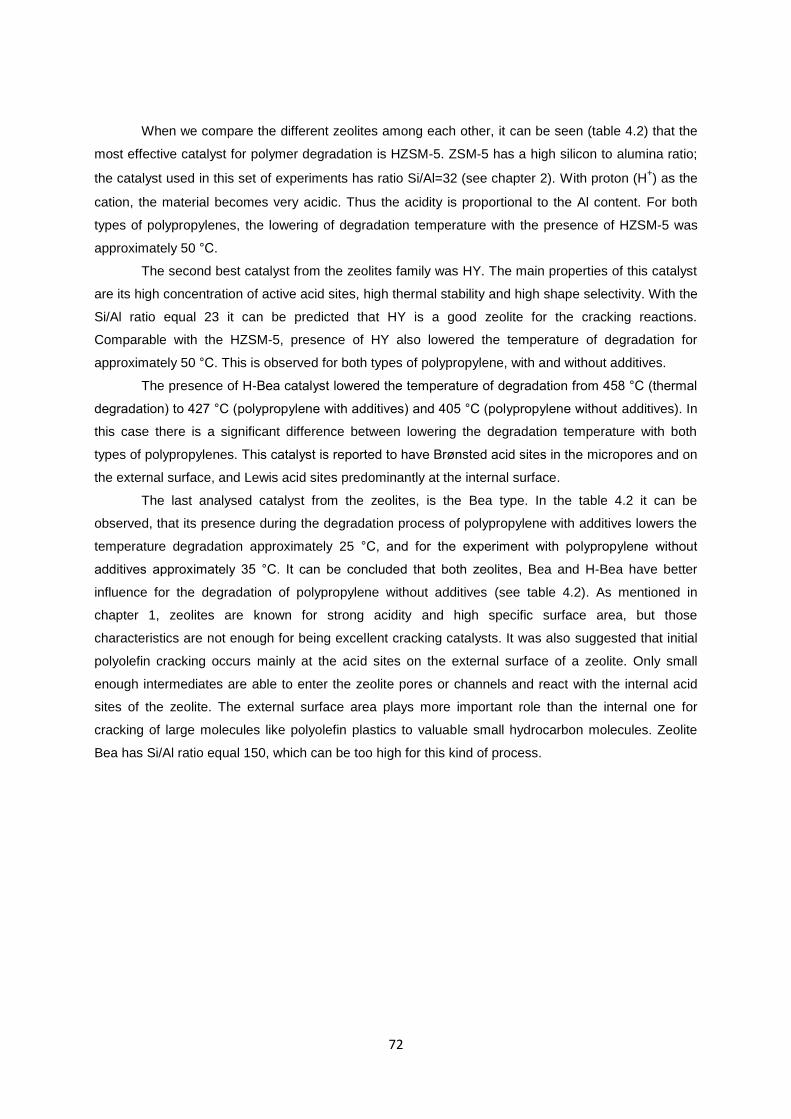
72
When we compare the different zeolites among each other, it can be seen (table 4.2) that the
most effective catalyst for polymer degradation is HZSM-5. ZSM-5 has a high silicon to alumina ratio;
the catalyst used in this set of experiments has ratio Si/Al=32 (see chapter 2). With proton (H+) as the
cation, the material becomes very acidic. Thus the acidity is proportional to the Al content. For both
types of polypropylenes, the lowering of degradation temperature with the presence of HZSM-5 was
approximately 50 °C.
The second best catalyst from the zeolites family was HY. The main properties of this catalyst
are its high concentration of active acid sites, high thermal stability and high shape selectivity. With the
Si/Al ratio equal 23 it can be predicted that HY is a good zeolite for the cracking reactions.
Comparable with the HZSM-5, presence of HY also lowered the temperature of degradation for
approximately 50 °C. This is observed for both types of polypropylene, with and without additives.
The presence of H-Bea catalyst lowered the temperature of degradation from 458 °C (thermal
degradation) to 427 °C (polypropylene with additives) and 405 °C (polypropylene without additives). In
this case there is a significant difference between lowering the degradation temperature with both
types of polypropylenes. This catalyst is reported to have Brønsted acid sites in the micropores and on
the external surface, and Lewis acid sites predominantly at the internal surface.
The last analysed catalyst from the zeolites, is the Bea type. In the table 4.2 it can be
observed, that its presence during the degradation process of polypropylene with additives lowers the
temperature degradation approximately 25 °C, and for the experiment with polypropylene without
additives approximately 35 °C. It can be concluded that both zeolites, Bea and H-Bea have better
influence for the degradation of polypropylene without additives (see table 4.2). As mentioned in
chapter 1, zeolites are known for strong acidity and high specific surface area, but those
characteristics are not enough for being excellent cracking catalysts. It was also suggested that initial
polyolefin cracking occurs mainly at the acid sites on the external surface of a zeolite. Only small
enough intermediates are able to enter the zeolite pores or channels and react with the internal acid
sites of the zeolite. The external surface area plays more important role than the internal one for
cracking of large molecules like polyolefin plastics to valuable small hydrocarbon molecules. Zeolite
Bea has Si/Al ratio equal 150, which can be too high for this kind of process.

73
Table 4. 2 - Degradation temperature for PP with additives (a) and without additives (b) with catalysts:
HZSM-5, HY, H-Bea, AlSiBea obtained from TGA/DSC results. Heating rate: 10°C/min.
Sample Tdegrad.( °C)
PP with additives 458,90
PP with add.+ HZSM-5
404,113
PP with add.+ HY
410,638
PP with add.+ H-Bea
427,034
PP with add.+ Bea
433,92
Sample Tdegrad.( °C)
PP without additives 459,00
PP with add.+ HZSM-5
400,912
PP with add.+ HY
408,30
PP with add.+ H-Bea
405,11
PP with add.+ Bea
422,04
4.3 Montmorillonites
4.3.1 DSC/TG analysis.
Figure 4. 11 - Weight loss curves (TGA curves) obtained in the degradation of PP with additives for
non-catalyzed and catalyzed process with different montomorillonites.
-0,2
0
0,2
0,4
0,6
0,8
1
1,2
0 200 400 600 800
we
igh
t fr
acti
on
T(°C)
PP with add.
PP withadd.+Mt6OAlCu
PP with add.+KlO AlAg+
PP with add.+K10 Cu2+

74
In this subsection, results from the experiments with montmorillonites are shown. From this
group of catalysts 3 representative samples were studied: Mt6OAlCu, K10 Al Ag+, K10 Cu
2+. The same
methodology, discussed in the previous sections, was applied. A comparison of the activity of catalyst
at a heating rate 10 °C/min in TGA/DSC experiments is shown in figures 4.11-4.14.
A very good catalytic effect was observed from the set of experiments with Mt6OAlCu. As can
be observed in figures 4.11 – 4.14 and table 4.3, this catalyst lowered the temperature of degradation
from 458 °C to 412 °C (polypropylene with additives), and from 459 °C to 433 °C (polypropylene
without additives).
The catalysts from the K10 montmorillonite series, K10 Al Ag+ and K10 Cu
2+, also reduce the
temperature of the degradation relatively to the non-catalytic process, although this reduction is a
minor one, only about 10 – 20 °C.
All of the catalyst from the montmorillonite group were previously acidity – activated, what
changed some properties of them. As mentioned in chapter 1, this activation extends the external
surface area and alters the pore size distribution, which has a significant meaning for the cracking of
hydrocarbons
Figure 4. 12 – Heat Flow curves (DSC curves) obtained in the degradation of PP with additives for
non-catalyzed and catalyzed process with different montomorillonites.
-45
-40
-35
-30
-25
-20
-15
-10
-5
0
0 200 400 600 800
He
at F
low
[m
W]
T(°C)
PP with add.
PP withadd.+Mt6OAlCu
PP with add.+KlO AlAg+
PP with add.+K10 Cu2+

75
Figure 4. 13 - Weight loss curves (TGA curves) obtained in the degradation of PP without additives for
non-catalyzed and catalyzed process with different montomorillonites.
Figure 4. 14 – Heat Flow curves (DSC curves) obtained in the degradation of PP without additives for
non-catalyzed and catalyzed process with different montomorillonites.
-0,2
0
0,2
0,4
0,6
0,8
1
1,2
0 200 400 600 800
we
igh
t fr
acti
on
T(°C)
PP without add.
PP withoutadd.+Mt6OAlCu
PP without add.+KlOAl Ag+
PP without add.+K10Cu2+
-40
-35
-30
-25
-20
-15
-10
-5
0
0 200 400 600 800
He
at F
low
[m
W]
T(°C)
PP without add.
PP withoutadd.+Mt6OAlCu
PP without add.+KlOAl Ag+
PP without add.+K10Cu2+
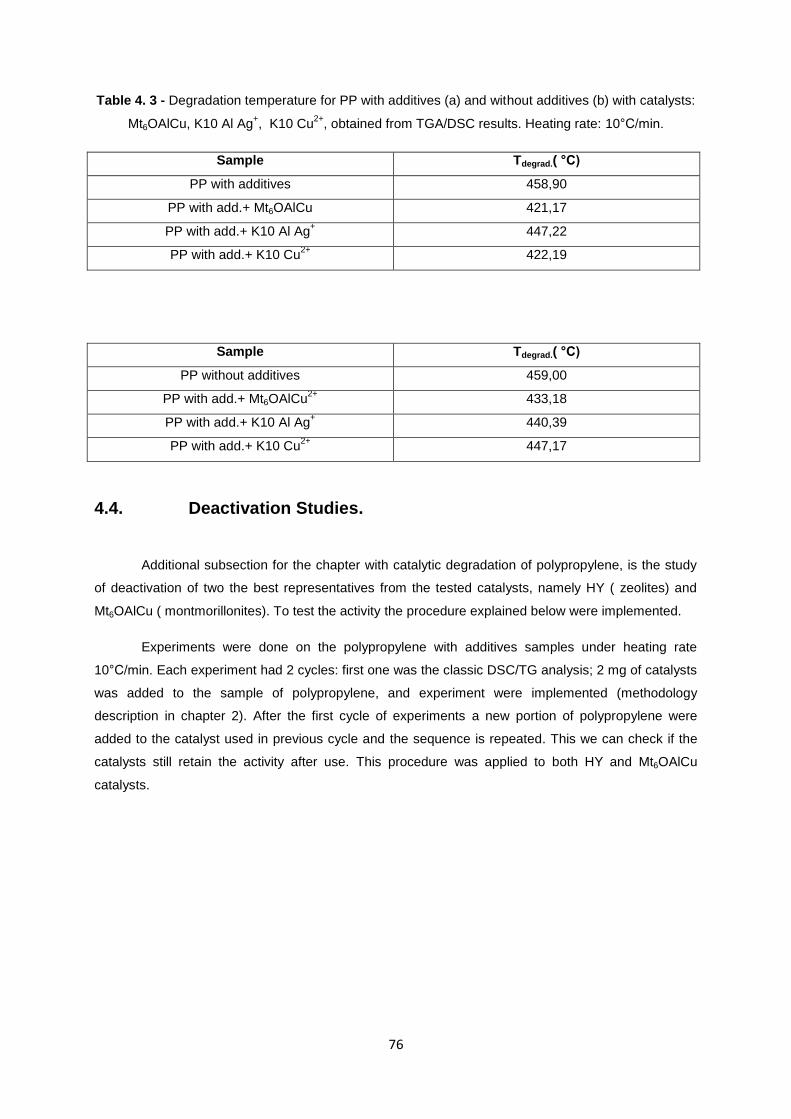
76
Table 4. 3 - Degradation temperature for PP with additives (a) and without additives (b) with catalysts:
Mt6OAlCu, K10 Al Ag+, K10 Cu
2+, obtained from TGA/DSC results. Heating rate: 10°C/min.
Sample Tdegrad.( °C)
PP with additives 458,90
PP with add.+ Mt6OAlCu
421,17
PP with add.+ K10 Al Ag+
447,22
PP with add.+ K10 Cu2+
422,19
Sample Tdegrad.( °C)
PP without additives 459,00
PP with add.+ Mt6OAlCu2+
433,18
PP with add.+ K10 Al Ag+
440,39
PP with add.+ K10 Cu2+
447,17
4.4. Deactivation Studies.
Additional subsection for the chapter with catalytic degradation of polypropylene, is the study
of deactivation of two the best representatives from the tested catalysts, namely HY ( zeolites) and
Mt6OAlCu ( montmorillonites). To test the activity the procedure explained below were implemented.
Experiments were done on the polypropylene with additives samples under heating rate
10°C/min. Each experiment had 2 cycles: first one was the classic DSC/TG analysis; 2 mg of catalysts
was added to the sample of polypropylene, and experiment were implemented (methodology
description in chapter 2). After the first cycle of experiments a new portion of polypropylene were
added to the catalyst used in previous cycle and the sequence is repeated. This we can check if the
catalysts still retain the activity after use. This procedure was applied to both HY and Mt6OAlCu
catalysts.
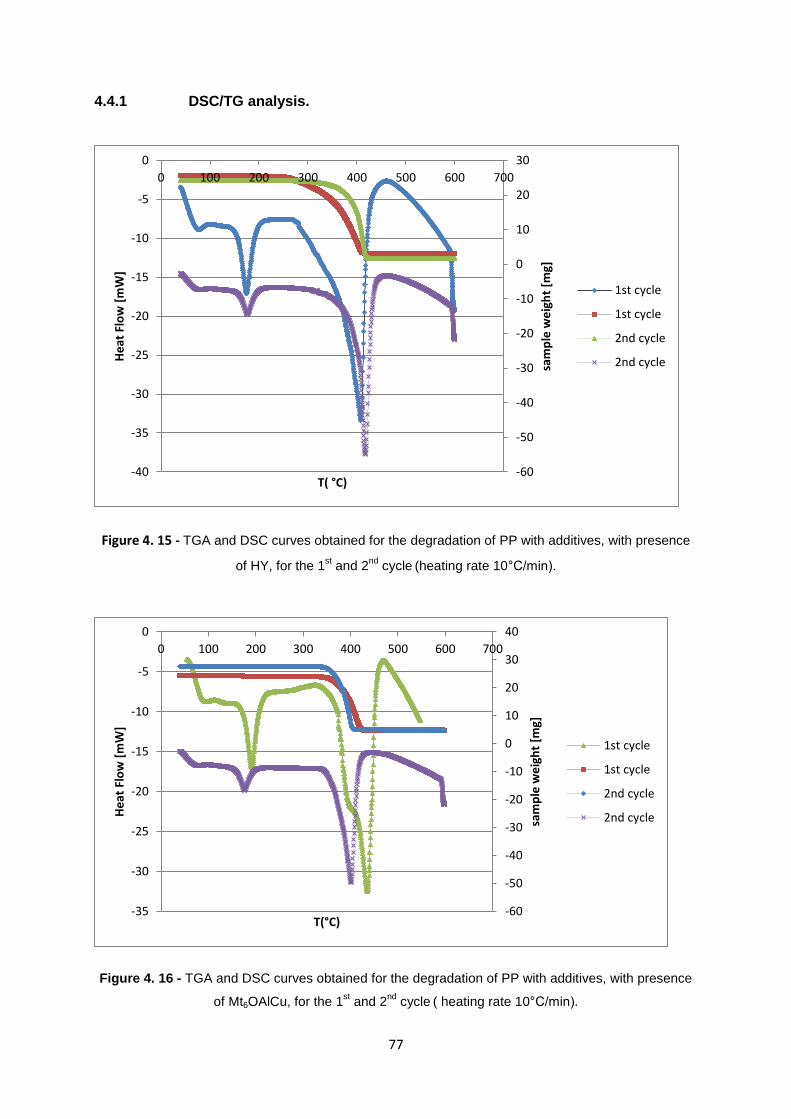
77
4.4.1 DSC/TG analysis.
Figure 4. 15 - TGA and DSC curves obtained for the degradation of PP with additives, with presence
of HY, for the 1st and 2
nd cycle
(heating rate 10°C/min).
Figure 4. 16 - TGA and DSC curves obtained for the degradation of PP with additives, with presence
of Mt6OAlCu, for the 1st and 2
nd cycle
( heating rate 10°C/min).
-60
-50
-40
-30
-20
-10
0
10
20
30
-40
-35
-30
-25
-20
-15
-10
-5
0
0 100 200 300 400 500 600 700
sam
ple
we
igh
t [m
g]
He
at F
low
[m
W]
T( °C)
1st cycle
1st cycle
2nd cycle
2nd cycle
-60
-50
-40
-30
-20
-10
0
10
20
30
40
-35
-30
-25
-20
-15
-10
-5
0
0 100 200 300 400 500 600 700
T(°C)
sam
ple
we
igh
t [m
g]
He
at F
low
[m
W]
1st cycle
1st cycle
2nd cycle
2nd cycle
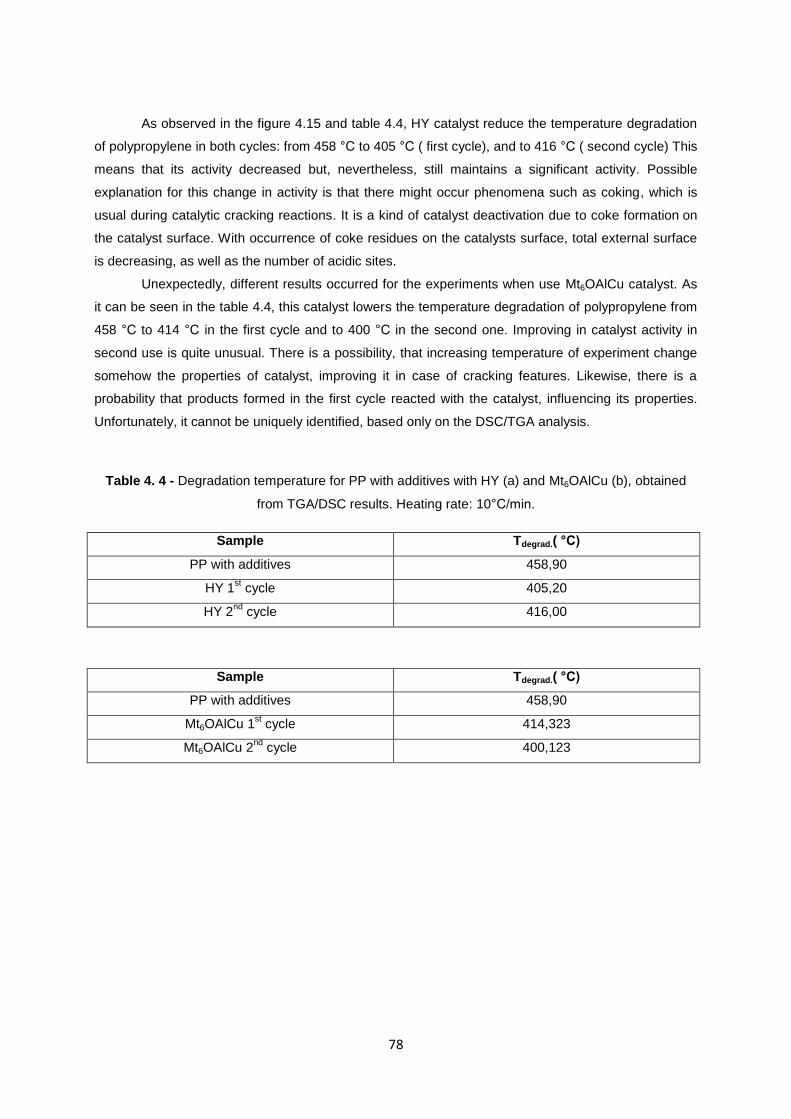
78
As observed in the figure 4.15 and table 4.4, HY catalyst reduce the temperature degradation
of polypropylene in both cycles: from 458 °C to 405 °C ( first cycle), and to 416 °C ( second cycle) This
means that its activity decreased but, nevertheless, still maintains a significant activity. Possible
explanation for this change in activity is that there might occur phenomena such as coking, which is
usual during catalytic cracking reactions. It is a kind of catalyst deactivation due to coke formation on
the catalyst surface. With occurrence of coke residues on the catalysts surface, total external surface
is decreasing, as well as the number of acidic sites.
Unexpectedly, different results occurred for the experiments when use Mt6OAlCu catalyst. As
it can be seen in the table 4.4, this catalyst lowers the temperature degradation of polypropylene from
458 °C to 414 °C in the first cycle and to 400 °C in the second one. Improving in catalyst activity in
second use is quite unusual. There is a possibility, that increasing temperature of experiment change
somehow the properties of catalyst, improving it in case of cracking features. Likewise, there is a
probability that products formed in the first cycle reacted with the catalyst, influencing its properties.
Unfortunately, it cannot be uniquely identified, based only on the DSC/TGA analysis.
Table 4. 4 - Degradation temperature for PP with additives with HY (a) and Mt6OAlCu (b), obtained
from TGA/DSC results. Heating rate: 10°C/min.
Sample Tdegrad.( °C)
PP with additives 458,90
HY 1st cycle 405,20
HY 2nd
cycle 416,00
Sample Tdegrad.( °C)
PP with additives 458,90
Mt6OAlCu 1st cycle 414,323
Mt6OAlCu 2nd
cycle 400,123
79
CHAPTER 5. Final Conclusions
5.1 Achieved Results
The pyrolytic behavior of PP with and without additives samples has been studied using
TGA/DSC apparatus, for thermal and catalytic degradation.
The conclusions drawn from this work are as follows:
The simultaneous use of DSC/TG analysis provided a clear picture of the thermal and catalytic
degradation processes, allowing to have a look at the reaction that occurs within the polymer before
gas-phase products start to evolve. This method provided additional information enabling better
understanding of the plastic decomposition mechanism.
- Comparison between the thermal degradation of PP with and without additives ( Dependence
on type of polypropylene)
Degradation temperature:
The degradation temperature of the pyrolysis process is dependent mostly on the heating
rates. As observed, when heating rate increase, the maximum of the heat flow curves shift towards
higher temperatures. Possible explanation is due to the kinetics of the process itself and to dynamic
effects of the used equipment. This behavior occurs to both types of polypropylene.
Kinetic parameters
The computational model developed gives quite good fittings to the experimental values and
allowed us to estimate kinetic and thermodynamic parameters in terms of the description of the
chemical process involved. The estimated values for the bond energies, vaporization enthalpies and
specific heat capacities are similar to published and calculated values.
In addition, in relation to apparent activation energy of the process determined for different
heating rates and increase in the estimated activation energy as the heating rate increases was
observed in accordance with the shift of the products distribution towards lighter ones.
- Comparison between the catalytic and thermal degradation
Degradation temperature:
The catalytic pyrolysis of polypropylene with and without additives was also investigated using
DSC/TGA analysis. For this study, although various catalysts were tested, zeolite catalysts were the
most active catalysts on the reduction of the degradation temperature, with the best results for HZSM-
5 and HY. Very good results were obtained for the Mt6OAlCu from montmorillonites group. In contrast,
vermiculites, both with transition metals and acidic activated, showed an apparent inactivity proving to
be ineffective in the reduction of temperature process.

80
5.2 Future Trends
This work was a first approach to the study of thermal and catalytic degradation of
polypropylene with and without additives.
Its development allowed to arrive at some important conclusions and opened perspectives for
an additional research, with the goal of getting a better insight into the process. Likewise, some
aspects of the pyrolysis that was not yet clarified, can be understand now more deeply.
In future work it may be interesting to extend the study to analyze waste polypropylene, as
well as other types of polyolefins.
In case of catalyst degradation, although the zeolites turned out to be the best catalyst for
pyrolysis, there are a lot of studies for its influence on plastics degradation. More promising will be
testing catalysts belonging the montmorillonites, for comparative and more detailed analysis of the
influence in the catalytic degradation of polyolefins. Consequently, a better characterization of the
catalysts will be needed, namely in terms of surface area, acidity, pore structures and composition.
To develop a sustainable pyrolysis process, it will be required to have a detailed knowledge of
the dependence between cracking conditions and product distributions.
Furthermore, evolution of the detailed kinetic measurements and computational models to
explain the time-course evolution of the reaction as well as product distribution. Therefore, more
detailed qualitative and quantitative characteristics of the products composition obtained in the
degradation reaction is necessary.
81
Bibliography
[1] G. Scott; Polymers and environment, Royal Society of Chemistry (1999).
[2] William D. Callister; David G. Rethwish; Materials Science and Engineering, Eigth Edition
[3] Asociation of Plastics Manufacturers in Europe (APME); An Analysis of European Plastics
Production, demand and waste data for 2011 (2012).
[4] C.L. Beyler and M. M. Hirschler; Thermal decomposition of polymers, In PJ Dinenno (ed),
SFPE Hanbook of Fire Protection Engineering. 3rd edn, Quincy, Boston (2001).
[5] N2 and CO2 Adsorption by TMA- and HDP-Montmorillonites - C. Volzone*, J. O. Rinaldi, J. Ortiga
Centro de Tecnología de Recursos Minerales y Cerámica (CETMIC)-CONICETC.C. 49, Cno.
Centenario y 506, (1897) M. B. Gonnet, Prov. Buenos Aires, Argentina.
[6] Converting Plastic into a Resource; United Nations Environmental Programme Division of
Technology, Industry and Economics International Environmental Technology Centre Osaka/Shiga,
Japan; United Nations Environment Programme, 2009
[7] K. Laidler Chemical Kinetics; Second Edition
[8] H. Bockhorn, A. Hornung, U. Hornung; J. Anal. Appl. Pyrolysis, 50 (1999) 77.
[9] F. Torrens, G. Castellano; Int. J. Quantum Chem., 107 (2007) 2378.
[10] A. Corma; Chem. Rev. 95 (1995) 559.
[11] T. Butcko; Ph.D. Thesis, Institut fur Materialphysik, University at Wien (2004).
[12] M. Elanany, M. Koyama, M. Kubo, P. Selvan, A. Miyamoto; Microporous Mesoporous
Mater., 71 (2004) 51.
[13] M. H. W. Sonoemans, C. den Heijer, and M. Crocker; J. Phys. Chem., 97 (1993) 440.
[14] M. Elanany, M. Koyama, M. Kubo, E. Broclawik, A. Miyamoto; Appl. Surf. Sci., 246 (2005)
[15] http://www.vermiculite.org/pdf_word/Vermiculite_Horticultural_Brochure.pdf
[16] M. Valáškov and G. Simha Martynková; Vermiculite: Structural Properties and Examples of the
Use, Technical University of Ostrava,2012.
[17] L. Chmielarz, A. Kowalczyk, M. Michalik; Acid-activated vermiculites and phlogophites as
catalysts for the DeNOx process; Applied Clay Science,2010
[18] B. Lombardi, M. Baschini, R.M. Torres Sanchez, Characterization of montmorillonites from
bentonite deposits of North Patagonia, Argentina: Pchysicochemical and structural parameter
correlation, 202
[19] J.F. Lambert, G. Poncelet; Top. Catal., 4 (1997) 43.
[20] J.M. Hartwell, The diverse uses of montmorillonites, 6,111.
[21] F.J. Mastral, E. Esperanza, P. Garcia, M. Just; Appl. Pyrolysis, 63 (2002) 273.
[22] J.M. Encinar, J.F. González; Fuel Process. Technol., 89 (2008) 678.
[23] R. W. J. Westerhout, J. Waanders, J. A. M. Kuipers, W. P. M. van Swaai; Ind. Eng. Chem.
Res., 36 (1997) 1955.
[24] N. Kiran, E. Ekinci, C.E. Snape; Resour. Conserv. Recycl., 29 (2000) 273.
82
[25] J. Aguado, D.P. Serrano, G. San Miguel, M.C. Castro, S. Madrid; J. Anal. Appl. Pyrolysis,
79(2007) 415.
[26] A. Demirbas; J. Anal. Appl. Pyrolysis, 72 (2004) 97.
[27] L. Sorum, M. G. Gronl, J. E. Hustad; Fuel, 80 (2001) 1217.
[28] L. Ballice; Fuel, 80 (2001) 1923.
[29] H. Bockhorn, A. Hornung, U. Hornung; J. Anal. Appl. Pyrolysis, 50 (1999) 77.
[30] J. W. Park, S. Cheon Oh, H. P. Lee, H. T. Kim, K. OK Yo; Poly. Degrad. Stab., 67(2000 )535.
[31] H. Bockhorn, A. Hornung, U.Hornung,P. Jakobstroer; J. Anal. Appl. Pyrolysis; 46 (1998) 1.
[32] S. Kim, E. Jang, D. Shin, K. Lee; Polym. Degrad. Stab., 85 (2004) 799.
[33] G. Manos, I.Y. Yusof, N. Papayannakos, N.H. Ganngas; Ind. Eng. Chem. Res., 40 (2001) 2220.
[34] I. Kayacan , Ö. M. Do Gan; Energy Sources, Part A, 30 (2008) 385.
[35] Z. Gao, I. Amasaki, M. Nakata; J. Anal. Appl. Pyrolysis, 67 (2003) 1.
[36] J. A. Conesa, A. Marcilla, R. Font, J.A. Caballero; J. Anal. Appl. Pyrolysis, 36 (1996) 1.
[37] G. Elordi, M. Olazar, R. Aguado, G. Lopez, M. Arabiourrutia and J. Bilbao; J. Anal. Appl.
Pyrolysis, 79 (2007) 450.
[38] Q. Zhou, L. Zheng, Y.-Z. Wang. G.-M. Zhao, B. Wang; Polym. Degrad. Stab., 84 (2004) 493.
[39] Y.-H. Lin, M.-H. Yang; Appl. Catal. B, 69 (2007) 145.
[40] A. Garforth, S. Fiddy, Y.-H. Lin, A. Ghanbari-Siakhali, P.N. Sharratt; Thermochim. Acta, 294
(1997) 65.
[41] A. G. Buekens, H. Huang; Resour. Conserv. Recycl., 23 (1998), 163.
[42] Y. H. Lin, M.-H. Yang, T.-F.Yeh, M.-D. Ger; Polym. Degrad. Stab., 86 (2004) 121.
[43] K. Gobin, G. Manos; Polym. Degrad. Stab., 83 (2004) 267.
[44] K. Gobin, G. Manos; Polym. Degrad. Stab., 86 (2004) 225.
[45] A. Marcilla, J.A. Reyes-Labarta, F.J. Sempere; Polymer, 42 (2001) 5343.
[46] J.A. Reyes-Labarta, M.M. Olaya, A. Marcilla; Polymer, 47 (2006) 8194.
[47] S. Chaianansutcharit, R. Katsutath, A. Chaisuwan, T. Bhaskar, A. Nigo, A. Muto and Y. Sakata; J.
Anal. Appl. Pyrolysis, 80 (2007) 360.
[48] A. Marcilla, A. Gómez-Siurana, F. Valdés; J. Anal. Appl. Pyrolysis, 79 (2007) 433.
[49] H. Bockhorn, A. Hornung, U. Hornung, D. Schawaller; J. Anal. Appl. Pyrolysis, 48 (1999) 93.
[50] F.J. Mastral, E. Esperanza, P. García, M. Juste; J. Anal. Appl. Pyrolysis, 63 (2002) 1.
[51] J.M. Encinar, J.F. González; Fuel Process. Technol., 89 (2008) 678.
[52] R. W. J. Westerhout, J. Waanders, J. A. M. Kuipers, W. P. M. van Swaai; Ind. Eng. Chem.
Res., 36 (1997) 1955.
[53] N. Kiran, E. Ekinci, C.E. Snape; Resour. Conserv. Recycl., 29 (2000) 273.
[54] J. Aguado, D.P. Serrano, G. San Miguel, M.C. Castro, S. Madrid; J. Anal. Appl. Pyrolysis, 79
(2007) 415.
[55] R. W. J. Westerhout, J. Waanders, J. A. M. Kuipers, W. P. M. van Swaai; Ind. Eng. Chem.
Res., 36 (1997) 1955.
[56] J. Ceamanos, J.F. Mastral, A. Millera, M.E. Aldea; J. Anal. Appl. Pyrolysis, 65 (2002) 93.
[57] J. W. Park, S. Cheon Oh, H. P. Lee, H. T. Kim, K. OK Yo; Poly. Degrad. Stab., 67(2000).
83
[58] http://commons.wikimedia.org/wiki/File:Syndiotactic-polypropylene-3D-balls.png
[59] R. Ramos Pinto, P. Borges, M.A.N.D.A. Lemos, F. Lemos, J.C. Védrine, E.G. Derouane, F.
Ramôa Ribeiro, Appl. Catal. A 284 (2005) 39–46
[60] 10th International Chemical and Biological Engineering Conference,CHEMPOR 2008- ‘Thermal
degradation kinetics of polyethylene in dynamic conditions using simultaneous DSC/TG analysis’ A.
Coelho, L. Costa, M.M. Marques, I.M. Fonseca, M.A.N.D.A. Lemos, F. Lemos.
[61] ‘Thermal degradation kinetics of polyethylene in dynamic conditions using simultaneous DSC/TG
analysis’ A. Coelho, L. Costa, M.M. Marques, I.M. Fonseca, M.A.N.D.A. Lemos, F. Lemos,
unpublished work.
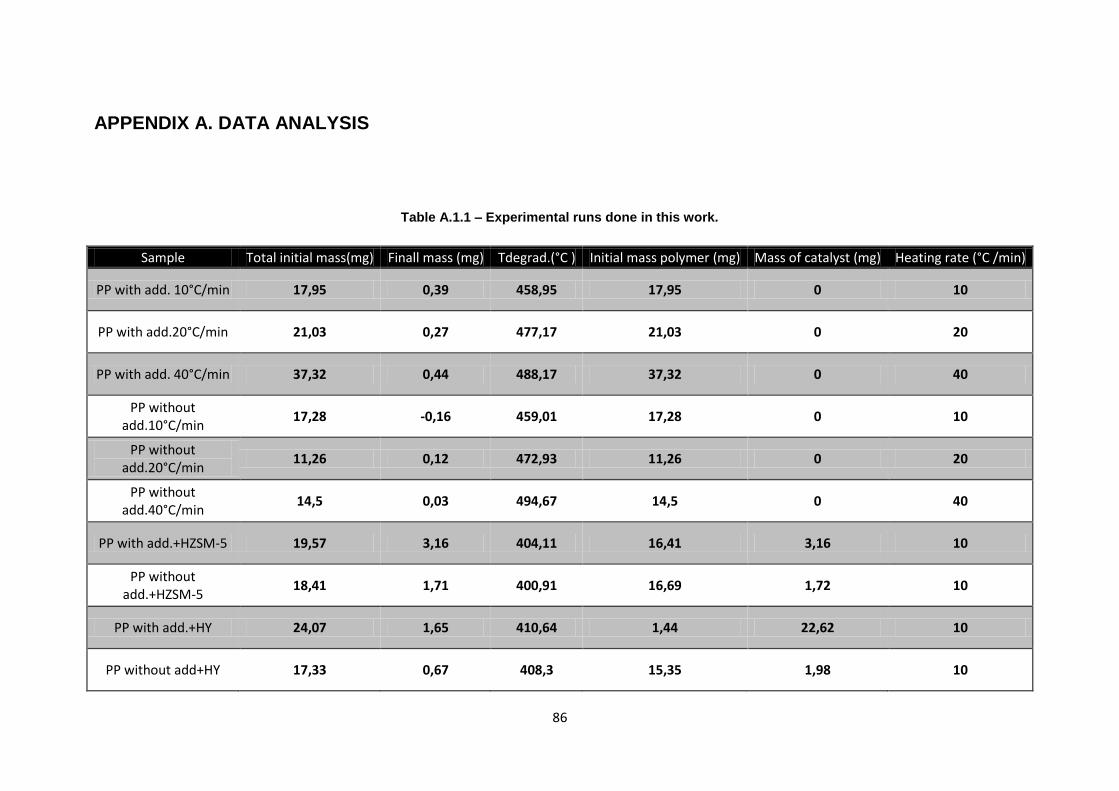
86
APPENDIX A. DATA ANALYSIS
Table A.1.1 – Experimental runs done in this work.
Sample Total initial mass(mg) Finall mass (mg) Tdegrad.(°C ) Initial mass polymer (mg) Mass of catalyst (mg) Heating rate (°C /min)
PP with add. 10°C/min 17,95 0,39 458,95 17,95 0 10
PP with add.20°C/min 21,03 0,27 477,17 21,03 0 20
PP with add. 40°C/min 37,32 0,44 488,17 37,32 0 40
PP without add.10°C/min
17,28 -0,16 459,01 17,28 0 10
PP without add.20°C/min
11,26 0,12 472,93 11,26 0 20
PP without add.40°C/min
14,5 0,03 494,67 14,5 0 40
PP with add.+HZSM-5 19,57 3,16 404,11 16,41 3,16 10
PP without add.+HZSM-5
18,41 1,71 400,91 16,69 1,72 10
PP with add.+HY 24,07 1,65 410,64 1,44 22,62 10
PP without add+HY 17,33 0,67 408,3 15,35 1,98 10
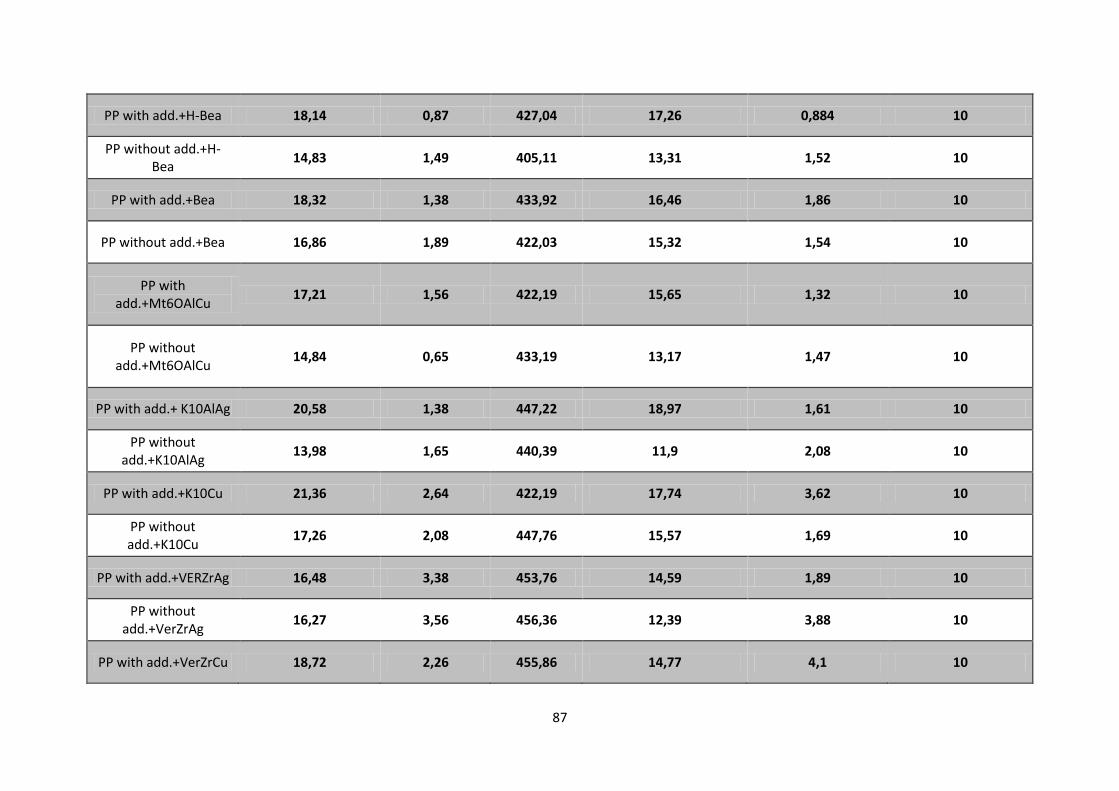
87
PP with add.+H-Bea 18,14 0,87 427,04 17,26 0,884 10
PP without add.+H-Bea
14,83 1,49 405,11 13,31 1,52 10
PP with add.+Bea 18,32 1,38 433,92 16,46 1,86 10
PP without add.+Bea 16,86 1,89 422,03 15,32 1,54 10
PP with add.+Mt6OAlCu
17,21 1,56 422,19 15,65 1,32 10
PP without add.+Mt6OAlCu
14,84 0,65 433,19 13,17 1,47 10
PP with add.+ K10AlAg 20,58 1,38 447,22 18,97 1,61 10
PP without add.+K10AlAg
13,98 1,65 440,39 11,9 2,08 10
PP with add.+K10Cu 21,36 2,64 422,19 17,74 3,62 10
PP without add.+K10Cu
17,26 2,08 447,76 15,57 1,69 10
PP with add.+VERZrAg 16,48 3,38 453,76 14,59 1,89 10
PP without add.+VerZrAg
16,27 3,56 456,36 12,39 3,88 10
PP with add.+VerZrCu 18,72 2,26 455,86 14,77 4,1 10
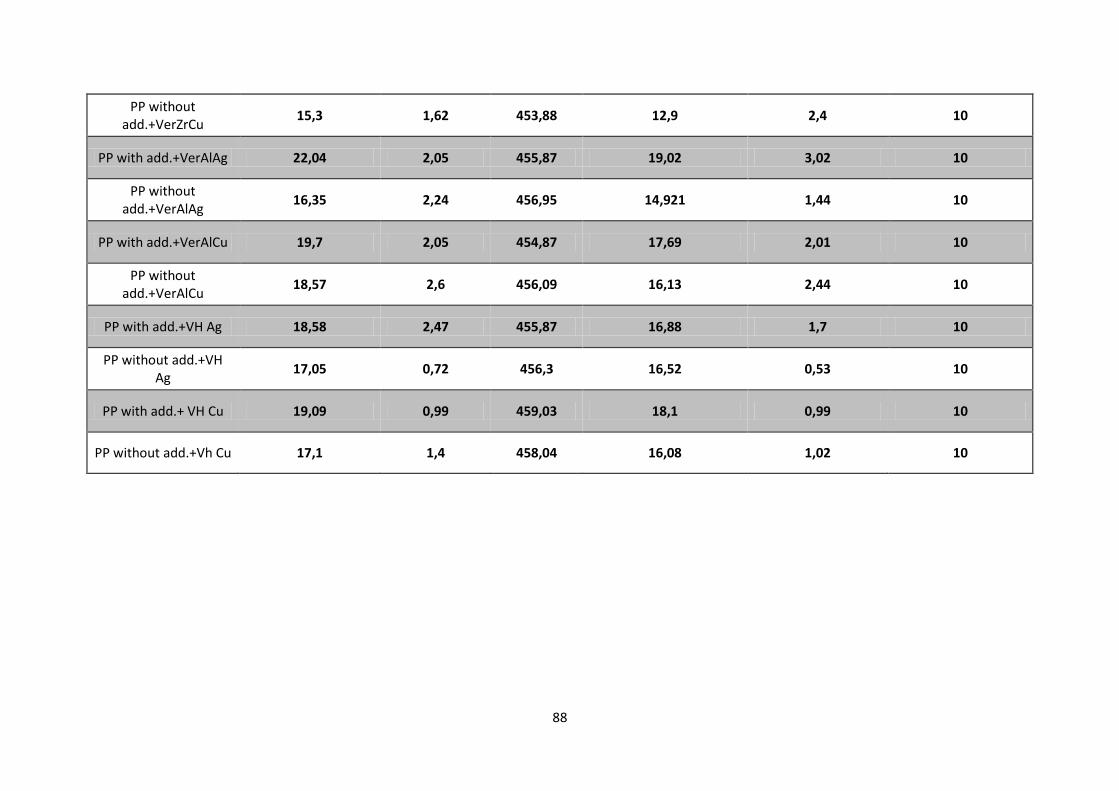
88
PP without add.+VerZrCu
15,3 1,62 453,88 12,9 2,4 10
PP with add.+VerAlAg 22,04 2,05 455,87 19,02 3,02 10
PP without add.+VerAlAg
16,35 2,24 456,95 14,921 1,44 10
PP with add.+VerAlCu 19,7 2,05 454,87 17,69 2,01 10
PP without add.+VerAlCu
18,57 2,6 456,09 16,13 2,44 10
PP with add.+VH Ag 18,58 2,47 455,87 16,88 1,7 10
PP without add.+VH Ag
17,05 0,72 456,3 16,52 0,53 10
PP with add.+ VH Cu 19,09 0,99 459,03 18,1 0,99 10
PP without add.+Vh Cu 17,1 1,4 458,04 16,08 1,02 10