fuel poverty methodology handbook 2020 - gov.uk
TRANSCRIPT

Fuel Poverty Methodology Handbook (Low Income High Costs)
30 April 2020 Statistical Methodology
Note – In 2021, fuel poverty in England changed to a new metric of Low Income Low Energy
Efficiency but this Low Income High Costs handbook is the latest report setting out how fuel poverty
was measured up to 2020.
Responsible statistician: Stephen Oxley Email: [email protected] Public enquiries: 0300 068 5025

Contents
1. Introduction ______________________________________________________ 1
1.1 What is fuel poverty? ____________________________________________ 1
1.2 What are the uses of fuel poverty statistics? __________________________ 3
1.3 Why are fuel poverty statistics reported separately for England, Wales, Scotland
and Northern Ireland? ________________________________________________ 4
2. What are the key data sources for modelling fuel poverty? __________________ 6
2.1 The English Housing Survey ______________________________________ 6
2.2 Energy price information _________________________________________ 8
3. How is household income modelled? __________________________________ 10
3.1 Overview _____________________________________________________ 10
3.2 Missing data___________________________________________________ 11
3.3 EHS Primary Benefit Unit (PBU) income methodology __________________ 13
3.4 Fuel poverty basic income methodology _____________________________ 18
3.5 Fuel poverty full income methodology _______________________________ 20
3.6 Fuel poverty equivalised after housing costs methodology _______________ 22
3.7 Validation of income data ________________________________________ 22
3.8 Changes in income methodology___________________________________ 24
4. How are energy prices calculated? ____________________________________ 31
4.1 Overview _____________________________________________________ 31
4.2 Data sources __________________________________________________ 32
4.3 Method of payment data _________________________________________ 35
4.4 Mapping the fuel prices of each household ___________________________ 36
4.5 Applying the Warm Homes Discount ________________________________ 38
4.6 Changes in prices methodology____________________________________ 39
5. How are household energy requirements calculated? ______________________ 40
5.1 Overview _____________________________________________________ 40
5.2 Dimensions calculation for energy requirements _______________________ 41
5.3 Dwelling energy requirements _____________________________________ 45
5.4 Information used in the calculation of fabric heat losses _________________ 46
5.5 Identification of space and water heating systems______________________ 47
5.6 Space heating assumptions and definition of heating regime _____________ 49
5.7 Water heating _________________________________________________ 53
5.8 Lights and appliance requirements _________________________________ 54
5.9 Cooking energy requirements _____________________________________ 54
5.10 Total fuel costs _______________________________________________ 54
5.11 Handling missing values ________________________________________ 56

Fuel poverty methodology handbook
5.12 BREDEM versions ____________________________________________ 57
5.13 Changes in energy modelling methodology _________________________ 57
6. Calculating fuel poverty under Low Income High Costs (LIHC) _______________ 58
6.1 Calculating the number of households in fuel poverty ___________________ 59
6.2 Calculating the fuel poverty gap____________________________________ 64
6.3 Calculation of the FPEER ________________________________________ 67
7. Projections methodology ____________________________________________ 69
7.1 Introduction ___________________________________________________ 69
7.2 Projecting energy efficiency _______________________________________ 70
7.3 Income _______________________________________________________ 73
7.4 Prices ________________________________________________________ 73
7.5 Projecting fuel poverty ___________________________________________ 74
7.6 Projecting against the target ______________________________________ 74
8. What fuel poverty statistics are available to users? ________________________ 76
8.1 Fuel poverty data _______________________________________________ 76
8.2 Fuel poverty publications _________________________________________ 77
8.3 Methodology information _________________________________________ 77
8.4 Consultation ___________________________________________________ 77
9. How accurate are the fuel poverty statistics? ____________________________ 79
10. Statistical Assessment ____________________________________________ 80
11. Acronyms ______________________________________________________ 81

Fuel poverty methodology handbook
1
1. Introduction
This methodology handbook is a guide for all users of the BEIS fuel poverty statistics.
Within it, the user will find descriptions of the methodology used to calculate the 2018 fuel
poverty figures for England, and the yearly fuel poverty time series produced back to 2003.
Information on the fuel poverty datasets available and where to find them is also included
in Section 8.
Users should note that the detailed methodological descriptions found from Chapter 2
onwards relate to the English fuel poverty statistics only (information on the other devolved
nations are provided in Section 1.3).
This is the 2020 version of this document, relating to the 2018 fuel poverty figures, and
supersedes all earlier methodology documents and updates.
1.1 What is fuel poverty
Fuel poverty in England is measured using the Low Income High Costs (LIHC) indicator. A
household is considered to be fuel poor if:
They have required fuel costs that are above average (the national median level); and
Were they to spend that amount, they would be left with a residual income below the
official poverty line.
The LIHC definition is a relative indicator as it compares households to the national
median fuel costs and income – thereby reflecting contemporary trends.
The Low Income High Costs indicator is a dual indicator consisting of:
i) The number of households that have both low incomes and high fuel costs
(shown by the shaded area in the bottom left hand quadrant in Figure 1); and
ii) The depth of fuel poverty among these fuel poor households. This is measured
through a fuel poverty gap (shown by the vertical arrows in Figure 1), which
represents the difference between the required fuel costs for each household
and the nearest fuel poverty threshold.
For a detailed explanation of how to calculate the Low Income High Costs indicator, see
Chapter 6.

Fuel poverty methodology handbook
2
Figure 1: Fuel poverty under the Low Income High Costs indicator
The key elements in determining whether a household is fuel poor under the LIHC
indicator are:
Household income;
Household energy requirements (dependent on dwelling characteristics and the
lifestyle of household occupants); and
Fuel costs.
The cost of energy is modelled rather than being based on actual spending. This ensures
that we do not overlook those households who have low energy bills simply because they
actively limit their use of energy at home, for example, by not heating their home. It is
calculated by combining the fuel requirements of the household with corresponding fuel
prices. These costs capture four areas of energy requirements:
Space heating;
Water heating;
Lights and appliances; and
Cooking.
The modelling ensures that the household achieves the adequate level of warmth (as set
out in the definition of fuel poverty and explained in more detail in Section 5.6), subject to a
range of characteristics concerning the dwelling and its occupants.

Fuel poverty methodology handbook
3
The household energy requirements are modelled based on several factors including:
The size of the property;
The number of people who live in the dwelling and their occupancy patterns;
The energy efficiency of the dwelling; and
The mix of different fuels used by each household.
1.2 What are the uses of fuel poverty statistics?
Fuel poverty data has a wide range of uses both within and outside of Government. As
well as being used to track objectives against targets, it is used to help develop, focus and
target policies. Whilst it is not possible to use the dataset to identify individual and specific
households that are in fuel poverty, within Government it is used to provide an
understanding of the demography and geography of the fuel poor, and to indicate which
groups are particularly susceptible to fuel poverty.
In addition, the wider English Housing Survey (EHS) dataset can provide detail around the
heating and energy requirement of different types of households and homes. This
information can be used to form an understanding of the role and impact of energy
efficiency measures on fuel poverty and help to target policies to improve the energy
efficiency of the housing stock.
Detailed demographic and dwelling-level splits of fuel poverty in England are available for
users, published as part of the annual fuel poverty reporting1. In addition to the current
year figures, a workbook showing long term trends in fuel poverty amongst different types
of household is updated and published annually2
BEIS also publish the full fuel poverty dataset each year at the household level. This is
made available from the UK Data Service3 after the full EHS datasets are made available.
This is helpful for users who want to extend their analysis of fuel poverty.
BEIS continue to endeavour to meet user requirements for sub-regional estimates of fuel
poverty. This data is used particularly by local authorities, who combine this data with
information they hold themselves to help target schemes at a local level. Annual sub-
regional LIHC fuel poverty data are available as Experimental Statistics4 for 2011 to 2018.
1 https://www.gov.uk/government/statistics/fuel-poverty-detailed-tables-2020 2 https://www.gov.uk/government/statistics/fuel-poverty-trends-2020 3 https://ukdataservice.ac.uk/ 4 Experimental statistics are defined in the Code of Practice for Official Statistics as “new official statistics undergoing evaluation. They are published in order to involve users and stakeholders in their development and as a means to build in quality at an early stage”.

Fuel poverty methodology handbook
4
1.3 Why are fuel poverty statistics reported separately for England, Wales, Scotland and Northern Ireland?
Fuel poverty is a devolved matter, with each separate administration having individual
policy targets, measurement and outputs. The main reason for the devolution is that the
separate administrations have the power to affect certain aspects of fuel poverty policies
(such as energy efficiency programs) but not others (such as incomes and market
conditions, which impact fuel prices). As a result, different indicators of fuel poverty are
used, that are based on different methodological assumptions.
Fuel poverty in Wales, Scotland and Northern Ireland, is currently calculated using a 10%
indicator as opposed to the LIHC indicator in England, to determine the proportion of fuel
poor in these nations.
Under the 10% indicator, a household is considered to be fuel poor if they are required to
spend more than 10% of their income on fuel, so as to maintain an adequate standard of
warmth. The fuel poverty ratio, used under this method, is defined as:
𝐹𝑢𝑒𝑙 𝑃𝑜𝑣𝑒𝑟𝑡𝑦 𝑅𝑎𝑡𝑖𝑜 = 𝑀𝑜𝑑𝑒𝑙𝑙𝑒𝑑 𝑓𝑢𝑒𝑙 𝑐𝑜𝑠𝑡𝑠 (𝑖. 𝑒. 𝑚𝑜𝑑𝑒𝑙𝑙𝑒𝑑 𝑐𝑜𝑛𝑠𝑢𝑚𝑝𝑡𝑖𝑜𝑛 × 𝑝𝑟𝑖𝑐𝑒)
𝐼𝑛𝑐𝑜𝑚𝑒
Where this ratio has a value greater than 0.1 (10%), the household is considered to be fuel
poor.
The 10% definition of fuel poverty was previously used to calculate the fuel poverty
statistics in England, from 2001 - 2011. In 2012, an independent review was published by
Professor John Hills5 which recommended a new method to calculate fuel poverty, with
separate indicators to calculate both the extent and depth of fuel poverty. This is known
as the Low Income High Costs (LIHC) indicator and has been used since the 2011 fuel
poverty statistics (published August 2013) to produce fuel poverty statistics for England.
Long term trends tables have been produced from 2003 using the LIHC indicator6.
The underlying assumptions used in the modelling of fuel poverty statistics varies for each
country, as detailed below.
In England fuel poverty is modelled from the English Housing Survey (EHS) using the
LIHC indicator, and this document explains the methodology underpinning the English
calculation.
In Scotland, the most recent statistics use a 10% indicator. The Scottish Housing
Survey is used to model fuel poverty. The most recent statistics measure fuel poverty
according to the definition of fuel poverty set out in the Scottish Fuel Poverty Statement
5 https://www.gov.uk/government/publications/final-report-of-the-fuel-poverty-review 6 https://www.gov.uk/government/collections/fuel-poverty-statistics

Fuel poverty methodology handbook
5
2002 using a 10% indicator. The underlying assumptions to calculate theoretical
energy consumption are similar to those used in England. The main differences in the
Scottish definition are alternative interpretations of;
a satisfactory heating regime for pensioners, long-term sick and disabled
households, meaning the adequate standard of warmth is achieved at a higher
temperature for these groups (23°C compared with English 21°C);
a different approach to under-occupancy.
The Fuel Poverty (Targets, Definition and Strategy) (Scotland) Bill7 was introduced to
the Scottish Parliament on 26 June 2018 and the Fuel Poverty (Targets, Definition and
Strategy) (Scotland) Act 20198 received Royal Assent on 18th July 2019. This includes
a new definition of fuel poverty in Scotland based on advice from an independent panel
of experts and further scrutiny and amendment by the Scottish Parliament. Please see
Annex C in the main fuel poverty report9 for further detail on the new definition.
The Welsh Housing Conditions Survey is used to estimate fuel poverty in Wales under
a 10% measure. Figures for Wales are also updated less frequently, as the fuel poverty
module of questions are not asked every year. The most recent estimates of fuel
poverty in Wales are measured using the Welsh Housing Conditions Survey 2017-18.
The last Housing Condition Survey for Northern Ireland was run in 2016. Fuel poverty
statistics produced using both a 10% and LIHC definition were published in 2018. It
should be noted that Northern Ireland has no statutory requirement relating to fuel
poverty.
As a result of both definition and methodological differences in fuel poverty for each
devolved nation, the figures are non-additive (i.e. cannot be combined) in relation to a UK
total. The latest fuel poverty figures for each of the devolved nations can be found at
Annex C in the annual fuel poverty report10. More details of the devolved surveys and fuel
poverty in each of the nations, can be found at the links below:
Scotland:
https://www.gov.scot/publications/scottish-house-condition-survey-2017-key-findings/
http://www.gov.scot/Topics/Statistics/SHCS
Wales:
https://gov.wales/fuel-poverty-estimates-wales
Northern Ireland:
https://www.nihe.gov.uk/Working-With-Us/Research/House-Condition-Survey
7 https://www.parliament.scot/parliamentarybusiness/Bills/108916.aspx 8 http://www.legislation.gov.uk/asp/2019/10/contents/enacted 9 https://www.gov.uk/government/statistics/annual-fuel-poverty-statistics-report-2020 10 https://www.gov.uk/government/statistics/annual-fuel-poverty-statistics-report-2020

Fuel poverty methodology handbook
6
2. What are the key data sources for modelling fuel poverty?
2.1 The English Housing Survey
The source of data for housing and the household members, essential for estimating fuel
poverty figures under LIHC, is the English Housing Survey (EHS). The EHS is currently an
annual survey, commissioned by the Ministry of Housing, Communities and Local
Government (MHCLG). For the purposes of producing the fuel poverty statistics, two years
of the survey are combined. The EHS data collected April 2017 to March 2018 (17-18
single year dataset) is combined with the data collected April 2018 to March 2019 (18-19
single year dataset) in order to produce the fuel poverty dataset used to estimate 2018 fuel
poverty figures.
The EHS covers all tenures and includes a household interview and a physical inspection
of properties by a surveyor. The information obtained through the survey provides an
accurate picture of the type and condition of housing in England, the people living there,
and their views on housing and their neighbourhoods. The survey is a random sample of
housing and householders in England. The sample is clustered, with half of England being
sampled each survey year, meaning that two consecutive years of the survey provide a
national sample, which is what is used to derive the fuel poverty statistics.
The two key components of the EHS used in the estimation of fuel poverty are:
Interview Survey: An interview is conducted with the householder. The interview covers
a wide range of topics that include: household characteristics, satisfaction with the
home and the area, disability and adaptations to the home, and income details;
Physical Survey: The interview is followed by a visual inspection of the property, both
internally and externally, by a surveyor. Data collected includes the number and type of
rooms and facilities contained in the property, the condition of a wide range of aspects
of the physical structure, details of the heating systems, approximate age of the
property, and assessment of neighbourhood quality.
Currently, each year around 13,300 interviews are conducted with householders, and
around 6,200 dwellings (approximately 6,000 households and 200 vacant properties) have
a follow-up physical survey of their dwelling.
Fuel poverty methodology handbook
7
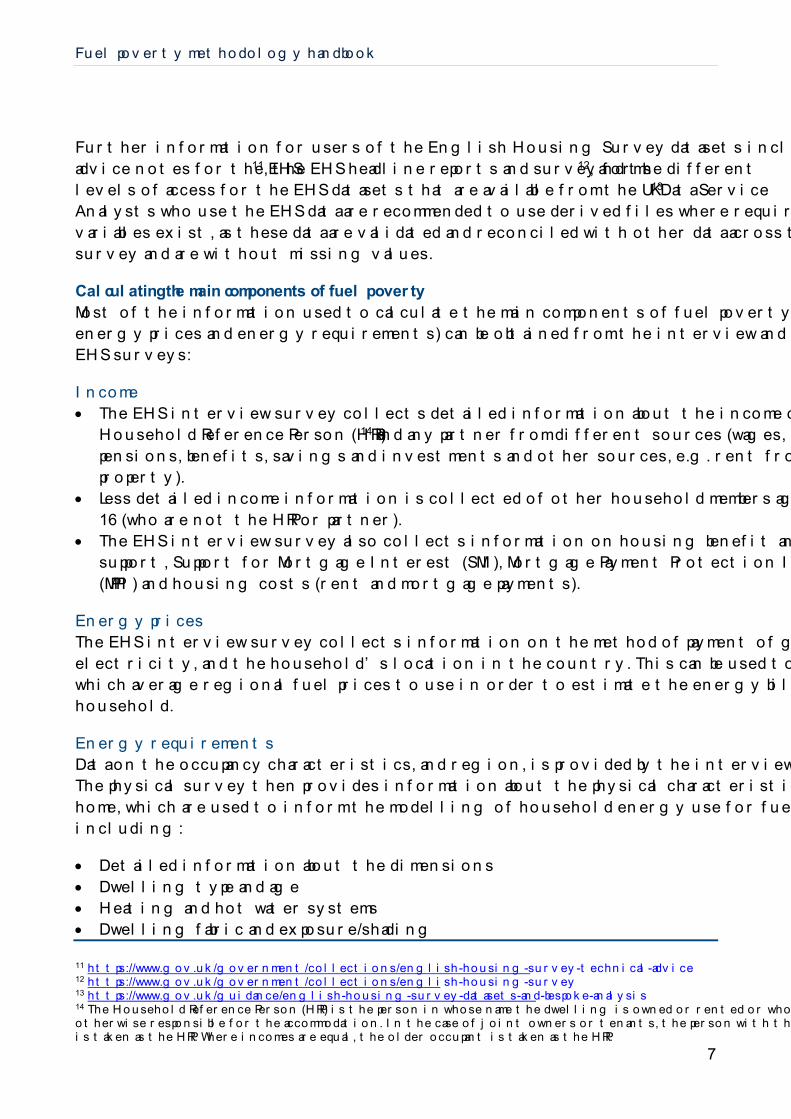
Further information for users of the English Housing Survey datasets include: technical
advice notes for the EHS11, the EHS headline reports and survey forms12, and the different
levels of access for the EHS datasets that are available from the UK Data Service13.
Analysts who use the EHS data are recommended to use derived files where required
variables exist, as these data are validated and reconciled with other data across the
survey and are without missing values.
Calculating the main components of fuel poverty
Most of the information used to calculate the main components of fuel poverty (income,
energy prices and energy requirements) can be obtained from the interview and physical
EHS surveys:
Income
The EHS interview survey collects detailed information about the income of the
Household Reference Person (HRP) 14 and any partner from different sources (wages,
pensions, benefits, savings and investments and other sources, e.g. rent from
property).
Less detailed income information is collected of other household members aged over
16 (who are not the HRP or partner).
The EHS interview survey also collects information on housing benefit and Council Tax
support, Support for Mortgage Interest (SMI), Mortgage Payment Protection Insurance
(MPPI) and housing costs (rent and mortgage payments).
Energy prices
The EHS interview survey collects information on the method of payment of gas and
electricity, and the household’s location in the country. This can be used to determine
which average regional fuel prices to use in order to estimate the energy bills for each
household.
Energy requirements
Data on the occupancy characteristics, and region, is provided by the interview survey.
The physical survey then provides information about the physical characteristics of the
home, which are used to inform the modelling of household energy use for fuel poverty,
including:
Detailed information about the dimensions
Dwelling type and age
Heating and hot water systems
Dwelling fabric and exposure/shading
11 https://www.gov.uk/government/collections/english-housing-survey-technical-advice 12 https://www.gov.uk/government/collections/english-housing-survey 13 https://www.gov.uk/guidance/english-housing-survey-datasets-and-bespoke-analysis 14 The Household Reference Person (HRP) is the person in whose name the dwelling is owned or rented or who is otherwise responsible for the accommodation. In the case of joint owners or tenants, the person with the highest income is taken as the HRP. Where incomes are equal, the older occupant is taken as the HRP.

Fuel poverty methodology handbook
8
Energy efficiency measures
Further information required for the modelling of fuel poverty is obtained from other data
sources. These are detailed in section 2.2 below, and within the chapters for each
component of fuel poverty.
2.2 Energy price information
Fuel prices used in the modelling of fuel poverty are produced using information gathered
from a variety of external sources, as the EHS does not collect detailed information on
energy suppliers and tariffs. Details of these sources are given below:
The Quarterly Energy Prices publication15 is used to provide the average annual fuel
prices for mains gas and electricity. Specifically, the prices are published within the
following BEIS published tables:
Average variable unit costs and fixed costs for electricity for UK regions (QEP
2.2.4); and,
Average variable unit cost and fixed cost for gas for regions in Great Britain (QEP
2.3.4).
The quarterly survey used to produce the tables for this official statistical16 publication
covers around 90 per cent of the energy suppliers and records specific details of the
price of each tariff, and the number of customers on each tariff in each region of the
UK, splitting this by payment type. BEIS then make assumptions for the proportion of
the market that is not surveyed in order to produce an estimate of the entire energy
market. Prices take the form of unit costs, fixed costs and any discounts that are given
(e.g. discount for paperless billing).
The Consumer Price Index (CPI)17, published by the ONS, is used to obtain fuel prices
for coal, heating oil and smokeless fuels. The prices are collected monthly and split
regionally.
The Sutherland Tables18 provide fuel price data for Liquefied Petroleum Gas (LPG) and
bottled gas. Fuel prices from the Sutherland Tables are available quarterly and are split
regionally to show comparative heating costs across the UK.
Finally, SAP 2012 fuel prices19 (from the Government’s Standard Assessment
Procedure for the energy rating of dwellings) are used for other fuels and tariffs (where
their use is relatively minor), including biofuels, communal heating, and economy 10
15 https://www.gov.uk/government/collections/quarterly-energy-prices 16 See Chapter 10 17 https://www.ons.gov.uk/economy/inflationandpriceindices 18 http://www.sutherlandtables.co.uk/ 19 https://www.bre.co.uk/sap2012/

Fuel poverty methodology handbook
9
and 24 electricity tariffs. These prices are then inflated to the survey year using the
CPI.

Fuel poverty methodology handbook
10
3. How is household income modelled?
This chapter details the income methodology, including the calculation of the final fuel
poverty income variables, validation of income and changes in the income methodology. A
list of the acronyms used in the description of the income methodology can be found in
Chapter 11.
3.1 Overview
The equivalised after housing costs (AHC) income is used to define the number of
households living in fuel poverty under the LIHC indicator and calculate the fuel poverty
gap. It is produced by:
Adding the personal incomes of every member of the household together plus any
benefit payments that the household receives (from private sources, state benefits, and
savings) to provide the Primary Benefit Unit (PBU) income. Income from other benefit
units and the Winter Fuel Payment (WFP), if applicable, is then added to give the
‘Basic household income’.
Addition of income related directly to housing, including: housing related benefits (HB),
Mortgage Payment Protection Insurance (MPPI), Council Tax Support (CTS), and the
deduction of Council Tax payable. This is the ‘Full household income’.
Deduction of housing costs (total mortgage repayments and net rent payments).
The division by the relevant income equivalisation factor (see Table 11) to reflect the
fact that different households have different spending requirements. This creates the
final ‘Equivalised AHC income’.
The income is calculated as the sum of the income of the Household Reference Person
(HRP) and any partner, known as the Primary Benefit Unit (PBU), plus any other adult
members of the household, known as Other Benefit Units (OBU). The EHS interview
survey collects detailed information about income sources for the PBU, and less detailed
income information for the OBU. Figure 2 outlines the main steps involved in this process
and the sections to follow, detail the procedures involved in each step.

Fuel poverty methodology handbook
11
Figure 2: The main steps in calculating equivalised AHC income
3.2 Missing data
The Computer Assisted Personal Interviewing (CAPI) used to conduct the EHS interview
survey contains many ‘soft checks’ to clarify values with the householder where extreme
amounts were initially provided, particularly around state benefits/allowances and tax
credits. Thus, the EHS income calculation method assumes that the details given by the
respondent are correct unless there is a strong reason to suggest otherwise. These are
assessed on a case by case basis. A method of imputation is required for these cases,
and (more commonly) for cases where information on income sources/amounts is either
refused or unknown. Within the 2018 combined year fuel poverty dataset, just under two-
thirds of the cases had no imputations for the Primary Benefit Unit (PBU) income data. Of
the remaining 34.9 per cent of cases with imputations, some cases had private sources
(15.5 per cent) or benefits (7.7 per cent) imputed where the information was missing,
refused or unknown. An additional 4.8 per cent of cases had some private sources and
Income from private sources
Basic Income
(For each household)
Add income from benefits & tax
credits
Deduct income tax and
national insurance payable
Bring lone parents and
pensioners up to at least basic
Income Support/Pension
Credit
Impute missing values
Add net income from
savings/investments
Add Winter Fuel
Payments to those
eligible
Full Income
(For each household)
Convert private income
sources provided as net to
gross income
PBU Income
(Of HRP and any partner
for each household)
Add income from council tax
support
Deduct council tax from all
households
Add on income from
other benefit units
Add income from housing related
benefits that help pay towards
rent
Add income from MPPI
Deduct housing costs
Apply equivalisation factor
Equivalised AHC
Income
(For each household)

Fuel poverty methodology handbook
12
some benefits imputed or changed. The remainder of cases had imputations such as,
household income imputed using group median (1.9 per cent), pension imputed to basic
state pension where below basic state pension (1.7 per cent), pension imputed using
group median where above basic state pension (1.9 per cent) and basic income imputed
where below basic income support (1.4 per cent). Table 1 summarises the type and
method of imputations carried out.
Table 1: Imputation procedures
Type of income Type of missing data Method of imputation
Private incomes Sources of private income are refused or unknown
Sample median imputed at a later stage
Self-employed Amounts missing Uses data from the Annual Survey of Hours and Earnings (ASHE) based on age, gender, part-time/full-time, social economic group and from 2010 data, also geographical location
Regular employment Amounts missing
Occupational pension Amounts missing Sample median based on gender and social economic group Private pension Amounts missing
Other sources Amounts missing Sample median based on working status
State benefits Benefits received are refused or unknown
Sample median imputed at a later stage
- Universal Credit - Income support - Job Seekers Allowance - Pension credit - State pension - Incapacity benefit - Employment and support allowance - Child benefit - Working tax credit* - Child tax credit - Maternity allowance - Widows pension - War disablement pension - Severe disability allowance - Industrial injuries disablement benefit - Attendance allowance - Carers allowance - DLA (mobility component) - DLA (care component) - PIP (mobility component) - PIP (daily living component) - Statutory sick pay
Benefit amount is refused or unknown
Where the rates vary greatly depending on the situation of the HRP and any partner (notably means tested benefits) individual benefit assessments are carried out. More general methods are used for benefits where fewer rates apply.
Other disability benefit Benefit amount is refused or unknown
Theoretical amount of DLA (mobility) modelled
Savings Amount of savings refused or unknown
Imputed using CHAID analysis using various household and dwelling characteristics
Primary Benefit Unit (PBU) income
Overall net household income missing or in households with a partner, HRP only missing/partner only missing
Median sample income imputed based on the HRP and any partner using the variables working status and social economic group or using HRP/partner information only
Other Benefit Units (OBU) Income amount missing for additional adults (on an individual basis)
Hot-decking (see section 3.4 for more information) based on gender, age, social economic group, working status, (from 2010 data) grouped geographical location for additional adults in work and (from 2015 data) presence of an income source.
Winter Fuel Payment (WFP) No information collected on whether household receives WFP
Modelled based upon eligibility of all household members. The amount depends upon the age profile of the household members.
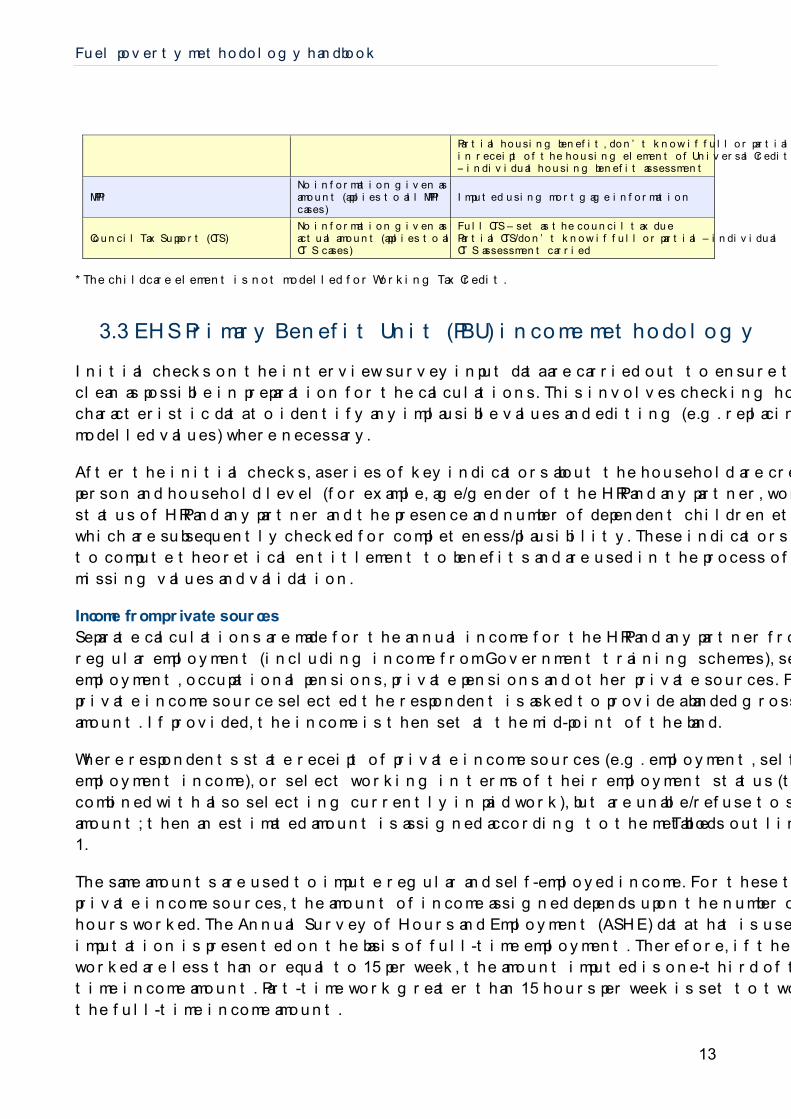
Housing related benefits that help pay towards rent
Amounts missing Full housing benefit – set as the net rent amount
Fuel poverty methodology handbook
13
Partial housing benefit, don’t know if full or partial or in receipt of the housing element of Universal Credit – individual housing benefit assessment carried out
MPPI No information given as to amount (applies to all MPPI cases)
Imputed using mortgage information
Council Tax Support (CTS) No information given as to the actual amount (applies to all CTS cases)
Full CTS – set as the council tax due Partial CTS/don’t know if full or partial – individual CTS assessment carried out
* The childcare element is not modelled for Working Tax Credit.
3.3 EHS Primary Benefit Unit (PBU) income methodology
Initial checks on the interview survey input data are carried out to ensure the dataset is as
clean as possible in preparation for the calculations. This involves checking household
characteristic data to identify any implausible values and editing (e.g. replacing with
modelled values) where necessary.
After the initial checks, a series of key indicators about the household are created at the
person and household level (for example, age/gender of the HRP and any partner, working
status of HRP and any partner and the presence and number of dependent children etc.),
which are subsequently checked for completeness/plausibility. These indicators are used
to compute theoretical entitlement to benefits and are used in the process of imputing
missing values and validation.
Income from private sources
Separate calculations are made for the annual income for the HRP and any partner from
regular employment (including income from Government training schemes), self-
employment, occupational pensions, private pensions and other private sources. For each
private income source selected the respondent is asked to provide a banded gross/net
amount. If provided, the income is then set at the mid-point of the band.
Where respondents state receipt of private income sources (e.g. employment, self-
employment income), or select working in terms of their employment status (the latter
combined with also selecting currently in paid work), but are unable/refuse to specify an
amount; then an estimated amount is assigned according to the methods outlined in Table
1.
The same amounts are used to impute regular and self-employed income. For these two
private income sources, the amount of income assigned depends upon the number of
hours worked. The Annual Survey of Hours and Employment (ASHE) data that is used for
imputation is presented on the basis of full-time employment. Therefore, if the hours
worked are less than or equal to 15 per week, the amount imputed is one-third of the full-
time income amount. Part-time work greater than 15 hours per week is set to two-thirds of
the full-time income amount.
Fuel poverty methodology handbook
14
Where the HRP/partner selected working in terms of their employment status, stated as
being in receipt of paid work, but did not select any employment or self-employment
income under their income sources (nor responded refused to their income sources) and is
not in receipt of any ‘other’ private income, then the HRP/partner is assigned an
employment income and an employment income amount is imputed based upon the
method outlined in Table 1. In this situation it is assumed that the HRP/partner
unintentionally omitted employment income as an income source in the EHS interview
survey.
For student households, if the HRP/partner is in full-time education (and not studying for A-
Levels), with no reported income sources, modelled to be living in a university household,
then the HRP/partner income is set to in receipt of 'other income', rather than ‘no income’
and an estimated amount is assigned according to the methods outlined in Table 1. Also,
each year, there are a few private income sources coded as £0 in the EHS interview
survey. These cases are individually assessed and where deemed implausible; an amount
is estimated using the standard imputation routines.
Respondents predominantly provide gross private income amounts. However, where net
amounts are given for income from private sources, the gross amount for that source is
approximated. The net amount is increased by 47 per cent if the individual is under
pension age and in receipt of earnings/self-employment income (to replicate tax and
National Insurance). Otherwise, 25 per cent is applied (to replicate tax only), unless the
combined private net and gross income is less than the tax threshold, in which case it is
assumed that no tax is paid, and the net amount is set to the gross amount. The total
gross private income for the HRP and any partner for all sources is calculated. This is
required to enable the total tax amount to be deducted. It is not possible to simply
calculate the tax on the gross part and then add the gross-taxed to the net, as the rate of
tax is dependent on income thresholds. Where imputation has taken place, this is recorded
against the data. On-going validation of the amounts of income from private sources is
carried out throughout the calculation.
Income from state benefits20
The EHS interview survey asks about benefits received by the HRP and any partner
(combined as a benefit unit) and the amounts and time periods of the payments. It is
unknown whether it is the HRP and/partner who are in receipt of the selected benefit
where a partner of the HRP is present in the household, with the exception of state
pension, child benefit, income support, pension credit and universal credit where the
individual recipient (whether HRP and/or partner) is known. As this information is required
for the purpose of tax deduction, it is estimated based on the eligibility criteria of each
person in the couple. Using this information, benefit amounts for the HRP and any partner
are calculated.
20 See section 3.8 for changes to Universal Credit

Fuel poverty methodology handbook
15
Missing benefit amounts are imputed for cases where the respondent has answered ‘yes’
to receiving a particular benefit but did not provide the amount received. For means tested
benefits, such as income support, the rate varies greatly depending on the circumstances
of the HRP and any partner and for these benefits individual benefit assessments are
carried out. For other benefits based on rates, such as Disability Living Allowance, the
prescribed rates are imputed.
Questions were introduced into the EHS 2010 interview survey to ascertain whether the
missing benefit amounts were due to the inclusion of the missing amounts with other
specified benefits. From 2010 modelling onwards, use of this data has been incorporated
into the assessment of missing benefit incomes to avoid double counting of benefit income
where it is deemed that the missing benefit income has already been accounted for.
The total benefit income is derived for the HRP and any partner separately, split between
taxable and non-taxable benefit income.
Income deductions
The final income variables are presented in terms of net income, which is the income net
of tax and National Insurance. At this stage in the income calculation process, the private
income is presented in terms of gross income and the benefit income is presented in terms
of gross and/or net income depending on the selected benefit receipt.
The private income and taxable benefit income are added together separately for the HRP
and any partner. This information is used in conjunction with the rates and allowances for
income tax, including applicable tax relief from property rental, to derive the income tax
payable for the HRP and partner. Based on the rates and allowances for National
Insurance21 , Class 1, 2 and 4 contributions are calculated. The total net income for HRP
and partner are computed separately by the following formula:
𝑁𝑒𝑡 𝑖𝑛𝑐𝑜𝑚𝑒 = 𝑁𝑜𝑛 𝑡𝑎𝑥𝑎𝑏𝑙𝑒 𝑖𝑛𝑐𝑜𝑚𝑒 + 𝑇𝑎𝑥𝑎𝑏𝑙𝑒 𝑖𝑛𝑐𝑜𝑚𝑒 − (𝑁𝑎𝑡𝑖𝑜𝑛𝑎𝑙 𝐼𝑛𝑠𝑢𝑟𝑎𝑛𝑐𝑒 𝑝𝑎𝑦𝑎𝑏𝑙𝑒
+ 𝐼𝑛𝑐𝑜𝑚𝑒 𝑡𝑎𝑥 𝑝𝑎𝑦𝑎𝑏𝑙𝑒)
Income from savings and investment
The EHS interview survey asks the HRP and any partner their combined total amount of
savings and any income they have invested, which is provided as banded amounts. The
mid-point of the reported band is taken as their savings amount.
Where the amount of savings/investment has not been provided, a method based on Chi
squared Automatic Interaction Detection (CHAID) analysis is used to estimate the
combined savings/investment of the HRP and any partner. The banded savings question
from the interview survey is used as the dependent variable in the analysis and a variety of
household and dwelling characteristics such as tenure and age/gender of HRP are used
21 National insurance contributions (NICs) fall into a number of classes, the class you pay depends on your employment status and how much you earn. See https://www.gov.uk/national-insurance/national-insurance-classes.

Fuel poverty methodology handbook
16
as the predictor variables for estimating the savings amount. Once all the cases have a
savings amount, income received from these savings is then calculated using a gross
interest rate of 3.75%. Income from savings is modelled as a gross amount and converted
(if applicable) to a net amount using an interest rate of 3 per cent net of tax22. As well as
the personal tax allowance, the personal savings allowance is also incorporated into the
gross to net conversion of savings income. The net savings amount is added onto the net
private and benefit income.
Low incomes
The next stage in the income calculation is the imputation of low incomes. This is where
the PBU net private and benefit income, including income from savings, is assessed for
certain groups to ascertain if it is below a theoretical minimum amount.
In 2007/2008 this area was the focus for development and was reviewed by the Fuel
Poverty Methodology Group (FPMG) who recommended some improvements to imputing
low incomes in 2008. Analysis showed that two household groups are more likely to under-
report their income: lone parents; and pensioners (although the reasons for this were not
investigated at this time). For these two groups, if their income is less than a minimum
amount, their income is imputed, using a different method for each group.
For lone parents, if their net income is below their theoretical income support entitlement
then their income is uplifted to their theoretical income support level (Figure 3a). Where
the HRP or any partner are over pension age, if their income is lower than state pension,
their income is imputed up to state pension (Figure 3b). If their income is greater than state
pension but lower than their pension credit entitlement their income is set to missing and
later in the calculation procedure it is imputed to the group median based on working
status and social economic group. A flag is created to identify cases which are changed in
the low income imputation routine and the original values are kept for later checking.
22 No information is collected on the type of savings account, the term of the account or the rate of interest. A net rate of 3% (3.75% gross) is fixed for all householders and has been used for all years of the fuel poverty calculation regardless of whether interest rates are higher or lower than this.

Fuel poverty methodology handbook
17
Figure 3: Imputation of low incomes
Imputing missing income data
At this stage there are three scenarios in which the total PBU income could still be
missing:
i) If the respondent answered ‘don’t know’ or ‘refused’ at the beginning of the
income section for the HRP and any partner;
ii) If the benefits received are reported as unknown or refused; or
iii) If, in the case of pensioners, their income is greater than state pension but lower
than their pension credit entitlement, their income is set to missing in the low
income imputation routine.
Where the HRP has a partner, it is possible that only one of the incomes is unknown or
refused. In this situation, or if there is no partner of the HRP, the income of the individual
with the missing amount is imputed to the group median based on their working status and
socio-economic group. Where the income of both the HRP and partner are missing, their
income is imputed to the group median based on a combined employment status and
socio-economic group for both HRP and partner.
Output Each PBU in the dataset has a net private and benefit income, including income from savings/investments.
𝑃𝐵𝑈 𝑖𝑛𝑐𝑜𝑚𝑒 = 𝑁𝑒𝑡 𝑝𝑟𝑖𝑣𝑎𝑡𝑒 𝑖𝑛𝑐𝑜𝑚𝑒 + 𝑁𝑒𝑡 𝑏𝑒𝑛𝑒𝑓𝑖𝑡 𝑖𝑛𝑐𝑜𝑚𝑒+ 𝑁𝑒𝑡 𝑆𝑎𝑣𝑖𝑛𝑔𝑠 𝑎𝑛𝑑 𝑖𝑛𝑣𝑒𝑠𝑡𝑚𝑒𝑛𝑡 𝑖𝑛𝑐𝑜𝑚𝑒
(𝑎𝑙𝑙 𝑏𝑎𝑠𝑒𝑑 𝑜𝑛 𝑡ℎ𝑒 𝐻𝑅𝑃 𝑎𝑛𝑑 𝑎𝑛𝑦 𝑝𝑎𝑟𝑡𝑛𝑒𝑟)
Fuel poverty methodology handbook
18
3.4 Fuel poverty basic income methodology
The fuel poverty basic income is the household net income, including winter fuel payment
for those eligible. The annual basic household income is then capped at £100,00023 to
maintain the confidentiality of respondents with an income above this level and to comply
with the data disclosure control guidance issued by the Government Statistical Service.
Other Benefit Units (OBU)
The PBU is made up of the HRP, their partner (if applicable) and any dependent children.
Other Benefit Units (OBU) are made up of other household members that are not part of
the PBU, e.g. a grown-up child living with their parents or two or more people sharing a
house. Each OBU can include up to two adults, but only if they are a couple, otherwise
each adult makes up its own OBU. For the fuel poverty calculations, the income of these
additional adult household members is considered as part of the household income24.
Data on the income of other household members aged over 16 (who are not the HRP or
partner) are collected at the person level. Household members aged 16 or over that are
not in the same benefit unit as the HRP are considered as additional adults and form the
OBU (if the household member is a child of the HRP/partner, aged between 16 and 18 and
in further education then they will be included in the same benefit unit as the HRP and
therefore not considered as an additional adult).
If a gross income is provided for the additional adult then this value is used for the income
of the household member. If no income sources are selected, apart from a particular group
of student cases (see below), the income of the additional adult is assigned as £0. If the
additional adult has selected income sources but has not provided an amount for their
income, then an income value is imputed based on a ‘hot-decking approach’.
If an additional adult is a full-time student, with no reported income sources, living in a
house where the HRP is also a full-time student in further education, then the additional
adult income is set to missing as opposed to no income (as it is highly likely that they have
misreported presence of an income source), and an income amount is imputed for the
individual based upon the hot-decking approach as described below.
The process of hot-decking involves finding cases in the dataset that provided an income
amount, which are similar in other parts of their responses to the cases with the missing
value. For imputing missing additional adult income values, a specification to find similar
cases is created for each case based on age (banded), gender, working status,
socioeconomic group (where applicable), grouped geographical location for those in work
23 The Government Statistical Service recommends that an appropriate level of top-coding should be applied to high incomes to make data non-disclosive. https://gss.civilservice.gov.uk/wp-content/uploads/2014/11/Guidance-for-microdata-produced-from-social-surveys.pdf 24 Additional adult household members reported during the EHS interview survey to be living in Halls of Residence are excluded from the analysis and their income is not considered to be part of the household income.

Fuel poverty methodology handbook
19
and presence of an income source. The case with the missing value has a precise
specification and it is matched at random to a case with an income value with the same
specification, this income value is then used for the missing case. If the additional adult
selected receipt of an income source, with a missing income value, then it is only hot-
decked against cases with an income greater than zero.
There are two situations where not all missing cases are matched:
i) If a case with a missing value has a specification which is not matched by a
case with a non-missing value; or
ii) When there are more cases with missing values than with non-missing values of
the same specification.
Missing cases that are not matched during the hot-decking process are imputed to a
sample median based on working status, and for some working status categories with
large samples, age (banded) and gender.
Once all the additional adults have a gross income assigned, it is converted to a net
amount by deducting the applicable income tax and National Insurance. The net income of
the additional adults is aggregated up to the household level to provide the total net
income from Other Benefit Units (OBU) in the household.
Winter Fuel Payments
Winter Fuel Payments (WFP), introduced in 1998, are a payment given once a year to
help older people with their cost of heating. They are available to households with at least
one resident aged over the female state pension age25 and are paid automatically to
eligible persons who have either received the payment before or who are in receipt of
state benefits (other than those that only receive either housing benefit, Universal Credit,
council tax support or child benefit). Those who do not automatically receive the WFP
have to claim the payment. No question is asked in the EHS survey as to whether anyone
in a household receives WFP. The applicable amount of WFP for the household is
modelled using the age profile of household members and the specified rates and
assigned to the household income. Additional one-off payments26 for household members
aged over female state retirement age are sometimes provided alongside WFP. For
example, in 2009/2010, in addition to the WFP payment there was an additional one-off
payment of £100 for households over 80 or £50 for those age 60 – 79. If applicable for the
year of the dataset, these payments will also be included in the WFP amount.
25 A male can claim a Winter Fuel Payment when they reach the state pension age of a woman with the same date of birth. 26 See page 26 of following document for more examples of additional payments made: Winter Fuel Payments update, Briefing Paper Number 06019, 24th March 2016 http://researchbriefings.files.parliament.uk/documents/SN06019/SN06019.pdf

Fuel poverty methodology handbook
20
Output
The Fuel Poverty Basic Income variable (fpbasinc)27 is created by adding the income from
the OBU in the household and the WFP to the PBU income variable.
𝐹𝑢𝑒𝑙 𝑝𝑜𝑣𝑒𝑟𝑡𝑦 𝑏𝑎𝑠𝑖𝑐 𝑖𝑛𝑐𝑜𝑚𝑒 (𝑓𝑝𝑏𝑎𝑠𝑖𝑛𝑐) = 𝑃𝐵𝑈 𝑖𝑛𝑐𝑜𝑚𝑒 + 𝑂𝐵𝑈 𝑖𝑛𝑐𝑜𝑚𝑒 + 𝑊𝐹𝑃
There are a small proportion of cases with a fuel poverty basic income of zero. This occurs
where:
i) the HRP and any partner select that they have no sources of income, with no
savings/investments;
ii) there is no income from any other additional adult household members; and
iii) where there are no household members over female state pension age and
therefore not in receipt of WFP.
At this stage of the modelling, for these cases the income is left unchanged.
3.5 Fuel poverty full income methodology
The Fuel Poverty Full Income variable is created by adding the income received related to
housing costs, notably housing related benefits (HB), Mortgage Payment Protection
Insurance (MPPI) and council tax support, to the uncapped basic income variable, and by
subtracting the annual approximate Council Tax bill for the household. Income/outgoings
relating to housing costs are dealt with in this final step, and the annual full household
income is then capped at £100,000.
Income from Housing Related Benefits that help pay towards rent
Housing benefit, Local Housing Allowance (LHA) and the housing element of Universal
Credit apply only to low income households that rent their home or are in a shared
ownership scheme, designed to help people on a low income pay their rent. Housing
benefit is derived from the householder’s response to the questions in the rent and
housing benefit module in the EHS interview survey questionnaire.
Where households state that they receive a housing related benefit that helps pay towards
rent but do not provide an amount, the amount is imputed in one of the following ways:
i) If the household states that they are in receipt of full housing benefit/LHA then
the weekly housing benefit is set to their theoretical guide rent amount (net of
services included in the rent such as heating, meals, water rates etc.) based on
their tenure, number of bedrooms and the English Region in which they live.
ii) If the household states that they are in receipt of partial housing benefit/LHA,
receipt of the housing element of Universal Credit or if they do not know if their
27 https://www.ukdataservice.ac.uk/get-data

Fuel poverty methodology handbook
21
housing benefit/LHA covers all or some of their rent, then an amount of housing
related benefit is imputed based on their total net rent payable and their
theoretical entitlement to housing benefit. For a selected number of Universal
Credit cases, the weekly housing related benefit amount received by the
household is calculated earlier in the income model process, and then brought
into the rent and housing benefit model to calculate the final amounts. From the
2013 modelling of EHS data onwards, the theoretical entitlement to partial
housing related benefits includes the modelling of the under-occupation charge
for working-age social tenants as introduced by Government in April 2013.
Income from Mortgage Payment Protection Insurance
Mortgage Payment Protection Insurance (MPPI) promises to make repayments on a
householder’s mortgage in the event of accident, sickness or unemployment. In the EHS
interview survey, applicable households are asked if they are in receipt of contributions
towards their mortgage payment under a MPPI policy and, if so, whether it covers
full/partial payments. No information is collected on the amount of MPPI. For cases in
receipt of MPPI, an amount for MPPI is set equal to their mortgage payment amount.
Income from Council Tax Support
Low income households may be eligible for Council Tax Support (CTS) from April 2013
(also known as Council Tax Reduction). The EHS interview survey asks the HRP and any
partner liable for paying Council Tax whether they are in receipt of CTS and, if so, whether
it covers full/partial payments. For households in receipt of full CTS payments, their CTS is
set to the full amount of Council Tax payable for their property. For households in receipt
of partial CTS or households that do not know if they are in receipt of CTS, a CTS amount
is assigned based on the Council Tax payable for the property and on their theoretical
eligibility.
Council Tax Deduction
The Council Tax band for each dwelling is collected via a data matching exercise
undertaken by the Valuation Office Agency28. The approximate amount of Council Tax
paid by the household is modelled using the Council Tax band of the dwelling and
information about charges in the relevant local authority area and is adjusted (using a
smoothing methodology) to minimise the identification of lower geographical areas. Single
person discount is applied where appropriate based on household size and whether the
respondent reported receipt of a discount on their Council Tax.
Output
The Fuel Poverty Full Income variable (fpfullinc)29 is created by adding the income related
to housing costs; i.e. housing related benefits that help pay towards rent, MPPI and
28 This is achieved by matching postcodes to Council Tax band information in order to feed into modelling undertaken by the survey contractors for the production of statistics only. Raw council tax data is deleted at the end of the process in line with data sharing agreements. 29 https://www.ukdataservice.ac.uk/get-data

Fuel poverty methodology handbook
22
Council Tax Support, to the uncapped basic income variable (fpbasinc) and subtracting the
approximate Council Tax payable.
𝐹𝑢𝑒𝑙 𝑝𝑜𝑣𝑒𝑟𝑡𝑦 𝑓𝑢𝑙𝑙 𝑖𝑛𝑐𝑜𝑚𝑒 (𝑓𝑝𝑓𝑢𝑙𝑙𝑖𝑛𝑐)= 𝑓𝑝𝑏𝑎𝑠𝑖𝑛𝑐 + 𝐻𝐵 / 𝐿𝐻𝐴 + 𝑀𝑃𝑃𝐼 + 𝐶𝑇𝑆 − 𝑐𝑜𝑢𝑛𝑐𝑖𝑙 𝑡𝑎𝑥 𝑝𝑎𝑦𝑎𝑏𝑙𝑒
As mentioned in Section 3.4, there are a small proportion of cases with a Fuel Poverty
Basic Income of zero. These incomes are retained, as recommended by the 2005 Sefton
and Chesshire30 Peer Review of the Fuel Poverty Methodology, in line with the treatment
of zero incomes in the Households Below Average Incomes statistics (HBAI)31 which are
based on data from the Family Resources Survey.
In these situations, and also for cases with a low basic income, this can lead to a negative
Fuel Poverty Full Income if the household does not report that they are in receipt of any
housing related payments and where they are liable for Council Tax for which a deduction
is made from their zero/low incomes.
3.6 Fuel poverty equivalised after housing costs methodology
The fuel poverty equivalised AHC income, as used in the calculation of the official fuel
poverty statistics, is an extension of the fuel poverty full income variable. Housing costs
(as published in the EHS derived interview file) are deducted from the uncapped full
income of the household, and the household income is equivalised to reflect the fact that
different households have different spending requirements. The final equivalised after
housing costs income variable is then capped at £100,000 before the calculation of fuel
poverty variables. Any negative AHC equivalised incomes are set to £0. The methodology
is detailed in Chapter 6.
3.7 Validation of income data
The validation of the input data into the income calculations, through to validation of the
final output fuel poverty income variables, is an important process to ensure data quality.
This process is outlined below.
Checking of the income data collected begins at the interview stage. The EHS interview
survey is collected using a technique called Computer Assisted Personal Interviewing
(CAPI) where the interviewer enters the information collected from the respondent directly
into a laptop computer. The EHS CAPI has in-built checks to ensure that the respondent’s
answers are as accurate as possible. For certain benefits, if an amount is entered outside
a valid range then a check will appear on the computer screen. The CAPI system has
30 Peer Review of the Methodology for Calculating the Number of Households in Fuel Poverty in England. Final Report to DTI and Defra, by Tom Sefton and John Chesshire. April 2005. 31 https://www.gov.uk/government/collections/households-below-average-income-hbai--2

Fuel poverty methodology handbook
23
cross checks between variables e.g. if housing benefit receipt is selected but not Council
Tax benefit. The checks in the CAPI system are routinely reviewed bi-annually and
updated as appropriate.
Once in receipt of the interview survey files, before beginning the income calculations,
initial checks on the interview survey input data are carried out to ensure they are as clean
and complete as possible. This involves checking household characteristic data, which is
later used for imputing missing values and validation. Implausible and missing values are
identified, and editing/imputation takes place where necessary.
Checks are made at each stage of the calculation process to ensure as far as possible that
the data are reasonable, and that missing data have been imputed correctly. Implausible
values are interrogated and only when we can be as certain as possible that the
information is incorrect is an imputation or change made. Any changes made are always
noted alongside the data to indicate the nature and extent of any imputation. At the end of
each stage additional checks are made to ensure that there are no missing values in the
final variables.
Certain parameters are evaluated at the end of each stage of the calculation process and
compared to previous English House Conditions Survey (EHCS)/EHS data. For example,
once the benefit section of the calculation process is complete, the take-up proportion of
imputed data and average values for each benefit are assessed.
Oddities in the results for the components of the fuel poverty income variables are
investigated in detail, concentrating on the difference in the data between the two specific
years until the change can be explained. This involves putting the data in context by
comparing the components of the fuel poverty income to external administrative sources
e.g. DWP/HMRC benefit statistics and data from other surveys e.g. the Annual Survey of
Hours and Earnings (ASHE) and the Living Cost and Food Survey (LCFS). From this
process it may be deemed that the results are in line with other external sources or the
difference attributed to the underlying EHS data or changes to the EHS interview survey.
The main external validation techniques applied to the fuel poverty income measures are
trend analysis over time and comparison with specific year income data from other
surveys, notably the LCFS and the Family Resources Survey (FRS).
The internal validation also occurs on the final fuel poverty income variables, comparing
the total income measures to data from previous years, looking at the distribution of
income across the population and the average income of certain household groups.
Income data from the LCFS Family Spending publication was used until 2014 to compare
the LCFS disposable household income to the fuel poverty basic income. Due to a change
in the data provided in the Family Spending publication however, from 2015 onwards the
LCFS 2015 disposable income from the Household Disposable Income and Inequality
(HDII) report is now compared to the fuel poverty full income (as the two income measures

Fuel poverty methodology handbook
24
are fairly closely aligned in their definition) by overall households, tenure and income
quintiles. Any unexpected divergence in the results between the two income measures is
investigated.
The FRS is considered to be the most comprehensive and accurate income survey
conducted in this country, and one that is dedicated to measuring incomes. The FRS
income data for the comparable year to the fuel poverty full income is not published until
after the publication of the fuel poverty statistics. However, the FRS provides the best
external income data source for comparison and it is therefore important to compare a
variant of the fuel poverty full income to the equivalent FRS income variable on publication
of the FRS data, focusing on the comparability of the distribution of incomes in both
surveys and the characteristics of households with the lowest incomes.
The FRS data are also the underlying source behind the AHC equivalised income figures
presented in the Households Below Average Income (HBAI) series, published by DWP.
Again, the comparable year of the HBAI is not published until after the publication of the
fuel poverty statistics but time series charts are produced on availability of the data to
compare the HBAI equivalised AHC income to the fuel poverty AHC equivalised income by
overall households and income deciles.
Outliers
Outlying cases are identified in the data and validated to ensure that the data modelling
processes are being performed correctly. In rare cases where the data are deemed to
require modification due to implausible outcomes, modifications to data imputation regimes
may be made as appropriate. In the 2014 and 2015 dataset, an alternative income
procedure was employed for one case, due to missing responses to their earnings from
amounts. In response to this outlying case and to minimise occurrences of outliers that
specifically affect fuel poverty, extra checks have now been incorporated into the income
modelling procedure, at an earlier stage. In particular, checks are carried out on
employment income values below minimum wage and in the top quintile for property
value/rent (i.e. those more likely to have low AHC incomes). Cases are now flagged and
investigated further if their only private income source is investment income, and the
amount for this income source is missing. Issues raised by the unusual circumstances of
specific outlier cases are fed back into future validation routines, where checks and
processes are added to help deal with similar issues in the future.
3.8 Changes in income methodology
Each year, minor modifications may be made to the fuel poverty income calculation
methodology as a result of improvements in the treatment of missing data, changes in the
benefit and tax system and minor alterations to the EHCS/EHS interview survey. Selected
years have also undergone larger methodology changes to the income calculation

Fuel poverty methodology handbook
25
assumptions which is the focus of this section. For the 2018 statistics there were relatively
minor changes to the methodology used for the calculation of household income.
Fuel poverty incomes were originally calculated for the 1996 statistics and a very similar
methodology was followed for the 2001 statistics. Ahead of the production of the 2003
figures, the Department of Trade and Industry (responsible at the time for publishing fuel
poverty statistics) commissioned a consultation to discuss proposed changes to the fuel
poverty income methodology. This resulted in three initial changes to the calculation of
household incomes, all of which came about due to additional information being collected
in the EHCS interview survey. This updated method was first used to calculate the 2003
fuel poverty figures. Headline figures for 1996, 1998 and 2001 were also revised to adopt
the new methodology. Further changes have taken place as a result of continual review of
improvements towards data quality and substantial changes to the interview survey as
discussed in more detail below.
Other Benefit Unit (OBU) income (2003 dataset)
Prior to the work on the 2003 EHCS data, incomes from other benefit units (i.e. other adult
household members who were not part of the same benefit unit as the HRP) were
modelled using a correction factor based on the Expenditure and Food Survey (EFS – now
the Living Costs and Food Survey). For the 2003 dataset a new method of computing the
income of other benefit units was introduced that used data collected in the EHCS
interview survey. Questions were asked of the respondent about any state benefits or
income received by each of the additional adult household members and these were used
to derive the income of the OBU.
Council Tax Deduction and Council Tax Benefit (2003 dataset)
Net Council Tax liability was not included in the fuel poverty Full Income definition prior to
the 2003 EHCS data. From 2003, Council Tax payments (net of Council Tax benefit) were
deducted from the fuel poverty Full Income. This was in order to be consistent with the
Government’s official Households Below Average Income (HBAI) measure and to ensure
consistency within the income definitions (i.e. for full income, including both the payment of
Council Tax, and the benefit received to help pay it; for basic income excluding both the
payment and the benefit).
Low Income Imputation (2006 dataset)
In 2004, alongside and in support of the fuel poverty consultation, an independent review32
of the fuel poverty methodology took place. In the peer review it was recommended that
the treatment of very low household incomes on the EHCS should be investigated with the
view to possibly amending the methodology to match more closely that of the Family
Resources Survey (FRS), a dedicated income survey. The FRS does not impute very low
incomes but leaves them on the dataset, including negative income amounts (e.g. a self-
32 Sefton, T and Cheshire, J. Peer Review of the methodology for calculating the number of households in fuel poverty in England. http://webarchive.nationalarchives.gov.uk/20070603164510/http://www.dti.gov.uk/files/file16566.pdf

Fuel poverty methodology handbook
26
employed person who has made a loss in the year concerned), whereas the EHCS (at the
time of the review) uplifted all households that were on a low income up to at least their
basic income support entitlement.
Following an extensive income review by BRE and the Fuel Poverty Methodology Group
(FPMG) a new low income method was decided upon and endorsed by the FPMG. The
new method was first adopted for the 2006 fuel poverty calculations, whereby only the
household composition categories adults over pension age and lone parents are subject to
the low income imputation (see details in Section 3.3).
Housing Benefit (2007 dataset)
In the 2007 EHCS interview survey, the Rent and Housing benefit module of the interview
survey was extensively revised leading to a more comprehensive set of questions on rent
and housing benefit. The 2007 fuel poverty calculations were adjusted to incorporate these
interview survey changes. As a result, the housing benefit amount assigned to applicable
households changed from being based on theoretical entitlement to the amount provided
by the occupant (where available).
Council Tax Benefit (2007 dataset)
In the 2007 EHCS, the method used for calculating levels of Council Tax benefit was
improved due to increased data quality in this area. Prior to 2007, the level of Council Tax
benefit assigned to a household was based on theoretical entitlement to this benefit. In
2007, the methodology was improved to allow use of the reported receipt of Council Tax
benefit receipt where provided.
Savings/Investment Income (2007 dataset)
In the 2007 EHCS interview survey, the questions asked about savings/investment were
adjusted to include more detail about savings/investment above £50,000. Questions on the
savings of the HRP and partner were asked in banded savings amounts. Prior to 2007, the
top savings band was £50,000 or over. For the purposes of fuel poverty income
calculations, it was assumed that this represented a level of savings of £55,000. In the
2007 EHCS interview survey, the following additional bands were added: a) £50,000-
£99,999; b) £100,000-£149,999; and c) £150,000 or over. For the purposes of fuel poverty,
the income methodology assumes levels of savings of a) £75,000, b) £125,000 and c)
£175,000 respectively.
Other Benefit Unit (OBU) income (2008 dataset)
In April 2008, the English House Condition Survey (EHCS) merged with the Survey of
English Housing (SEH) to create the English Housing Survey (EHS) leading to further
changes in the 2008 interview survey. The main change relevant to the fuel poverty
income due to the move to the EHS was the way income information is collected for
additional adult household members.

Fuel poverty methodology handbook
27
Prior to the 2008 survey, there was an income module in the interview survey on the OBU
that collected income and benefit information at the Benefit Unit level on other adult
members living within the household (who were not part of the same benefit unit as the
HRP). This information was used to compute the income of Other Benefit Units and
missing values were imputed via two different methods based on working status. If an
adult member of the OBU was working, then income data from ASHE was used to impute
an income value based on full-time/part-time, age and sex. If no additional adults in the
OBU were working, then the income of the OBU was imputed to their theoretical income
support entitlement.
In 2008, the OBU income section was removed from the EHS interview survey. The
required information was collected differently via questions asked of all household
members aged 16 or over. Additional adult incomes can be extracted from these data and
the 2008 fuel poverty income methodology was revised to incorporate the additional adult
income survey changes. The method of imputing missing values also changed to hot-
decking (for more detail see Section 3.4) to capture the variability found in actual income
data on additional adults.
Savings Routine (2008 dataset)
Prior to 2008, the addition of income from savings/investment was the last step in
calculating the Primary Benefit Unit income (that of the HRP and Partner). This changed in
2008 and the routine is now performed before the low income imputation so that the
amount of income from savings/investment can be added onto the net private and benefit
income of the HRP and any partner before the low income assessment. This change was
added as an improvement to the income methodology to ensure that the income of lone
parents and pensioners are not imputed in the low income imputation routine if they have
sufficient savings/investment to put them above the low income threshold.
Earnings from other work (2008 dataset)
Prior to 2008, in the EHCS interview survey there were two income categories. In addition
to the income category ‘Earnings from main job’ there was also an income category called
‘Earnings from other work’. From the 2008 survey year onwards, the EHCS category
‘Earnings from other work’ was removed from the survey and the employment income
category broadened from applying to the main job only (under the EHCS) to a general
‘Earnings from employment’ category under the EHS. From 2008 onwards earnings from
other work is likely to be recorded under the category ‘Earnings from employment’ or the
category ‘Other sources’.
Housing Benefit (2013 dataset)
For the 2013 modelling of EHS data, the theoretical entitlement to partial housing related
benefits includes the modelling of the under occupation charge for working-age social
tenants (Removal of Spare Room Subsidy) as introduced by Government in April 2013.

Fuel poverty methodology handbook
28
Council Tax Support (2013 dataset)
In April 2013 Council Tax Support (CTS) replaced Council Tax Benefit (CTB). Across all
Local Authorities (LA), support for pensioners remained the same as under the old CTB
scheme. Therefore, no changes have been made to the calculation of theoretical partial
CTS for pensioners in 2013. Different LA's adopted different approaches to the CTS
scheme, but it is not feasible to model each scheme on the EHS data. Generally, across
the majority of Local Authorities, the support for working age claimants was cut compared
to the old CTB scheme. For 2013 and subsequent modelling, a blanket factor is applied to
reduce the theoretical partial CTS entitlement for working age claimants for all Local
Authorities. This factor is derived each year by simulating theoretical CTS entitlement on
EHS data and matching it to research undertaken on CTS reductions by the JRF33 (Joseph
Rowntree Foundation) and varies very slightly around the 0.85 mark for each survey year.
Council tax payable (2015 dataset)
From 2015, a smoothing methodology has been applied in the derivation of council tax to
minimise identification of lower geographical details. Rather than using the exact council
tax due for each Local Authority as previously used in modelling, an average council tax
due is calculated based on several similar local authorities, resulting in very small
differences to the amounts assigned.
Universal Credit (2016 dataset)
Universal Credit is a benefit that was introduced in April 2013 and is gradually replacing
the following means-tested benefits: income-based Job Seekers Allowance, income-based
Employment and Support Allowance, Income Support, Child Tax Credit, Working Tax
Credit and Housing Benefit. Due to an increasing number of households in receipt of this
benefit, changes to the way Universal Credit is modelled were introduced in 2016, to better
match how universal credit is paid to households in receipt of this benefit. This resulted in
a more accurate representation of how the benefit is split up into the main element
(modelled as the Universal Credit benefit) and the housing element (modelled as housing
benefit).
Personal Savings Allowance (2016 dataset)
From April 2016, changes were made to the way income from savings is taxed. The
personal savings allowance exempts basic rate taxpayers from tax on the first £1000 of
savings income, while higher rate taxpayers are exempt from tax on the first £500 of
savings income. Additional rate taxpayers have no personal savings allowance. The
personal savings allowance has been incorporated into the calculation of income from
savings.
Student households (2017 dataset)
Student households in the EHS have previously been flagged as a group where it is
believed that their total household income is typically underreported. Several measures
33 https://www.jrf.org.uk/report/how-have-low-income-families-been-affected-changes-council-tax-support

Fuel poverty methodology handbook
29
were put in place to better represent student income from loans and family allowances. In
the EHS 2017/18, a reminder was added to interview survey to prompt interviewers to
include student loans and family allowances as income. Also, minor changes surrounding
the income of student households were incorporated into the 2017 modelling; 1. If an
additional adult is a full-time student, with no reported income, living in a house where the
HRP is a full-time student in further education, then the additional adult income is set to
missing (as it is likely that they have misreported presence of an income source) and an
income amount is imputed. 2. If the HRP/partner is in full-time education (and not studying
for A-Levels), with no reported income, modelled to be living in a university household,
then the HRP/partner income is set to in receipt of 'other income', rather than ‘no income’
and an income amount is imputed.
Rental Income (2017 dataset)
From April 2017, a property trading scheme was introduced whereby an individual can
benefit up to £1,000 in tax-free allowance for property income. For the 2017 fuel poverty
modelling, the property trading scheme allowance has been incorporated into the
derivation of the personal tax allowance, as well as incorporating the pre-existing rent a
room scheme that allows an individual to earn up to a threshold of £7,500 per year tax-free
from letting out furnished accommodation in their home. If the HRP/partner selects receipt
of income from rent, the fuel poverty income modelling assumes that the HRP/partner
benefits in tax relief from either the £1,000 property trading allowance scheme or, if a
lodger is present, the rent a room relief legislation. You cannot get both rental allowances;
therefore, the greatest applicable tax allowance figure is derived based on the
HRP/partner modelled rental income and their circumstances, and assigned to the
individual.
Negative AHC equivalised incomes (2017 dataset)
From 2017 modelling, any negative AHC equivalised incomes are set to zero. This is done
to take account of the inappropriate action of equivalisation factors on negative incomes,
which will act in the opposite direction to that which is intended. Setting to zero is based
upon the recommendation of the Canberra Group Handbook on Household Income
Statistics34. In addition to this, the fuel poverty income modelling and EHS rent/mortgage
modelling (the latter from which the derived housing cost variables are sourced) are very
separate models with little integration between the two. Due to this, there can be some
cases every year that have extreme negative AHC incomes values which are highly
implausible. Setting the AHC income values to £0 mitigates these extreme implausible
situations. This has no effect on the fuel poverty status, or fuel poverty gap, for these
households.
34 http://www.unece.org/index.php?id=28894

Fuel poverty methodology handbook
30
Support for Mortgage Interest (2018 dataset)
Homeowners on certain benefits may be eligible to get help towards mortgage interest
payments called Support for Mortgage Interest (SMI). However, from April 2018, SMI no
longer exists as a benefit for new or existing claimant’s, instead it is now paid as a loan
which is repaid with interest upon the sale of the claimant’s home, or on a claimant’s return
to work if the borrower can afford it. As SMI has switched from a benefit to a loan, from
2018 modelling, SMI is no longer included as a component of fuel poverty household
income.
Universal Credit (2018 dataset)
Since its introduction in April 2013, attention is paid to cases where the HRP or partner
selects receipt of Universal Credit in the benefit module of the EHS interview survey. To
better capture the data on Universal Credit amounts, questions regarding Universal Credit
were altered in the EHS 2018 interview survey. The modelling of Universal Credit has
been updated to reflect the EHS interview survey revisions. Universal Credit covers an
‘income’ component and (if applicable) a ‘housing’ component. To ensure that Universal
Credit receipt is not double counted under both the income component (income based
benefits) and the housing component (housing related benefits), cases where the
HRP/partner selects Universal Credit in the detailed income benefits section of the
interview survey, are assigned a Universal Credit Scenario between 1 and 20 in the benefit
modelling. The scenario assigned depends upon how the suite of EHS Universal
Credit/housing related benefit interview survey questions were answered in combination
with theoretical modelled universal credit 'income only' amounts. Depending on the
scenario assigned, the Universal Credit amount collected in the benefit section of the EHS
interview survey is either treated as the total Universal Credit amount that includes help
towards housing costs i.e. an ‘income’ element and a ‘housing’ element combined, or as
an 'income' only amount i.e. an amount that excludes the housing element. In the former
situation, the income only amount is derived by deducting the housing element (as
collected in the housing benefit module of the EHS interview survey) from the total
combined amount. The housing element of Universal Credit is not incorporated as income
in the Primary Benefit Unit (PBU) income variable, but the housing element of Universal
Credit is included as income in the fuel poverty full income variable (an extension of the
PBU income variable). The combination of the EHS interview survey revisions regarding
Universal Credit and the revisions to the Universal Credit methodology, reduces the risk of
double counting Universal Credit in the income modelling.

Fuel poverty methodology handbook
31
4. How are energy prices calculated?
4.1 Overview
The fuel price element of the fuel poverty calculation produces fuel prices which can
readily be combined with household energy requirement outputs to produce fuel costs (see
Section 5.10). The price that each household pays for its fuel depends on four main
factors:
The household’s location within the country (as fuel prices vary regionally);
The choice of supplier;
The choice of tariff;
The method of payment where relevant, i.e. payment by direct debit, standard credit or
prepayment meter (PPM).
Information on the exact tariff, or the supplier, is not collected in the EHS. The survey does
however collect information on the geographical location of each case and on the method
of payment for metered fuels (i.e. gas and electricity). Therefore, this allows the application
of an average fuel price for each combination of region and method of payment, leading to
the calculation of fuel prices specific to each household.
The process involved is shown as a flowchart in Figure 4.
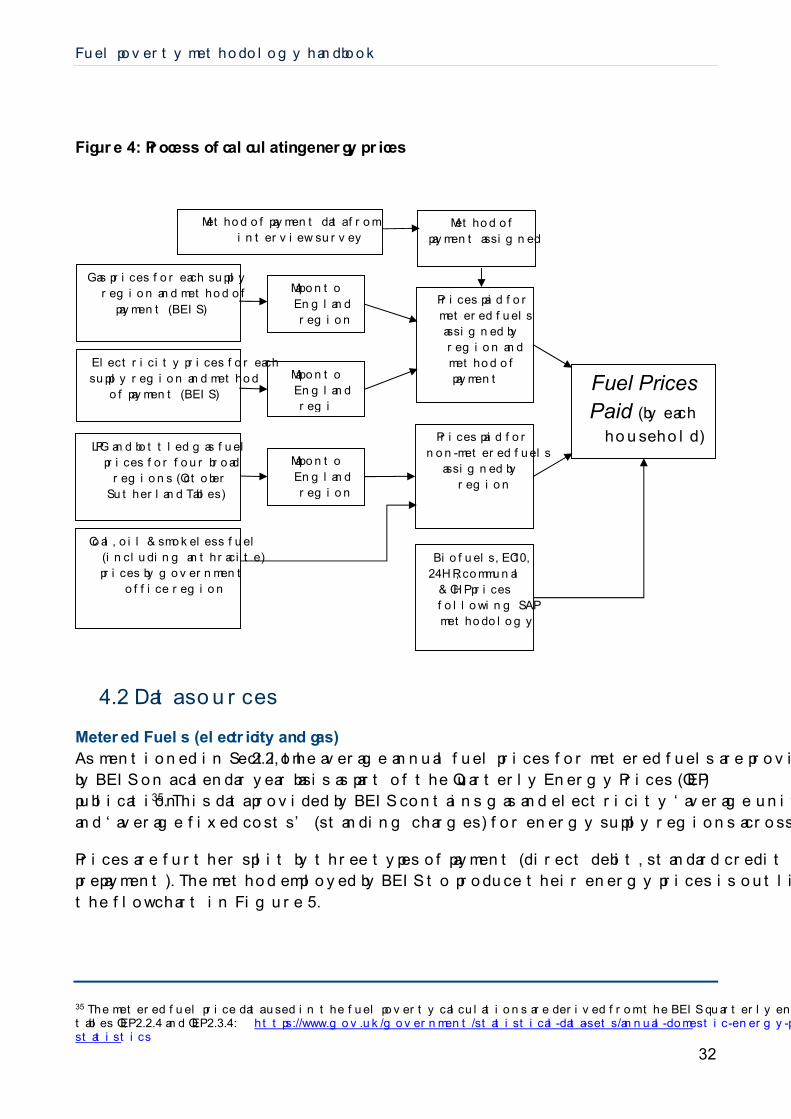
Fuel poverty methodology handbook
32
Figure 4: Process of calculating energy prices
4.2 Data sources
Metered Fuels (electricity and gas)
As mentioned in Section 2.2, the average annual fuel prices for metered fuels are provided
by BEIS on a calendar year basis as part of the Quarterly Energy Prices (QEP)
publication35. This data provided by BEIS contains gas and electricity ‘average unit price’
and ‘average fixed costs’ (standing charges) for energy supply regions across England.
Prices are further split by three types of payment (direct debit, standard credit and
prepayment). The method employed by BEIS to produce their energy prices is outlined in
the flowchart in Figure 5.
35 The metered fuel price data used in the fuel poverty calculations are derived from the BEIS quarterly energy prices, in tables QEP 2.2.4 and QEP 2.3.4: https://www.gov.uk/government/statistical-data-sets/annual-domestic-energy-price-statistics
Map onto
England
region
Map onto
England
region
Electricity prices for each
supply region and method
of payment (BEIS)
LPG and bottled gas fuel
prices for four broad
regions (October
Sutherland Tables)
Prices paid for
metered fuels
assigned by
region and
method of
payment
Prices paid for
non-metered fuels
assigned by
region
Method of
payment assigned
Gas prices for each supply
region and method of
payment (BEIS)
Map onto
England
region
Method of payment data from
interview survey
Coal, oil & smokeless fuel
(including anthracite)
prices by government
office region
Biofuels, EC10,
24HR, communal
& CHP prices
following SAP
methodology
Fuel Prices
Paid (by each
household)

Fuel poverty methodology handbook
33
Figure 5: energy prices methodology used by BEIS to produce the prices used in
the fuel poverty modelling (n.b. the estimates of consumption described in this
flowchart are not used directly in any of the fuel poverty modelling).
An example of this data can be found in
Table 2: Example of electricity average unit price and average fixed costs (standing
charge) in 2018 below36.
36 Annual domestic fuel costs: https://www.gov.uk/government/statistical-data-sets/annual-domestic-energy-price-statistics
Gas and electricity companies submit data on a quarterly
basis of every tariff in every region that they have customers
on. This includes unit prices, split levels, customer
numbers, standing charges and discounts.
Household assumptions of energy requirements
are used for each quarter.
For gas (13,600 kWh/year) assumed levels are:
Q1:40%; Q2: 20%; Q3: 10%; Q4: 30%. For standard electricity (3,600 kWh/year) and economy 7 (6,000 kWh/year): Q1 and Q4 = 30%;
Q2 and Q3 = 20%.
An average annual bill is calculated for each tariff, by
summing the costs for each quarter. This is done using the
assumptions around the consumption for each quarter (see
left).
If data for a tariff is missing in a quarter, for example if the
tariff is new, the bills for the missing quarters are calculated
using the data for the available quarters and the appropriate
energy requirement levels.
For Economy 7 tariffs it is assumed that half of the bill is
charged at the standard unit rate and the remaining half at
the cheaper night rate.
The average annual bill is multiplied by the average
customer numbers for each tariff, to give the annual
revenue.
The annual revenue is summed for each payment type in
each region by type of cost (cost per unit and standing
charge). This is then divided by the number of customers in
the region for that method of payment to give the average
unit costs and average standing charge.

Fuel poverty methodology handbook
34
Table 2: Example of electricity average unit price and average fixed costs (standing charge) in 2018
Non-Metered Fuels
The prices paid for LPG and bottled gas (non-metered fuels) are taken from the
Sutherland Tables37. These are independently produced reports which provide the
average prices paid for fuels, split into four broad geographical regions.
The reports are published quarterly in April, July, October and January. For fuel poverty
calculations the October Sutherland Tables prices of the survey year are used, as this
reflects the time of year of high fuel demand and prices, taking the general methodological
approach to not underestimate fuel costs. The prices produced by Sutherland are taken
from a sample of prices collected over the preceding three months.
Prices for heating oil, coal and smokeless fuel (including anthracite) are currently obtained
from the Consumer Price Index (CPI)38, produced by the Office for National Statistics.
These prices have been split by English region and represent a 12-month average over
the calendar year for each fuel.
Other minor fuels
37 http://www.sutherlandtables.co.uk/ 38 https://data.gov.uk/dataset/consumer_price_indices
Region Credit Direct Debit PPM Direct Debit PPM
East Midlands 0.158 0.148 0.140 74.93 86.62
Eastern 0.163 0.151 0.148 76.15 90.39
London 0.167 0.154 0.139 78.44 99.93
Merseyside & North Wales 0.173 0.160 0.155 80.16 87.88
North East 0.164 0.151 0.153 76.67 71.18
North West 0.161 0.151 0.148 77.28 83.09
South East 0.172 0.157 0.153 76.60 84.14
South West 0.180 0.164 0.158 76.95 91.24
Southern 0.166 0.153 0.148 74.86 89.73
West Midlands 0.165 0.152 0.149 76.85 88.20
Yorkshire 0.161 0.149 0.147 76.49 81.59
97.15
104.23
103.42
103.30
97.79
102.61
101.75
103.36
97.49
Credit
103.42
103.37
Average fixed costs (£/year):Average Unit Price (£/kWh):

Fuel poverty methodology handbook
35
The price of Economy 10 and 24-hour electricity is set as the SAP 2012 prices39, inflated
to 2017 and 2018 prices using the CPI for electricity. The prices of wood and other biofuels
are also based on SAP 2012 prices, which are inflated from 2012 prices using the change
in the CPI for coal from this date. The price of communal heat is calculated using SAP
2012 communal prices, inflated using the Consumer Price Index for gas.
Plausibility checks
Metered and non-metered fuel prices are compared graphically against corresponding
prices for previous years in order to identify any anomalies in prices or unexpected trends
with time. This helps not only in the identification of suspect prices but also in
understanding overall trends in relation to fuel costs and fuel poverty levels,
4.3 Method of payment data
The methods of payment are collected for mains gas and electricity only. Each household
is asked in the interview survey how they pay for their electricity and gas. For each fuel
there is the option of:
(1) Direct debit (including online direct debit);
(2) Payment on receipt of bill by post, telephone, online or at bank/post office;
(3) Standing order;
(4) Prepayment (key card, slot or token) meters;
(5) Included in rent;
(6) Frequent cash payment method (i.e. more frequent than once a month);
(7) Fuel direct/direct from benefits;
(8) Fixed Annual Bill (however much gas/electricity is used) e.g. StayWarm;
(9) Other (Please specify);
(-9) Not applicable;
(-8) Don't know (spontaneous only).
There are more methods of payment collected in the EHS survey than the three methods
of payment attached to the prices provided by BEIS. Therefore, assumptions are made in
order to assign each household a method of payment, and the above categories are
grouped as:
Those stating, ‘direct debit’, ‘included in rent’, ‘fuel direct/direct from benefits’ or ‘fixed
annual bill (e.g. StayWarm)’ are coded as Direct Debit.
39 http://www.bre.co.uk/filelibrary/SAP/2012/SAP-2012_9-92.pdf

Fuel poverty methodology handbook
36
Those stating, ‘payment on receipt of bill’ and ‘frequent cash payment method (more
than once a month)’ are coded as Standard Credit.
Those stating ‘prepayment (key card or token) meters’ are coded as Pre-Payment.
For those coded as ‘other’, and where a written description is provided by the householder,
the most suitable method of payment is imputed for each fuel, matching the written
description to the above criteria, and additional criteria below:
Direct debit for any reference to: ‘Included in rent’ (to include all mentioning ‘paying landlord’, ‘paying employer’, ‘payments to family’), ‘stay warm scheme’ includes direct from benefit, ‘Pay council’, ‘Internet’.
Standard credit for any reference to: ‘Regular monthly payments’, ‘secure homes’, ‘Easypay’, ‘Moneyway’, ‘Cash’, ‘Cheque’.
Pre-payment for any reference to: ‘Payment cards’, ‘coin meters’, ‘gas stamps’, ‘Paypoint payment’.
After this process there may be a small number of cases without a method of payment (i.e. those who have said they don’t know or “other” and where the description is missing or insufficient). For these cases the higher price of the standard credit method of payment is assigned, taking the general methodological approach to not underestimate fuel costs where data is unknown. Where the gas method of payment is NA (i.e. not applicable, no gas), the gas method of payment is nominally assigned to be the same as the electricity method of payment, and a gas price applied accordingly. If no electricity method of payment is present, the gas price is set to the default standard credit. This method ensures that any case which has a discrepancy between the householder response to the method of payment, and the surveyor response to the heating systems (e.g. where a householder says NA (no gas) to method of payment, but the surveyor says there is gas present and being used) allows reconciliation of the data to occur and prices still applied where applicable.
4.4 Mapping the fuel prices of each household
In addition to matching each household to a fuel based on the method of payment, the
household must also be assigned a price based on its location within the country. The
EHS collects information on which of the nine English regions each household is in,
however the English regions do not correspond with the electricity supply regions, gas
distribution zones or Sutherland Table regions.
The fuel prices for each supply/distribution/Sutherland region are matched with the English
region using a geographical matching technique. This is based upon estimates of the
proportion of each English region within each supply region or distribution zone, as shown
in Table 3 and Table 4.
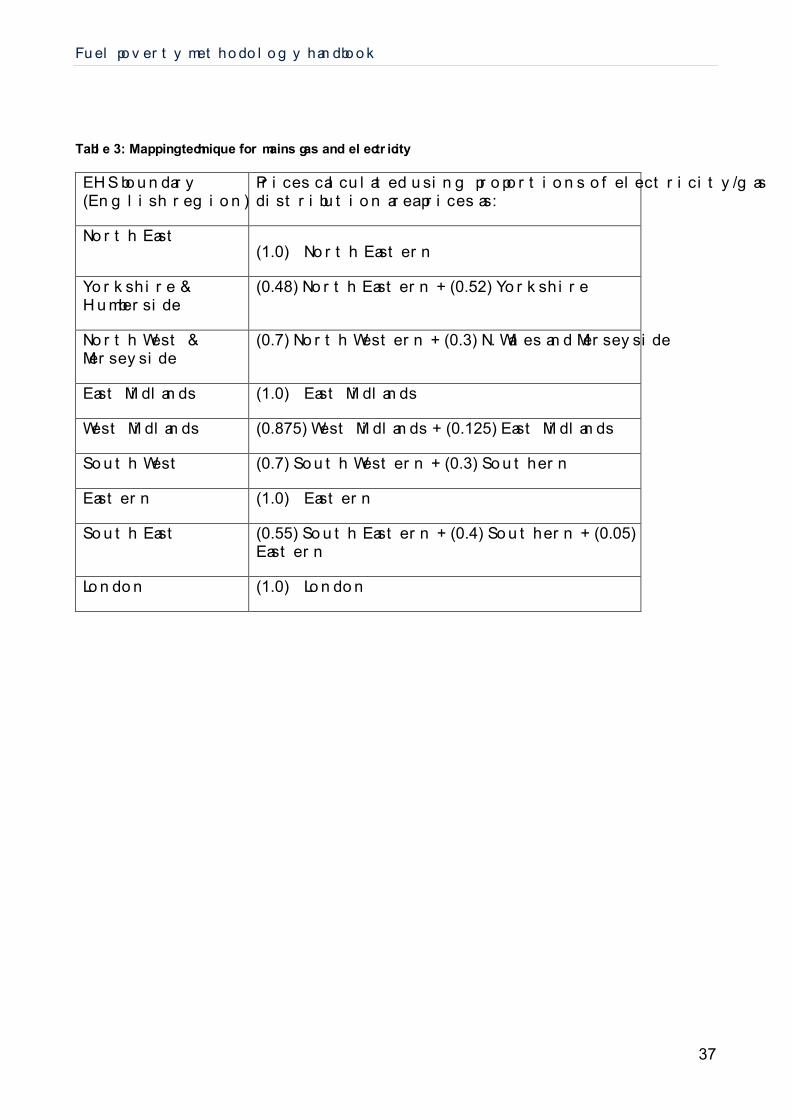
Fuel poverty methodology handbook
37
Table 3: Mapping technique for mains gas and electricity
EHS boundary (English region)
Prices calculated using proportions of electricity/gas distribution area prices as:
North East (1.0) North Eastern
Yorkshire & Humberside
(0.48) North Eastern + (0.52) Yorkshire
North West & Merseyside
(0.7) North Western + (0.3) N. Wales and Merseyside
East Midlands (1.0) East Midlands
West Midlands (0.875) West Midlands + (0.125) East Midlands
South West (0.7) South Western + (0.3) Southern
Eastern (1.0) Eastern
South East (0.55) South Eastern + (0.4) Southern + (0.05) Eastern
London (1.0) London

Fuel poverty methodology handbook
38
Table 4: Mapping methodology for Sutherland tables non-metered fuels
EHS boundary (English region)
Prices calculated using proportions of Non-metered fuel region prices as:
North East
(0.95) Northern England + (0.025) Midlands + (0.025) Wales and South West
Yorkshire & Humberside
North West & Merseyside
East Midlands (0.92) Midlands + (0.08) Northern England
West Midlands
South West (0.97) Wales and South West + (0.03) Midlands
Eastern
(0.95) South East + (0.05) Midlands South East
London
For example, if a household’s English region lies 40% within one supply region and 60%
within another supply region the price applied will be a 40/60 weighted average of the two
prices. This approach assumes a uniform population density across England.
The prices of biofuels, Economy 10 electricity, 24hr electricity, communal from boilers and
communal from Combined Heat and Power (CHP) are calculated on a national scale, so
no regional mapping is necessary. Prices for heating oil, coal and smokeless fuel are
provided by English region and therefore do not require mapping.
4.5 Applying the Warm Homes Discount
The fuel costs are initially calculated without the receipt of Warm Homes Discount (WHD)
applied, as this data is not available to match with the cases in the EHS survey data. It is
important, however, that the WHD policy (and legacy tariffs included prior to 2015) are
accounted for in the fuel poverty statistics. Receipt of WHD will change a household’s
FPEER rating. To achieve this, some final adjustments are made to the dataset which act
to reduce the total fuel costs for those households considered likely to be in receipt of the
WHD. The total number of households modelled to receive the WHD is set to be equal to
the total number of households in receipt of support through these elements of the WHD
scheme, as reported by Ofgem.
Fuel poverty methodology handbook
39
Information on eligibility for each element of the WHD is also provided by Ofgem40 which
allows the modelling of receipt of this discount. There are, however, more households
theoretically eligible for this scheme than actually in receipt of these rebates. Therefore, a
process of repeated sampling from the pool of eligible households, and selection of a
representative iteration is undertaken (i.e. through Monte-Carlo type simulation or similar).
The process of assigning the WHD for the 2018 data is as follows:
a) Details of the number of households in receipt of each component of the WHD (core
group and broader group) are provided by Ofgem.
b) Details of eligibility for each element of the WHD are provided by Ofgem, and flags
are created in the EHS dataset.
c) A series of runs are made, sampling from the pool of eligible households, which
subtracts the WHD cash amount (i.e. £140 for the 2018-19 data) from the final costs
for those in the Core or Broader Groups. The number of households in receipt of
each element of the WHD is used to constrain this modelling.
d) A representative iteration is selected from all runs.
The representative iteration is optimised towards a median position by examining the
variation of each run from the median number of those receiving the rebate by income
decile, tenure, region, age of oldest person in household, method of payment for gas and
vulnerability.
The WHD has been applied for all years from 2011 to 2018.
4.6 Changes in prices methodology
Each year, minor modifications may be made to the fuel poverty fuel price calculation
methodology as a result of improvements in the treatment of missing data, alterations or
additions to fuels used, and updates and changes to the EHS survey questions or other
data sources. In 2018, there were no major changes to the fuel price methodology.
40 https://www.ofgem.gov.uk/environmental-programmes/social-programmes/warm-home-discount-whd

Fuel poverty methodology handbook
40
5. How are household energy requirements calculated?
5.1 Overview
The amount of fuel required to provide the energy needs of each household is one of the
components of fuel poverty and, combined with fuel prices, produces the modelled fuel bill.
Under the fuel poverty definition, the energy required to heat and power a home can be
grouped into four categories:
i) Space heating – Es (GJ);
ii) Water heating – Ew (GJ);
iii) Lights and appliances – ELA (GJ);
iv) Cooking – Ec (GJ).
The Building Research Establishment Domestic Energy Model (BREDEM) methodology41
is used to predict the energy requirements of a household where:
𝑇𝑜𝑡𝑎𝑙 ℎ𝑜𝑢𝑠𝑒ℎ𝑜𝑙𝑑 𝑒𝑛𝑒𝑟𝑔𝑦 𝑟𝑒𝑞𝑢𝑖𝑟𝑒𝑚𝑒𝑛𝑡𝑠 = 𝐸𝑆 + 𝐸𝑊 + 𝐸𝐿𝐴 + 𝐸𝐶
Total household energy requirements include space and water heating (to meet defined
standards), energy for lights and appliances (including requirements for pumps, fans and
electric showers, and energy generated by renewables), and energy for cooking. The
amount of energy required to heat a dwelling will depend on the building’s specifications
such as insulation levels, heating systems, the geographical location of the dwelling, and
construction type. A household’s demand for energy will depend on the number of people
within the household and the lifestyle and habits of these individuals. Information from the
EHS is used to provide details about both dwellings and households. The calculation
process is summarised in Figure 6 below. Reduced Data SAP (RdSAP) assumptions are
used to deal with missing data and can be found in the SAP procedure document42. It
should be noted that the figures now incorporate the revised U-values as published in
RdSAP v9.93.
41 The BREDEM methodology used is described in Henderson J, Hart J, BREDEM 2012 A technical description of the BRE Domestic Energy Model, v1.1, January 2015. http://www.bre.co.uk/filelibrary/bredem/BREDEM-2012-specification.pdf 42 BRE 2017. Appendix S: Reduced Data SAP for existing dwellings, RdSAP 2012 v9.93. https://www.bre.co.uk/filelibrary/SAP/2012/RdSAP-9.93/RdSAP_2012_9.93.pdf

Fuel poverty methodology handbook
41
Figure 6: Calculating household energy requirements and associated fuel costs
5.2 Dimensions calculation for energy requirements
Data from the EHS physical survey are used to calculate the dimensions of the dwelling
and, in particular, the heated volume and heat loss areas. This involves utilising data from
many different modules that relate to different parts of the EHS physical survey form.
The following information is calculated:
Internal and external wall areas;
Roof area;
Room specific floor areas;
Habitable floor area and footprint area43;
Perimeter of building;
Ceiling heights;
Window and door areas;
43 Footprint area is the area of the dwelling in contact with the ground.
BREDEM based energy use for:
Space & water heating, Lights and
Appliances, Cooking
BREDEM based energy use for
each household
Input fuel prices for each household
EHS physical & interview
surveys
Dimensions variables
Default data & RdSAP
assumptions (To deal with
missing data)
Fuel prices paid by each
household (Inc. WHD)
Apply WHD rebate (selected
households)
Fuel poverty methodology fuel costs
for each household

Fuel poverty methodology handbook
42
Number of floors and rooms in a dwelling.
Key variables are the width and depth of the main and additional parts of the dwelling,
which are directly collected in the EHS physical survey. These are used to determine the
area (m2) of each floor. All physical data relating to the dwelling must have a value for the
width and depth of the building to be considered part of the main data set. The EHS survey
form collects the widths and depths of up to three levels, so the dimensions of any further
levels are imputed. They are assumed to be the same size as the floor below, with the
exception of any attics, which are imputed based on the floor area dimensions, and
basements, which are assumed to be the same size as the floor above. In general,
wherever possible, imputations are based on the case in question, not on archetypes or on
the rest of the data set.
Initial consistency and plausibility checks
Ahead of the production of derived dimensions variables, a period of raw data input
validation takes place. The internal integrity and the consistency of the data is checked.
The purpose of these checks is to firstly detect and eliminate certain logical
inconsistencies that would cause problems for modelling, and secondly to identify highly
implausible answers which, if deemed necessary, are corrected. Where a conflict exists,
these investigations take the form of inspection of all relevant data items by an analyst and
a judgement being drawn on the most appropriate course of action for each case. In some
cases, the raw EHS physical survey data is altered following these consistency and
plausibility checks.
Checks include:
Levels checks – data may be inconsistent with regard to the number of storeys in the
building, and the floor occupied by the dwelling. The following possible errors are:
A room on a level that does not exist (e.g. 3rd floor of a three-storey module);
A room on a level that is not part of the flat (e.g. room on the 3rd floor but flat on the
2nd floor);
A measured level that is not part of the module (e.g. dimensions for 3rd floor when
the dwelling only has three storeys);
A flat on a level that does not exist (e.g. flat on the 3rd floor when the module only
has three storeys);
Cross checks for presence of a habitable attic/basement and number of floors.
Plausible dimensions – statistical range checks are carried out on the dimensions, to
identify any floor area that seems too large or too small for the number of rooms.
Non permissible values – if a dimension is equal to a value that is reserved for special
purposes in the EHS coding scheme. The numbers 77, 88 and 99 are reserved to indicate

Fuel poverty methodology handbook
43
the section not applicable, question not applicable, or unknown. When investigation
suggests these figures occur as real measurements, they are reduced by one.
Incorrect number of flats – the dimensions of the surveyed flat are checked against the
total floor area of the survey module to identify if the number of flats per module seems
realistic.
Incorrect roof type – in the EHS, certain roof types (chalet and mansard) can only be
defined where the dwelling has an attic. On occasions, surveyors may mistake steep
pitched roofs for chalet roofs. In this situation, the data for pitched and chalet roofs is
swapped over.
Implausible wall and window areas – where a dwelling seems to have a wall or window
area that is too high or too low the data is checked.
Wall thickness – cases are identified and checked where the wall thickness as measured
by the EHS surveyor is not typical of the wall selected.
Heating system consistency checks – where cases contain inconsistent heating system
data on the EHS physical survey the data is checked.
Dimensions variables for use in fuel poverty energy modelling
Due to the complexity in producing dwelling dimensions, a specific derived file is produced
within the EHS called: Dimensions.sav, and provides additional data on dwelling
dimensions44. The dimensions derived data file is available to researchers on request
under the EHS Special Licence (SL) through the UK Data Service45 following publication of
the EHS Annual Reports. Users are strongly advised to use these dimensions for any
secondary analysis.
Details of the derived dimensions variables are provided below. All variables in this file are
described in detail in the EHS data dictionary which can be obtained from the UK data
service. Users are recommended to refer to this when using the Dimensions.sav file. All
EHS raw data files mentioned in this section are also available under the EHS Special
Licence (SL) through the UK Data Service.
Floor area
The EHS records the external dimensions, and these dimensions are converted to internal
ones using the wall thickness46, to calculate a floor area at each level.
Party walls are considered to have a thickness of 0.125m, which is derived by dividing the
average wall thickness for the EHS stock by two. The area of each floor consists of the
44 Note that the Dimensions.sav file now includes variables previously found on the EnergyDims.sav file. 45 https://ukdataservice.ac.uk/ 46 Thickness of walls was measured for the first time in the 2013 EHS.

Fuel poverty methodology handbook
44
main part, additional part and the join between the two. The floor area of conservatories
with no separating door are also included (taken from page 16 of the EHS form).
For fuel poverty modelling, the floor area variable to be used is the banded variable
FloorArea, which is available to researchers on request under the Fuel Poverty Special
Licence (SL) through the UK Data Service. Note, that the variable “Energy floor area” on
the derived EHS Special Licence Dimensions.sav file should not be used for this purpose.
Storey heights
Data on storey heights (floor to ceiling distance) is collected on page 3 of the EHS form47
and can be found in the interior.sav raw data file. Following the data consistency,
plausibility and integrity checks, derived storey heights for each level are produced by
taking the mean of the ceiling heights on each level. These are included in the
Dimensions.sav derived file and are defined in the data dictionary.
Wall areas
Following the data consistency, plausibility and integrity checks, derived wall areas are
produced. Wall areas for houses are determined from page 13 of the EHS form and can
be found in the shape.sav raw data file.
Gross areas (inclusive of openings) are obtained by multiplying the internal dimensions of
each floor by the storey height. Assumptions based on the RdSAP methodology for inter-
floor thickness are applied so that 0.25m is added to each storey height except the lowest.
Basements are included in the wall area, however, a storey containing a room in the roof is
not (RdSAP has a separate methodology for modelling rooms in the roof, which is used
instead).
The party wall area of each face is calculated by taking the fraction of the gross area that
is recorded as attached. This information is collected on page 14 of the EHS form and can
be found in the elevate.sav raw data file. The exposed wall area of each face is calculated
by removing the party wall area, window and door area from the gross wall area. The
same procedure is followed for flats with dimensions that are not the same as the module,
except information is used from page 9 of the EHS form (flatdets.sav). The variables
relating to the fraction of wall “to outside air” and fraction of wall “to internal accessways”
are used to determine the exposed and semi-exposed wall areas respectively. For flats
with dimensions the same as the module, the wall area for the whole module is calculated
as described above for houses, using data from page 13 of the EHS form. This is then
divided by the number of flats, factoring in if there is any non-residential use in the module.
This information is collected on page 11 of the EHS form and can be found in the
47 e.g. https://www.gov.uk/government/publications/english-housing-survey-2016-to-2017-questionnaire-and-physical-
survey-form and subsequent years

Fuel poverty methodology handbook
45
numflats.sav raw data file. Flats wholly within a room in the roof are treated as timber
framed dwellings according to RdSAP procedures.
Derived wall areas for the module are included on the Dimensions.sav derived file but
need to be adjusted to remove the area of wall at ceiling height on the top floor and
converted to internal dimensions for the purpose of BREDEM fuel poverty modelling.
Door areas
The area of external doors is not directly collected as part of the EHS, but the number of
external doors is collected on page 17 of the EHS form and can be found in the doors.sav
raw data file. For the purposes of BREDEM fuel poverty energy modelling, it is assumed
that all external doors are of area 1.85 m2 which is the standard RdSAP assumption.
Window areas
Window areas for houses are calculated by taking the fraction of gross wall area that the
surveyor records as fenestration (windows + doors) and then subtracting the door area.
This information is collected on page 14 of the EHS form and found in the elevate.sav raw
data file. In the case of flats, the window area (m2) can be taken directly from page 9 of
the EHS form and can be found in the flatdets.sav raw data file. The fenestration area is
produced in the Dimensions.sav derived file. The age of the windows is collected on page
17 of the EHS form and can be found in the windows.sav raw data file. It is used to
determine whether the double glazed windows are assigned a pre-2003 or post-2003 U-
value.
Roof area
The roof area is taken as the floor area of the largest storey, unless there is a room in the
roof in which case RdSAP assumptions are applied.
5.3 Dwelling energy requirements
The calculation of energy requirements for fuel poverty uses information from the raw
physical and interview survey files, along with the derived EHS datasets Physical.sav,
Interview.sav and Dimensions.sav. These files are available to researchers on request
under the EHS Special Licence (SL) through the UK Data Service48 following publication of
the EHS Annual Reports. The data is used to derive the following:
Heat loss due to conduction from all the external house structure to the external
environment, for example heat lost through the walls or roof (fabric heat losses);
Heat gain from solar fluxes and other gains such as from lights, appliances and
occupants;
Heat loss due to ventilation;
48 https://ukdataservice.ac.uk/

Fuel poverty methodology handbook
46
Energy required for space and water heating systems;
Heating regime of the inhabitants (when and to what extent they heat their home);
Energy required for lights, appliances and cooking;
Energy generated from renewable technologies (photovoltaics, solar hot water and
micro generation wind turbines).
This information is calculated using data collected from the interview and physical surveys,
as outlined in sections 5.4 to 5.9.
5.4 Information used in the calculation of fabric heat losses
Fabric heat loss is calculated for the dwelling using information on each of the external
building elements (e.g. wall, floor, roof, windows, doors) and details of thermal bridging.
U-values
The rate of heat loss through each element is calculated by multiplying the element area
by the U-value of the material that the element is constructed from. The U-value is a
measure of the effectiveness of a material as a heat conductor. U-values of external
elements are assigned according to the actual construction date of the property, as
recorded in the firstimp.sav file. These are matched to the RdSAP default U-values.
Where the age of individual elements is different from the age of the dwelling, U-values are
assigned in line with RdSAP defaults by subtracting the age of the element (as reported on
the EHS) from the whole-year date of the EHS single survey year. For example, a window
identified as 10 years old in the EHS survey year which ran between April 2015 and March
2016 (the ‘2015 EHS single year’) is considered for the purposes of the fuel poverty
modelling to date from 2005 (i.e. 2015 – 10 = 2005). This remains the case if the actual
survey took place in the first three months of 2016.
If the main wall type is predominantly cavity (≥50%) then a party wall U-value of
0.25 W/m2K is assumed for houses and flats with dimensions that are the same as the
module, otherwise, no heat loss is assumed for the party wall. Access corridors are
assumed to be unheated and an adjustment factor, for the thermal resistance of 0.4
m2K/W, is applied to the U-values of walls adjacent to these areas.
Non-repeating thermal bridging
For the purposes of fuel poverty BREDEM modelling, the effect of non-repeating thermal
bridges is taken into account. The heat loss rate for non-repeating thermal bridges is
calculated in line with table S13 of RdSAP for dwellings of different ages.
Fuel poverty methodology handbook
47
5.5 Identification of space and water heating systems
All data of relevance to the identification and use of space heating systems in fuel poverty
modelling can be located in the derived EHS Physical.sav file and EHS raw data
services.sav file. For the purposes of secondary analysis, users are strongly
recommended to use the derived Physical.sav variables where possible. They should also
refer to the detailed documentation of these variables as provided in the Physical.sav data
dictionary available from the UK Data Service.
The type and characteristics of the space and water heating systems present in the
dwelling are collected on pages 5, 6 and 7 of the EHS form. In particular, these pages
collect data on:
Mains gas and electricity connections;
Primary space heating system type and fuels;
Boiler names and models;
Heat distribution systems;
Heating controls;
Secondary heating system type and fuels;
Water heating systems types and systems; and
Hot water tank presence and levels of insulation.
Two types of space heating system are defined and used in the BREDEM modelling: main
heating and secondary heating. In addition, one water heating system is defined. The
method of determining these systems from the EHS data are described below.
Main heating
Information relating to the heating systems assigned for each dwelling is taken directly
from the EHS physical survey. The primary heating group, fuel and type are essential for
the allocation of the primary heating system and the calculation of energy use for each
household.
When an EHS surveyor first inspects the heating systems in a dwelling, they are required
to identify firstly whether there is any system which can be considered a “Primary System”
and then to identify what this system is. A primary heating system is a system which
provides heat to more than one room. Where multiple systems exist, the primary system is
the one in the main living room. The vast majority of dwellings contain a primary heating
system and this is recorded on the page 6 of the EHS form. Where a primary heating
system is identified by a surveyor, details about the primary heating system are used as
the main heating system within the BREDEM modelling. In cases where primary data are
missing for the heating systems, information from ‘other heating’ (secondary heating) is
used in its place according to the SAP methodology.

Fuel poverty methodology handbook
48
The surveyor records:
Primary heating group (e.g. central heating, storage radiators);
Primary heating type (e.g. boiler type);
Primary heating code (a three digit coding system that allows more details such as
type of flue to be recorded);
Primary heating fuel;
Primary system age;
Boiler name and model information (if applicable);
Distribution type (radiators or underfloor); and
Details about primary heating controls.
The initial source for information about the type of heating system is the boiler name and
model. The boiler model is searched for in the Product Characteristics Database (PCDB)49
of efficiencies, and where a match is found, details on the boiler efficiency and flue type
are used within the BREDEM modelling. For combination boilers, additional information is
extracted from the PCDB for use in the modelling where available, such as combi loss
factors, keep-hot information and storage details (if the system is a storage combi).
Following requests from users, a flag indicating a successful match with the PCDB, and
the assumed efficiency are included as part of the Special Licence fuel poverty dataset,
which researchers can obtain through the UK Data Service for 2014 data onwards.
Where no match can be found or these data are missing, the Primary heating code is used
to define the type of heating system. If the Primary heating code is insufficient to define the
system the Primary heating type fuel, and age are determined from these items on the
EHS form. The type of heating system is then used to determine the default efficiencies via
a lookup table of heating system efficiencies in SAP.
Secondary heating
Surveyors are also asked whether there is an “other” heating system within the home. This
is recorded as the system in the main living room, where present, otherwise it is the
system in any other room. The data on these systems is recorded on page 6 of the EHS
form. The type of system recorded as “other” heating is taken as the secondary heating
system in the home. SAP defaults for each type of system provide the data on the relative
efficiencies of each system. Where no “other” system is indicated the BREDEM calculation
uses the primary heating system only. According to SAP rules, storage heaters require a
secondary heating system so if a secondary heating system is not already recorded,
electric room heaters are added.
49 http://www.ncm-pcdb.org.uk/sap/

Fuel poverty methodology handbook
49
Water heating
Information relating to the presence and specification of the water heating system is also
obtained from the EHS physical survey. Water heating systems are identified on page 7 of
the EHS form.
The EHS surveyors are able to specify and list the various water heating systems present
in the dwelling. Only one of these systems is taken forward into the BREDEM modelling. In
the case of multiple systems, the order of system preference is:
Boiler with central heating;
Boiler for water heating only;
Back boiler;
Communal;
Single immersion;
Dual immersion;
Single point instantaneous;
Multi point instantaneous50; and
Other.
Data on the cylinder dimensions and insulation (where present) and water heating controls
are also collected on page 7 of the EHS form and affect the water heating efficiency and
water heating energy requirement. Where the system is with the central heating system,
the data on the main heating system is used for the calculation of water heating system
efficiency.
In BREDEM 2012 the water heating demand is a function of the number of showers and
baths taken per day, as well as the type of shower. The specific rules applied for
calculating water heating from EHS data are as follows:
If the dwelling has two water heating systems, a main and an electric instantaneous,
an electric shower is assumed
If the dwelling has a combi boiler then set the shower type to Mixer (combi)
Otherwise assume shower type is Mixer (not combi).
5.6 Space heating assumptions and definition of heating regime
The amount of energy required for space heating is estimated using the BREDEM
algorithm using information on the space heating systems (Section 5.5), applied insulation,
dwelling construction and materials, in addition to the external climate conditions and
acceptable level of heating.
50 If there is an instantaneous water heater and another water heating system, it is assumed that the instant heater is an electric shower

Fuel poverty methodology handbook
50
The external conditions are determined for the geographic location of the dwelling and
time of year. The acceptable level of heating is defined in terms of the demand
temperature of a dwelling, the extent to which the dwelling space is heated, and the
number of hours that the occupants heat the house for (the heating regime). These are
described below.
Geographical Location
BREDEM defines twelve geographical regions for England. These BREDEM regions
define monthly average climatic conditions such as temperature, solar flux (i.e. heat gains
from the sun) and wind-speed. Each dwelling in the EHS has a geographical identifier that
can be used to determine in which BREDEM region the property is located.
Demand Temperature
BREDEM suggests that (generally) a house can be split into three distinct zones: a
primary heated zone, secondary heated zone and unheated zone. For the modelling of
fuel poverty, the demand temperature of all dwellings within the primary zone is assumed
to be 21°C, the secondary zone is assumed to be heated to 18°C and the temperature of
the unheated zone relates to the external temperature and therefore varies depending on
the local climatic conditions.
Extent of Heating/under-occupancy
Some dwellings are considered excessive in size for the number of occupants that live
there. In these cases, the house is assumed to be “under-occupied”, and that only a
proportion of the dwelling will need heating. For a dwelling to be considered under-
occupied it must fulfil criteria that depend on both the number of bedrooms in a dwelling
and the total floor area of the dwelling. These criteria are described in more detail below.
A dwelling is considered to have surplus bedrooms if there are one or more extra
bedrooms than required for homes without dependent children (children under 18 years),
or there are two or more extra bedrooms than required for homes with dependent children.
A separate bedroom is allowed for each married or cohabiting couple, any other person
aged 16 or over, each pair of adolescents aged 10-15 of the same sex, and each pair of
children under 10. Any unpaired person aged 10-15 is notionally paired, if possible, with a
child under 10 of the same sex, or, if that is not possible, he or she is counted as requiring
a separate bedroom, as is any unpaired child under 10.
There is considered to be surplus floor area in a property if the floor area of the property is
over double that considered to be the “standard” living area required for the number of
occupants, as defined by the Parker-Morris Standard51. This standard is defined as in
Table 5 below.
51 “Homes for today and tomorrow”, Department of the Environment, HMSO 1961.

Fuel poverty methodology handbook
51
Table 5: Parker Morris Standard
Occupants Standard living area required (m2)
1 33.0
2 48.5
3 61.0
4 79.0
5 89.5
6 97.0
7 114.5
8 128.0
9 140.0
For the purposes of fuel poverty, a dwelling is considered to be under-occupied if there are
both surplus bedrooms and surplus floor area.
If a dwelling is under-occupied then it is assumed that exactly half of the dwelling is
heated, that is:
𝐴ℎ𝑒𝑎𝑡𝑒𝑑 = 0.5 ∗ 𝐴
Where A is the total floor area of the dwelling.
The remaining space is declared as a BREDEM unheated space. Because under-
occupying households will always live in large dwellings (to be classed as under-occupying
the floor area must be large), Zone 1 (living area) is assumed to be fully heated under this
methodology. This will result in the area of Zone 2 that is heated being reduced for all
under-occupying households. The proportion of Zone 2 that is heated can be calculated as
follows:
𝐴𝑟𝑒𝑎 𝑜𝑓 𝑍𝑜𝑛𝑒 1 = 𝑍1
𝐴𝑟𝑒𝑎 𝑜𝑓 𝑍𝑜𝑛𝑒 2 = 𝑍2
𝑈𝑛ℎ𝑒𝑎𝑡𝑒𝑑 𝑍𝑜𝑛𝑒 2 𝑎𝑟𝑒𝑎 𝑓𝑜𝑟 𝑢𝑛𝑑𝑒𝑟 − 𝑜𝑐𝑐𝑢𝑝𝑎𝑛𝑐𝑦 = (𝑍1 + 𝑍2) / 2
𝐻𝑒𝑎𝑡𝑒𝑑 𝑍𝑜𝑛𝑒 2 𝑎𝑟𝑒𝑎 𝑓𝑜𝑟 𝑢𝑛𝑑𝑒𝑟 − 𝑜𝑐𝑐𝑢𝑝𝑎𝑛𝑐𝑦 = 𝑍2 − (𝑍1 + 𝑍2) / 2
𝑃𝑟𝑜𝑝𝑜𝑟𝑡𝑖𝑜𝑛 𝑜𝑓 𝑍𝑜𝑛𝑒 2 ℎ𝑒𝑎𝑡𝑒𝑑 = (𝑍2 − (𝑍1 + 𝑍2) / 2) / 𝑍2
Heating Season
The heating season is defined as the months of October to May, in line with the SAP
methodology.

Fuel poverty methodology handbook
52
Heating Regimes
A standard heating regime assumes that the occupants are not occupying the dwelling
during normal working hours. In this case it is assumed that the occupant heats the
dwelling for two hours first thing in the morning and then for seven hours from late
afternoon. During the weekend it is assumed that the property is heated throughout the
day for 16 hours. The SAP methodology also makes this assumption to calculate the
energy requirements in a dwelling.
This heating pattern does not apply for large sectors of the population, in particular the
vulnerable such as the elderly and those caring for young children. The EHS interview
survey includes a direct question on whether anybody within the household occupies the
dwelling during the morning or afternoon in the winter. This question is directly utilised to
approximate the heating pattern. If anybody is in the house in either the morning or
afternoon during weekdays, the house is assumed to require all day heating. In these
cases, all day heating is assumed throughout the week as well as the weekend.
In dwellings that are under-occupied, it is assumed that some of the rooms in the dwelling
are not heated and a “half-house” heating regime is applied. For example, where a single
person occupies a four-bedroom house, it would be assumed that some of the bedrooms
are not heated.
The following heating regimes are defined and used to calculate the energy requirements
of a household:
Table 6: The standard heating regime for the fuel poverty heating calculations
Details of STANDARD heating regime
Heating Pattern Weekday 9 hours of heating Weekend 16 hours of heating
Heating Extent Whole house
Demand Temperature
Primary living zone 21°C Secondary living zone 18°C
Table 7: The full heating regime for the fuel poverty heating calculations
Details of FULL heating regime
Heating Pattern Weekday 16 hours of heating Weekend 16 hours of heating
Heating Extent Whole house
Demand Temperature
Primary living zone 21°C Secondary living zone 18°C
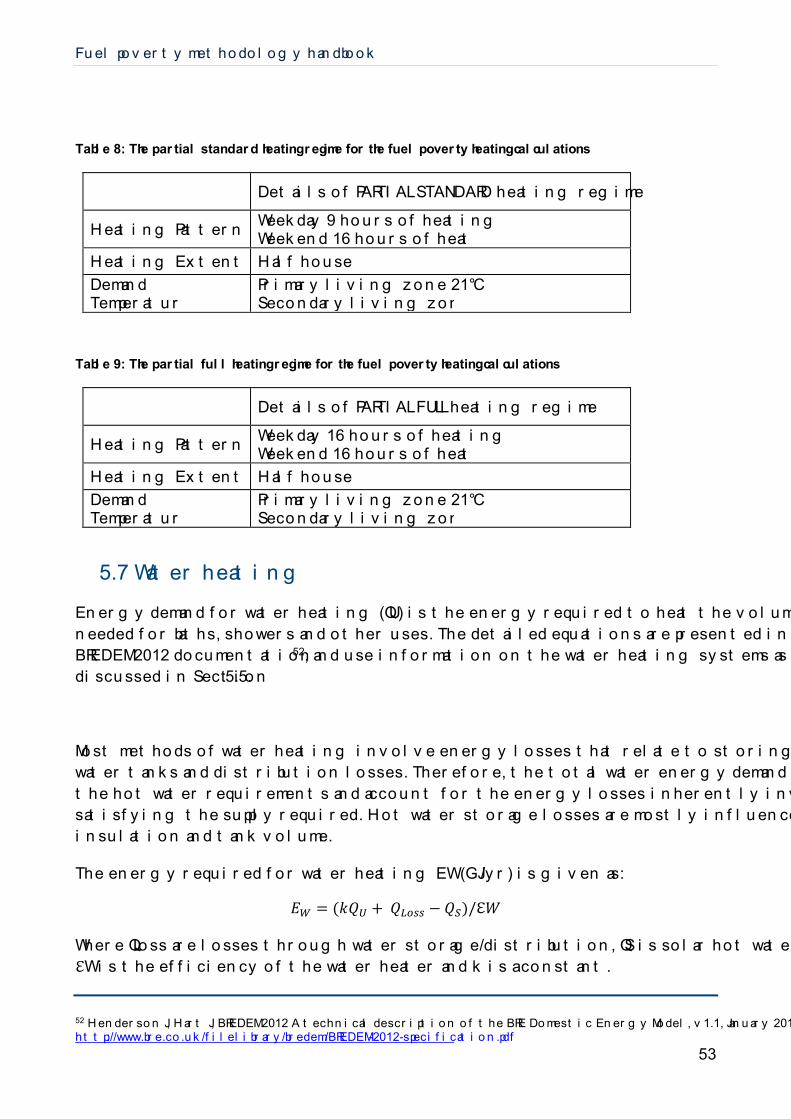
Fuel poverty methodology handbook
53
Table 8: The partial standard heating regime for the fuel poverty heating calculations
Details of PARTIAL STANDARD heating regime
Heating Pattern Weekday 9 hours of heating Weekend 16 hours of heating
Heating Extent Half house
Demand Temperature
Primary living zone 21°C Secondary living zone 18°C
Table 9: The partial full heating regime for the fuel poverty heating calculations
Details of PARTIAL FULL heating regime
Heating Pattern Weekday 16 hours of heating Weekend 16 hours of heating
Heating Extent Half house
Demand Temperature
Primary living zone 21°C Secondary living zone 18°C
5.7 Water heating
Energy demand for water heating (QU) is the energy required to heat the volume of water
needed for baths, showers and other uses. The detailed equations are presented in the
BREDEM 2012 documentation52, and use information on the water heating systems as
discussed in Section 5.5.
Most methods of water heating involve energy losses that relate to storing the water in hot
water tanks and distribution losses. Therefore, the total water energy demand must satisfy
the hot water requirements and account for the energy losses inherently involved in
satisfying the supply required. Hot water storage losses are mostly influenced by tank
insulation and tank volume.
The energy required for water heating EW (GJ/yr) is given as:
𝐸𝑊 = (𝑘𝑄𝑈 + 𝑄𝐿𝑜𝑠𝑠 − 𝑄𝑆)/ℇ𝑊
Where QLoss are losses through water storage/distribution, QS is solar hot water heating,
ℇW is the efficiency of the water heater and k is a constant.
52 Henderson J, Hart J, BREDEM 2012 A technical description of the BRE Domestic Energy Model, v1.1, January 2015, http://www.bre.co.uk/filelibrary/bredem/BREDEM-2012-specification.pdf

Fuel poverty methodology handbook
54
5.8 Lights and appliance requirements
Energy demand for electricity ELA (GJ/yr) includes lights, appliances, pumps, fans and
electric showers, less the household electricity generated by renewable electricity sources
such as photovoltaics and wind turbines (where applicable). The algorithm for lighting
energy requirements includes provision for low energy lighting. The full equations can be
found on page 6 of the BREDEM 2012 documentation51.
5.9 Cooking energy requirements
Energy demand for cooking is given as EK (GJ/yr) and is a function of household size:
𝐸𝐶 = 𝑓𝑔𝑎𝑠(1.7316 + 0.3456𝑁) + 𝑓𝑒𝑙𝑒𝑐𝑡𝑟𝑖𝑐𝑖𝑡𝑦(0.990 + 0.1198𝑁)
Where fgas and felectricity are the proportions of demand satisfied from gas or electric
cooking, respectively, and N is the number of people in the household. The full equations
can be found on page 6 of the BREDEM 2012 documentation.
Several types of cookers can be modelled in BREDEM 2012, but data on cooker type is
not collected in the EHS. For the fuel poverty modelling, if the dwelling is fully electric it is
assumed that a normal sized electric cooker is in use. Otherwise it is assumed that a
normal sized gas/electric cooker is in use. Therefore:
Where a gas connection is present (i.e. a gas meter is identified by the surveyor), but
no gas space or water heating appliances are present, it is assumed that the gas
connection is not in use. In these cases 100% of energy demand for cooking is
assumed to be met by electricity. No gas standing charge will be applied in the final
calculation of fuel cost.
Where both gas and electricity are present in a dwelling it is assumed that the
proportion of gas and electrical energy demanded for cooking is split equally.
Consequently, in this case fgas =0.5 and felectricity =0.5.
5.10 Total fuel costs
Total energy requirements are given as:
𝑇𝑜𝑡𝑎𝑙 𝑒𝑛𝑒𝑟𝑔𝑦 𝑟𝑒𝑞𝑢𝑖𝑟𝑒𝑚𝑒𝑛𝑡𝑠 (𝐺𝐽/𝑦𝑟) = 𝐸𝑆 + 𝐸𝑊 + 𝐸𝐿𝐴 + 𝐸𝐶
Where:
ES: Energy for space heating;
EW: Energy for water heating;

Fuel poverty methodology handbook
55
ELA: Energy required for lights and appliances;
EC: Energy required for cooking.
The fuel cost for each energy component is calculated by multiplying the total number of
units required under each of the components by the unit cost for the fuel used and adding
the appropriate standing charge. Each survey case is unique, with the appropriate fuel
prices being applied based on the type of fuel given for each component of energy use.
The total fuel cost is the sum of the fuel cost for each component:
𝑇𝑜𝑡𝑎𝑙 𝑒𝑛𝑒𝑟𝑔𝑦 𝑐𝑜𝑠𝑡 (£) = £𝑆 + £𝑊 + £𝐿𝐴 + £𝑐
Where:
£S: Fuel cost for space heating (including standing charges where appropriate);
£W: Fuel cost for water heating;
£LA: Fuel cost for lights and appliances (including standing charges and Warm
Homes Discount);
£C: Fuel cost for cooking.
In the fuel poverty datasets, standing charges are assigned to the most appropriate
component of fuel cost as follows:
Fuel cost for space heating (£S) includes cost of space heating (units consumed multiplied
by unit cost) and:
The gas standing charge if gas is present;
Standing charges associated with communal systems or other fuels;
Standing charges from off-peak electricity tariffs, above the standard rate charge.
Fuel cost for lights and appliances (£LA) includes the cost of lights and appliances (units
consumed multiplied by unit cost) and:
The standard electricity charge, not related specifically to heating;
The Warm Homes Discount rebate if applicable.
Due to the simplified way of assigning standing charges to the fuel costs, this may result in
a few cases where a standing charge is assigned to space heating despite the fuel not
being used in this way. For example, households with a gas space heating cost but no gas
space heating usage can be due to the standing charge allocated to the space heating
costs arising from a gas-based water heating system. Households with an off peak electric
tariff, which do not use electricity for their space heating, can also show this type of
anomaly. These cases are, however, rare and this method of assigning standing charges
is done to simplify the dataset.

Fuel poverty methodology handbook
56
5.11 Handling missing values
Alteration to the dwelling data
When performing detailed checks on the outputs, there are cases that are flagged where
values recorded on the physical survey form are deemed implausible and require
alteration to the raw data within the energy modelling process. Each case is assessed on a
case-by-case basis using other information from the survey form in order to apply the
appropriate action for the data to be processed correctly.
Missing dwelling data
Most of the data required to calculate the energy requirements of the household are
available from the EHS survey. Where there are missing data items, these are dealt with in
accordance with RdSAP assumptions for existing buildings as specified in Appendix S53 of
the SAP 2012 booklet. The exception is where data for loft insulation is missing and the
occupant has access to the loft space. Loft insulation is assigned using the mean value for
dwellings of that age and tenure using what is referred to as ‘default data’. This data is
constructed using national averages from the EHS.
Missing household data
The number of occupants living in a dwelling and the composition of the household is
provided in the interview survey. Data are required for each individual household. If this
information is not available then the property is considered to be vacant – vacant dwellings
are not included in fuel poverty calculations, therefore, the combined (paired) sample in
the EHS dataset compared to the combined (paired) sample in the Fuel Poverty dataset
will not be identical.
Validation
Validation of the energy requirements and cost outputs is an important process in the
delivery of reliable results. The level of validation applied will depend on the level of
accuracy quoted, the significance of the indicator, the type of result quoted and the
resource provided for the task. Several layers of data validation are applied to the fuel
poverty energy use and cost variables. These include cross checking from an independent
member of staff, time series analysis, interrogation of important metrics, and comparing
results against external data sources such as the Digest of UK Energy Statistics
(DUKES)54.
Outliers
Outlying cases are identified in the data and validated to ensure that the data modelling
processes are being performed correctly. In rare cases where the data are deemed to
require modification, the fuel costs are imputed based on the median value from a group
53 https://www.bre.co.uk/sap2012/ 54 DUKES, Digest of United Kingdom Energy Statistics: https://www.gov.uk/government/organisations/department-ofenergy-climate-change/series/digest-of-uk-energy-statistics-dukes

Fuel poverty methodology handbook
57
with similar characteristics (grouped according to dwelling type and main heating fuel
category).
5.12 BREDEM versions
BREDEM is the calculation procedure used for modelling energy requirements in dwellings
for fuel poverty. It was first developed in the early 1980s and has been continuously
updated as a result of changes to our understanding of dwelling energy requirements and
the use of energy in the national housing stocks.
The latest version of BREDEM 2012, version 1.155, is used for both years in the combined
2017 and 2018 datasets and trends data. All years in the timeseries also use U-value and
other default assumptions from the latest version of RdSAP (version 9.93). These data
are, therefore, produced on as comparable a methodology as possible to allow
comparison between years and assist interpretation.
5.13 Changes in energy modelling methodology
Each year, minor modifications may be made to the fuel poverty energy modelling
calculations as a result of improvements in the treatment of the data, changes to the
modelling methodology, and alterations to the EHS physical survey data collection. In
some years more major methodology changes have been implemented.
Incorporation of RdSAP 9.93 U-value (2016 dataset)
U-values for solid brick, stone, system build and cavity walls have been updated in
timeseries data to reflect the updated U-values in version 9.93 of the RdSAP procedure
document. Overall, this had a minor effect on energy requirements at a stock level, as
energy reductions in dwellings with wall types that received an improved (lower) U-value
were offset by the increased energy demand in dwellings which received a higher wall U-
value under new RdSAP assumptions
Pumps and fans methodology update (2018 dataset)
The methodology for calculating energy use from pumps, flues and fans was updated for
the 2018 (single year) half of the dataset to align with the RdSAP methodology. The
principal change was a switch from external observations (e.g. chimneys) to internal (e.g.
open fireplaces). Analysis indicates that this change will have increased the mean SAP
ratings of the stock as a whole by approximately 0.3 SAP points (measured using the
combined year datasets).
55 Henderson J, Hart J, BREDEM 2012 A technical description of the BRE Domestic Energy Model, v1.1, January 2015, http://www.bre.co.uk/filelibrary/bredem/BREDEM-2012-specification.pdf

Fuel poverty methodology handbook
58
6. Calculating fuel poverty under Low Income High Costs (LIHC)
This chapter describes the method used to identify households living in fuel poverty under
the Low Income High Costs (LIHC) indicator. Under this indicator, households are
considered to be fuel poor if:
they have required fuel costs that are above average (the national median level); and
were they to spend that amount, they would be left with a residual income below the
official poverty line.
The depth of fuel poverty is defined as the amount by which the assessed energy
requirements of fuel poor households exceed the threshold for reasonable costs. This is
referred to as the fuel poverty gap. Figure 9 shows the four possible groups a household
can fall into under this indicator.
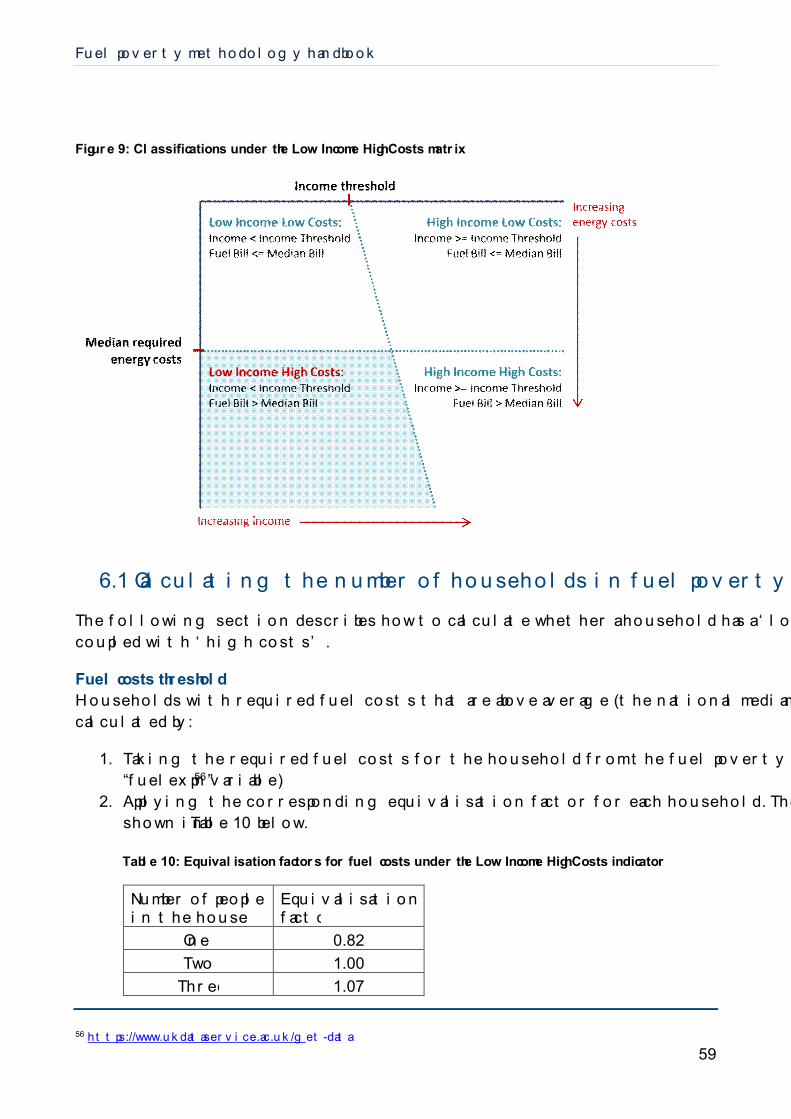
Fuel poverty methodology handbook
59
Figure 9: Classifications under the Low Income High Costs matrix
6.1 Calculating the number of households in fuel poverty
The following section describes how to calculate whether a household has a ‘low income’
coupled with ‘high costs’.
Fuel costs threshold
Households with required fuel costs that are above average (the national median level) are
calculated by:
1. Taking the required fuel costs for the household from the fuel poverty dataset (the
“fuelexpn”56 variable)
2. Applying the corresponding equivalisation factor for each household. These are
shown in Table 10 below.
Table 10: Equivalisation factors for fuel costs under the Low Income High Costs indicator
Number of people in the household
Equivalisation factor
One 0.82
Two 1.00
Three 1.07
56 https://www.ukdataservice.ac.uk/get-data

Fuel poverty methodology handbook
60
Four 1.21
Five or more 1.32
The fuel costs equivalisation factors are not intended to be reviewed on an annual
basis. They may however be revisited periodically in the future to ensure they do
not become dated.
The fuel costs equivalisation factors are based on three years of required fuel cost
data from the English Housing Survey (using the 2008, 2009 and 2010 Fuel Poverty
datasets). The combined 3 year weights (from the EHS“3yr_weight890”47 file) were
used to arrive at the above set of equivalisation factors. Median fuel costs for each
of the above five household size group from this dataset57 are calculated. These
medians are then indexed to the two-person households. Adults and children are
treated equally in the equivalisation of fuel costs - that is, a household with two
adults and two children are treated the same as a household with four adults.
3. Then, divide the required fuel costs by the equivalisation factor to get the
equivalised required fuel costs for that particular household. Equivalising effectively
increases the costs of single person households, and decreases the costs of
multiple person households, with the aim of making them comparable.
4. The fuel cost threshold is the weighted median of equivalised required fuel costs for
the whole sample.
In other words, half of all households will have “high costs” i.e. above the threshold, and
half will have “low costs” i.e. below the threshold.
The threshold for fuel costs is the same for all households in each year of the fuel poverty dataset, irrespective of the combined dataset.
Household income threshold
Households are below the income threshold if fuel spend leaves the household with a
residual income below the official poverty line58. This is calculated by:
1. Taking the full income for the household from the fuel poverty dataset59 (the
“fpfullinc” variable).
2. Subtracting housing costs from the income to arrive at After Housing Costs (AHC)
income. Housing costs consist of:
a. Weekly total mortgage repayments (“mortwkx” variable from the EHS
interview file)
57 Based on the “hhsizex” variable from the EHS interview file. 58 Relative low income (or poverty) is defined as 60% of the median equivalised disposable income, and is used in official UK statistics. For example: https://www.ons.gov.uk/peoplepopulationandcommunity/personalandhouseholdfinances/incomeandwealth/articles/persistentpovertyintheukandeu/2014 59 https://www.ukdataservice.ac.uk/get-data

Fuel poverty methodology handbook
61
b. Weekly net rent payments (“rentExS” variable from the EHS interview file).
This variable also includes housing benefit. Note, the “rentExS” variable is
used rather than the “rentwkx”, as “rentwkx” includes the cost of any services
that the household pay alongside their rent. To ensure consistency in
reporting only the true housing costs, variable “rentExs” is used.
3. Divide the after housing costs income by the relevant After Housing Costs (AHC)
income equivalisation factor. Equivalising effectively increases the incomes of
single people, and reduces the incomes of larger households, similarly to fuel costs,
with the intention of making them comparable. The equivalisation factors for each
person in the household are shown in Table 11 below.
Table 11: After housing costs income equivalisation factors for the LIHC indicator
Number of people in the household After Housing Costs
(AHC) income
equivalisation factor
First adult in the household 0.58
Subsequent adults (includes partners and
children aged 14 or over)
0.42
Children under 14 0.20
The AHC income equivalisation factors used are consistent with that used by the
DWP in their production of Households Below Average Income (HBAI) statistics.
These factors were first devised by the OECD, and are used widely across Europe,
including by Eurostat.
Two key elements are needed to derive an individual household’s equivalisation
factor: the number of occupants in the household, and their age (as the OECD scale
distinguishes between under and over 14 year olds).
The number of household occupants is taken from the “hhsize” variable (from the
EHS “interview file”) and combined with information on the occupants age from the
“DVHsize” variable (from the EHS “people” file)60. The difference in the number of
additional adults between “hhsize” and “DVHsize” are assumed to be additional
adults who live in halls of residence. These adults are removed from these
calculations. The AHC income equivalisation factor therefore, excludes any
60 The “hhsize” variable only excludes people living in halls of residence from 2008 onwards, following a change from the EHCS to the EHS. Prior to that, “hhsize” was consistent with “DVHsize”, and so people living in halls of residence were included in our income equivalisation method. There is therefore a small break in the consistency of the time series between 2007 and 2008.

Fuel poverty methodology handbook
62
household members who are living away in halls of residence, making the
calculation of AHC income equivalisation factors consistent with fuel costs
equivalisation factors, by counting only household members living in the residence.
A worked example of how to arrive at a households AHC income equivalisation
factor is given below. Suppose a household consists of the following members:
Table 12: Worked example household details
Household member
Age (years)
Status AHC equivalisation factors
HRP 54 Lives at home 0.58
HRP partner 52 Lives at home 0.42
Additional adult 21 Lives in halls of residence
0.42
Additional adult 18 Lives in halls of residence
0.42
Additional adult 16 Lives at home 0.42
Child 12 Lives at home 0.2
Total 2.46
Here the:
Hhsize = 4 (excludes the two people living in halls of residence)
DVHsize = 6 (includes the two people living in halls of residence)
The overall equivalisation factor, after accounting for the 2 people living in halls of residence, is given by:
AHC income equivalisation factor = 2.46 – (2 * 0.42) = 1.62
The key assumptions here are:
i) We assume the difference between the “hhsize” and “DVHsize” is due to
people living away in halls of residence; and more crucially
ii) that all individuals living in halls of residence will be over 14 years old, and so
have an equivalisation factor of 0.42 rather than 0.20.
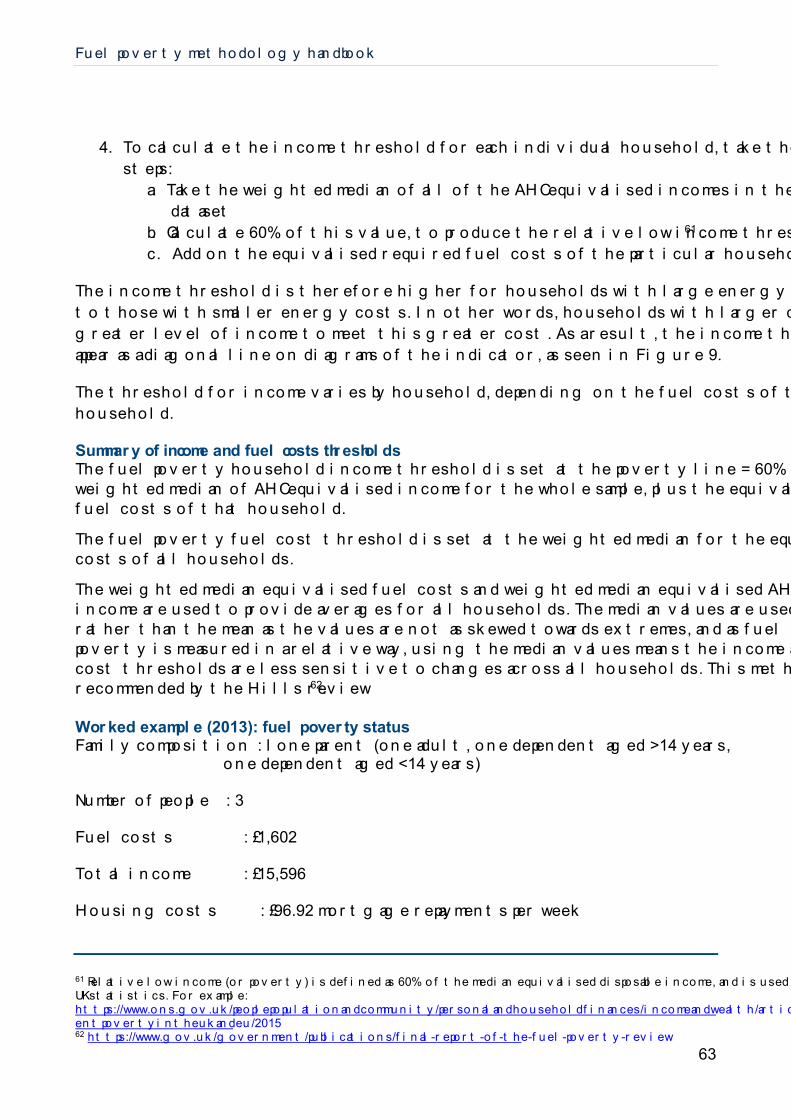
Fuel poverty methodology handbook
63
4. To calculate the income threshold for each individual household, take the following
steps:
a. Take the weighted median of all of the AHC equivalised incomes in the
dataset
b. Calculate 60% of this value, to produce the relative low income threshold61 .
c. Add on the equivalised required fuel costs of the particular household.
The income threshold is therefore higher for households with large energy costs compared
to those with smaller energy costs. In other words, households with larger costs require a
greater level of income to meet this greater cost. As a result, the income threshold will
appear as a diagonal line on diagrams of the indicator, as seen in Figure 9.
The threshold for income varies by household, depending on the fuel costs of the
household.
Summary of income and fuel costs thresholds The fuel poverty household income threshold is set at the poverty line = 60% of the weighted median of AHC equivalised income for the whole sample, plus the equivalised fuel costs of that household.
The fuel poverty fuel cost threshold is set at the weighted median for the equivalised fuel costs of all households.
The weighted median equivalised fuel costs and weighted median equivalised AHC income are used to provide averages for all households. The median values are used rather than the mean as the values are not as skewed towards extremes, and as fuel poverty is measured in a relative way, using the median values means the income and fuel cost thresholds are less sensitive to changes across all households. This method was recommended by the Hills review62.
Worked example (2013): fuel poverty status Family composition : lone parent (one adult, one dependent aged >14 years,
one dependent aged <14 years) Number of people : 3 Fuel costs : £1,602 Total income : £15,596 Housing costs : £96.92 mortgage repayments per week
61 Relative low income (or poverty) is defined as 60% of the median equivalised disposable income, and is used in official UK statistics. For example: https://www.ons.gov.uk/peoplepopulationandcommunity/personalandhouseholdfinances/incomeandwealth/articles/persistentpovertyintheukandeu/2015 62 https://www.gov.uk/government/publications/final-report-of-the-fuel-poverty-review
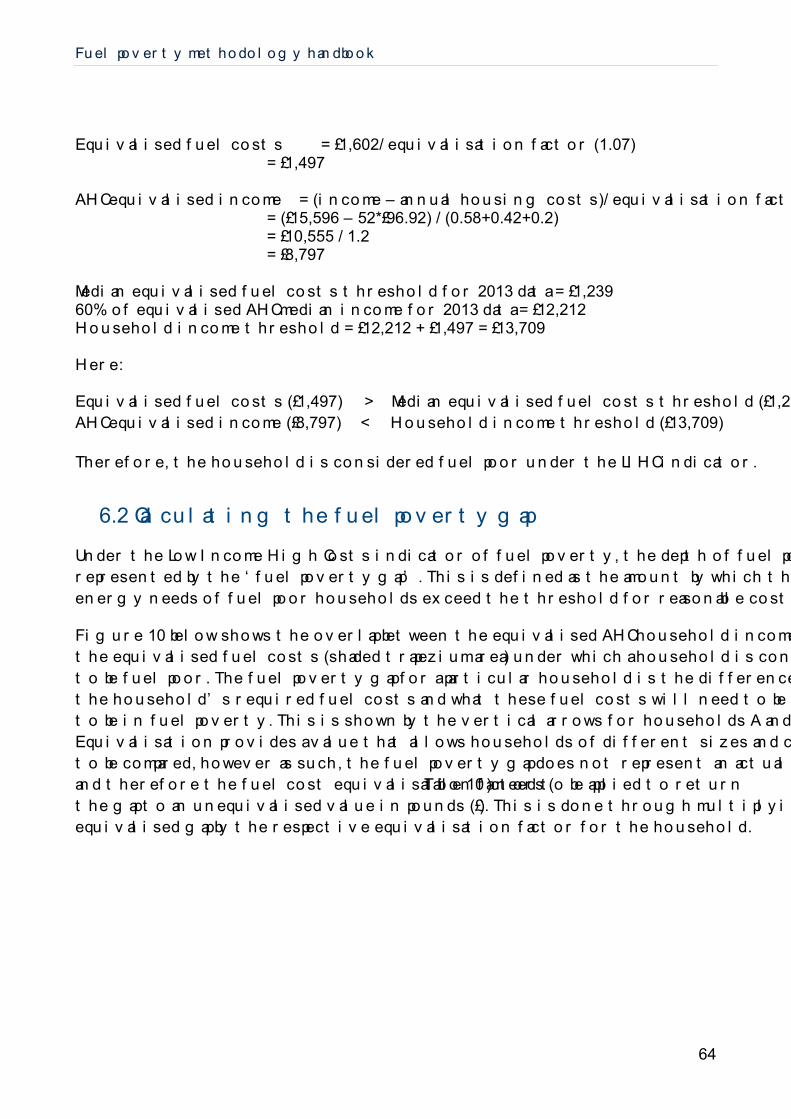
Fuel poverty methodology handbook
64
Equivalised fuel costs = £1,602/ equivalisation factor (1.07) = £1,497
AHC equivalised income = (income – annual housing costs)/ equivalisation factor = (£15,596 – 52*£96.92) / (0.58+0.42+0.2) = £10,555 / 1.2
= £8,797
Median equivalised fuel costs threshold for 2013 data = £1,239 60% of equivalised AHC median income for 2013 data = £12,212 Household income threshold = £12,212 + £1,497 = £13,709 Here: Equivalised fuel costs (£1,497) > Median equivalised fuel costs threshold (£1,239)
AHC equivalised income (£8,797) < Household income threshold (£13,709)
Therefore, the household is considered fuel poor under the LIHC indicator.
6.2 Calculating the fuel poverty gap
Under the Low Income High Costs indicator of fuel poverty, the depth of fuel poverty is
represented by the ‘fuel poverty gap’. This is defined as the amount by which the assessed
energy needs of fuel poor households exceed the threshold for reasonable costs.
Figure 10 below shows the overlap between the equivalised AHC household income and
the equivalised fuel costs (shaded trapezium area) under which a household is considered
to be fuel poor. The fuel poverty gap for a particular household is the difference between
the household’s required fuel costs and what these fuel costs will need to be for them not
to be in fuel poverty. This is shown by the vertical arrows for households A and B below.
Equivalisation provides a value that allows households of different sizes and composition
to be compared, however as such, the fuel poverty gap does not represent an actual value
and therefore the fuel cost equivalisation factors (Table 10) need to be applied to return
the gap to an unequivalised value in pounds (£). This is done through multiplying the
equivalised gap by the respective equivalisation factor for the household.

Fuel poverty methodology handbook
65
Figure 10: Fuel poverty gap under the Low Income High Costs indicator
For fuel poor households, the fuel poverty gap can be generalised as: Fuel poverty gap = (y – ym) – max{[x – (xm + ym)],0} Where: x = equivalised household income xm = 60% of equivalised AHC median income y = equivalised household fuel costs ym = median equivalised fuel costs (fuel cost threshold) From the 2017 fuel poverty dataset:
- 60% of equivalised AHC median income = £13,672 - Median equivalised fuel costs = £1,158
These are based on the equivalised incomes and equivalised fuel costs. For more
information on equivalisation, and the factors used for both incomes and fuel costs, please
see Section 6.1.
Worked example (2017): fuel poverty gap
Figure 11: Worked example: fuel poverty gap calculation11 below illustrates the fuel
poverty gap calculation for two typical fuel poor households, A and B. In 2017, the Income
threshold (defined as 60% of equivalised AHC median income) was £13,672 and the Fuel
cost threshold (defined as the median required fuel costs, equivalised) were £1,158. The

Fuel poverty methodology handbook
66
Overall income threshold at the median fuel costs is defined as the sum of the two:
£13,672 + £1,158 = £14,830. In this example, household A has an income below this
threshold while household B has an income above it. The income (x) and fuel costs (y) for
each household is shown in Figure 11: Worked example: fuel poverty gap calculation 11
below as (x, y).
60% of equivalised AHC median income (xm) = £13,672
Fuel cost threshold (median equivalised fuel costs, ym) = £1,158
Overall income threshold (at median fuel costs) = (xm + ym) = £13,672 + £1,158 =
£14,830
Household A is below the Overall income threshold (equivalised household income =
£11,643) and therefore their fuel poverty gap is calculated as their excess fuel costs alone
(y – ym).
(Equivalised household income)A = £11,643
(Equivalised fuel costs)A = £1,311
Fuel cost equivalisation factor = 1.21
(Fuel poverty gap)A = Equivalised fuel costs – Fuel Cost threshold
= £1,311 - £1,158
= £153
(Final unequivalised fuel poverty gap)A = (Fuel poverty gap)A x equivalisation factor
= £153 x 1.21
= £185
Household B is above the Overall income threshold (equivalised household income =
£15,414) and therefore their fuel poverty gap is calculated as the excess fuel costs minus
their extra income above the overall income threshold: (y – ym) – (x – (xm + ym)).
(Equivalised household income)B = £15,414
(Equivalised household fuel costs)B = £2,751
(Fuel poverty gap)B = Equivalised household fuel costs – Fuel cost threshold
– (Equivalised household income – Overall income threshold)
= £2,751 – £1,158 – (£15,414 – £14,830)
= £1,009
Fuel cost equivalisation factor = 1.21
(Final unequivalised fuel poverty gap) B = (Fuel poverty gap)B x equivalisation factor
= £1,009 x 1.21
= £1,221

Fuel poverty methodology handbook
67
The resulting gap for each individual household is then aggregated across all fuel poor
households to produce an overall aggregate fuel poverty gap. This gives a sense of the
depth of fuel poverty on a national level. In addition, this aggregate gap can then be
divided by the total number of fuel poor households to give an average fuel poverty gap.
By examining the average fuel poverty gap for different groups of households, the severity
of the problem can be compared by examining the average fuel poverty gap for different
groups of households.
Figure 11: Worked example: fuel poverty gap calculation
6.3 Calculation of the FPEER
The Fuel Poverty Energy Efficiency Rating (FPEER) is calculated as laid out in the Fuel
Poverty Energy Efficiency Rating methodology documentation available at:
https://www.gov.uk/government/publications/fuel-poverty-england-regulations-2014-and-
methodology
The FPEER is a measure of the energy efficiency of a property based on the Standard
Assessment Procedure (SAP), and accounting for polices that directly affect the cost of
energy, such as the Warm Homes Discount, that is applied to selected households (see
Section 4.5). It is produced based on SAP 2012 costs, and generates a rating of energy

Fuel poverty methodology handbook
68
efficiency between 1 (low) and 100 (high), which is also translated into an energy
efficiency, from G (lowest) to A (highest).
Fuel poverty methodology handbook
69
7. Projections methodology
7.1 Introduction
The fuel poverty projections methodology is split into five sections, with one section for
each area that is projected: household energy efficiency, household income and fuel
prices. The calculation of the projected fuel poverty figures is then detailed in the fourth
section with the final section covering projections against the Government’s fuel poverty
energy efficiency rating (FPEER) targets.
This year we have decided not to publish projections for 2020 due to the unprecedented
nature of the ongoing coronavirus (COVID-19) pandemic. We do not yet have enough
information to develop assumptions for what is likely to happen to incomes, energy efficiency
installations and energy prices between April 2020 and March 2021. Therefore, in this chapter
the focus is the projection of fuel poverty forward to 2019, from a base year of 2018.
This year, the fuel poverty model has been re-developed by refining a number of the
assumptions and improving the process of estimating fuel poverty in future years, although
broadly the principles remain the same as in previous years.
As discussed in Section 2.1 the EHS data for the 2018 year is made up of two single year
datasets collected April 2017 to March 2018 (17-18 single year dataset) and April 2018 to
March 2019 (18-19 single year dataset). This is called the combined year dataset for 2018.
Previously, to project to 2019 we would apply assumptions to and model the whole
combined year dataset for 2018. This year we have improved the structure of our
projections model. We have carried out our projections on the 17-18 single year dataset
and kept the 18-19 dataset the same. This improvement means that the projections
modelling is more comparable to the method used to produce the 2018 dataset.

Fuel poverty methodology handbook
70
Figure 12: Improved projections process
7.2 Projecting energy efficiency
One of the key drivers of fuel poverty is how energy efficient a dwelling is, and therefore,
what the energy requirements are to maintain an adequate standard of warmth. For
example, if a dwelling is poorly insulated, its energy requirements are likely to be high,
which is one of the main criteria of fuel poverty. To establish if the levels of fuel poverty are
likely to increase or decrease, the number and type of improvements to the housing stock
needs to be modelled.
The number of measures to allocate
There are several different types of measures that can be installed to improve the energy
efficiency of a dwelling. For this model, the key measures that have been used are:
Cavity wall insulation
Solid wall insulation
Loft insulation
Solar photovoltaic panels
Condensing boilers
Central heating
Heating controls
Double Glazing
Draught Proofing
The first step is to establish how many of each of these measures have been installed in
the time period that is being projected. Additionally, these measures can be installed under
different policies. The number of measures installed under each policy for the year being

Fuel poverty methodology handbook
71
projected is required, so that measures can be allocated to appropriate properties to model
the change in energy requirements over time.
Changes to ECO (Energy Company Obligation) eligibility criteria introduced as part of
ECO 363. From October 2018, the ECO scheme was wholly targeted to low income
vulnerable households. In previous phases of the ECO scheme, any household was
entitled to subsidies towards energy efficiency improvements, regardless of their income.
From 1st April 2019, the Private Rented Sector Minimum Energy Efficiency Standards64
regulations for the domestic private rented sector required private landlords to improve
their properties to an efficiency of at least an E, to meet the minimum standards. This is
captured in the 2019 projections.
BEIS publish national statistics on the number of installations by policy area and these are
available for 2019.
Another area that is important to consider is improvements to the energy efficiency made
by householders or property owners not under a Government policy, a key example is
boiler improvements. According to the English Housing Survey (EHS), the proportion of
households with condensing boilers is increasing each year. In order to estimate how
much this will increase for the projected years, the change between 2017 and 2018 in the
EHS is used as a proxy. The number of boilers installed under ECO is then deducted from
this figure.
Furthermore, the projections model continues to account for the incremental improvements
in the housing stock that occurs as newer, more energy efficient, properties are built, and
older buildings are demolished. These changes are captured in the projections model by
altering the household weights of the original EHS sample. Household weights of newer
A/B/C and D properties are increased in line with ONS and MHCLG statistics on
population figures and the number of households in 201965,66.
Allocating installations
For the first time this year, we have been able match households that have received a
measure under ECO in 2019 with the EHS data (this match has been undertaken only for
households that have consented for their data to be matched). This has improved the
accuracy of allocations within the model.
63 For more detail on ECO3 eligibility, please refer to Ofgem’s website: https://www.ofgem.gov.uk/publications-and-
updates/energy-company-obligation-2018-22-eco3-guidance-delivery 64 http://www.legislation.gov.uk/ukdsi/2018/9780111175217/contents 65 ONS population figures available here: https://www.ons.gov.uk/peoplepopulationandcommunity/populationandmigration/populationprojections/datasets/regionsin
englandtable1 66 MHCLG households figures available here: https://www.gov.uk/government/statistical-data-sets/live-tables-on-
household-projections
Fuel poverty methodology handbook
72
Measures under the PRS policy are then randomly allocated to households that meet the
criteria. These are then combined to make up the total number of allocations within the half
year sample.
Different types of installations are only available to certain types of households. For
example, to receive cavity wall insulation, the house must have uninsulated cavity walls.
Eligibility criteria for each household are then matched from the energy performance
dataset. An SQL model then allocates measures based on meeting relevant criteria.
The random allocation of measures is repeated in turn for each of the individual measure
(e.g. insulation) and policy (e.g. ECO) combinations. If a household is eligible for more
than one type of measure, they can receive multiple measures, for example loft insulation
and cavity wall insulation.
Energy Requirements Calculation
Once individual energy efficiency measures have been allocated, they are combined to
create an overall allocation per household, this could be one measure, multiple measures,
or none. The next step is to model the impacts of these measures on a household’s
energy requirements, and ultimately, fuel costs.
Savings factors for every possible combination have been created to indicate the level of
savings for different dwelling types for every possible combination of measures. The
relevant savings factor for the measures allocated is then applied to a household’s energy
requirement. This is done for each fuel type (e.g. gas) and each type of use (e.g. space
heating). This provides an estimate of the reduction in energy requirements that each
given combination of measures allocated would have on that household. The total energy
use by fuel type is then used to calculate the total new fuel cost per household using the
prices (see Section 7.4 below). This whole process is completed for each half year of the
projections, as a different number of measures are allocated for each half year, along with
different fuel prices.
SAP Costs calculation
The standard assessment procedure (SAP)67 is a measure of energy efficiency. The SAP
costs are part of the SAP calculation, which is used to create the fuel poverty energy
efficiency rating (FPEER). FPEER is based on the SAP methodology, however, it
additionally considers any energy rebates given to the household. In a similar way to the
recalculation of the energy requirements, savings factors are applied to the original SAP
costs, based on the combination of measures allocated to the household.
67 SAP manual: https://www.bre.co.uk/filelibrary/SAP/2012/SAP-2012_9-92.pdf
Fuel poverty methodology handbook
73
7.3 Income
Within the fuel poverty dataset, sources of household income are recorded. This is
categorised into income from: earnings, savings, benefits and ‘other’. Council tax is then
deducted from the full income. Income is uprated dependent on its source, for the
subsequent two years. Figures from the Economic and Fiscal Outlook68 which is produced
by the Office for Budget Responsibility (OBR) are used to uprate incomes from: earnings,
savings, benefits and ‘other’ income sources.
Earnings
We continue to capture the differential rate in the increase in earnings between different
deciles. This is based on data from ONS’ Average Weekly Earnings data69 and is validated
against OBR fiscal outlook figures on the annual change in average earnings.
Savings
Any income from savings is uprated by Gross Domestic Product (GDP).
Other
Any income from sources categorised as ‘other’ is uprated by GDP.
Benefits
Benefits are a broad term for any type of financial support, of which the amount received
increases or decreases at different rates, dependent on the type of benefit received.
However, for simplicity, they are treated as one type of benefit and are simply inflated by
the Retail Price Index (RPI) figures, sourced from OBR fiscal outlook tables.
Council Tax
Average changes to council tax are applied for each year. These are based on figures
published by MHCLG on council tax levels in England in 2018-19 70.
7.4 Prices
The main fuel prices considered in projections are the price of gas and electricity. The
changes to average prices are known for 2019 and have been published as part of BEIS’
Quarterly Energy Prices publication71. This shows the average unit and fixed costs for gas
and electricity. Average costs split by region, payment type and tariff type (for electricity)
are applied to the individual households in the EHS sample.
68 https://obr.uk/efo/economic-and-fiscal-outlook-march-2020/ 69https://www.ons.gov.uk/employmentandlabourmarket/peopleinwork/employmentandemployeetypes/bulletins/averagew
eeklyearningsingreatbritain/latest 70 Council tax changes: Table 3 : https://www.gov.uk/government/statistics/council-tax-levels-set-by-local-authorities-in-england-2020-to-2021 71 https://www.gov.uk/government/statistical-data-sets/annual-domestic-energy-price-statistics

Fuel poverty methodology handbook
74
The new methodology uplifts the fuel prices of those household that have not received a
measure based on the payment type and fuel type while it re-calculates the fuel prices for
those households that have received a measure based on the new calculated
consumption.
Prices are calculated in two ways this year.
1. For those households that have not received a measure and
2. For those households that have received a measure.
For point one, the standing charge for 2017 is deducted from the total fuel costs depending
on the main fuel type and if applicable. The difference is then uplifted (by multiplying it with
a calculated factor derived from QEP) and the total fuel cost is achieved by adding the
standing charge for 2019 to this new calculated figure.
For point two, the unit costs of each of these fuel types are then multiplied by the new
number of units of energy required. This is done at a household level and is done
separately for the half sample. Any standing charges associated with each fuel type are
added to give a total fuel cost per fuel. The total fuel costs by fuel are added together to
give a total fuel cost per household per year.
For heating oil, coal, and smokeless fuel, prices are known because they are used in the
calculation of the CPI for 2018 and are used in the 2019 projection.
7.5 Projecting fuel poverty
To calculate the proportion of households projected to be in fuel poverty, and their average
fuel poverty gap, projected national level fuel costs and incomes for each year are used to
calculate new fuel poverty thresholds.
For each projected year, the relative position of households to the new thresholds, and
ultimately their fuel poverty status, is recalculated along with their associated fuel poverty
gap, following the methodology defined in Chapter 6.
7.6 Projecting against the target
New SAP costs are calculated based on the projected allocation of energy efficiency
measures (considering savings factors) and are then used to calculate FPEER following
the standard methodology72. The FPEER methodology includes the Warm Home Discount
(WHD). Allocation of WHD, for the first time this year has been kept as original data i.e.
72 FPEER methodology:https://www.gov.uk/government/publications/fuel-poverty-england-regulations-2014-and-methodology

Fuel poverty methodology handbook
75
households that have received this discount in the original dataset (2018) continues to
receive the discount within the projections model.
Following the FPEER methodology, new FPEER bands for all households are created.
Using the projected fuel poverty status of the households, the projected progress against
the target (see Chapter 2 of the main fuel poverty publication) can then be calculated.
These targets require the projection of the proportion of fuel poor households that have an
energy efficiency rating of Band E or above, Band D or above and Band C or above.

Fuel poverty methodology handbook
76
8. What fuel poverty statistics are available to users?
8.1 Fuel poverty data
BEIS publish a large set of detailed tables, which accompany the main report, showing fuel
poverty by income decile, tenure, dwelling type, household composition and many other
factors concerning both the householders and the dwelling itself (e.g. insulation
measures). BEIS also publish an Excel workbook looking at trends in fuel poverty since
2003 for a range of sub-groups. To allow comparison, these tables show the results, under
the LIHC definition and under the consistent (BREDEM 2012 v1.1) time series.
Both of these can be found on the BEIS website at:
https://www.gov.uk/government/collections/fuel-poverty-statistics
The detailed 2018 fuel poverty dataset, along with datasets from previous years, will be
available via the UK Data Service later in 2020. These datasets contain the underlying
data used to calculate fuel poverty and the corresponding crosstab variables used within
the fuel poverty report and are intended for advanced users of fuel poverty data.
Documentation covering variable names and descriptions are also provided alongside the
datasets.
Anonymisation techniques are applied to the End User Licence and Special Licence fuel
poverty datasets deposited on the UK Data Service to maintain the confidentiality of
respondents. Prior to releasing the data on the UK Data Service, and in-line with EHS
disclosure control, all disclosive variables are removed to maintain the confidentiality of
respondents. Some response categories are also condensed, several variables are top
coded, and, in a few rare situations, data swapping between cases takes place for
disclosure control reasons.
Most fuel poverty variables are included in the dataset deposited at the UK Data Service
under the standard End User Licence. To comply with the data disclosure control guidance
issued by the Government Statistical Service, supplementary fuel poverty variables are
released under the more restricted Special Licence on the UK Data Service.
In addition to this, BEIS also publish fuel poverty data at a sub-regional level. Data for
Local Authorities, Counties, Parliamentary Constituencies and Lower Super Output Areas
(LSOAs) can be found on the BEIS website at:
https://www.gov.uk/government/collections/fuel-poverty-sub-regional-statistics
Fuel poverty methodology handbook
77
8.2 Fuel poverty publications
The 2020 Annual Report on Fuel Poverty Statistics reports the headline fuel poverty
statistics for 2018. The report provides an explanation of these figures, and the reasons for
change from previous years, by looking at household income, household energy efficiency
and energy prices. In addition, the report explores the trends in fuel poverty since 2003
amongst various subgroups. This publication is available, alongside the reports from
previous years, on the BEIS website:
https://www.gov.uk/government/collections/fuel-poverty-statistics
8.3 Methodology information
Although this document supersedes all previous methodology documents, the
methodology documents from previous years are also available from the archive section of
the BEIS website. Up to and including 2014 fuel poverty statistics, a technical annex with
addition details on the fuel cost modelling was published alongside the main methodology
handbook. The technical annex is now incorporated within this document, to provide a
single methodology document for the fuel poverty statistics.
8.4 Consultation
Through the Energy Act 2013, the Government implemented a new legal framework to
monitor fuel poverty in England using the Low Income High Costs Indicator (LIHC). This
indicator of fuel poverty was first proposed in Professor Hills’ review of Fuel Poverty73 and
following consultation, the Government confirmed its intention to adopt the indicator in July
201374. In the accompanying strategic framework document, ‘Fuel Poverty: a framework
for future action’75, the Government set out how the new indicator will inform the strategic
approach to tackling fuel poverty, including setting a new fuel poverty target which will be
underpinned by a new fuel poverty strategy.
A draft strategy and consultation document, ‘Cutting the cost of keeping warm’ was then
published in July 2014. This proposed the creation of an additional indicator known as the
Fuel Poverty Energy Efficiency Rating (FPEER) for use in targeting, and a number of
targets tied to specific dates. Secondary legislation was put forward in December 2014 for
this rating, alongside the LIHC fuel poverty definition, to form the basis of the statutory
target for fuel poverty. This requires, as far as reasonably practicable, for all persons living
in fuel poverty to have an FPEER of Band C or above by 31st December 2030.
73 See https://www.gov.uk/government/publications/final-report-of-the-fuel-poverty-review 74 See https://www.gov.uk/government/consultations/fuel-poverty-changing-the-framework-for-measurement 75 See https://www.gov.uk/government/publications/fuel-poverty-a-framework-for-future-action

Fuel poverty methodology handbook
78
In March 2015 the final Fuel Poverty Strategy was published, confirming the main and
interim targets, alongside the responses to the July 2014 consultation.
In July 2019 the Government published the ‘Fuel Poverty Strategy for England:
Consultation’ document76, in order to assess the implementation of the 2015 fuel poverty
strategy77 so far and to seek views on proposals to update the fuel poverty strategy. In
light of the ongoing COVID-19 response, Government has taken the decision to
temporarily delay publication of the response to this consultation. The Government plan to
publish the response to consultation, the updated Fuel Poverty Strategy for England and
related documents later this year.
76 https://www.gov.uk/government/consultations/fuel-poverty-strategy-for-england 77 https://www.gov.uk/government/publications/cutting-the-cost-of-keeping-warm

Fuel poverty methodology handbook
79
9. How accurate are the fuel poverty statistics?
Fuel poverty in England is published as a point estimate of the number of households
affected. A series of models are used to calculate the figure using inputs from a variety of
sources, many of which are approximations. Therefore, the modelling process requires
numerous assumptions. For example, there is no information on the energy supplier and
the tariff that a household uses. Instead, households are assigned an average price
depending on the region that they live in and the way in which they pay for their energy
(e.g. standard credit, direct debit, etc.).
In 2014, DECC (now BEIS) published analysis that estimated the uncertainty around the
point estimates of fuel poverty for 2012. This analysis looked specifically at the uncertainty
around household incomes, fuel prices and energy requirements, using these to then
estimate the levels of uncertainty around the overall national estimates of fuel poverty.
This analysis suggests that the addition of uncertainty is likely to increase the levels of fuel
poverty observed.
We can interpret this in the context of the distribution of households across the LIHC
metric – particularly in terms of how many households can be placed into the LIHC
quadrant by the addition of uncertainty, compared to how many can be removed from this
quadrant. Since on average, just over 10% of households are in fuel poverty, there are
more households outside the LIHC quadrant than inside and in particular more households
outside the LIHC quadrant close to the income and fuel costs thresholds (in the HIHC and
LILC quadrants).Therefore the application of uncertainty is able to move more households
into fuel poverty than out of it (i.e. of 10 households, one would be in fuel poverty and nine
not fuel poor – so it is more likely to place a number of the nine households into fuel
poverty than remove the one household out of fuel poverty). This has the net effect of
increasing the average number of fuel poor households, resulting in a slightly higher
distribution of possible values for the number that are fuel poor, and so consequently the
aggregate gap, after the addition of uncertainty.
These results need to be interpreted with caution. Any analysis of this kind is ultimately
dependent on the input distributions used within the modelling, and the majority of the
input distributions used are in themselves best estimates of uncertainty in each factor.
Further to this, the analysis has been designed with a cautious approach, with
conservative assumptions made throughout. As a result, these figures should be treated
as indicative of the effect of uncertainty upon the national estimates of fuel poverty, rather
than strictly quantitative.

Fuel poverty methodology handbook
80
10. Statistical Assessment
The UK Statistics Authority (UKSA) is an independent body operating at arms-length from
the Government as a non-ministerial department, directly accountable to parliament. The
UKSA’s objective is to promote and safeguard the quality and comprehensiveness of
official statistics and to ensure good practice in relation to official statistics.
Between February and July 2010, the UKSA carried out an assessment of BEIS’s (then
DECC) fuel poverty statistics against the Code of Practice for Official Statistics. The Code
is structured in terms of 8 principles and 3 protocols, which encompass meeting user
needs, impartiality and objectivity, and sound methods, amongst others. If, after an
assessment by the UKSA, official statistics are found to comply with the Code, they are
designated as National Statistics. This indicates to users that the statistics have been
produced in line with the Code. More details of the Code can be found on the UKSA
website at:
https://www.statisticsauthority.gov.uk/code-of-practice/the-code/
In this assessment, the UKSA judged that the fuel poverty statistics are readily accessible,
produced according to sound methods and are managed impartially and objectively in the
public interest. As a result, the UKSA confirmed that the statistics published in the Annual
Report on Fuel Poverty Statistics can be designated as National Statistics.
The continued designation of these statistics as National Statistics was confirmed in
August 2017 following a compliance check by the Office for Statistics. The statistics last
underwent a full assessment against the Code of Practice for Statistics in 2014.

Fuel poverty methodology handbook
81
11. Acronyms
Acronym Definition ASHE Annual Survey of Hours and Earnings AHC After Housing Cost BEIS Department for Business, Energy and Industrial Strategy BRE Building Research Establishment BREDEM BRE Domestic Energy Model CAPI Computer Assisted Personal Interviewing CHAID Chi-squared Automatic Interaction Detector CHP Combined Heat and Power CPI Consumer Price Index CTB/CTS Council Tax Benefit/Support DLA Disability Living Allowance DUKES Digest of UK Energy Statistics DWP Department of Work and Pensions EHCS English House Condition Survey EHS English Housing Survey FPEER Fuel Poverty Energy Efficiency Rating FPMG Fuel Poverty Methodology Group FRS Family Resources Survey HB Housing Benefit HBAI Households Below Average Income HRP Household Reference Person LA Local Authority LCFS Living Cost and Food Survey LHA Local Housing Allowance LIHC Low Income High Cost LPG Liquefied Petroleum Gas MHCLG Ministry of Housing, Communities and Local Government MPPI Mortgage Payment Protection Insurance OBU Other Benefit Unit OECD Organisation for Economic Co-operation and Development ONS Office for National Statistics PBU Primary Benefit Unit PIP Personal Independence Payment PPM Prepayment Meter RdSAP Reduced Data Standard Assessment Procedure RSL Registered Social Landlord SAP Standard Assessment Procedure SMI Support for Mortgage Interest UKSA UK Statistics Authority WFP Winter Fuel Payment WHD Warm Homes Discount
Fuel poverty methodology handbook
82
© Crown copyright 2020
This publication is licensed under the terms of the Open Government Licence v3.0 except where otherwise stated. To view this licence, visit nationalarchives.gov.uk/doc/open-government-licence/version/3 or write to the Information Policy Team, The National Archives, Kew, London TW9 4DU, or email: [email protected].
Where we have identified any third-party copyright information you will need to obtain permission from the copyright holders concerned.
This publication is available from: https://www.gov.uk/government/collections/fuel-poverty-
sub-regional-statistics
If you need a version of this document in a more accessible format, please email
[email protected]. Please tell us what format you need. It will help us if you say
what assistive technology you use.