fuel reduction and electricity consumption impact of
TRANSCRIPT
UC IrvineUC Irvine Previously Published Works
TitleFuel reduction and electricity consumption impact of different charging scenarios for plug-in hybrid electric vehicles
Permalinkhttps://escholarship.org/uc/item/3pp1t0ws
JournalJournal of Power Sources, 196(15)
ISSN0378-7753
AuthorsZhang, LBrown, TSamuelsen, GS
Publication Date2011-08-01
DOI10.1016/j.jpowsour.2011.03.003
Copyright InformationThis work is made available under the terms of a Creative Commons Attribution License, availalbe at https://creativecommons.org/licenses/by/4.0/ Peer reviewed
eScholarship.org Powered by the California Digital LibraryUniversity of California
Fs
LA
a
ARRAA
KPCFE
1
1
sefep
tricccggwctpo
0d
Journal of Power Sources 196 (2011) 6559–6566
Contents lists available at ScienceDirect
Journal of Power Sources
journa l homepage: www.e lsev ier .com/ locate / jpowsour
uel reduction and electricity consumption impact of different chargingcenarios for plug-in hybrid electric vehicles
i Zhang, Tim Brown ∗, G. Scott Samuelsendvanced Power and Energy Program (APEP), University of California, Irvine, Irvine, CA 92697-3550, United States
r t i c l e i n f o
rticle history:eceived 6 January 2011eceived in revised form 3 March 2011ccepted 3 March 2011vailable online 10 March 2011
a b s t r a c t
Plug-in hybrid electric vehicles (PHEVs) consume both gasoline and grid electricity. The correspondingtemporal energy consumption and emission trends are valuable to investigate in order to fully understandthe environmental benefits. The 24-h energy consumption and emission profile depends on differentvehicle designs, driving, and charging scenarios. This study assesses the potential energy impact of PHEVsby considering different charging scenarios defined by different charging power levels, locations, and
eywords:lug-in hybrid electric vehiclesharging scenariosuel reductionlectricity consumption
charging time. The region selected for the study is the South Coast Air Basin of California. Driving behaviorsare derived from the National Household Travel Survey 2009 (NHTS 2009) and vehicle parameters arebased on realistic assumptions consistent with projected vehicle deployments. Results show that thereduction in petroleum consumption is significant compared to standard gasoline vehicles and the abilityto operate on electricity alone is crucial to cold start emission reduction. The benefit of higher power
nsumon-ho
charging on petroleum cocharging for home, and n
. Introduction
.1. Vehicle electrification
A hybrid vehicle combines two different types of propulsionystems such as an electric motor and an internal combustionngine, although other types are possible [1]. The main motivationor developing hybrid electric vehicles (HEVs) is the possibility tonhance vehicle fuel economy and to reduce greenhouse gas andollutant emissions.
Although HEVs have been on the mass market for over 10 years,hey cannot eliminate the dependence on petroleum fuel and theireduction of greenhouse gas emissions is limited. As a result, plug-n hybrid electric vehicles (PHEVs), also called off-vehicle chargeapable vehicles, are being developed, which act as a HEV underharge sustaining mode [2], and consume grid electricity underharge depleting mode [2] after battery recharging. Because therid load experiences temporal variation resulting in underutilizedeneration facilities, research indicates for the United States as ahole, up to 84% of U.S. cars, pickup trucks, and sport utility vehi-
les could be supported by the existing electric generation andransmission infrastructure. This has an estimated gasoline dis-lacement potential of 6.5 million barrels of fuel equivalent per day,r approximately 52% of the nation’s fuel imports [3]. PHEVs could
∗ Corresponding author. Tel.: +1 949 824 0088; fax: +1 949 824 7423.E-mail address: [email protected] (T. Brown).
378-7753/$ – see front matter © 2011 Elsevier B.V. All rights reserved.oi:10.1016/j.jpowsour.2011.03.003
ption is small. Delayed and average charging are better than immediateme charging increases peak grid loads.
© 2011 Elsevier B.V. All rights reserved.
reduce greenhouse gas emissions more than standard HEVs, espe-cially when the electricity generation mix is cleaner. Also, studieshave shown that PHEVs have greater pollutant emissions benefitsthan conventional vehicles and hybrid electric vehicles [4,5].
Since a PHEV consumes both fuel and electricity, it is compli-cated to assess each of them accurately. A PHEV can be both a HEVwhen never charged and an EV when the battery energy is suffi-cient for an entire trip before the next recharging. In general, fueland electricity consumption of a PHEV fleet depends on: (1) vehicledesign parameters, such as battery capacity, electric motor size andcontrol strategy [6]; (2) driving behaviors, such as trip length andtrip time; and (3) charging behaviors, such as charging power, loca-tion and time. Several studies have analyzed PHEV adoption [7–11].However, these assessments are derived from limited analysis,based on either macroscopic trend analysis or modeling second-by-second mechanical operations of a single vehicle [12]. These studiescannot simulate the accurate time dependent fuel and electric con-sumption of the vehicle fleet, nor look into the detailed impact ofcharging behaviors.
The goal of this study is to evaluate the temporal fuel, electricityconsumption and emissions, based on different charging scenariosand vehicle parameters. A key to the study is to select a regionfor analysis that is both rich in data and recognized for alternative
vehicle adoption. The South Coast Air Basin of California (SoCAB)is home to one of the largest vehicle fleets in the U.S. with morethan 10 million vehicles [13], aggressive carbon reduction goals,and notorious air quality issues. Consequently, it is reasonable tostart research in this area and expand to other areas.
6 er So
2
1
2
3
4
56
3
bswmocpdm
3
mctetdicftae
hvdsmttmpsadtt0
560 L. Zhang et al. / Journal of Pow
. Methodology
The methodology of this study can be summarized as:
. Observe the individual behavior of current in-use vehicles. Inthis study, data are derived from NHTS 2009 [14]. For each sam-pled vehicle, trip information is included for one day, such astime, location, and length. These data contain detailed operat-ing information and have a relatively large sample size (7860vehicles).
. Build a computer simulation and replace the vehicles withPHEVs.
. Operate each PHEV under the same behavior as observed in theNHTS, assuming people do not change driving behavior.
. Obtain individual vehicle’s temporal petroleum and electric-ity consumption and emission information by varying chargingbehaviors and vehicle parameters.
. Sum the results.
. Scale the results to simulate the prospective amount of vehiclesor VMT.
. Data conversion
According to the methodology above, the data used must beased on vehicle activity. However, NHTS data are based on per-onal activity, including any sort of transportation method, such asalking, biking, mass transit, etc. Additionally, NHTS personal dataay repeat in terms of vehicle activity when there is more than
ne person using a single vehicle. In this case, data conversion wasonducted to filter out all the vehicle activities and converted fromerson chain to vehicle chain. As a result, 7860 vehicles’ driving andwelling information is available for one day and are utilized in theodel.
.1. Model build
A model has been developed in Matlab. As shown in Fig. 1, theodel consists of two components, operating and charging, cir-
led by state-of-charge (SOC), which is simplified and defined ashe proportion of instantaneous usable energy in the battery to thentire usable energy in the battery when full charged. One loophrough the flow chart represents a specific trip and consequentwelling activity. NHTS data, which contain the trip and dwelling
nformation, serves as the internal input. Vehicle parameters andharging strategies are the external input, which can be changedor different scenarios. Output is the time-dependent fuel and elec-ricity consumption and other vehicle operating information suchs number and times of cold starts, and time and duration of alllectric operation.
It is assumed that each PHEV begins the day with a full charge,aving 100% SOC. In the operating component of the model, theehicle consumes electricity in the battery first during chargeepleting mode and then starts the engine converting to chargeustaining mode if the battery is depleted. In the charge depletingode, the vehicle can consume both electric energy in the bat-
ery and fuel when the engine is operating to assist with meetinghe extra power demand. The extent of engine operation in this
ode depends on vehicle design parameters, such as battery andower limit of the traction motor and vehicle operating parametersuch as velocity and acceleration. These complicated parameters
re simplified by one parameter, the electrification ratio (ER), whichefines the ratio of the amount of energy drawn out of the bat-ery if driven on battery and engine, to the energy drawn out ofhe battery if driven on battery only. For example, a vehicle having.7 ER, means that for a given operating distance, on average, theurces 196 (2011) 6559–6566
battery provides 70% of the energy and the engine provides 30%.In the California Air Resources Board’s (CARB) PHEV test proce-dure, ‘Test Procedures for 2012 and Subsequent Model Off-VehicleCharge Capable Hybrid Electric Vehicles’, a closely related ratio iscalled the all electric fraction [15], while other studies define similarratios as charge decreasing electric energy fraction [16].
The final SOC from the operating component of the model ispassed to the charging component in which the vehicle can becharged with a given power, location and time strategy. Based onthe NHTS data, the vehicle may then embark on a second trip witha new initial SOC and go back to the operating component to cir-culate again until the vehicle activities terminate at the end of aday.
The parameters used in the simulation are listed below andshown in Table 1:
1. Vehicle types: conventional vehicle, hybrid electric vehicle,plug-in hybrid electric vehicle.
2. MPG: miles per gallon;3. kWh mi−1: electric energy consumption per mile in charge
depleting mode from battery; The value of 0.25 kWh mi−1
(0.16 kWh km−1) is derived from simulating the General MotorsEV 1 drivetrain with a Toyota Prius’ mass and aerodynamiccoefficient for two U.S. EPA drive cycles (UDDS and US06) incommercial vehicle simulation software, ADVISOR;
4. ER: electrification ratio;5. kWh: usable battery capacity from 1 to 10 kWh;6. Range: the corresponding all electric range from 4 to 40 mi (from
6.4 to 64 km);7. Charging power: the limit of charging power, 1.44 kW is the typ-
ical National Electric Manufacturers Association 5-15 standardin North America;
8. Charging location: the limit of charging locations,a. Home related;b. Home and work related;c. Anywhere;
9. Charging time: charging time strategya. Immediate charging: the vehicle is recharged immediately
after a trip, at the maximum power when there are no otherrestrictions;
b. Delayed charging: if the dwelling time is longer than the nec-essary charging time, then the charging start time is delayedto make the ending time coincide with the start of the nexttrip;
c. Average charging: the vehicle is recharged at the minimumconstant charging power required for a full SOC using thewhole dwelling time when there are no other restrictions.
Delayed and average charging can be considered as two smartcharging strategies that vary the charging start point, end point andcharging power, but transfer the same total energy to the batteryat the end of the charging period.
4. Results
The analysis determines total fuel consumption, number of coldstarts, instantaneous electricity consumption, and impact on theexisting grid load by varying charging strategies, charging location,time and power. All of the results below account only for the 7860vehicles from the NHTS survey located in the SoCAB.
4.1. Fuel consumption
Fig. 2 shows the total fuel consumption per day forCV, HEV and PHEV having battery capacities ranging from
L. Zhang et al. / Journal of Power Sources 196 (2011) 6559–6566 6561
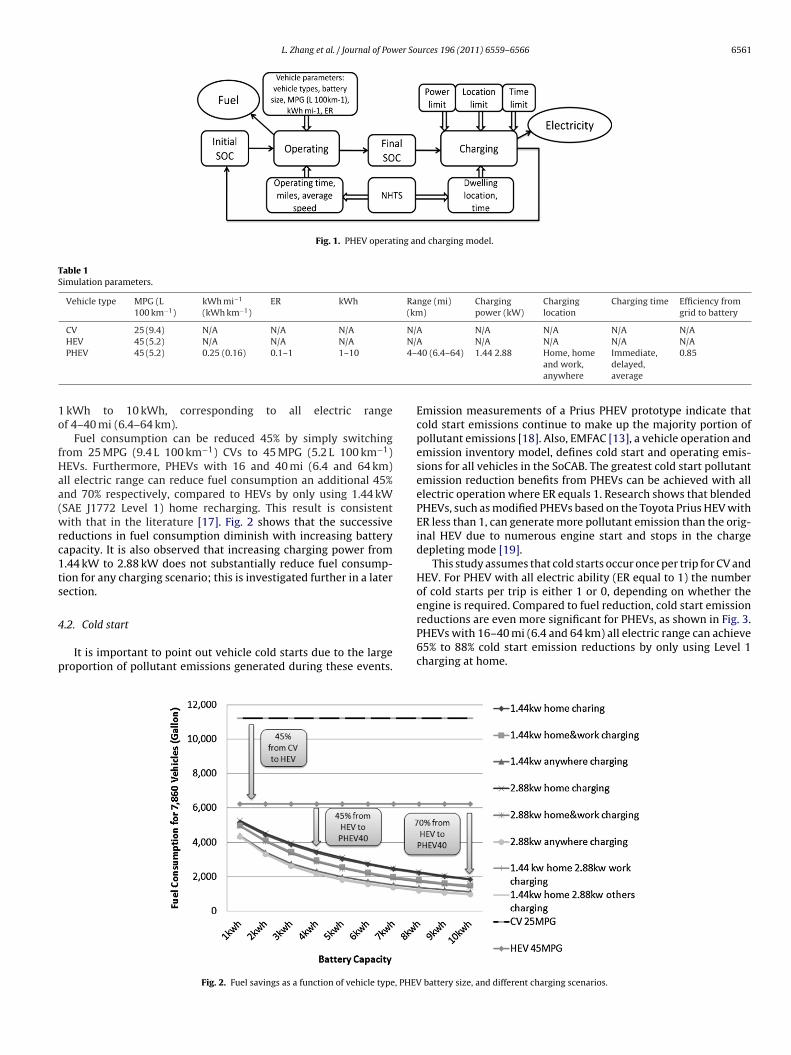
Fig. 1. PHEV operating and charging model.
Table 1Simulation parameters.
Vehicle type MPG (L100 km−1)
kWh mi−1
(kWh km−1)ER kWh Range (mi)
(km)Chargingpower (kW)
Charginglocation
Charging time Efficiency fromgrid to battery
CV 25 (9.4) N/A N/A N/A N/A N/A N/A N/A N/AN/4–
1o
fHaa(wrc1ts
4
p
HEV 45 (5.2) N/A N/A N/APHEV 45 (5.2) 0.25 (0.16) 0.1–1 1–10
kWh to 10 kWh, corresponding to all electric rangef 4–40 mi (6.4–64 km).
Fuel consumption can be reduced 45% by simply switchingrom 25 MPG (9.4 L 100 km−1) CVs to 45 MPG (5.2 L 100 km−1)EVs. Furthermore, PHEVs with 16 and 40 mi (6.4 and 64 km)ll electric range can reduce fuel consumption an additional 45%nd 70% respectively, compared to HEVs by only using 1.44 kWSAE J1772 Level 1) home recharging. This result is consistentith that in the literature [17]. Fig. 2 shows that the successive
eductions in fuel consumption diminish with increasing batteryapacity. It is also observed that increasing charging power from.44 kW to 2.88 kW does not substantially reduce fuel consump-ion for any charging scenario; this is investigated further in a laterection.
.2. Cold start
It is important to point out vehicle cold starts due to the largeroportion of pollutant emissions generated during these events.
Fig. 2. Fuel savings as a function of vehicle type, PHEV
A N/A N/A N/A N/A40 (6.4–64) 1.44 2.88 Home, home
and work,anywhere
Immediate,delayed,average
0.85
Emission measurements of a Prius PHEV prototype indicate thatcold start emissions continue to make up the majority portion ofpollutant emissions [18]. Also, EMFAC [13], a vehicle operation andemission inventory model, defines cold start and operating emis-sions for all vehicles in the SoCAB. The greatest cold start pollutantemission reduction benefits from PHEVs can be achieved with allelectric operation where ER equals 1. Research shows that blendedPHEVs, such as modified PHEVs based on the Toyota Prius HEV withER less than 1, can generate more pollutant emission than the orig-inal HEV due to numerous engine start and stops in the chargedepleting mode [19].
This study assumes that cold starts occur once per trip for CV andHEV. For PHEV with all electric ability (ER equal to 1) the numberof cold starts per trip is either 1 or 0, depending on whether the
engine is required. Compared to fuel reduction, cold start emissionreductions are even more significant for PHEVs, as shown in Fig. 3.PHEVs with 16–40 mi (6.4 and 64 km) all electric range can achieve65% to 88% cold start emission reductions by only using Level 1charging at home.battery size, and different charging scenarios.

6562 L. Zhang et al. / Journal of Power Sources 196 (2011) 6559–6566
Fig. 3. Cold start emission reductions as a function of PHEV battery size and different charging scenarios.
ling ti
4
d
Fig. 4. Distribution of dwel
.3. Charging location and power sensitivity
Fig. 4 shows the distribution of dwelling time for different tripestinations. Average dwelling time is shown in Fig. 5 for differ-
0
2
4
6
8
10
12
Dw
ellin
g Ti
me
(hou
rs)
Fig. 5. Average length of dwelling time by destination activity.
me by destination activity.
ent trip destinations. Home related dwelling time makes up 75% oftotal dwelling time with an average of more than 10 h, while workrelated stops account for just 14% of total dwelling time and anaverage of 6 h. As for the other non-home locations, they accountfor only 11% of the total dwelling time, with most averaging lessthan 2 h. These properties of dwelling locations and correspond-ing average dwelling time lead to the fuel reduction sensitivity ofdifferent charging locations and power.
Fig. 6 shows the sensitivity of fuel consumption ratio to charg-ing scenarios at different locations for Level 1 (1.44 kW) for vehicleshaving battery capacities from 1 kWh to 10 kWh. For each batterycapacity, the fuel consumption for home charging is normalizedas 1. For larger batteries, the trends from ‘home charging’ to ‘any-where charging’ show greater benefits for larger batteries. Whenthe battery capacity increases to 8 kWh, the fuel reduction of “homeand work” and “anywhere” charging is more than 14% and 25%,respectively compared to home charging. These two numbers arethe proportions of dwelling time of work related and non-home
locations on the whole dwelling time, shown in Fig. 4. This resultdemonstrates that larger batteries can enhance the benefit of charg-ing at non-home locations. However, the extra fuel reduction relieson infrastructure improvement at these locations. In a recent sur-
L. Zhang et al. / Journal of Power Sources 196 (2011) 6559–6566 6563
0.6
0.65
0.7
0.75
0.8
0.85
0.9
0.95
1
1.05
ome&arging
Nor
mal
ized
Fue
l con
sum
p�on
Ra�
o
(hom
e ch
argi
ng=1
)
1kwh
2kwh
3kwh
4kwh
5kwh
6kwh
7kwh
8kwh
9kwh
10kwh
consu
vs4a
fpiPftoirl
ditbt
1.44kw home 1.44kwcharging hch
Fig. 6. Charging location sensitivity on fuel
ey conducted to evaluate PHEV infrastructure readiness, resultshow that few respondents found non-home recharge locations:.8% found outlets at work, 2.3% at a store or restaurant, and 9.7%t other locations [20].
In Fig. 2 it is difficult to distinguish the fuel reduction impactrom 1.44 kW to 2.88 kW charging. Similarly, Fig. 7 shows chargingower sensitivity, in which fuel consumption for 1.44 kW charg-
ng is normalized as 1. For both 4 kWh and 8 kWh battery capacityHEVs (PHEV16 and PHEV32), increasing home charging powerrom 1.44 kW up to 7.2 kW can reduce fuel consumption by lesshan 5%, because home related dwelling time is longer than 10 h,n average. When it comes to both home and work related charg-ng, the benefit of faster charging is still less than 10% due to theelatively long average dwelling time, more than 6 h at work relatedocations.
For locations other than home and work due to the shorter
welling time (about 4 h at school and about 2 h or less elsewhere)ncreasing charging power, up to 7.2 kW, decreases fuel consump-ion by 20% when compared to 1.44 kW charging. However, thisenefit relies on higher power circuit upgrades at non-home loca-ions.
0.7
0.75
0.8
0.85
0.9
0.95
1
1.05
1.44kwcharging
2.88kwcharging
4.32kwcharging
Nor
mal
ized
Fue
l Con
sum
p�on
Ra�
o(1
.44
kW=1
)
Fig. 7. Charging power sensitivity on fuel cons
work 1.44kw anywherecharrging
mption for different PHEV battery capacity.
Based on the results presented in Figs. 2, 6 and 7, it is shown thatincreasing battery capacity and utilizing only home charging mayoffer a greater benefit for fuel reduction compared to upgradingnon-home charging infrastructure. However, accurate battery andinfrastructure cost is necessary to provide a more comprehensivecomparison.
4.4. Instantaneous electricity consumption
An important consideration of PHEVs is the instantaneous elec-tricity consumption of the fleet and the corresponding impacton existing grid load. PHEV infrastructure readiness survey datarevealed that 52.4% respondents indentified electrical outlets attheir home within 25 ft (7.6 m) of where a vehicle is parked [20].NEMA 5-15 rated at 1.44 kW is the standard electrical outlet inthe U.S. Consequently, 1.44 kW immediate home charging is the
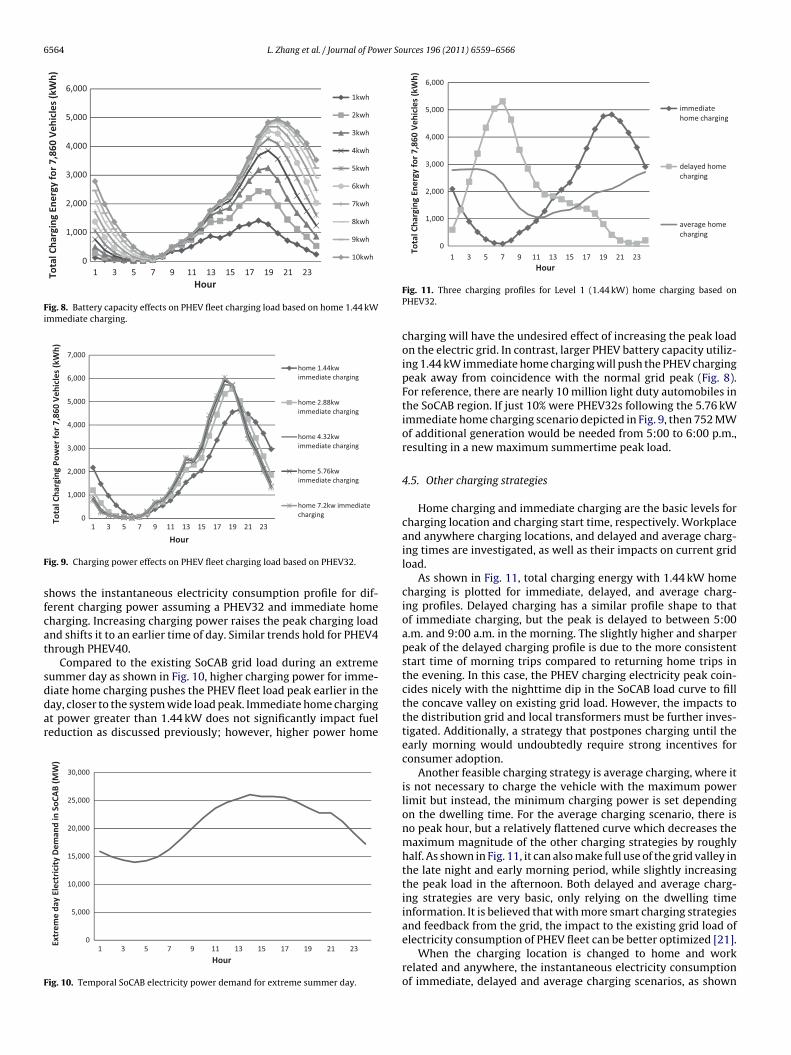
most likely near-term scenario due to the availability of 1.44 kWelectric outlets and a simple charging strategy. Fig. 8 shows theinstantaneous electricity consumption profile for different bat-tery capacities, from PHEV4 to PHEV40. The curve peak is shiftedfrom 6:00 p.m. to 9:00 p.m. with increased battery capacity. Fig. 95.76kwcharging
7.2kwcharging
4kwh ba�eryhome charging
4kwh ba�eryhome&workcharging
4kwh ba�eryanywherecharging
8kwh ba�eryhome charging
8kwh ba�eryhome&workcharging
8kwh ba�eryanywherecharging
umption for different charging locations.
6564 L. Zhang et al. / Journal of Power Sources 196 (2011) 6559–6566
0
1,000
2,000
3,000
4,000
5,000
6,000
2321191715131197531Tota
l Cha
rgin
g En
ergy
for
7,86
0 V
ehic
les
(kW
h)
Hour
1kwh
2kwh
3kwh
4kwh
5kwh
6kwh
7kwh
8kwh
9kwh
10kwh
Fig. 8. Battery capacity effects on PHEV fleet charging load based on home 1.44 kWimmediate charging.
0
1,000
2,000
3,000
4,000
5,000
6,000
7,000
Tota
l Cha
rgin
g Po
wer
for
7,86
0 V
ehic
les
(kW
h)
home 1.44kwimmediate charging
home 2.88kwimmediate charging
home 4.32kwimmediate charging
home 5.76kwimmediate charging
home 7.2kw immediatecharging
F
sfcat
sddar
F
0
1,000
2,000
3,000
4,000
5,000
6,000
2321191715131197531
Tota
l Cha
rgin
g En
ergy
for
7,86
0 V
ehic
les
(kW
h)
immediatehome charging
delayed homecharging
average homecharging
2321191715131197531
Hour
ig. 9. Charging power effects on PHEV fleet charging load based on PHEV32.
hows the instantaneous electricity consumption profile for dif-erent charging power assuming a PHEV32 and immediate homeharging. Increasing charging power raises the peak charging loadnd shifts it to an earlier time of day. Similar trends hold for PHEV4hrough PHEV40.
Compared to the existing SoCAB grid load during an extremeummer day as shown in Fig. 10, higher charging power for imme-
iate home charging pushes the PHEV fleet load peak earlier in theay, closer to the system wide load peak. Immediate home chargingt power greater than 1.44 kW does not significantly impact fueleduction as discussed previously; however, higher power home0
5,000
10,000
15,000
20,000
25,000
30,000
2321191715131197531
Extr
eme
day
Elec
tric
ity
Dem
and
in S
oCA
B (M
W)
Hour
ig. 10. Temporal SoCAB electricity power demand for extreme summer day.
Hour
Fig. 11. Three charging profiles for Level 1 (1.44 kW) home charging based onPHEV32.
charging will have the undesired effect of increasing the peak loadon the electric grid. In contrast, larger PHEV battery capacity utiliz-ing 1.44 kW immediate home charging will push the PHEV chargingpeak away from coincidence with the normal grid peak (Fig. 8).For reference, there are nearly 10 million light duty automobiles inthe SoCAB region. If just 10% were PHEV32s following the 5.76 kWimmediate home charging scenario depicted in Fig. 9, then 752 MWof additional generation would be needed from 5:00 to 6:00 p.m.,resulting in a new maximum summertime peak load.
4.5. Other charging strategies
Home charging and immediate charging are the basic levels forcharging location and charging start time, respectively. Workplaceand anywhere charging locations, and delayed and average charg-ing times are investigated, as well as their impacts on current gridload.
As shown in Fig. 11, total charging energy with 1.44 kW homecharging is plotted for immediate, delayed, and average charg-ing profiles. Delayed charging has a similar profile shape to thatof immediate charging, but the peak is delayed to between 5:00a.m. and 9:00 a.m. in the morning. The slightly higher and sharperpeak of the delayed charging profile is due to the more consistentstart time of morning trips compared to returning home trips inthe evening. In this case, the PHEV charging electricity peak coin-cides nicely with the nighttime dip in the SoCAB load curve to fillthe concave valley on existing grid load. However, the impacts tothe distribution grid and local transformers must be further inves-tigated. Additionally, a strategy that postpones charging until theearly morning would undoubtedly require strong incentives forconsumer adoption.
Another feasible charging strategy is average charging, where itis not necessary to charge the vehicle with the maximum powerlimit but instead, the minimum charging power is set dependingon the dwelling time. For the average charging scenario, there isno peak hour, but a relatively flattened curve which decreases themaximum magnitude of the other charging strategies by roughlyhalf. As shown in Fig. 11, it can also make full use of the grid valley inthe late night and early morning period, while slightly increasingthe peak load in the afternoon. Both delayed and average charg-ing strategies are very basic, only relying on the dwelling timeinformation. It is believed that with more smart charging strategiesand feedback from the grid, the impact to the existing grid load of
electricity consumption of PHEV fleet can be better optimized [21].When the charging location is changed to home and workrelated and anywhere, the instantaneous electricity consumptionof immediate, delayed and average charging scenarios, as shown

L. Zhang et al. / Journal of Power So
0
1,000
2,000
3,000
4,000
5,000
6,000
2321191715131197531Tota
l Cha
rgin
g En
ergy
for
7,86
0 V
ehic
les
(kW
h)
Hour
immediatehome&workcharging
delayedhome&workcharging
averagehome&workcharging
Fig. 12. Three charging profiles for Level 1 (1.44 kW) home and work related charg-ing based on PHEV 32.
0
1,000
2,000
3,000
4,000
5,000
6,000
2321191715131197531Tota
l Cha
rgin
g En
ergy
for
7,86
0 V
ehic
les
(kW
h)
immediateanywherecharging
delayedanywherecharging
averageanywherecharging
FP
iagelcacs
atD
Hour
ig. 13. Three charging profiles for Level 1 (1.44 kW) anywhere charging based onHEV 32.
n Figs. 12 and 13, change in a similar way. Between 9:00 a.m.nd 5:00 p.m., electricity consumption of all three charging strate-ies increases when the charging location is changed from home toverywhere. During the other periods of the day, the trend changesittle with only a slight decrease in magnitude. Unlike home basedharging scenarios, at non-home locations, neither the delayed norverage charging strategy can change the instantaneous electricityonsumption in the time period of 9:00 a.m. to 5:00 p.m.; all haveimilar characteristics in terms of trend and magnitude.
The phenomena can be attributed to the property of people’sctivity. Derived from the travel survey data, Fig. 14 shows the dis-ribution of dwelling vehicles in terms of different trip destinations.aytime, particularly from 9:00 a.m. to 5:00 p.m., is when most
Fig. 14. 24-h distribution of dwelling vehicles for different destinations.
urces 196 (2011) 6559–6566 6565
of the non-home dwelling activities happen, while home dwellingoccurs at different times. Therefore, the electricity consumptionincreases in this period when work related and other locations areadded for charging. On the other hand, as shown in Fig. 5, the aver-age dwelling time at other locations is relatively shorter than home;6 h for work related locations and less than 2 h for other locations,so immediate, delayed and average charging have little impact forwork related and other locations. Other more intelligent chargingstrategies should be evaluated. However, due to the properties ofdwelling time, it is not promising that the electricity consumptionwould change significantly in this time period when non-homecharging locations are added.
5. Conclusions
The energy impact of plug-in hybrid electric vehicles in SoCABhas been evaluated based on NHTS 2009, by analyzing the all elec-tric range and different charging scenarios in a vehicle operationand charging model. The following conclusions are drawn:
The study adopts the SoCAB as an example, but the methodol-ogy, the model, and the NHTS data can be used for other areas.
PHEV16 and PHEV40 can reduce fuel consumption by 45% and70% respectively, compared to the corresponding HEV by onlycharging at home with Level 1 charging at a maximum of 1.44 kW.The cold start criteria pollutant emission reductions are 65% and88%, respectively.
Increasing charging locations to anywhere at 1.44 kW can savemore fuel (up to 35% for PHEV32) compared to only home chargingat 1.44 kW. Increasing charging power to 7.2 kW at home, homeand work related locations, and anywhere can reduce fuel con-sumption by less than 5%, 10% and 20% for PHEV 32 compared to1.44 kW charging at these three locations. Considering the massiveinstallation of infrastructure that would be required for high power,non-home charging locations, large batteries with home 1.44 kWcharging show the potential for considerable fuel reduction withminimal infrastructure investment.
Immediate home charging results in an electricity demand peakfrom 6:00 p.m. to 9:00 p.m., averaging less than 1 kW per vehi-cle. Increasing immediate home charging power from 1.44 kW to7.2 kW would undesirably shift the peak hour closer to the existinggrid peak.
By knowing the starting time of the next trip, delayed and aver-age charging strategies can be implemented having the same fuelreduction as immediate charging, but different instantaneous elec-tricity consumption impacts. For home related locations, delayedcharging can move the PHEV charging peak hour to the morning toavoid the existing grid peak time, smooth the PHEV consumptioncurve, and decrease the PHEV demand peak load by 50%.
Charging at non-home locations adds to the existing peak gridload during daytime, between 9:00 a.m. and 5:00 p.m. Immediate,delayed, and average charging show similar results in this period.It is not likely to eliminate this drawback by using more intelli-gent charging strategies due to the property of people’s driving anddwelling activity.
Acknowledgements
This work is associated with the California Clean MobilityPartnership, a collaborative program between the Berkeley andIrvine campuses of the University of California, supported by the
California Air Resources Board under the Alternative Fuel Incen-tive Program (AFIP) enacted as part of California State AssemblyBill 1811 and by Toyota Motor Engineering & ManufacturingNorth America, Inc. The authors greatly appreciate assistance andresources provided by Toyota.
6 er So
R
[
[
[
[
[
[
[
[
[
[
01-0283, 2007.[20] Jonn Axsen, Ken Kurani, The Early U.S. Market for PHEVs: Anticipating Con-
566 L. Zhang et al. / Journal of Pow
eferences
[1] M. John, German, Hybrid Powered Vehicle, 2003, ISBN: 978-0-7680-1310-8.[2] SAE, Recommended Practice for Measuring the Exhaust Emissions and Fuel
Economy of Hybrid-Electric Vehicles, Including Plug-in Hybrid Vehicles, SAEStandard J1711, 2010.
[3] Michael Kintner-Meyer, Kevin Schneider, Robert Pratt, Impacts Assessment ofPlug-in Hybrid Vehicles on Electric Utilities and Regional U.S. Power Grids,Pacific Northwest National Laboratory, 2006.
[4] R. Graham, Comparing the Benefits and Impacts of Hybrid Electric VehicleOptions, EPRI, Palo Alto, CA, 2001.
[5] K. Parks, P. Denholm, T. Markel, Costs and Emissions Associated with Plug-InHybrid Electric Vehicle Charging in the Xcel Energy Colorado Service Territory,NREL, NREL/TP-640-41410, 2007.
[6] Jeffrey Gonder, Tony Markel, Energy Management Strategies for Plug-In HybridElectric Vehicles, SAE Paper, 2007-01-0290, 2007.
[7] H. Bradley Thomas, W. Quinn Casey, Analysis of plug-in hybrid electric vehicleutility factors, Journal of Power Sources 195 (2010) (2010) 5399–5408.
[8] Stephanie Stockar, Pinak Tulpule, Vincenzo Marano, Giorgio Riz-zoni, Energy, Economical and Environmental Analysis of Plug-InHybrids Electric Vehicles Based on Common Driving Cycles, SAE Paper,2009-24-0062, 2009.
[9] Richard “Barney” Carlson, Michael Duoba, Neeraj Shidore, Drive Cycle Fuel
Consumption Variability of Plug-In Hybrid Electric Vehicles Due to AggressiveDriving, SAE Paper, 2009-01-1335, 2009.10] Constantine Samaras, Kyle Meisterling, Environmental Science and Technology42 (9) (2008) 3170–3176.
11] Saeid Bashash, Scott J. Moura, Joel C. Forman, Hosam K. Fathy, Journal of PowerSources 196 (2011) (2011) 541–549.
[
urces 196 (2011) 6559–6566
12] Jee E. Kang, W.W. Recker, Transportation Research Part D 14 (2009) (2009)541–556.
13] California Environmental Protection Agency Air Resources Board, EMFAC, avail-able at: http://www.arb.ca.gov/msei/onroad/latest version.htm.
14] U.S. Department of Transportation Federal Highway Administration,2009 National Household Travel Survey, available at: http://nhts.ornl.gov/download.shtml#2009.
15] California Environmental Protection Agency Air Resources Board, CaliforniaExhaust Emission Standards and Test Procedures for 2009 and SubsequentModel Zero-Emission Vehicles and Hybrid Electric Vehicles, in the Passen-ger Car, Light-Duty Truck and Medium-Duty Vehicle Classes, available at:http://www.arb.ca.gov/msprog/levprog/test proc.htm.
16] E.D. Tate, Peter J. Savagian, The CO2 Benefits of Electrification E-REVs, PHEVsand Charging Scenarios, SAE Paper, 2009-01-1311, 2009.
17] T. Markel, K. Smith, A. Pesaran, Presented at EVS-24 International Battery,Hybrid and Fuel Cell Electric Vehicle Symposium Stavanger, Norway, May13–16, 2009, 2009.
18] D. Allgood, T. Brown, S. Samuelsen, International Journal of Engine Research 11(2010).
19] Richard W. Carlson, Michael J. Duoba, Theodore P. Bohn, Anantray D. Vyas,Testing and Analysis of Three Plug-in Hybrid Electric Vehicles, SAE Paper, 2007-
sumer Awareness, Recharge Potential, Design Priorities and Energy Impacts,UCD-ITS-RR-08-22, 2008.
21] H. Jansen Karel, M. Brown Tim, G. Scott Samuelsen, Journal of Power Sources195 (16) (2010) 5409–5416.