fuel volume versus - home:...
TRANSCRIPT

Fuel Volume versus Weight
Effective March 2011
1st | Edition �

Fuel Volume versus Weight
Final Report
TASK FORCE REPORT Effective March 2011
IATA TECHNICAL FUEL GROUP (TFG)
TASK FORCE
International Air Transport Association Montreal – Geneva
1st | Edition

D ISCLAIMER
The information contained in this publication is subject to constant review in the light of changing government requirements and regulations. No subscriber or other reader should act on the basis of any such information without referring to applicable laws and regulations and/or without taking appropriate professional advice. Although every effort has been made to ensure accuracy, the International Air Transport Association shall not be held responsible for loss or damage caused by errors, omissions, misprints or misinterpretation of the contents hereof. Furthermore, the International Air Transport Association expressly disclaims all and any liability to any person, whether a purchaser of this publication or not, in respect of anything done or omitted, and the consequences of anything done or omitted, by any such person in reliance on the contents of this publication. No part of the Volume versus Weight may be reproduced, recast, reformatted or transmitted in any form by any means, electronic or mechanical, including photocopying, recording or any information storage and retrieval system, without the prior written permission from:
Senior Vice President, Safety, Operations & Infrastructure
International Air Transport Association 800 Place Victoria
P.O. Box 113 Montreal, Quebec
CANADA H4Z 1M1
Fuel Volume versus Weight IATA Technical Fuel Group (TFG) Task Force © 2011 International Air Transport Association. All rights reserved. Montreal - Geneva

Results & Discussion
iii | P a g e
Acknowledgements IATA extends its thanks to all the Task Force members who spontaneously contributed their time and talent in the main investigative effort and the numerous consultation sessions that led to this report. Special thanks to the Chairman of the Task Force, Dan Maslowski of Commport Aerospace Services Ltd. who took over the task from Rim Najeh of Air France and led and diligently coordinated the work of the Task Force and the contributions from a large and diverse group of companies and specialists. Additionally, the Task Force thanks Tracy Boval of Synapteryx, Inc. for assisting in the final editing of the report. The contributors to this report and the companies they represent are listed below:
Baljet Michel IATA Farmery Mike Shell Aviation Flick Kevin UPS Freeman David ASIG Rios Galvan Alejandro ASA Ginkel Van Arjan Micro-Motion Gore Daniel Anton Paar Gunduz Resat Turkish Airlines Inc. Harris Greg Audit Air Inc. Hernandez De Gerencia ASA Huber Natascha Anton Paar Jones A. Chris Exxon Mobil Aviation Jones Michael Boeing Koch Jim Micro-Motion Maschler Eva Austrian Airlines Mashimoto Yukio Japan Airlines Maslowski Dan - Chairman Task Force Commport Aerospace Services Ltd. Najeh Rim Air France Schulze Marko Skytanking Smith Rick Integrated Sensing Systems Inc. Tscharland Raphael SWISS Walker Ross Airbus Ulloa, Rommy IATA Zombanakis P. George Continental Airlines

TASK FORCE REPORT
iv | P a g e
TABLE OF CONTENT ACKNOWLEDGEMENTS .................................................................................................................. III� SECTION 1 -SUMMARY .................................................................................................................... 1�REDUCES HUMAN ERROR; GIVES MORE REPRESENTATIVE INFORMATION OF FUEL UPLIFTED 1�A MECHANISM TO REDUCE AIRCRAFT OVER-FUELLINGS ........................................................... 1�
Recommendation�1:�..............................................................................................................................�3�
Recommendation�2:�..............................................................................................................................�3�
Recommendation�3�...............................................................................................................................�3�
Recommendation�4:�..............................................................................................................................�3�
SECTION 2 – RESULTS & DISCUSSION ............................................................................................ 4�2.1� Background�...............................................................................................................................�4�
2.2� Equipment�Overview�&�Experimental�Design�Summary�..........................................................�4�
2.3� Results�.......................................................................................................................................�7�
2.3.1� Discussion�Point�1:��Equipment�ComparisonsͲAdvantages/Disadvantages�........................�10�
2.3.2� Discussion�Point�2:��Aircraft�OverͲFuelling�Observations�...................................................�10�
2.3.3� Discussion�Point�3:�Cost�Benefit�Analysis�............................................................................�11�
SECTION 3 – CONCLUSIONS & RECOMMENDATIONS ................................................. 14�3.1� Conclusion�#1:��Potential�to�Reduce�Human�Error;�Provides�More�Representative�Information�of�Fuel�Uplifted�........................................................................................................................................�14�
3.2�Conclusion�#2:��New�Equipment�Types�Provides�Mechanism�to�Reduce�Aircraft�OverͲFuellings�14�
3.3�Conclusion�#3:��Likely�to�Satisfy�the�EU�Carbon�Emissions�Trading�Measurement�Requirements�............................................................................................................................................................�14�
3.4��Conclusion�#4:��Economic�Benefit�for�New�Equipment�...............................................................�15�
SECTION 4 – DEFINITION OF TERMS ACRONYMS .................................................................... 16��SECTION 5 – REFERENCES ................................................................................................... 19� SECTION 6 – APPENDICES ..................................................................................................... 20�
Results & Discussion
1 | P a g e
SECTION 1 - SUMMARY
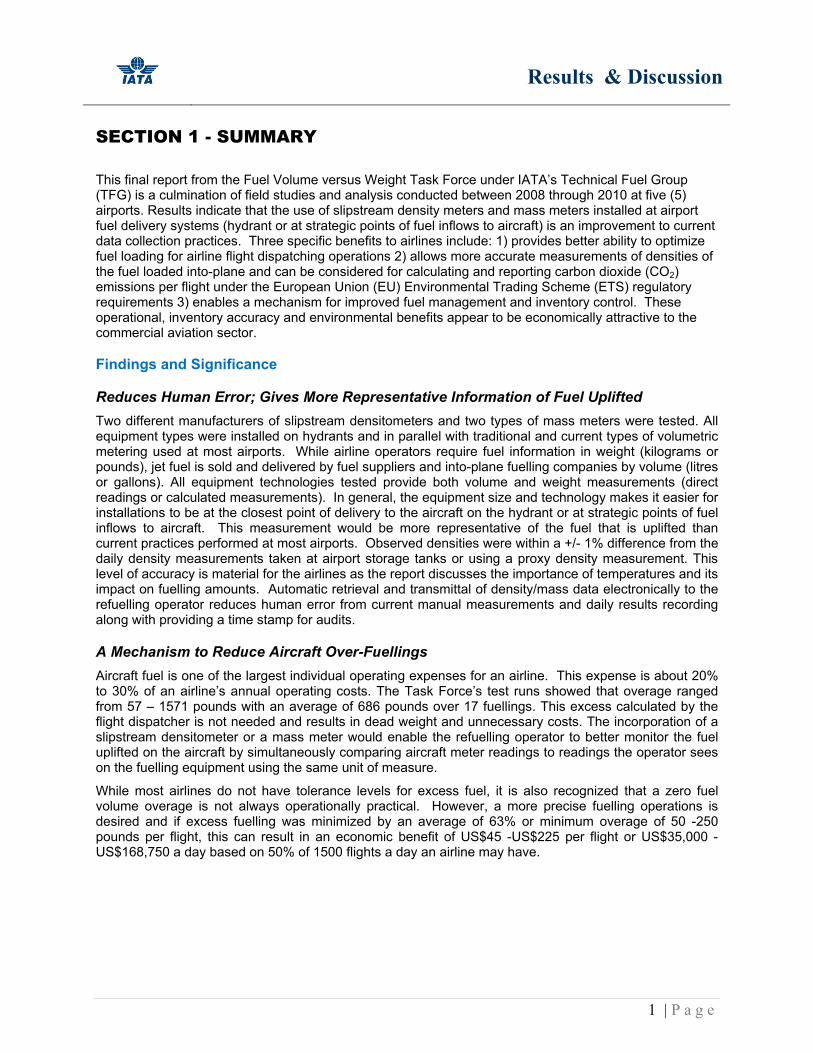
This final report from the Fuel Volume versus Weight Task Force under IATA’s Technical Fuel Group (TFG) is a culmination of field studies and analysis conducted between 2008 through 2010 at five (5) airports. Results indicate that the use of slipstream density meters and mass meters installed at airport fuel delivery systems (hydrant or at strategic points of fuel inflows to aircraft) is an improvement to current data collection practices. Three specific benefits to airlines include: 1) provides better ability to optimize fuel loading for airline flight dispatching operations 2) allows more accurate measurements of densities of the fuel loaded into-plane and can be considered for calculating and reporting carbon dioxide (CO2) emissions per flight under the European Union (EU) Environmental Trading Scheme (ETS) regulatory requirements 3) enables a mechanism for improved fuel management and inventory control. These operational, inventory accuracy and environmental benefits appear to be economically attractive to the commercial aviation sector. Findings and Significance
Reduces Human Error; Gives More Representative Information of Fuel Uplifted Two different manufacturers of slipstream densitometers and two types of mass meters were tested. All equipment types were installed on hydrants and in parallel with traditional and current types of volumetric metering used at most airports. While airline operators require fuel information in weight (kilograms or pounds), jet fuel is sold and delivered by fuel suppliers and into-plane fuelling companies by volume (litres or gallons). All equipment technologies tested provide both volume and weight measurements (direct readings or calculated measurements). In general, the equipment size and technology makes it easier for installations to be at the closest point of delivery to the aircraft on the hydrant or at strategic points of fuel inflows to aircraft. This measurement would be more representative of the fuel that is uplifted than current practices performed at most airports. Observed densities were within a +/- 1% difference from the daily density measurements taken at airport storage tanks or using a proxy density measurement. This level of accuracy is material for the airlines as the report discusses the importance of temperatures and its impact on fuelling amounts. Automatic retrieval and transmittal of density/mass data electronically to the refuelling operator reduces human error from current manual measurements and daily results recording along with providing a time stamp for audits.
A Mechanism to Reduce Aircraft Over-Fuellings Aircraft fuel is one of the largest individual operating expenses for an airline. This expense is about 20% to 30% of an airline’s annual operating costs. The Task Force’s test runs showed that overage ranged from 57 – 1571 pounds with an average of 686 pounds over 17 fuellings. This excess calculated by the flight dispatcher is not needed and results in dead weight and unnecessary costs. The incorporation of a slipstream densitometer or a mass meter would enable the refuelling operator to better monitor the fuel uplifted on the aircraft by simultaneously comparing aircraft meter readings to readings the operator sees on the fuelling equipment using the same unit of measure.
While most airlines do not have tolerance levels for excess fuel, it is also recognized that a zero fuel volume overage is not always operationally practical. However, a more precise fuelling operations is desired and if excess fuelling was minimized by an average of 63% or minimum overage of 50 -250 pounds per flight, this can result in an economic benefit of US$45 -US$225 per flight or US$35,000 - US$168,750 a day based on 50% of 1500 flights a day an airline may have.

TASK FORCE REPORT
2 | P a g e
Likely to Satisfy the EU Carbon Emissions Trading Measurement Requirements
The EU’s ETS Carbon Emissions reporting requires the aviation industry to commence participation starting January 2012. While the final details for regulatory requirements are still to be determined, it is believed that the ETS’s Monitoring, Reporting and Verification (MRV) requirements will necessitate equipment measurement and reporting capability accuracies to the 3rd decimal place of a density measurement or have an equivalent tight tolerance. It is anticipated that EU authorities will likely require actual densities of fuel uplifted. In addition, it is believed that electronic capture and transmission of data is likely to be the preferred protocol satisfying MRV requirements.
The accuracy and sensitivity of density measurements are environmentally and financially important. An example of this is a calculation using a standard density of 0.800 g/mL and a measured density of 0.795g/mL of one billion litres of fuel a year (17,000 barrels of jet fuel per day). A mere 0.005 g/mL difference equates to over-reporting of an annual fifteen thousand seven hundred fifty (15,750) tons of CO2 emitted. With a cost of fifteen (15) euros per ton of CO2 emitted, this equates to two hundred and fourth-thousand (240,000) euros (US$ 312,000) per year that an airline would be obligated to pay due to not choosing to measure at better accuracy levels. Conversely, if measured density is 0.005 greater than the standard density i.e. 0.805, then this could result in under-reporting which might likely trigger other regulatory consequences.
One More Step Towards Better Fuel Management and Inventory Control for Airlines For airlines who buy fuel at-airport (not into-wing) and is common in the United States, fuel inventory balancing is a primary operating focus area of importance post each aircraft fuelling. Airlines use the weight of fuel as key parameter to determine proper operation for each flight and for balancing for inventory control. Specific improvements such as the slipstream densitometers or mass meters to measure fuel weight uplifted and cross-referencing it to the amount of fuel in the aircraft fuel tanks furthers a more meaningful fuel stock reconciliation for inventory control management. The errors inherent in using conversion factors to calculate equivalent volumes of fuel from the weight of fuel would be eliminated and weight would be directly correlated for fuel management balancing. Current airline practice at airport for airport purchased fuel (excludes into-wing):
Improved airline practice using direct in-field measurements at airport (excludes into-wing):
Amount of fuel aircraft
requires for route (weight)
Calculate volume of fuel uplifted
from weight
Compare with the amount of fuel
purchased (volume)
Compare to the balance of fuel that
should be available in inventory in airport
tank (volume)
Amount of fuel aircraft
requires for route (weight)
Recalculate weight to volume &
compare with the amount of fuel
purchased (volume)
Measure actual fuel uplifted with densitometer or mass meters to amt. requested
(weight)
Compare to the balance of fuel that
should be available in inventory in airport
tank (weight)
Results & Discussion
3 | P a g e
The following report further discusses all items above including general equipment characteristics, its installations in field trials and analysis of these measurements compared to those used per current practices at the following airports: Vienna (VIE), Newark (EWR), Mexico City (MEX), Cancun (CUN).and Cleveland (CLE). Recommendations The Task Force suggests four (4) recommendations be implemented.
Recommendation 1: On new hydrant systems and/or hydrant refuelling vehicles, install inline Coriolis mass meters that provide both weight and volumetric measurement readings. This new measuring system capability will aid in better fuel management, environmental regulatory reporting and cost savings.
Recommendation 2: On current hydrant systems and/or hydrant refuelling vehicles, install slipstream densitometers as an adjunct to current measurement systems. This will aid in better fuel management, environmental regulatory reporting and likely enhance cost savings.
Recommendation 3:
The industry technical and specification bodies such as the Society of Automotive Engineers (SAE) should complete the development of standardized reference testing methodology for density meter calibration for the aviation sector.
Recommendation 4: The industry’s on-airport fuel systems standards/guidelines should be updated by its authors like the Air Transport Association (ATA), Joint Inspection Group, Inc. (JIG) and the IATA Fuel Quality Pool (IFQP) to acknowledge that the accuracy requirements are the same for mass meters and volumetric meters as primary metering systems.

TASK FORCE REPORT
4 | P a g e
Figure 1: Handheld Densitometer Figure 2: Hydrometer
SECTION 2 – RESULTS & DISCUSSION
2.1 Background Aviation turbine fuel is typically purchased and dispensed in volumetric units of measure (gallons or litres). Gross volumes of fuel are not corrected for temperature variation. However, it is mass or weight which the airlines require to determine the amount of energy in the fuel needed for each flight. Therefore, measurements of mass, weight, density or API gravity are key monitoring parameters. Current practices include fuel quality comparison checks of density or API gravity by fuel suppliers and refuelling operators which are checked against an airport storage tank density measurement taken typically once per day in the early morning. For flight dispatching, aircraft operators also require weight measurements (pounds or kilograms) to determine fuel inventory and trim (aircraft weight balancing). The aircraft’s fuel tank’s densitometers are used for this purpose which measures the fuel density of the total inventory onboard including fuel from the last flight. The airline only uses the fuel suppliers’ measurement as a cross-check. In 2007, IATA TFG formed a Task Force to identify alternative measurement systems for weight (density or mass) and then field test it against currently used systems. Evaluations would determine the impact on managing on-aircraft fuel inventories and determine its utility for airline compliance with the European Union’s (EU) Emission Trading Scheme’s (ETS) carbon emissions reporting that commences in 2012. As methods and practices used for fuel purchasing and delivery measurements in volume would not be affected by this Task Force, further evaluations of country regulations and reporting requirements used to calculate excise tax or other commerce related activities were not studied.
2.2 Equipment Overview & Experimental Design Summary Volumetric fuel systems are currently the primary measuring system used at most airports worldwide. Equipment installed at airports on hydrant systems or refuelling vehicles follow mechanical tolerance limits, calibration and other protocols specified in industry requirements stated in documents such as ATA 103, JIG 1 and IATA’s IFQP Manual. These systems remained the primary system as the point of reference for the Task Force’s installed density and mass meters. Most airports measure density or API gravity of jet fuel by taking manual measurements by a handheld, portable densitometer with digital readout (figure 1) or a hydrometer (figure 2).

Results & Discussion
5 | P a g e
The approved testing methodologies and requirements are defined by the airport requirements for fuel in the industry documents stated above. This data was used to compare the differences with real-time densities obtained during refuelling. Two different mass meters and two slipstream densitometers were used in the field tests and installed as secondary measurements to the current systems. The manufacturers and installation locations are listed in Table I. All equipment installations included electronic data readouts.
Table I: Type of Density/Mass Meters Evaluated and Location Installed On-Airport
Installations of electronic slipstream density equipment and mass meters are shown in Figures 3-5. Figure 3: Anton-Paar at Vienna Airport Figure 4: ISSYS at Cleveland Airport
Figure 5: Coriolis Meter in Mexico
Equipment Type Manufacturer Installation Location Coriolis Mass Meter- CMF300 Micro Motion Hydrant refueler Coriolis Mass Meter-Promass F Endress+Hauser Hydrant refueler Slipstream Densitometer ISSYS Hydrant refueler & hydrant Slipstream Densitometer- L-Dens 427
Anton Paar Hydrant refueler

TASK FORCE REPORT
6 | P a g e
Coriolis mass meters are widely used in the chemical & petrochemical (43%) industries along with food & beverage (13%) and oil & gas (8%) with a high degree of reliability and accuracy. A mass meter’s data output is not affected by temperature or pressure variations. The mass meters were calibrated and proved according to manufacturer requirements. The meters were not compared against each other but output was compared to the current volumetric measurements. Typical accuracies of mass meters are within 0.1% for flow rates of forty five (45) gallons per minute (gpm) or one hundred sixty (160) liters per minute (lpm) to eight hundred fifty (850) gpm or three thousand one hundred (3,100) lpm. Mass meters not only measure mass directly but also density. Slipstream electronic densitometers are also widely used in many industry applications including jet fuel by fuel suppliers and pipeline operators of refined petroleum product distribution. Density multiplied by volume results in weight. The main focus of this study was to compare the real-time density data against the daily fuel storage density measurements. Figure 6 shows good correlation between the two selected densitometers and a traditional hydrometer. Figure 6: Density vs Temperature Between Density Meters Scheduled maintenance of the densitometers included running a reference standard like isopropyl alcohol (IPA) compared against the displayed value. Recommendations for new industry protocols for maintenance of these densitometers are underway through the SAE 5 Technical group. Density of fuel varies with temperature during a typical day and there is an inverse relationship which means that as temperature increases the density of a fuel decreases. Since ambient air temperatures vary throughout the day as seen in figure 7, the differences in daily densities taken only once per day and the real-time densities for fuel loaded were critical to the evaluation.

Results & Discussion
7 | P a g e
Figure 7: Relationship of Density v.s. Temperature Effects During the Day Equipment installations and field tests were completed at five (5) airports, Vienna (VIE), Newark (EWR), Mexico City (MEX), Cancun (CUN) and Cleveland (CLE). The only criteria for the airport selections were that the airport’s main fuel delivery mechanism was a hydrant system and that local authorities were consulted about the test runs. A large dataset was necessary to study the effects of seasonal weather changes, variation of daily ambient temperatures against instrument performance. Table II describes the testing timeframes and the equipment installed and evaluated.
Table II: Experiment Timeframes, Locations and Equipment Type
Airport Testing Timeframe Equipment Type
Vienna (VIE) 2010 (May – Dec) Slipstream Densitometer Newark (EWR) 2009 (Jul- Dec) Slipstream Densitometer Mexico City (MEX) 2008 (May-Jul ) Mass Meter Cancun (CUN) 2008 (May-Jul) Mass Meter Cleveland (CLE) 2010 (Oct- Dec) Slipstream Densitometer
2.3 Results
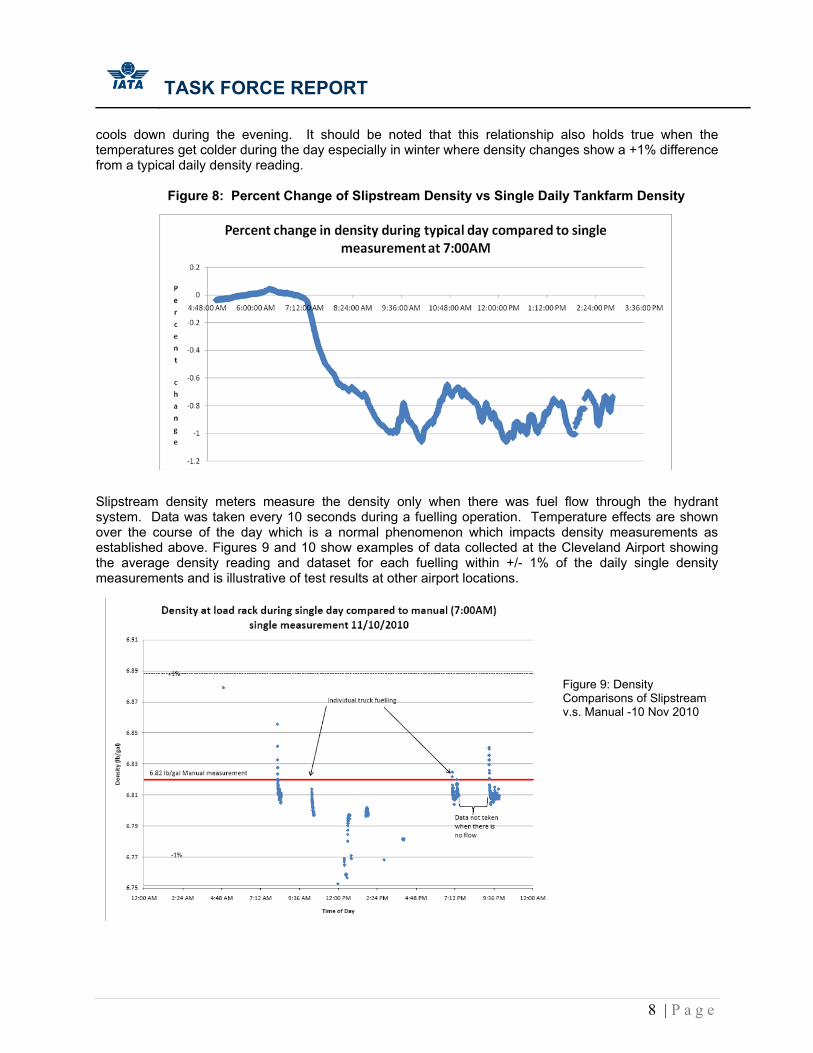
Results from five (5) airports consistently demonstrated that electronic data sensors for mass or density were consistently within +/- 1% of the daily manual density reading typically taken only once per day. This finding is a result observed from approximately one thousand (1000) aircraft refuels collected during the study. Figure 8 shows this percent change of density when ambient temperatures are typically cooler in the early morning and warms mid-morning to a constant temperature until the temperature naturally
TASK FORCE REPORT
8 | P a g e
cools down during the evening. It should be noted that this relationship also holds true when the temperatures get colder during the day especially in winter where density changes show a +1% difference from a typical daily density reading.
Figure 8: Percent Change of Slipstream Density vs Single Daily Tankfarm Density
Slipstream density meters measure the density only when there was fuel flow through the hydrant system. Data was taken every 10 seconds during a fuelling operation. Temperature effects are shown over the course of the day which is a normal phenomenon which impacts density measurements as established above. Figures 9 and 10 show examples of data collected at the Cleveland Airport showing the average density reading and dataset for each fuelling within +/- 1% of the daily single density measurements and is illustrative of test results at other airport locations.
Figure 9: Density Comparisons of Slipstream v.s. Manual -10 Nov 2010

Results & Discussion
9 | P a g e
-------- Daily Tankfarm Density ------- Slipstream Density
Figure 10: Density Comparisons of Slipstream v.s. Manual -5 Dec 2010
Density measurements over different times of the year fluctuate but slipstream measuring systems show close agreement (within +/- 1%) of the single daily tankfarm measurement as shown in Figure 11.
Figure 11: Typical Seasonal Differences of Density (Kg/m3) Comparisons May thru Oct 2010 – Vienna Airport
TASK FORCE REPORT
10 | P a g e
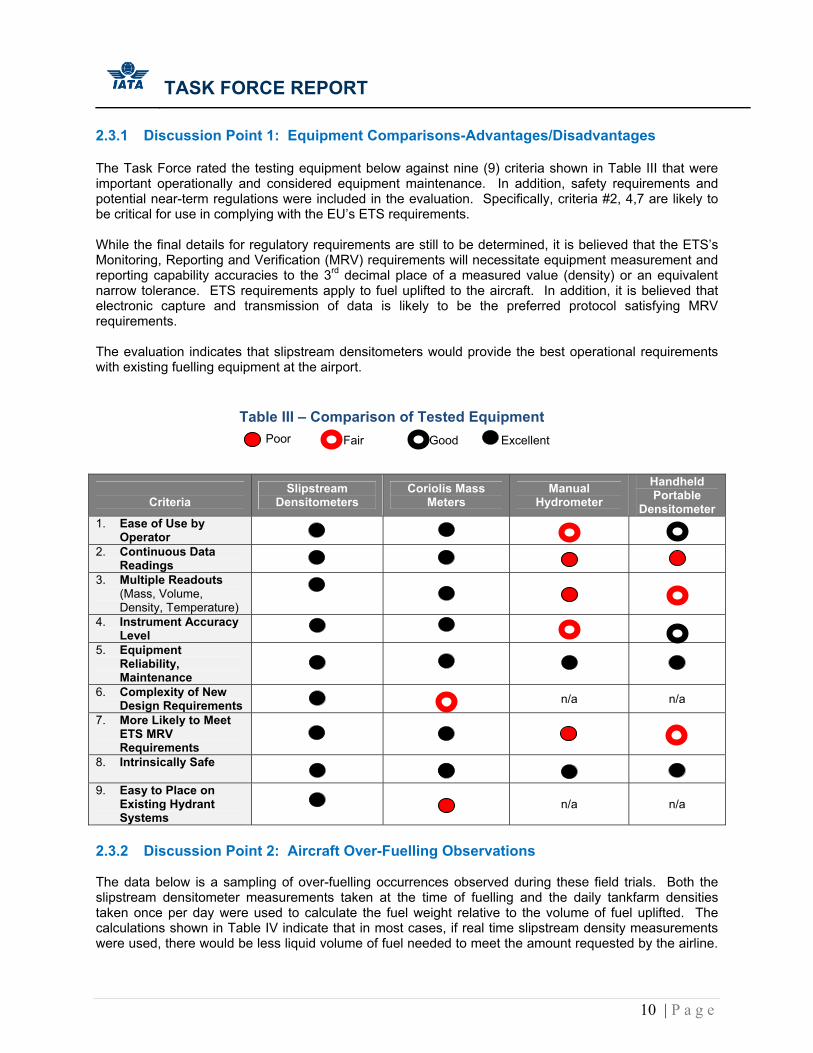
2.3.1 Discussion Point 1: Equipment Comparisons-Advantages/Disadvantages The Task Force rated the testing equipment below against nine (9) criteria shown in Table III that were important operationally and considered equipment maintenance. In addition, safety requirements and potential near-term regulations were included in the evaluation. Specifically, criteria #2, 4,7 are likely to be critical for use in complying with the EU’s ETS requirements. While the final details for regulatory requirements are still to be determined, it is believed that the ETS’s Monitoring, Reporting and Verification (MRV) requirements will necessitate equipment measurement and reporting capability accuracies to the 3rd decimal place of a measured value (density) or an equivalent narrow tolerance. ETS requirements apply to fuel uplifted to the aircraft. In addition, it is believed that electronic capture and transmission of data is likely to be the preferred protocol satisfying MRV requirements. The evaluation indicates that slipstream densitometers would provide the best operational requirements with existing fuelling equipment at the airport.
Table III – Comparison of Tested Equipment
Criteria
Slipstream Densitometers
Coriolis Mass Meters
Manual Hydrometer
Handheld Portable
Densitometer 1. Ease of Use by
Operator
2. Continuous Data Readings
3. Multiple Readouts (Mass, Volume, Density, Temperature)
4. Instrument Accuracy Level
5. Equipment Reliability, Maintenance
6. Complexity of New Design Requirements n/a n/a
7. More Likely to Meet ETS MRV Requirements
8. Intrinsically Safe
9. Easy to Place on Existing Hydrant Systems
n/a n/a
2.3.2 Discussion Point 2: Aircraft Over-Fuelling Observations The data below is a sampling of over-fuelling occurrences observed during these field trials. Both the slipstream densitometer measurements taken at the time of fuelling and the daily tankfarm densities taken once per day were used to calculate the fuel weight relative to the volume of fuel uplifted. The calculations shown in Table IV indicate that in most cases, if real time slipstream density measurements were used, there would be less liquid volume of fuel needed to meet the amount requested by the airline.
Poor Good Excellent Fair

Results & Discussion
11 | P a g e
Out of seventeen occurrences at two different airports, the range of overages was 57 – 1571 pounds with an average of 686 pounds. Fuel overages are important for both load balancing and fuel management. Aircraft manufacturers require aircraft load balancing to be within 4%. Densitometers installed in the aircraft fuel tanks are accurate to within 0.5% - 2%. Depending on the airline’s requirements, some aircraft are enabled with density readings in the cockpit which is used to calculate the fuel weight. An airline may also opt to use the standard density of 800 kg/m3 for their fuel inventory calculations for flight dispatching. Airlines can also cross-check the fuel weight with a calculation using the daily tankfarm density measurement although it falls short of being a more real-time measurement of the fuel uplifted into the aircraft. The testing observations show that this can create an inaccurate perception and overconfidence of the fuelling operation’s preciseness. In addition to aircraft load balancing, fuel management is a critical cost control parameter and over-fuelling is undesirable. Minimum tolerances for overages are managed by each airline with their fuel supplier as there is no common industry standard or guidance. Table IV: Over-Fueled Amount Comparisons Using Different Densities
Fuelling Occurrences
Fuel Uplifted (Litres)
Over-fueled Amount (Slipstream
Densitometer) Pounds (kg)
Over-fueled Amount (Tankfarm Density)
(kg)
Over-fueled Amount
(Std Density) (kg)
2 Oct 2010 99,960 385 (175) 24 1368 12 Jun 2010 72,353 739 (336) 274 582 11 Jun 2010 53,766 1571 (714) 781 913 10 Jun 2010-1 93,341 1085 (493) 388 473 10 Jun 2010-2 4,777 57 (26) 38 42 10 May 2010 96,032 1496 (680) 497 1226 9 May 2010 58,187 682 (310) 186 650 4 May 2010 44,555 1322 (601) 551 944 10 Jul 2009-1 6,026 495 (225) 10 Jul 2009-2 9,191 111 (50) 9 Jul 2009-1 33,073 735 (333) 9 Jul 2009-2 22,183 281 (127) 9 Jul 2009-3 46,807 443 (201) 9 Jul 2009-4 115,781 1262 (572) 9 Jul 2009-5 28,663 329 (149) 9 Jul 2009-6 22,735 589 (267) 8 Jul 2009 27,690 85 (39)
Range (pounds) 57 - 1571 Ave. (pounds) 686
2.3.3 Discussion Point 3: Cost Benefit Analysis A simple cost benefit analysis for the use of slipstream densitometers or mass meters is completed below. The analysis shows that slipstream densitometers, which can be installed on currently used refuelling equipment to run in tandem, can have a cost to benefit of about 1:66. Simplistically, this means that for every $1 spent, you could expect about $66 in returned value. Costs assessed include estimating calibration and maintenance costs/frequencies, estimates for equipment reliability, accounting for equipment run-life and potential costs for potential software upgrade.

TASK FORCE REPORT
12 | P a g e
See appendix for detailed information. Benefits assessed focused on those listed by the Task Force in this report. This included cost savings associated with reducing the fuel amount uplifted by using real-time densities and environmental compliance with better cost accuracies on CO2 emissions and avoidance of other possible penalties.
Cost savings from Over-fuelling While most airlines do not have tolerance levels for excess fuel, it is also recognized that a zero fuel volume overage is not always operationally practical. A more precise fuelling operations is desired and if excess fuelling was to minimum overage of 50 -250 pounds per flight, this can result in an economic benefit of US$45 -US$225 per flight or US$35,000 - US$168,750 a day based on 50% of 1500 flights per day an airline may have.
Cost accuracy with EU ETS CO2 Reporting and Compliance Penalty Avoidance
The accuracy and sensitivity of density measurements are environmentally and financially important. An example of this is a calculation using a standard density of 0.800 g/mL and a measured density of 0.795g/mL of one billion litres of fuel a year (17,000 barrels of jet fuel per day). A mere 0.005 g/mL difference (0.6%) equates to over-reporting of an annual fifteen thousand seven hundred fifty (15,750) tons of CO2 emitted. With a cost of fifteen (15) euros per ton of CO2 emitted, this equates to two hundred and fourth-thousand (240,000) euros (US$ 312,000) per year that an airline would be obligated to pay due to not choosing to measure at better accuracy levels. Note that lower than average densities occur in areas that have higher temperatures i.e. regularly in tropical and subtropical countries.
Conversely, if measured density is 0.005 g/mL greater than the standard density i.e. 0.805 g/mL, then this could result in under-reporting which might likely trigger other regulatory consequences. Penalties can be assessed if the obligated parties’ (airlines in this case) reports are deemed incorrect and does not satisfy MRV requirements. This non-compliance penalty is currently set at 100 euros per ton of CO2. Cost Benefit Example For ease of application, an example of a cost benefit analysis is shown in Table V below and based on conservative assumptions. Investment is made in a slipstream densitometer at an upper range of $6500 per unit for 25 hydrant fuelling vehicles (see appendix for details). This cost includes installation and a total cost of ownership estimate for years 1 and 2. The benefit calculation is based on two factors: 1. Fuelling overage relative to fuel requested using $2.00 per gallon of jet fuel and 2. ETS calculations – improved density metering accuracy for a difference of 0.005 instead of using a standard density. Even if the ETS accuracy instead becomes a cost to the airline, the cost benefit ratio is still attractive at 1:22. .
Table V: Cost Benefit Example
COST Amount Per Day
(USD)
Capital investment, installation, total cost of ownership (est. at 16% of investment) for 25 fuelling vehicles based on $6,500 per unit $452
Total Cost $452
BENEFIT Amount Per Day
(USD) 1. Reduction in over-fuelling to ave of 250 pounds overage per flight instead of 686 pounds. Assume 225 flights per day (med-sized airport) $ 28,853
2. ETS Metering Accuracy Benefit of 1billion litres of fuel per year $ 855
Total Benefit $ 29,708
Calculated�Ratio�of�Cost�to�Benefit� 1�to�66�

Results & Discussion
13 | P a g e
The scope of this example is broad and it should be recognized that the investment and the total cost of ownership would be the financial burdens of the owner of fuelling equipment on-airport. However, these same parties would not necessarily derive any direct benefits documented in this example. It is more likely that cost recovery for the investment would occur and result in additional fuelling costs for a time period. The airline(s) should evaluate investments more comprehensively against the benefits that could be potentially realized for each specific installation.

TASK FORCE REPORT
14 | P a g e
SECTION 3 – CONCLUSIONS & RECOMMENDATIONS Based on the findings and analysis above, the task force highlights four (4) conclusions and four 4) recommendations. 3.1 Conclusion #1: Potential to Reduce Human Error; Provides More Representative
Information of Fuel Uplifted All equipment technologies tested provide both fuel volume and weight measurements (direct readings or equipment calculated measurements). In general, the equipment size and technology makes it easier to install at the closest point of delivery to the aircraft. This measurement is more representative of fuel uplifted to the aircraft compared to current practices. Observed densities were within +/- 1% difference than the daily density measurements taken at airport storage tanks or using a proxy standard density measurement of 800kg/m3. Automatic retrieval and transmittal of density/mass data electronically to the refuelling operator also reduces human error from current manual measurements and daily results recording along with providing a time stamp for audits. 3.2 Conclusion #2: New Equipment Types Provides Mechanism to Reduce Aircraft Over-Fuellings Airlines’ focus on fuel managing is a key area of importance for cost control and aircraft balancing. The Task Force’s test runs showed that fuel was filled in excess of what was requested at an average of about 686 pounds per fuelling. The incorporation of a slipstream densitometer or a mass meter would enable the refuelling operator to better monitor the fuel. In real-time, a refuelling operator can simultaneously compare aircraft meter readings to readings the operator sees on the fuelling equipment using the same unit of measure.
A more precise fuelling operations is desired and if excess fuelling was minimized to an average of 63% or a minimum overage of 50 -250 pounds per flight, this would result in an economic benefit of US$45 -US$225 per flight or US$35,000 - US$168,750 a day based on only 50% of 1500 daily flights an airline may have. 3.3 Conclusion #3: Likely to Satisfy the EU Carbon Emissions Trading Measurement Requirements
Slipstream densitometers and mass meters will likely satisfy the EU ETS’s Monitoring, Reporting and Verification (MRV) requirements with the level of accuracy required along with the data integrity, data capture and archival capabilities. These systems have an advantage over the manual hydrometer methods for measuring density under anticipated MRV requirements.
It is believed that the ETS’s Monitoring, Reporting and Verification (MRV) requirements will necessitate equipment measurement and reporting capability accuracies to the 3rd decimal place or have an equivalent tight tolerance. It appears that EU authorities will likely require actual densities of fuel uplifted. The accuracy and sensitivity of density measurements are environmentally and financially important. Density measurements with improved reporting accuracies can result in more accurately reporting CO2 emissions. In addition, the likelihood of enforcement penalties of 100 euros per ton of CO2 might be avoided since there is less likelihood that reports submitted are incorrect.

Results & Discussion
15 | P a g e
3.4 Conclusion #4: Economic Benefit for New Equipment The economic benefit of slipstream densitometers can be roughly 66 times which far out-weighs the costs for equipment purchase, installation and upkeep. This value was based on conservative estimates and can vary by airline and location. Specific and detailed analysis should be completed by all parties involved to determine appropriate investment decisions. In addition, the installation and use of these densitometers or meters enable better options for airlines that require checks and balances for fuel management and inventory control in weight, the unit of measure of key importance to airlines. 3.5 Recommendations The Task Force suggests four (4) recommendations be implemented.
Recommendation 1: On new hydrant systems and/or hydrant refuelling vehicles, install inline Coriolis mass meters that can provide both weight and volumetric measurement readings. This new measuring system capability will aid in better fuel management, environmental regulatory reporting and cost savings.
Recommendation 2: On current hydrant systems and/or hydrant refuelling vehicles, install slipstream densitometers as an adjunct to current measurement systems. This will aid in better fuel management, environmental regulatory reporting and cost savings.
Recommendation 3: The industry technical and specification bodies such as the Society of Automotive Engineers (SAE) should complete the development of standardized reference testing methodology for density meter calibration for the aviation sector.
Recommendation 4: The industry’s on-airport fuel systems standards/guidelines should be updated by its authors like the Air Transport Association (ATA), Joint Inspection Group, Inc. (JIG) and the IATA Fuel Quality Pool (IFQP) to acknowledge that the accuracy requirements are the same for mass meters and volumetric meters as primary metering systems.

TASK FORCE REPORT
16 | P a g e
SECTION 4 – DEFINITION OF TERMS ACRONYMS
API American Petroleum Institute ATA Air Transport Associations ETS Emissions Trading Scheme EU European Union GPM Gallons per minute IATA International Air Transport Association IFQP IATA Fuel Quality Pool JIG Joint Inspection Group, Inc. LPM Litres per minute MRV Monitoring, Reporting and Verification NIST National Institute of Standards and Technology SAE Society of Automotive Engineers VATC Volumetric Automatic Temperature Compensation

Results & Discussion
17 | P a g e
DEFINITION OF TERMS
API Gravity See definition of Density below. Carbon Dioxide A green house gas at tropospheric atmosphere known to contribute to global climate change. Chemical formula is CO2. Carbon dioxide emissions per the EU ETS’ MRV Guidelines Is defined as fuel consumed multiplied by an emissions factor of 3.15. Coriolis Mass Meter The mass meters measures mass flow directly as liquid flows causing tube vibrations allowing measures of specific forces. It also measures density directly and can also provide volume and temperature. The equipment consists of two primary components, a measurement sensor and an electronic transmitter. The flow element, referred to as the sensor, mounts directly in the process piping. The transmitter can be directly mounted to the sensor or remotely located and connected to the sensor by a multi-conductor cable. Daily Density Measurement A manual measurement of density taken usually at 7am and recorded from a fuel sample taken at the fuel storage tank that is released for aircraft fuel uplifts. Density Density of a fuel is its mass per unit volume (or weight per unit volume). Density is affected by temperature and pressure. It is expressed in kilograms/cubic meter, grams/millilitre (or cubic centimetre or pounds/gallon).
Relative density, or specific gravity, is dimensionless since it is a ratio of the density of a substance to the density of a reference substance, namely water. Density varies with temperature. The temperature of the liquid being compared to the reference substance and the temperature of the reference substance, itself, must be given. Relative density is also expressed as API gravity. The following equation gives the relationship between API gravity and relative density. Like density, the specific gravity of a fuel decreases with an increase in temperature. Density Meter Also referred to as a densitometer, the density meter is a measuring apparatus for density or API gravity. The meter measures oscillating vibration frequencies of a tube at constant temperature. Meters can be handheld and portable or installed in a fuel system. Most units can provide density and temperature. ASTM D 4052/IP 365 is the test method for jet fuel specification testing using density meters.
Fuel Management and Inventory Balancing
qAPI = 141.5 - 131.5 Relative Density (60°F)
Density X Volume = Weight
TASK FORCE REPORT
18 | P a g e
A practice used by an airline whose operation purchases at-airport in-tank and not into-wing. This is typical in the United States. After each fuel uplift, comparisons are made to the fuel purchased and how much fuel is in-tank at-airport for stock reconciliation and inventory control. Current practices involve using conversion factors to determine weight and volume. Fuel Weight Density (kilogram/cubic meter or pounds/gallon) X Volume Flow (Litres or Gallons) = Weight (Kilograms or Pounds) Hydrant System A mechanically controlled underground fuel delivery system of pipes and pumps for jet fuel at airport from fuel storage tanks to the aircraft parking gates. The systems are built to specific industry standards. Hydrant Refuelling Vehicles Fuelling vehicles are intermediaries like hydrant carts, hydrant servicers that do not carry fuel but are connected to the hydrant pits and the aircraft to fuel the aircraft. The vehicles are built to specific industry standards. Hydrometer A device usually made of glass that consists of a cylindrical stem and a bulb with weighted material. Fuel is transferred to a cylindrical container and the hydrometer is lowered into the cylinder. The value on the hydrometer scale positioned at the surface of the sample is read by a technician. ASTM D 1298/ IP 160 is the test method for jet fuel specification testing. Slipstream Densitometers A density meter that is specifically designed for installation in a side section of pipe that experiences a representative sampling of the main flow of fuel and minimizes turbulent flow effects. The sensors have an electronically output to portable and instantaneous recording devices for readout and data archive. Fuel Volume A liquid volume of jet fuel typically in litres or gallons. Jet fuel volume amounts are dependent on pressure and temperatures. Volume can be calculated using the weight or mass of the fuel divided by the density or specific gravity of the fuel. Mass Mass is the quantity of matter without regard to the force of the earth’s pull. It is usually measured in kilograms, grams. For purposes of this IATA report, it is being used interchangeably with the term, weight. Net Volume The volume of fuel that is temperature corrected to a base temperature 15ºC (60ºF) Over-Fuelling The quantity of fuel that is onboard the aircraft that is in excess of the amount requested by the airline Weight The weight of a mass is the force of gravity on the mass. A more simple definition is being used for the purpose of this IATA report and the term is being used interchangeably with the term, mass. The units of measure is expressed in kilograms, grams or pounds.

Results & Discussion
19 | P a g e
SECTION 5 – REFERENCES
1. Whitepaper “Mass Meters for Liquid Measurement”, Commport Aerospace Services Ltd. 2008
2. “Time for Calibration”, Control Engineering Asia, October 2009 pp. 24-27 3. Endress+Hauser Accuracy Statement and Chart, Mar 2011
4. Emerson Process Management Accuracy Statement and Chart, Jan 2009
5. “Coriolis Principles”, IATA Aviation Fuel Forum Presentation, Dan Maslowski, Commport Aerospace Servcies Ltd. May 2008
6. Publicly accessible Financial Statements from various airlines on aircraft fuel costs. 7. “Chevron Aviation Fuels Technical Review” 2006 pp. 19, 25, 26 8. All raw and/or analysed data were provided and owned by various Task Force members 9. “Monitoring, Reporting Guidelines Aviation” Commission Decisions of Apr 2009 (2009/339/EC) p.20 10. “Guidance for the Aviation Industry- Monitoring & Reporting Annual Emissions and Tonne km Data for EU Emissions Trading 1.0” 28 May 2009, Section 7 MP AE Template – Uncertainty Assessment, p 39

TASK FORCE REPORT
20 | P a g e
SECTION 6 – APPENDICES
I. Vendor Input of Equipment Costs through Life of the Equipment
Table of Expected Equipment Cost (used to calculate Cost/Benefit estimate)
Equipment Cost for Software Upgrades
Calibration Comments
Maintenance,
Warranty Est (USD)
Capital Cost Est
(USD)
Equipment Run-life
(yr)
Installation Cost
Estimate per meter (USD)
Anton Paar Densitometer & Electronic Data Transmission
0 Every 6 months 0 $ 4,500 – $5,500 20 yrs. $1000
ISSYS Densitometer & Electronic Data Transmission
0
Calibration 1x/yr (1hr. technician time per meter); Reliability is being determined since it’s a new
product.
0 $2,500 – $3,500 10 yrs $1000
Coriolis Mass Meters & Electronic Data Transmitter
0 Calibrate every 3
years at $830 to sent back to the factory
0 $19,600
- $24,000
50 yr $2,000 – $4,400
Manual Hydrometer n/a Every 6 months 0 50 1 yr 0 - 100
Source: Compiled from Vendors & Industry information
II. Current Calibration and Metering Requirements Per the Latest Industry Standards Per ATA 103 13. Fuel Quantity Measurement Meter Meters must be capable of maintaining accuracy of 1/10 of one percent (0.1%) and repeatability of 1/20 of one percent (0.05%) at flow rates ranging from 100 gpm to the maximum rated flow of the fuelling equipment. Calibrator/adjustor must be sealed.
Per IFQP and JIG 5.I.17. Meters should be calibrated and sealed every 6 months against a certificated master meter or proving tank as appropriate. Meter proving shall be performed at a flow rate of between 70 and 80% of the rated flow of the meter under test or normal maximum flow rate in service if this is less. The meter should be checked against the master meter or prover tank and adjusted until a minimum of two consecutive results within plus/minus 0.05% of the master meter or prover tank (taking into account the calibration factors) are obtained. In order to check meter accuracy at low flow rates a further run should be performed at 20%of rated flow of the meter under test. The error at this flow rate shall not exceed plus/minus 0.20%. Meters with erratic performance, or those not capable of being adjusted to meet these calibration criteria, shall be removed from service for repair, overhaul and recalibration, or disposal.

Results & Discussion
21 | P a g e
HYDRANT COUPLER
STRAINER
MONITOR FILTER
ELECTRONIC COUNTER
EMR3
PD METER
FLOW-MASS METER
VENTURI
INTO-PLANE VALVES
HOSE REEL
INTO-PLANE VALVE
SHOCK ABSORBER
INSTALLATION DIAGRAM
Further guidance can be found in petroleum industry standards such as the IP Petroleum Measurement Manual and the API Manual of Petroleum Measurement Standards. Where government or local regulations require different calibration criteria, alternative procedures may apply.
Meters with pulse transmission from the meter drive to an electronic display meter head generally match or exceed the accuracy of mechanical bulk meters. Different calibration equipment and procedures may be applicable. These should be based on the manufacturer’s recommendations and comply with the above calibration criteria.
III. Schematic for Mass Flow Meter Installation
IV. Fuel Density - per the EU ETS Monitoring, Reporting Guidelines Apr 2009 2.2.3. FUEL DENSITY
If the amount of fuel uplift or the amount of fuel remaining in the tanks is determined in units of volume (litres or m 3 ), the aircraft operator shall convert this amount from volume to mass by using actual density values. Actual density means density expressed as kg/litre and determined for the applicable temperature for a specific measurement. Unless on-board measurement systems can be used, the actual density shall be the one measured by the fuel supplier at fuel uplift and recorded on the fuel invoice or delivery note. If such information is not available, the actual density shall be determined from the temperature of the fuel during the uplift provided by the fuel supplier or specified for the aerodrome where the fuel uplift takes place, using standard density-temperature correlation tables. Only in cases for which it is shown to the satisfaction of the competent authority that actual values are not available, a standard density factor of 0,8 kg/litre shall be applied.