fukoku mutual life insurance company · increased 4.1%, to ¥15,961.1 billion. meanwhile, group...
TRANSCRIPT

FUK
OK
U M
UTU
AL LIFE
INS
UR
AN
CE
CO
MPA
NY A
nn
ual R
epo
rt 2010
Annual Report 2010Year Ended March 31, 2010
Printed in Japan

16 FUKOKU MUTUAL LIFE INSURANCE COMPANY
Fukoku Life was founded in 1923. Since then, we have held as our fundamental principle that the interests
of policyholders must be protected to the utmost of our ability. Throughout the life insurance industry,
Fukoku Life is noted for its distinguished investment record and efficient corporate management.
The operating environment for the life insurance industry is becoming increasingly difficult, as a result
of such problems as the aging of society and the uncertainty surrounding the investment environment.
Given these conditions, Fukoku Life will devote still more attention to ensuring the soundness of
insurance operations, and endeavor to develop products tailored to meet increasingly diverse customer
needs. At the same time, it is committed to enhancing efficiency throughout its businesses and to making
active efforts to establish a highly competitive operating base. In this way, it will continue to translate into
practice its management principle of protecting the interests of policyholders.
ContentsFinancial Highlights (Non-consolidated) ....................... 1Message from the President ......................................... 2Fukoku Life’s Management Philosophy ........................ 3Review of Operations (Non-consolidated) Overview ..................................................................... 4 Business Performance in FY2009 .............................. 5 Investment Performance in FY2009 (General Account) ..................................................... 7 Investment Policies for FY2010 ................................. 8Governance System ........................................................ 9Corporate Citizenship ...................................................... 10Non-consolidated Financial Statements ........................ 12Consolidated Financial Statements .............................. 32Corporate Organization ................................................. 53Corporate Information ................................................... 54

1FUKOKU MUTUAL LIFE INSURANCE COMPANY
As of March 31,
Life insurance in force ........................................ ¥49,827,169 ¥48,555,655 ¥47,457,381 $510,075Total assets ......................................................... 5,725,231 5,514,454 5,613,104 60,330 Securities ....................................................... 3,962,459 3,596,377 3,800,984 40,853 Loans ............................................................. 1,231,963 1,238,205 1,220,945 13,122 Tangible fixed assets .................................... 205,952 250,065 279,476 3,003Total liabilities ..................................................... 5,478,270 5,393,901 5,401,158 58,052 Policy reserves .............................................. 5,262,578 5,221,451 5,225,501 56,164 Subordinated bonds ...................................... 47,362 38,870 37,406 402Total net assets ................................................... 246,961 120,553 211,946 2,278
For the year ended March 31,
Total ordinary revenues ...................................... 906,459 881,685 787,517 8,464 Premium and other income ........................... 736,468 646,726 623,778 6,704 Investment income ....................................... 146,216 166,730 147,754 1,588Total ordinary expenditures ................................ 848,381 879,520 754,558 8,110Net surplus for the year ...................................... 45,385 56,863 26,135 280
Solvency margin ratio (%) ................................... 1,146.9 1,008.4 1,127.6 —Employees .......................................................... 13,477 13,836 14,207 —
Millions of yenMillions ofU.S. dollars
Notes 1. U.S. dollar amounts are converted from yen, for convenience only, at the rate of U.S.$1=¥93.04, the rate of exchange on March 31, 2010. 2. Yen and U.S. dollar amounts are rounded down to the nearest million yen or million dollars.
Financial Highlights (Non-consolidated)
Head Office
2008 2009 2010 2010

2 FUKOKU MUTUAL LIFE INSURANCE COMPANY
Firstly, I would like to take this opportunity to express my
sincere gratitude for the understanding and support shown
to Fukoku Life to date by our policyholders. I am Yoshiteru
Yoneyama, appointed in July 2010 as the new president to
replace Tomofumi Akiyama. In my new role, I will do my ut-
most to earn the trust of all of Fukoku Life’s policyholders.
In fiscal 2009, ended March 31, 2010, financial mar-
kets around the world continued to experience uncertain-
ties sparked by the financial crisis, although financial and
economic measures by individual countries contributed to
a general easing of the situation. In Japan too, the environ-
ment surrounding the life insurance industry improved com-
pared with the previous year.
Amid these circumstances, we worked hard to ensure
that our “Customer-Centric” philosophy underpinned all
ideas and actions. Under this philosophy, the assumption
is that all employees treat customers as they themselves
would like to be treated. This serves as the starting point
for our provision of services.
In fiscal 2009, we sought to provide products that were
easy for customers to use and understand. In April 2009,
for example, we launched a medical insurance product
combining generous cover and easy-to-comprehend ben-
efit payment conditions. On the management side too, we
endeavored to utilize the opinions of customers to improve
management by widely seeking their views and require-
ments.
On the asset management side, amid ongoing un-
certainty surrounding the future, we sought to maintain
the safety and liquidity of assets we hold on behalf of our
customers. To this end, we continued the strategy adopted
in the second half of fiscal 2008 of increasing our holdings
of corporate bonds and primarily domestic bonds, while
decreasing our holdings of stocks and foreign currency-
denominated assets.
Message from the President
In addition to securing additional foundation funds, we
worked hard to provide further peace of mind to customers
by strengthening our solvency margin ratio. To this end, we
boosted internal reserves by increasing the accumulated
foundation funds redeemed and the reserve for price fluc-
tuation of securities.
In light of the Company’s business performance in fis-
cal 2009, we will maintain dividends paid to policyholders at
the same level as the previous fiscal year.
As a company engaged in the highly public business of
mutual life insurance based on the spirit of mutual assist-
ance, Fukoku Life adheres to its management philosophy of
“to protect the interests of our policyholders.” Under this
philosophy, all executives and employees will continue im-
plementing our “Customer-Centric” approach as we strive
to be a company that is rated the most highly by custom-
ers.
Yoshiteru Yoneyama
President

3FUKOKU MUTUAL LIFE INSURANCE COMPANY
Fukoku Life’s Management Philosophy
Our “Customer-Centric” ValuesPossessing “Customer-Centric” values means creating and providing unique services that provide
true peace of mind to customers based on the assumption that all employees treat customers as they themselves would like to be treated.
Fukoku Life will continue adhering to its original management philosophy of protecting the interests of policyholders and contributing to society. In addition, we will provide a workplace that enables
personal fulfillment so that all executives and employees find their work rewarding.
A “Customer-Centric” code of conduct to be reflected in the attitudes of all executives and employees as they carry out their daily business.
To us, “Customer-Centric” values means:Valuing teamworkDeserving the trust of each and every customerBeing enthusiastic and proud of our workPossessing common senseContinuing to highlight the importance of life
insuranceOvercoming any kind of difficultyAiming to create a bright and friendly work
environment
1. Foster personnel with “Customer-Centric” valuesWith the aim of providing customers with peace of mind, foster confident and proud employees who have the ability to adopt the customer’s perspective.
2. Reinforce sales staff structureWith the aim of providing meticulous services to customers, reinforce the structure under which sales personnel conduct face-to-face sales.
3. Net increase in customersWith the aim of increasing the number of net customers, strengthen the design, provision and follow-up services for insurance products that meet their diverse needs.
4. Enhance business efficiencyWith the aim of achieving stable growth, improve the efficien-cy of the Company’s wide range of business activities.
Values
Management Philosophy
To protect the interests of our policyholders To contribute to society Personal expression
Code of Conduct Business Policies
Management Philosophy
Code of Conduct
Business Policies
”Values”
Tomofumi AkiyamaChairman of the Board
Yoshiteru YoneyamaPresident
3FUKOKU MUTUAL LIFE INSURANCE COMPANY

4 FUKOKU MUTUAL LIFE INSURANCE COMPANY
ers. We have also boosted our follow-up services provided after a customer takes out a new policy. In alliance with Fukokushinrai Life Insurance Co., Ltd., a subsidiary, we sell our products through financial institutions, mainly credit unions with close ties to local communities. At the end of the period under review, our products we were being sold via 279 financial institution branches and 1,859 other agency outlets. Both Fukoku Life and Fu-kokushinrai Life Insurance provide ongoing support for the insurance sales activities of their partner financial institu-tions. We are also developing other sales channels for such products as tuition insurance through venues that include large shopping centers and the Internet.
Group InsuranceFukoku Life’s group insurance system provides consult-ing services for corporate welfare programs. We provide professional consulting services for the design of corporate retirement funds and pension plans. We also offer consult-ing services for the transition from qualified retirement pensions to defined-benefit pension plans and defined-contribution pension plans. We also make socially responsible investments (SRIs) in companies that work proactively in areas of environmen-tal protection and social contribution.
OverviewIndividual InsuranceThe insurance needs of customers have become increas-ingly diverse over time. We endeavor to the satisfaction of customers by designing and proposing policies to meet cur-rent needs, and offering comprehensive follow-up services. In these ways, we attach importance to providing custom-ers with continued peace of mind, and thus achieving a net increase in the number of policyholders. In addition to nursing care insurance, medical insur-ance, and life insurance, we provide a wide range of prod-ucts and services that meet the varied needs of our cus-tomers. We are further expanding the scope of coverage in the nursing care insurance sector and constantly reviewing our products in various other insurance fields, in order to provide customers with optimum insurance that covers the various risks they are exposed to in the course of their lives.
Sales ChannelsFukoku Life’s products are sold through two major chan-nels: its own salespeople and the offices of financial institu-tions. Our nationwide sales network consists of 62 branch-es and around 11,000 salespeople promoting insurance and annuities to individuals and companies. With the aid of dedicated mobile computers, introduced to enhance the consulting skills of sales staff when conducting face-to-face sales, we work hard to provide optimal products to custom-
4 FUKOKU MUTUAL LIFE INSURANCE COMPANY
Review of Operations (Non-consolidated)
5FUKOKU MUTUAL LIFE INSURANCE COMPANY
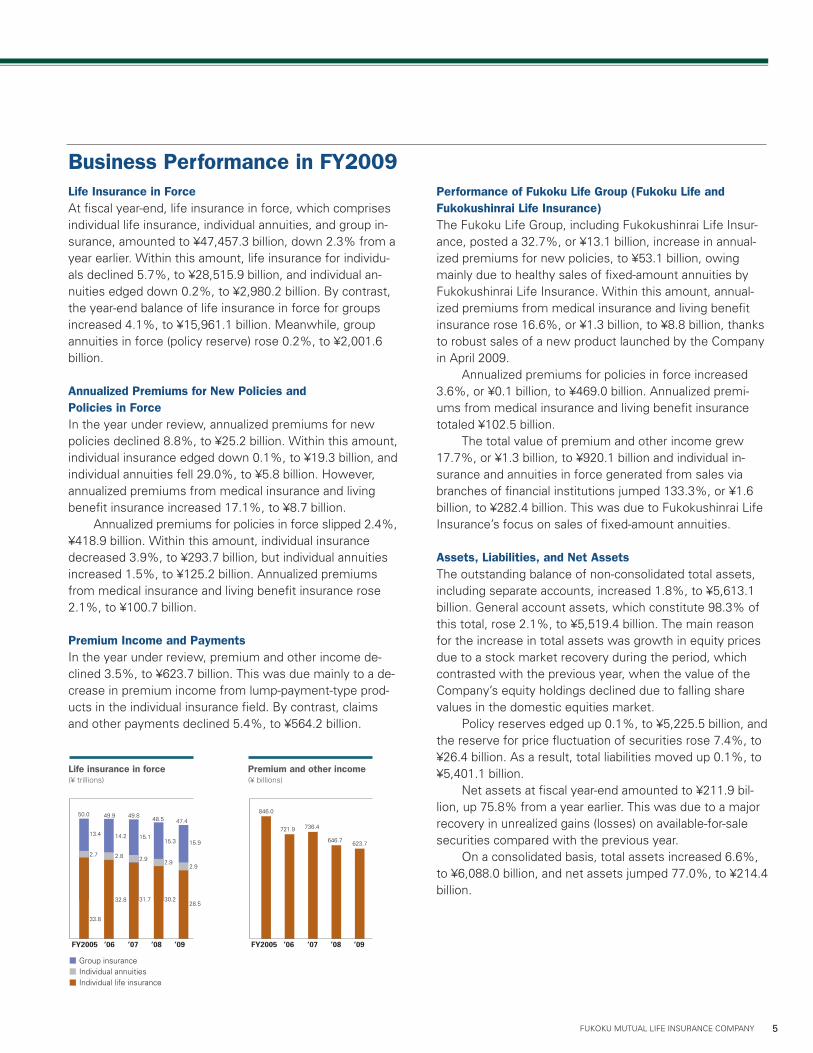
Business Performance in FY2009Life Insurance in ForceAt fiscal year-end, life insurance in force, which comprises individual life insurance, individual annuities, and group in-surance, amounted to ¥47,457.3 billion, down 2.3% from a year earlier. Within this amount, life insurance for individu-als declined 5.7%, to ¥28,515.9 billion, and individual an-nuities edged down 0.2%, to ¥2,980.2 billion. By contrast, the year-end balance of life insurance in force for groups increased 4.1%, to ¥15,961.1 billion. Meanwhile, group annuities in force (policy reserve) rose 0.2%, to ¥2,001.6 billion. Annualized Premiums for New Policies and Policies in ForceIn the year under review, annualized premiums for new policies declined 8.8%, to ¥25.2 billion. Within this amount, individual insurance edged down 0.1%, to ¥19.3 billion, and individual annuities fell 29.0%, to ¥5.8 billion. However, annualized premiums from medical insurance and living benefit insurance increased 17.1%, to ¥8.7 billion. Annualized premiums for policies in force slipped 2.4%, ¥418.9 billion. Within this amount, individual insurance decreased 3.9%, to ¥293.7 billion, but individual annuities increased 1.5%, to ¥125.2 billion. Annualized premiums from medical insurance and living benefit insurance rose 2.1%, to ¥100.7 billion.
Premium Income and PaymentsIn the year under review, premium and other income de-clined 3.5%, to ¥623.7 billion. This was due mainly to a de-crease in premium income from lump-payment-type prod-ucts in the individual insurance field. By contrast, claims and other payments declined 5.4%, to ¥564.2 billion.
Performance of Fukoku Life Group (Fukoku Life and Fukokushinrai Life Insurance) The Fukoku Life Group, including Fukokushinrai Life Insur-ance, posted a 32.7%, or ¥13.1 billion, increase in annual-ized premiums for new policies, to ¥53.1 billion, owing mainly due to healthy sales of fixed-amount annuities by Fukokushinrai Life Insurance. Within this amount, annual-ized premiums from medical insurance and living benefit insurance rose 16.6%, or ¥1.3 billion, to ¥8.8 billion, thanks to robust sales of a new product launched by the Company in April 2009. Annualized premiums for policies in force increased 3.6%, or ¥0.1 billion, to ¥469.0 billion. Annualized premi-ums from medical insurance and living benefit insurance totaled ¥102.5 billion. The total value of premium and other income grew 17.7%, or ¥1.3 billion, to ¥920.1 billion and individual in-surance and annuities in force generated from sales via branches of financial institutions jumped 133.3%, or ¥1.6 billion, to ¥282.4 billion. This was due to Fukokushinrai Life Insurance’s focus on sales of fixed-amount annuities.
Assets, Liabilities, and Net AssetsThe outstanding balance of non-consolidated total assets, including separate accounts, increased 1.8%, to ¥5,613.1 billion. General account assets, which constitute 98.3% of this total, rose 2.1%, to ¥5,519.4 billion. The main reason for the increase in total assets was growth in equity prices due to a stock market recovery during the period, which contrasted with the previous year, when the value of the Company’s equity holdings declined due to falling share values in the domestic equities market. Policy reserves edged up 0.1%, to ¥5,225.5 billion, and the reserve for price fluctuation of securities rose 7.4%, to ¥26.4 billion. As a result, total liabilities moved up 0.1%, to ¥5,401.1 billion. Net assets at fiscal year-end amounted to ¥211.9 bil-lion, up 75.8% from a year earlier. This was due to a major recovery in unrealized gains (losses) on available-for-sale securities compared with the previous year. On a consolidated basis, total assets increased 6.6%, to ¥6,088.0 billion, and net assets jumped 77.0%, to ¥214.4 billion.
Life insurance in force(¥ trillions)
FY2005
50.0
’06
49.9
’07
49.8
’08
48.5
’09
47.4
Premium and other income(¥ billions)
FY2005
846.0
’06
721.9
’07
736.4
’08
646.7
’09
623.7
13.4
2.7
33.8
14.2
2.8
32.8
15.1
2.9
31.7
15.3
2.9
30.2
15.9
2.9
28.5
Group insuranceIndividual annuitiesIndividual life insurance
Review of Operations (Non-consolidated)
6 FUKOKU MUTUAL LIFE INSURANCE COMPANY
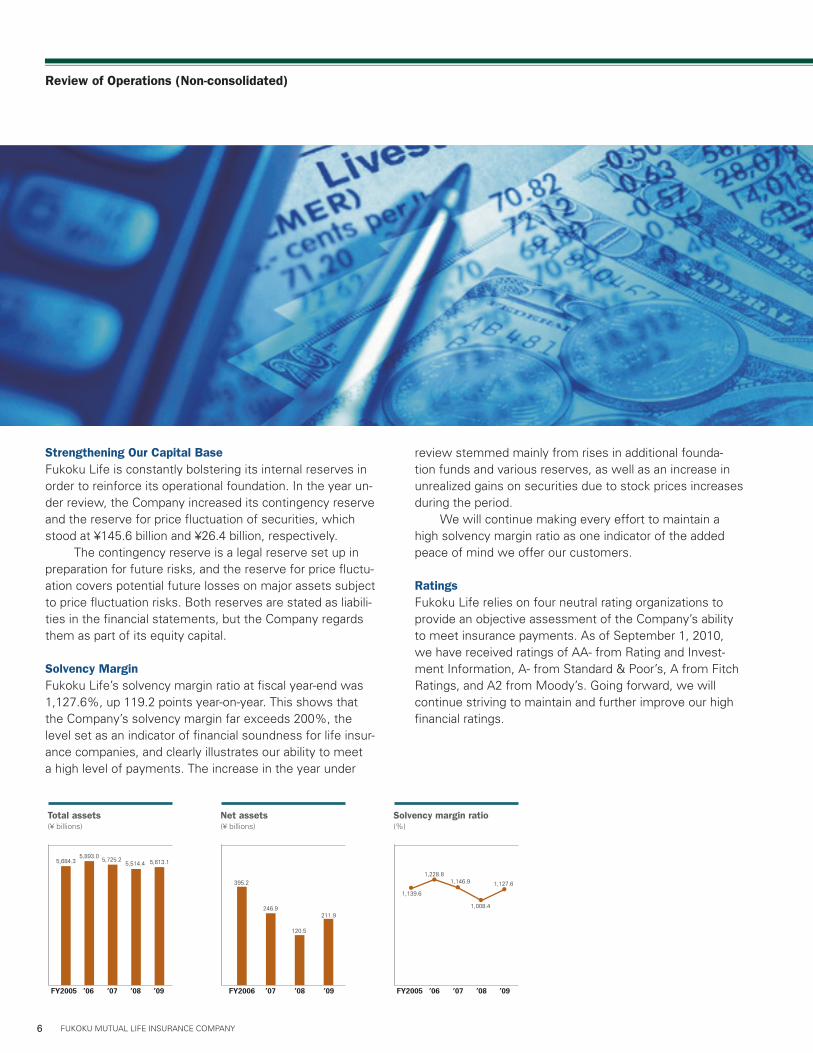
Strengthening Our Capital BaseFukoku Life is constantly bolstering its internal reserves in order to reinforce its operational foundation. In the year un-der review, the Company increased its contingency reserve and the reserve for price fluctuation of securities, which stood at ¥145.6 billion and ¥26.4 billion, respectively. The contingency reserve is a legal reserve set up in preparation for future risks, and the reserve for price fluctu-ation covers potential future losses on major assets subject to price fluctuation risks. Both reserves are stated as liabili-ties in the financial statements, but the Company regards them as part of its equity capital.
Solvency MarginFukoku Life’s solvency margin ratio at fiscal year-end was 1,127.6%, up 119.2 points year-on-year. This shows that the Company’s solvency margin far exceeds 200%, the level set as an indicator of financial soundness for life insur-ance companies, and clearly illustrates our ability to meet a high level of payments. The increase in the year under
review stemmed mainly from rises in additional founda-tion funds and various reserves, as well as an increase in unrealized gains on securities due to stock prices increases during the period. We will continue making every effort to maintain a high solvency margin ratio as one indicator of the added peace of mind we offer our customers.
RatingsFukoku Life relies on four neutral rating organizations to provide an objective assessment of the Company’s ability to meet insurance payments. As of September 1, 2010, we have received ratings of AA- from Rating and Invest-ment Information, A- from Standard & Poor’s, A from Fitch Ratings, and A2 from Moody’s. Going forward, we will continue striving to maintain and further improve our high financial ratings.
Total assets(¥ billions)
FY2005
5,684.3
’06
5,893.0
’07
5,725.2
’08
5,514.4
’09
5,613.1
Net assets(¥ billions)
FY2006
395.2
’07
246.9
’08
120.5
’09
211.9
Solvency margin ratio(%)
FY2005
1,139.6
’06
1,228.8
’07
1,146.9
’08
1,008.4
’09
1,127.6
Review of Operations (Non-consolidated)

7FUKOKU MUTUAL LIFE INSURANCE COMPANY
OverviewIn fiscal 2009, ended March 31, 2010, the Japanese econ-omy turned around thanks to recovery of overseas econo-mies and economic stimulus measures by the government. Reflecting economic recovery in Asia, especially China, and a bottoming out of economies in Europe and North America as well, the domestic economy benefited from a moderate increase in exports and a corresponding continued upturn in production activities. Despite some remaining uncertainty, financial and capital markets returned to stability owing to financial measures adopted by various countries. Against this backdrop, in its asset management activi-ties Fukoku Life continued shifting its emphasis from risk-based assets to yen-denominated fixed-income assets, with the aim of maintaining asset stability and liquidity. Specifi-cally, we increased our holdings of public bonds, centering on a national government bonds, while at the same time reducing our holdings of equities and foreign currency de-nominated assets. In addition, we increased our holdings of yen denominated foreign bonds, which produce high yields, and our holdings of other foreign bonds as a hedge against currency risk. At fiscal year-end, total assets including separate ac-counts, amounted to ¥5,613.1 billion, up 1.8%, or ¥98.6 billion, from a year earlier, due largely to an increase in valu-ation gains on shares held. General account assets, which comprise 98.3% of total assets, rose 2.2%, or ¥116.4 bil-lion, to ¥5,519.4 billion. Investment income from general accounts fell 20.0%, or ¥33.4 billion, to ¥133.3 billion. Interest and dividends, the
main components of investment income, declined 3.7%, or ¥4.2 billion, to ¥110.7 billion. Major factors included a decline in the balance of foreign securities, a decrease in interest income due to the appreciation of the yen, and a decline in dividends from other equities. Gains on sales of securities fell 57.2%, or ¥29.4 billion, to ¥22.0 billion, due mainly to lower sales of domestic bonds. Investment expenses declined 51.3%, or ¥74.1 bil-lion, to ¥70.2 billion. Major factors were a ¥41.4 billion loss on sales of securities, centering on foreign securities and domestic equities, and ¥11.5 billion in losses from deriva-tive instruments, mainly hedge-related expenses aimed at addressing stock price fluctuation risk. As a result, investment income, net of investment expenses, amounted to ¥63.0 billion, up 181.8% from the previous fiscal year.
Bonds: In the year under review, we allocated proceeds from the sale of foreign securities and shares primarily to domestic bonds. As a result, the Company’s bond portfolio at fiscal year-end stood at ¥2,565.9 billion, up 3.9%, or ¥97.1 billion, from a year earlier.
Stocks: Our year-end holdings of domestic equities were up 13.0%, or ¥54.3 billion, to ¥473.2 billion. This was mainly due to an increase in unrealized gains stemming from a recovery in share prices, which compensated for a ¥39.9 billion fall in book value.
Investment Performance in FY2009 (General Account)
General account assets(¥ billions)
FY2005
5,563.4
’06
5,763.9
’07
5,610.5
’08
5,402.9
’09
5,519.4
Breakdown of general account assets(¥ billions)
Total: ¥5,519.4 billion
Ordinary loans: 1,146.7 (20.8%)
Policy loans: 74.1 (1.3%)
Bonds: 2,565.9 (46.5%)
Others: 117.1 (2.1%)Real estate:275.8 (5.0%)Cash and deposits, and others:194.6 (3.5%) (Note)
Other securities: 49.5 (0.9%)
Stocks: 473.2 (8.6%)
Foreign securities: 622.0 (11.3%) Securities:
3,710.8 (67.2%)
Loans: 1,220.9(22.1%)
Note: It is including cash and deposits, call loans, monetaryclaims bought and money held in trust
Review of Operations (Non-consolidated)

8 FUKOKU MUTUAL LIFE INSURANCE COMPANY
Foreign Securities: Our holdings of foreign securities Increased due mainly to a rise in foreign bonds and recovery in prices of foreign equi-ties. As a result, the Company’s holdings of foreign securi-ties, including equity holdings, grew 8.3%, or ¥47.4 billion, to ¥622.0 billion.
Loans: During the period, there was a decline in loans provided to individuals. As a result, the fiscal year-end balance of
outstanding loans, including policy loans, slipped 1.4%, or ¥17.2 billion, to ¥1,220.9 billion.
Real Estate: The year-end balance of Fukoku Life’s real estate holdings rose 12.0%, or ¥29.6 billion, to ¥275.8 billion, mainly re-flecting the Osaka Fukoku Mutual Life Insurance Building reconstruction project, currently under way. This project is located at the Umeda Terminal, the largest transportation hub in Western Japan, and is expected to contribute to the Company’s real estate income in the future.
Bonds(¥ billions)
FY2005
2,362.1
’06
2,431.1
’07
2,444.6
’08
2,468.8
’09
2,565.9
Stocks(¥ billions)
FY2005
790.7
’06
801.1
’07
601.9
’08
418.8
’09
473.2
Foreign securities(¥ billions)
FY2005
608.9
’06
709.9
’07
757.4
’08
574.6
’09
622.0
Loans(¥ billions)
FY2005
1,250.8
’06
1,266.2
’07
1,231.9
’08
1,238.2
’09
1,220.9
Real estate(¥ billions)
FY2005
191.0
’06
201.4
’07
201.8
’08
246.2
’09
275.8
Bonds: Fukoku Life will leave the balance of its bond holdings unchanged. In a rising interest rate environment, we will work to enhance profitability by investing in bonds with longer periods to maturity.
Stocks: Our policy here is to boost earnings by decreasing our holdings of stocks while reshuffling our portfolio.
Foreign Securities: With respect to foreign securities, we will make efficient allocations in yen-denominated and foreign currency-
Investment Policies for FY2010
Investment EnvironmentIn the fiscal year ending March 31, 2011, we expect the Japanese economy to maintain a recovery trend, although the level of growth will be low. In addition to a pullback in overseas demand, the strong yen will also have a restraining im-pact, causing exports to weaken. We also expect personal consumption to stagnate, reflecting erosion of consumer senti-ment stemming from low stock prices. By contrast, we predict that capital expenditures will show a moderate uptrend, especially in environmental protection and other fields earmarked for future growth, amid improvements in corporate earnings. We expect long-term investment rates to remain low thanks to strong investment sentiment among institutional investors in a difficult operating climate. As investors adopt a strongly cautious view of the economic outlook, meanwhile, growth in share prices will be sluggish.
denominated securities while closely monitoring foreign exchange markets and interest rates.
Loans: Emphasizing profitability and credit risk, we will provide financing while ensuring diversification of borrower sec-tors.
Real Estate: Maintaining real estate holdings at the current level, we will work to improve the profitability of existing properties.

9FUKOKU MUTUAL LIFE INSURANCE COMPANY
Establishment of Management Control Measures The Board of Directors makes important business decisions and monitors business execution. The two external direc-tors bring an outside perspective to the deliberations of the Board. In April 2009, Fukoku Life introduced an executive officer system. Under this system, we have separated and strengthened decision-making and business execution func-tions, with the Board of Directors fulfilling decision-making and supervisory functions. We are striving to strengthen internal controls through the activities of various commit-tees, including the Risk Management Committee and the Compliance Committee, which are under the direct supervi-sion of the Board of Directors.
Enhancement of Internal Control SystemThe Company’s Board of Directors has set the terms for the creation of a system of internal controls to ensure the soundness of operations. We are working to enhance the efficiency of operations, strengthen risk management, and promote compliance based on the core policies of our inter-nal control system.
Risk Management SystemWe must enhance financial soundness by addressing the various risks we face in order to be able to meet custom-ers’ expectations over the long term, while maintaining their policies. We are working across the entire company to improve the risk management system in an initiative that includes the full involvement of top management. The Risk Management Committee manages risk rigor-ously in accordance with core policies set by the Board of Directors. We have committees that provide expert risk management in each of the five risk categories: underwrit-
ing risks, asset management risks, administration risks, sys-tem risks, and other risks. In addition, the audit department monitors the effective operation of the risk management system.
Compliance SystemAs members of the community, all executives and employ-ees undergo ongoing training in compliance-related matters so that they not only observe laws and regulations, but also comply with protocols and social conventions. To this end, as well as improving and reinforcing the compliance sys-tem, we hold regular hands-on training programs. However, we recognize that even the most robust of systems cannot guarantee the complete elimination of improper conduct. We believe that it is important to detect any improper conduct early, deal with it swiftly and ap-propriately, and make constant improvements and work to rectify the situation in order to prevent a recurrence. The Compliance Committee, which is chaired by the President, is mandated by the Board of Directors to pro-mote compliance-related activities. The Chief Compliance Officer and Compliance Officers stationed at our Head Of-fice ensure the constant monitoring of compliance.
Protection of Personal InformationAs an insurance company that is trusted by its customers, Fukoku Life takes great care in the handling of personal information. We ensure compliance with the Personal In-formation Protection Law enacted in Japan in April 2005, as well as related laws and guidelines. The appropriate man-agement of personal information is also governed by the Company’s own privacy policy.
Governance System
As a mutual life insurance company, Fukoku Life is engaged in the highly public business of protecting policyholders’ rights. Therefore, we are committed to establishing a man-agement system that ensures the soundness of operations,
and to enhancing management measures, including our risk management system and compliance measures. In addi-tion, we employ our internal control systems to ensure the efficient operation of these measures.
Board of Representative Members of Policyholders

10 FUKOKU MUTUAL LIFE INSURANCE COMPANY
Fukoku Life ConcertsFukoku Life holds two types of concerts throughout the country: Visiting Concerts and Charity Concerts. Visiting Concerts give children attend-ing schools for the disabled and disabled people living in institutions who cannot easily get to concert halls the opportunity to hear performances of classical music. Charity Concerts are held at concert halls as part of the Company’s commitment to fostering community welfare. A Visiting Concert is held after a Charity Concert has been held. Musi-cians who performed at the Charity Concert visit a local welfare facility where they play music and improvise as necessary to create an enjoyable musical occasion for residents. Since 1993, the Company has held 189 Charity Concerts. Visiting Concerts, which were introduced in 2003, have been held at a total of 140 welfare facilities. At Charity Concerts, members of the audience are asked to make do-nations, which are given to local welfare groups, and goods made by the disabled are sold from stalls in the hall foyer.
Other ActivitiesWe plan to attract the corporate tenants of the new Osaka Fukoku Mutual Life Insurance Building scheduled for completion in 2010, as well nearby universities and companies, and provide information of interest related to culture and health. The Company is a proud sponsor of the Pink Ribbon Campaign, which promotes the importance of the early detection, diagnosis, and treatment of breast cancer. Together with Shochiku Co., Ltd., which is involved with such enter-tainment business as Japanese Kabuki and films, Fukoku Life is a sponsor of the Metropolitan Opera: Live in High Definition series of screenings, which give members of the general public the opportunity to see some of the finest opera performances in the world.
Corporate Citizenship
Contributions to SocietyFukoku Life engages in a variety of activities aimed at building a happier and more affluent society in line with the management philosophy of “contributing to society,” to which it has steadfastly adhered since its founda-tion. At the same time as sponsoring programs and events for the benefit of society, our employees also partici-pate in a range of activities.
Company Sponsored Activities
Visiting concert
Charity concert
©Marty Sohl/Metropolitan Opera

11FUKOKU MUTUAL LIFE INSURANCE COMPANY
Flora PreservationRecently in Japan, there has been an increase in forests left to grow un-checked due to the lack of people willing to take over forestry businesses. One particular problem is uncontrolled groves of the vigorously growing Moso bamboo, which not only invades forests, but also takes over farm-land and causes landslides due to the shallowness of their roots. This bamboo problem is even found in land owned by the Company in Shizuoka Prefecture. Fukoku Life has set up a forest regeneration project to tackle this problem. The aim of the project is to not only assist forest regenera-tion by felling bamboo groves, but to also return some bamboo groves to a healthy state. Since 2006, Fukoku Life’s executives and employees have taken part in the project. In the year under review, 166 executives, employees and their family members volunteered their time to take part in these activities.
Other ActivitiesAll of the company’s employees participate in various other initiatives, including neighborhood cleanup campaigns and collections of PET bottle lids.
Alliance with SanrioThe Sanrio character Hello Kitty is famous all over the world. Fukoku Life uses Hello Kitty in posters and pamphlets, and sponsors the “Sanrio Char-acter Boat Ride,” one of the many attractions in the Sanrio Puroland indoor theme park.
Providing InformationFukoku Life publishes a variety of materials for its stakeholders. Publica-tions that provide information on the Company’s business activities include the Japanese-language magazine, “Disclosure” (and abridged versions thereof), booklets written for policyholders, and this English-language an-nual report. Our diverse lineup of public relations and advertising activities include the production of a variety of publications as needed, in order to strengthen the channels of communication between the Company, its poli-cyholders, and its many other customers.
Communicating with Societies
Employee Activities
©1976,2010 SANRIO CO.,LTD. APPROVAL NO. G510813
©’08,’10 SANRIO/SEGA TOYS S S/W TX JLPC ©’10 SANRIO APPROVAL No.P020901-01
12 FUKOKU MUTUAL LIFE INSURANCE COMPANY
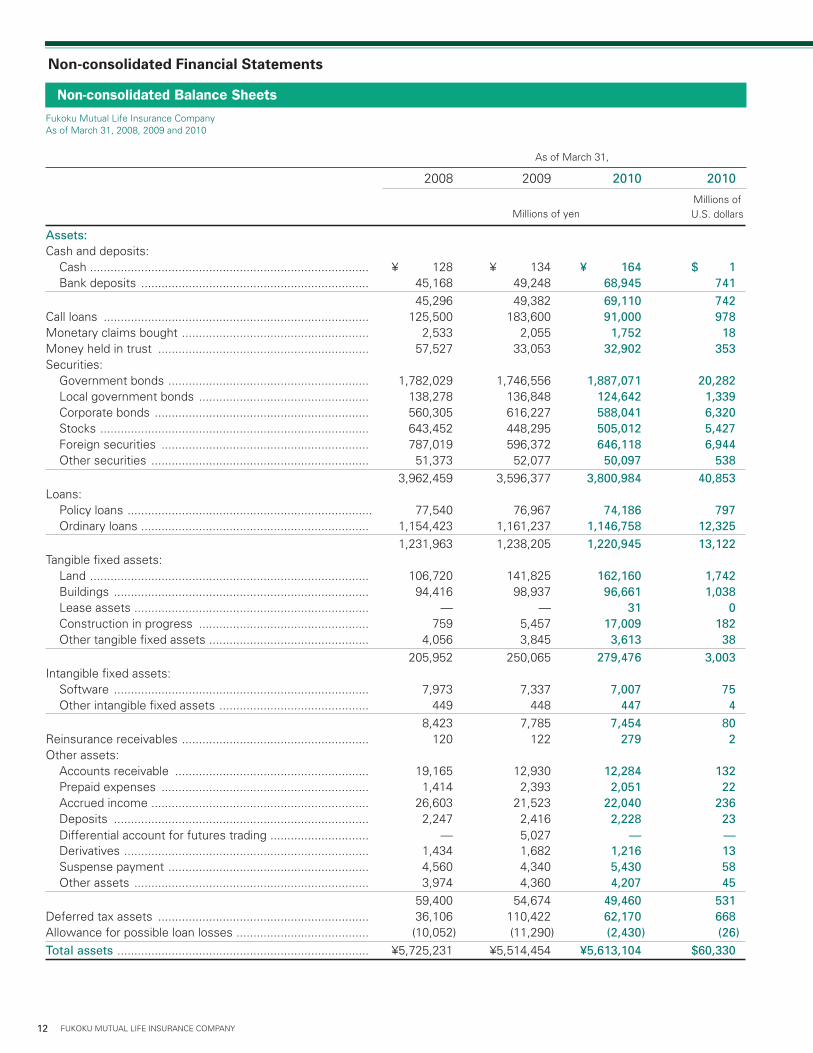
Assets: Cash and deposits: Cash .................................................................................. ¥ 128 ¥ 134 ¥164 $1 Bank deposits ................................................................... 45,168 49,248 68,945 741 45,296 49,382 69,110 742Call loans .............................................................................. 125,500 183,600 91,000 978Monetary claims bought ....................................................... 2,533 2,055 1,752 18Money held in trust .............................................................. 57,527 33,053 32,902 353Securities: Government bonds ........................................................... 1,782,029 1,746,556 1,887,071 20,282 Local government bonds .................................................. 138,278 136,848 124,642 1,339 Corporate bonds ............................................................... 560,305 616,227 588,041 6,320 Stocks ............................................................................... 643,452 448,295 505,012 5,427 Foreign securities ............................................................. 787,019 596,372 646,118 6,944 Other securities ................................................................ 51,373 52,077 50,097 538 3,962,459 3,596,377 3,800,984 40,853Loans: Policy loans ........................................................................ 77,540 76,967 74,186 797 Ordinary loans ................................................................... 1,154,423 1,161,237 1,146,758 12,325 1,231,963 1,238,205 1,220,945 13,122Tangible fixed assets: Land .................................................................................. 106,720 141,825 162,160 1,742 Buildings ........................................................................... 94,416 98,937 96,661 1,038 Lease assets ..................................................................... — — 31 0 Construction in progress .................................................. 759 5,457 17,009 182 Other tangible fixed assets ............................................... 4,056 3,845 3,613 38 205,952 250,065 279,476 3,003Intangible fixed assets: Software ........................................................................... 7,973 7,337 7,007 75 Other intangible fixed assets ............................................ 449 448 447 4 8,423 7,785 7,454 80Reinsurance receivables ....................................................... 120 122 279 2Other assets: Accounts receivable ......................................................... 19,165 12,930 12,284 132 Prepaid expenses ............................................................. 1,414 2,393 2,051 22 Accrued income ................................................................ 26,603 21,523 22,040 236 Deposits ........................................................................... 2,247 2,416 2,228 23 Differential account for futures trading ............................. — 5,027 — — Derivatives ........................................................................ 1,434 1,682 1,216 13 Suspense payment ........................................................... 4,560 4,340 5,430 58 Other assets ..................................................................... 3,974 4,360 4,207 45 59,400 54,674 49,460 531Deferred tax assets .............................................................. 36,106 110,422 62,170 668Allowance for possible loan losses ....................................... (10,052) (11,290) (2,430) (26)Totalassets .......................................................................... ¥5,725,231 ¥5,514,454 ¥5,613,104 $60,330
Fukoku Mutual Life Insurance CompanyAs of March 31, 2008, 2009 and 2010
2008 2009 2010 2010
Millions of U.S. dollarsMillions of yen
As of March 31,
Non-consolidated Balance Sheets
Non-consolidated Financial Statements

13FUKOKU MUTUAL LIFE INSURANCE COMPANY
Liabilities: Policy reserves: Reserve for outstanding claims ........................................ ¥ 26,415 ¥ 28,220 ¥25,342 $272 Policy reserve ................................................................... 5,181,780 5,135,913 5,145,399 55,303 Reserve for dividends to policyholders ............................. 54,382 57,317 54,759 588 5,262,578 5,221,451 5,225,501 56,164Reinsurance payables ........................................................... 102 87 117 1Subordinated bonds .............................................................. 47,362 38,870 37,406 402Other liabilities: Corporate income tax payable .......................................... 9,316 107 1,291 13 Accounts payable ............................................................. 3,274 1,680 3,290 35 Accrued expenses ............................................................ 10,931 9,975 10,434 112 Unearned income ............................................................. 479 517 452 4 Deposits received ............................................................. 5,043 5,050 5,016 53 Guarantee deposits received ............................................ 12,708 11,712 12,893 138 Differential account for futures trading ............................. — — 337 3 Derivatives ........................................................................ 1,422 8,879 6,867 73 Suspense receipt .............................................................. 1,557 1,625 1,338 14 44,733 39,550 41,921 450Reserve for employees' retirement benefits ........................ 49,504 49,293 49,776 535Reserve for price fluctuation of securities ............................ 53,911 24,622 26,451 284Deferred tax liabilities for revaluation reserve for land ......... 20,076 20,026 19,983 214Totalliabilities ..................................................................... 5,478,270 5,393,901 5,401,158 58,052
Netassets:Foundation funds ................................................................... 40,000 40,000 40,000 429Accumulated foundation funds redeemed ............................ 31,000 31,000 46,000 494Reserve for revaluation .......................................................... 112 112 112 1Surplus: Legal reserve for future losses .......................................... 1,787 1,987 2,187 23 Other surplus: Reserve for redemption of foundation funds ................ 10,000 20,000 15,000 161 Reserve for dividend allowances ................................... 3,895 3,895 3,895 41 Reserve for advanced depreciation of real estate for tax purpose ........................................... 319 311 303 3 Other reserves ............................................................... 767 767 767 8 Unappropriated surplus ................................................. 55,671 56,660 54,075 581 70,653 81,634 74,042 795 72,441 83,621 76,229 819Total foundation funds and surplus ........................................ 143,553 154,733 162,341 1,744Net unrealized gains (losses) on available-for-sale securities, net of tax ........................................................... 115,334 (35,474) 48,291 519Deferred valuation gains under hedge accounting ...................................................... 408 479 538 5Revaluation reserve for land, net of tax ................................. (12,335) 814 773 8Total valuation and translation adjustments ........................... 103,407 (34,180) 49,604 533Totalnetassets .................................................................. 246,961 120,553 211,946 2,278Totalliabilitiesandnetassets ........................................... ¥5,725,231 ¥5,514,454 ¥5,613,104 $60,330
See notes to the non-consolidated financial statements.
Non-consolidated Balance Sheets (Continued)
2008 2009 2010 2010
Millions of U.S. dollarsMillions of yen
As of March 31,
Non-consolidated Financial Statements

14 FUKOKU MUTUAL LIFE INSURANCE COMPANY
Ordinaryrevenues:Premium and other income: Premium income .............................................................. ¥736,241 ¥646,500 ¥623,490 $6,701 Reinsurance income ......................................................... 226 226 288 3 736,468 646,726 623,778 6,704Investment income: Interest, dividends and other income: Interest from deposits .................................................. 584 662 493 5 Interest and dividends from securities ......................... 83,910 75,050 70,444 757 Interest from loans ....................................................... 25,075 24,324 24,812 266 Income from real estate for rent .................................. 12,771 14,300 14,718 158 Other interest and dividends ........................................ 641 689 287 3 122,983 115,027 110,757 1,190 Gains from trading securities, net .................................... 1,827 — 165 1 Gains on sales of securities .............................................. 21,031 51,491 22,043 236 Other investment income ................................................. 373 212 358 3 Gains from separate accounts, net ................................... — — 14,428 155 146,216 166,730 147,754 1,588Other ordinary revenues: Fund receipt from annuity rider ........................................ 851 557 777 8 Fund receipt from deposit of claims paid ......................... 18,702 19,967 10,120 108 Reversal of reserve for outstanding claims ....................... 1,955 — 2,878 30 Reversal of policy reserve ............................................... — 45,866 — — Reversal of reserve for employees' retirement benefits ........................................................ 743 211 — — Others ............................................................................... 1,521 1,624 2,208 23 23,774 68,227 15,984 171Totalordinaryrevenues ..................................................... 906,459 881,685 787,517 8,464
Ordinaryexpenditures: Claims and other payments: Claims ............................................................................... 235,444 205,663 178,959 1,923 Annuities ........................................................................... 76,212 89,550 88,092 946 Benefits ............................................................................ 144,598 151,181 146,378 1,573 Surrenders ........................................................................ 120,386 109,976 114,050 1,225 Other payments ................................................................ 24,934 39,840 36,396 391 Reinsurance premiums ..................................................... 349 338 336 3 601,926 596,550 564,214 6,064Provision for policy reserve and others: Provision for reserve for outstanding claims .................... — 1,804 — — Provision for policy reserve .............................................. 73,766 — 9,485 101 Interest on accumulated dividends to policyholders ........ 200 242 157 1 ¥ 73,967 ¥ 2,047 ¥9,643 $103
Fukoku Mutual Life Insurance CompanyFor the years ended March 31, 2008, 2009 and 2010
2008 2009 2010 2010
Millions of U.S. dollarsMillions of yen
Year ended March 31,
Non-consolidated Statements of Operations

15FUKOKU MUTUAL LIFE INSURANCE COMPANY
Investment expenses: Interest expenses ............................................................. ¥ 2,466 ¥ 1,974 ¥1,852 $19 Losses from money held in trust, net ............................... 6,251 3,912 197 2 Losses from trading securities, net ................................... — 3,343 — — Losses on sales of securities ........................................... 15,511 95,471 41,494 445 Losses on valuation of securities ..................................... 2,731 25,268 1,588 17 Losses from derivative instruments, net .......................... 961 110 11,555 124 Foreign exchange losses, net ........................................... 443 2,348 1,706 18 Provision for allowance for possible loan losses .............. 745 1,243 — — Depreciation of real estate for rent and other assets ....... 4,753 4,226 5,230 56 Other investment expenses ............................................. 5,965 6,450 6,618 71 Losses from separate accounts, net ................................. 19,765 25,086 — — 59,595 169,435 70,244 754Operating expenses ............................................................. 87,913 86,137 87,658 942Other ordinary expenditures: Claim deposit payments ................................................... 13,377 14,532 11,551 124 Taxes ................................................................................ 5,100 4,957 4,916 52 Depreciation ..................................................................... 6,149 5,583 5,430 58 Provision for reserve for employees’ retirement benefits .......................................................... — — 483 5 Others ............................................................................... 350 277 417 4 24,978 25,349 22,799 245Totalordinaryexpenditures ............................................... 848,381 879,520 754,558 8,110Ordinaryprofits ................................................................... 58,077 2,164 32,958 354Extraordinarygains: Gains on disposal of fixed assets ..................................... 42 41,724 326 3 Reversal of reserve for price fluctuation of securities....... — 29,289 — — Reversal of allowance for possible loan losses ................. — — 606 6Totalextraordinarygains ................................................... 42 71,014 933 10Extraordinarylosses: Losses on disposal of fixed assets ................................... 240 904 685 7 Impairment losses ............................................................ 398 514 865 9 Provision for reserve for price fluctuation of securities .... 3,845 — 1,829 19Totalextraordinarylosses .................................................. 4,484 1,418 3,380 36Surplusbeforeincometaxes ............................................. 53,635 71,760 30,511 327Incometaxes: Current .............................................................................. 18,905 3,645 3,746 40 Deferred ........................................................................... (10,655) 11,251 629 6Totalincometaxes .............................................................. 8,249 14,896 4,375 47Netsurplusfortheyear ..................................................... ¥ 45,385 ¥ 56,863 ¥26,135 $280
See notes to the non-consolidated financial statements.
Fukoku Mutual Life Insurance CompanyFor the years ended March 31, 2008, 2009 and 2010
2008 2009 2010 2010
Millions of U.S. dollarsMillions of yen
Year ended March 31,
Non-consolidated Statements of Operations (Continued)

16 FUKOKU MUTUAL LIFE INSURANCE COMPANY
Foundationfundsandsurplus: Foundationfunds Balance at the end of previous fiscal year ...................... ¥40,000 ¥40,000 ¥40,000 $429 Changes in the current fiscal year: Financing of additional foundation funds ................... — — 15,000 161 Redemption of foundation funds ............................... — — (15,000) (161) Total changes in the current fiscal year ...................... — — — — Balance at the end of current fiscal year ........................ 40,000 40,000 40,000 429 Accumulatedfoundationfundsredeemed Balance at the end of previous fiscal year ...................... 31,000 31,000 31,000 333 Changes in the current fiscal year: ................................. Additions to accumulated foundation funds redeemed ................................................................ — — 15,000 161 Total changes in the current fiscal year ...................... — — 15,000 161 Balance at the end of current fiscal year ........................ 31,000 31,000 46,000 494 Reserveforrevaluation Balance at the end of previous fiscal year ...................... 112 112 112 1 Changes in the current fiscal year: Total changes in the current fiscal year ...................... — — — — Balance at the end of current fiscal year ........................ 112 112 112 1 Surplus: Legalreserveforfuturelosses Balance at the end of previous fiscal year ................. 1,587 1,787 1,987 21 Changes in the current fiscal year: Additions to legal reserve for future losses ........... 200 200 200 2 Total changes in the current fiscal year ................. 200 200 200 2 Balance at the end of current fiscal year .................... 1,787 1,987 2,187 23 Othersurplus: Reserveforredemptionoffoundationfunds Balance at the end of previous fiscal year ............. — 10,000 20,000 214 Changes in the current fiscal year: Additions to reserve for redemption of foundation funds ............................................ 10,000 10,000 10,000 107 Reversal of reserve for redemption of foundation funds ............................................ — — (15,000) (161) Total changes in the current fiscal year ............. 10,000 10,000 (5,000) (53) Balance at the end of current fiscal year ............... 10,000 20,000 15,000 161 Reservefordividendallowances Balance at the end of previous fiscal year ............. 3,895 3,895 3,895 41 Changes in the current fiscal year: Total changes in the current fiscal year ............. — — — — Balance at the end of current fiscal year ............... 3,895 3,895 3,895 41 Reserveforadvanceddepreciationof realestatefortaxpurpose Balance at the end of previous fiscal year ............. 343 319 311 3 Changes in the current fiscal year: Reversal of reserve for advanced depreciaiton of real estate for tax purpose ............................. (23) (8) (7) (0) Total changes in the current fiscal year ............. (23) (8) (7) (0) Balance at the end of current fiscal year ............... 319 311 303 3
Fukoku Mutual Life Insurance CompanyFor the years ended March 31, 2008, 2009 and 2010
2008 2009 2010 2010
Millions of U.S. dollarsMillions of yen
Year ended March 31,
Non-consolidated Statements of Changes in Net Assets

17FUKOKU MUTUAL LIFE INSURANCE COMPANY
Reservefordirectors'retirementallowances Balance at the end of previous fiscal year ............. 2,770 — — — Changes in the current fiscal year: Reversal of reserve for directors' retirement allowances .................................... (2,770) — — — Total changes in the current fiscal year ............. (2,270) — — — Balance at the end of current fiscal year ............... — — — — Otherreserves Balance at the end of previous fiscal year ............. 767 767 767 8 Changes in the current fiscal year: Total changes in the current fiscal year ............. — — — — Balance at the end of current fiscal year ............... 767 767 767 8 Unappropriatedsurplus Balance at the end of previous fiscal year ............. 53,771 55,671 56,660 608 Changes in the current fiscal year: Additions to reserve for dividends to policyholders ................................................... (35,525) (31,868) (17,856) (191) Additions to legal reserve for future losses ...... (200) (200) (200) (2) Payment of interest on foundation funds ......... (716) (716) (716) (7) Net surplus for the year .................................... 45,385 56,863 26,135 280 Additions to reserve for redemption of foundation funds ............................................. (10,000) (10,000) (10,000) (107) Reversal of reserve for advanced depreciation of real estate for tax purpose ..... 23 8 7 0 Reversal of reserve for directors' retirement allowances .................................... 2,770 — — — Reversal of revaluation reserve for land............ 161 (13,098) 44 0 Total changes in the current fiscal year ............. 1,899 988 (2,584) (27) Balance at the end of current fiscal year ............... 55,671 56,660 54,075 581 Totalsurplus Balance at the end of previous fiscal year ................. 63,135 72,441 83,621 898 Changes in the current fiscal year: Additions to reserve for dividends to policyholders .. (35,525) (31,868) (17,856) (191) Payment of interest on foundation funds .............. (716) (716) (716) (7) Net surplus for the year ......................................... 45,385 56,863 26,135 280 Reversal of reserve for redemption of foundation funds ................................................. — — (15,000) (161) Reversal of revaluation reserve for land ................ 161 (13,098) 44 0 Total changes in the current fiscal year ................. 9,305 11,180 (7,392) (79) Balance at the end of current fiscal year .................... 72,441 83,621 76,229 819 Totalfoundationfundsandsurplus Balance at the end of previous fiscal year ...................... 134,247 143,553 154,733 1,663 Changes in the current fiscal year: Financing of additional foundation funds ................... — — 15,000 161 Additions to reserve for dividends to policyholders ... (35,525) (31,868) (17,856) (191) Additions to accumulated foundation funds redeemed ....................................................... — — 15,000 161 Payment of interest on foundation funds .................. (716) (716) (716) (7) Net surplus for the year ............................................. 45,385 56,863 26,135 280 Redemption of foundation funds ............................... — — (15,000) (161) Reversal of reserve for redemption of foundation funds ..................................................... — — (15,000) (161) Reversal of revaluation reserve for land ..................... 161 (13,098) 44 0 Total changes in the current fiscal year ...................... 9,305 11,180 7,607 81 Balance at the end of current fiscal year ........................ 143,553 154,733 162,341 1,744
2008 2009 2010 2010
Millions of U.S. dollarsMillions of yen
Year ended March 31,
Non-consolidated Statements of Changes in Net Assets (Continued)

18 FUKOKU MUTUAL LIFE INSURANCE COMPANY
Valuationandtranslationadjustments: Netunrealizedgains(losses)onavailable-for-sale securities,netoftax Balance at the end of previous fiscal year ...................... 273,377 115,334 (35,474) (381) Changes in the current fiscal year: Net changes, excluding foundation funds and surplus .............................................................. (158,043) (150,809) 83,766 900 Total changes in the current fiscal year ...................... (158,043) (150,809) 83,766 900 Balance at the end of current fiscal year ........................ 115,334 (35,474) 48,291 519 Deferredvaluationgains(losses)underhedgeaccounting Balance at the end of previous fiscal year ...................... (152) 408 479 5 Changes in the current fiscal year: Net changes, excluding foundation funds and surplus ............................................................... 560 70 59 0 Total changes in the current fiscal year ...................... 560 70 59 0 Balance at the end of current fiscal year ........................ 408 479 538 5 Revaluationreserveforland,netoftax Balance at the end of previous fiscal year ...................... (12,204) (12,335) 814 8 Changes in the current fiscal year: Net changes, excluding foundation funds and surplus ............................................................. (130) 13,149 (40) (0) Total changes in the current fiscal year ...................... (130) 13,149 (40) (0) Balance at the end of current fiscal year ........................ (12,335) 814 773 8 Totalvaluationandtranslaitonadjustments Balance at the end of previous fiscal year ...................... 261,020 103,407 (34,180) (367) Changes in the current fiscal year: Net changes, excluding foundation funds and surplus ............................................................... (157,612) (137,588) 83,785 900 Total changes in the current fiscal year ...................... (157,612) (137,588) 83,785 900 Balance at the end of current fiscal year ........................ 103,407 (34,180) 49,604 533
Totalnetassets Balance at the end of previous fiscal year ........................... 395,268 246,961 120,553 1,295 Changes in the current fiscal year: Financing of additional foundation funds ........................ — — 15,000 161 Additions to reserve for dividends to policyholders........ (35,525) (31,868) (17,856) (191) Additions to accumulated foundation funds redeemed ............................................................. — — 15,000 161 Payment of interest on foundation funds ....................... (716) (716) (716) (7) Net surplus for the year .................................................. 45,385 56,863 26,135 280 Redemption of foundation funds .................................... — — (15,000) (161) Reversal of reserve for redemption of foundation funds ........................................................... — — (15,000) (161) Reversal of revaluation reserve for land ......................... 161 (13,098) 44 0 Net changes, excluding foundation funds and surplus ................................................................... (157,612) (137,588) 83,785 900 Total changes in the current fiscal year .......................... (148,307) (126,407) 91,393 982 Balance at the end of current fiscal year ............................. ¥ 246,961 ¥ 120,553 ¥211,946 $2,278
2008 2009 2010 2010
Millions of U.S. dollarsMillions of yen
Year ended March 31,
Non-consolidated Statements of Changes in Net Assets (Continued)
19FUKOKU MUTUAL LIFE INSURANCE COMPANY
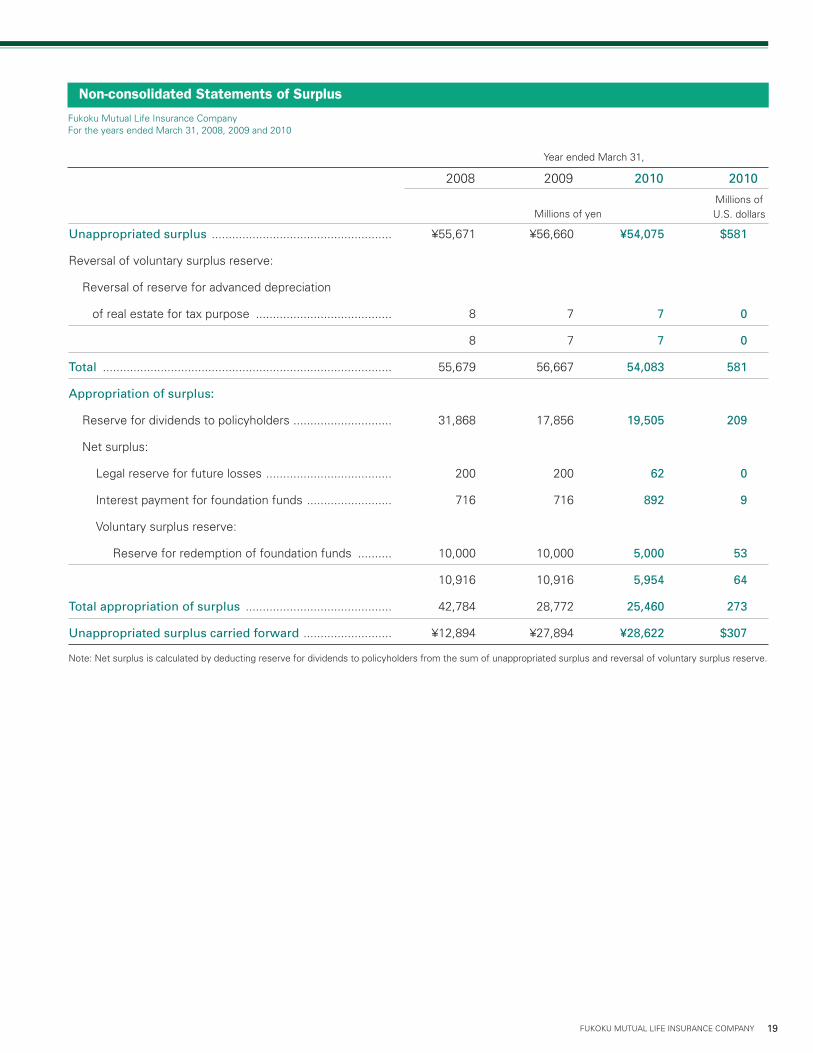
Unappropriatedsurplus ..................................................... ¥55,671 ¥56,660 ¥54,075 $581
Reversal of voluntary surplus reserve:
Reversal of reserve for advanced depreciation
of real estate for tax purpose ........................................ 8 7 7 0
8 7 7 0
Total ..................................................................................... 55,679 56,667 54,083 581
Appropriationofsurplus:
Reserve for dividends to policyholders ............................. 31,868 17,856 19,505 209
Net surplus:
Legal reserve for future losses ..................................... 200 200 62 0
Interest payment for foundation funds ......................... 716 716 892 9
Voluntary surplus reserve:
Reserve for redemption of foundation funds .......... 10,000 10,000 5,000 53
10,916 10,916 5,954 64
Totalappropriationofsurplus ........................................... 42,784 28,772 25,460 273
Unappropriatedsurpluscarriedforward .......................... ¥12,894 ¥27,894 ¥28,622 $307
Note: Net surplus is calculated by deducting reserve for dividends to policyholders from the sum of unappropriated surplus and reversal of voluntary surplus reserve.
Fukoku Mutual Life Insurance CompanyFor the years ended March 31, 2008, 2009 and 2010
2008 2009 2010 2010
Millions of U.S. dollarsMillions of yen
Year ended March 31,
Non-consolidated Statements of Surplus

20 FUKOKU MUTUAL LIFE INSURANCE COMPANY
I. Presentation of the Non-consolidated Financial Statements
1. Basis of Presentation
The accompanying non-consolidated financial statements have been prepared from the accounts maintained by Fukoku Mutual Life Insurance Company (the "Company") in accordance with the provisions set forth in the Insurance Business Law of Japan and its related rules and regulations and in conformity with account-ing principles generally accepted in Japan, which are different in certain respects from accounting principles generally accepted in countries and jurisdictions other than Japan. In addition, the notes to the non-consolidated financial statements include information which is not required under ac-counting principles generally accepted in Japan but is presented herein as additional information. Amounts of less than one million yen have been eliminated. As a result, total in yen shown herein do not necessarily agree with the sum of the individual amounts.
2. U.S. Dollar Amounts
The translations of yen amounts into U.S. dollar amounts are included solely for the convenience of the reader and have been made, as a matter of arithmetical computation only, at the rate of ¥93.04 = US$1.00, the effective rate of exchange at the bal-ance sheet date of March 31, 2010. The translations should not be construed as representations that such yen amounts have been or could in the future be, converted into U.S. dollars at that or any other rates.
II. Notes to Balance Sheets
1. Significant Accounting Policies
(1) Valuation methods of securities
The valuation of securities, including bank deposits and mon-etary claims bought which are equivalent to securities, and securities managed as trust assets in money held in trust, is as follows:
Trading securities are stated at fair market value. Costs of their sales are determined by the moving average method.Held-to-maturity debt securities are stated at amortized cost under the straight-line method, cost being determined by the moving average method.Policy-reserve-matching bonds are stated at amortized cost under the straight-line method, cost being determined by the moving average method in accordance with "Temporary Treatment of Accounting and Auditing Concerning Policy-re-serve-matching Bonds in Insurance Industry" (Industry Audit
Committee Report No.21 issued by the Japanese Institute of Certified Public Accountants on November 16, 2000).Investments in subsidiaries and affiliates are stated at cost, cost being determined by the moving average method.Available-for-sale securities with fair market value are stated at fair market value based on the market prices at the end of fiscal year. Costs of their sales are determined by the mov-ing average method. Net unrealized gains or losses on these available-for-sale securities, net of taxes, are recorded as a separate component of net assets. Available-for-sale securities with no fair market value are stated at cost, cost being determined by the moving average method, except for public and corporate bonds including foreign bonds, of which the difference between acquisition cost and face value is considered to be an adjustment of interest. Such bonds are stated at amortized cost under the straight-line method, cost being determined by the moving average method.
(2) Valuation methods of derivative instruments
Derivative instruments are stated at fair market value.
(3) Revaluation of land
The Company revalued the land for business purposes based on the Law for Revaluation of Land (Law No.34 promulgated on March 31, 1998). The difference between fair value and book value resulting from the revaluation, net of related taxes, is re-corded as revaluation reserve for land as a separate component of net assets and the related tax is recorded as deferred tax liabilities for revaluation reserve for land.
Date of revaluation: March 31, 2002Method of revaluation as prescribed for in Article 3 Paragraph 3 of the said Law:Calculation is based on the appraisal value for property tax set forth in Article 2 item 3 of the Enforcement Ordinance of the Law for Revaluation of Land (Government Ordinance No.119 promulgated on March 31, 1998) and the road rate set forth in Article 2 item 4 of the said Ordinance with certain reasonable adjustments.
i)
ii)
iii)
iv)
v)
Notes to the Non-consolidated Financial Statements

21FUKOKU MUTUAL LIFE INSURANCE COMPANY
(4) Depreciation of tangible fixed assets
Depreciation of tangible fixed assets is calculated by the follow-ing methods.
Buildings (excluding lease assets)Acquired on or before March 31, 1998: Previous declining-balance methodAcquired on or after April 1, 1998 but on or before March 31, 2007: Previous straight-line methodAcquired on or after April 1, 2007: Straight-line method
Assets other than buildings (excluding lease assets)Acquired on or before March 31, 2007: Previous declining-balance methodAcquired on or after April 1, 2007: Declining-balance method
Lease assets related to finance lease transactions that do not transfer ownership: Straight-line method over the lease term
Other tangible fixed assets acquired for ¥100,000 or more but less than ¥200,000 are depreciated equally over three years.
(5) Foreign currency translation
Foreign currency-denominated assets and liabilities, except for investments in subsidiaries and affiliates, are translated into Japanese yen at the effective exchange rate prevailing at the balance sheet date. Investments in subsidiaries and affiliates are translated into Japanese yen at the exchange rate on the date of acquisition.
(6) Allowance for possible loan losses
Allowance for possible loan losses is provided in accordance with the Company's standards of self-assessment and write-offs and reserves on credit quality:
For the credits of borrowers who are legally bankrupt such as being in the proceedings of bankruptcy or civil rehabilitation (hereinafter called "legally bankrupt borrowers") and who are substantially bankrupt (hereinafter called "substantially bank-rupt borrowers"), the Company provides the remaining amount of credits after the direct write-off described below and the deductions of the amount expected to be collected through the disposal of collateral or the execution of guarantees.For the credits of borrowers who are not currently bank-rupt but have a high possibility of bankruptcy, the Company provides the amounts deemed as necessary considering the borrowers' ability to pay, within the amounts after deductions of the amount expected to be collected through the disposal of collateral or the execution of guarantees.For the credits of borrowers other than the above, the Com-pany provides the amounts calculated by multiplying the borrowers' balance by the actual ratio of bad debt losses on defaults during a certain past period.
All credits are assessed by the relevant departments in accor-dance with the Company's standards of self-assessment on credit quality. The results of the assessment are reviewed by the audit department, which is independent of business-related divisions. Subsequently, the allowance for possible loan losses are provided based on the results of these assessments. For the credits of legally bankrupt borrowers and substan-tially bankrupt borrowers, the amounts remaining after deduc-tions of collateral value or the amounts collectible through the execution of guarantees is written-off directly from the bor-rower's balance as the estimated uncollectible amounts. The amounts written-off as of March 31, 2008, 2009 and 2010 were ¥875 million, ¥852 million and ¥9,036 million (US$97 million), respectively.
(7) Reserve for employees' retirement benefits
The Company adopts accounting standards for employees' retirement benefits (Business Accounting Council dated June 16, 1998) and accounts for the reserve for employees' retire-ment benefits based on the projected benefit obligation and plan assets at the balance sheet date.
(8) Reserve for price fluctuation of securities
Reserve for price fluctuation of securities is calculated in accor-dance with Article 115 of the Insurance Business Law.
(9) Lease Transactions as a Lessee
Finance lease transactions that do not transfer ownership to the lessee whose commencement day was on or before March 31, 2008 continued to be accounted for in a manner similar to accounting treatment for ordinary rental transactions.
(10) Lease Transactions as a Lessor
For the years ended March 31, 2009 and 2010, as for the finance lease transactions where the Company is a lessor, the lease fee is recorded in “interest, dividends and other income” at the time of receiving lease fee. The corresponding cost of the lease assets is recorded in “other investment expenses”, which is calculated by deducting an amount equivalent to the interest allocated over the lease term from the lease fee received.
i)
ii)
iii)
i)
ii)
iii)
i)
ii)

22 FUKOKU MUTUAL LIFE INSURANCE COMPANY
(11) Accounting for hedge activities
Hedge accounting is based on "Accounting Standards for
Financial Instruments" (ASBJ Statement No. 10 issued by the
Accounting Standards Board of Japan on August 11, 2006).
For the foreign currency forward contracts against the ex-
change rate fluctuations in the value of foreign currency-denom-
inated bonds classified as available-for-sale securities, which
qualify for hedge accounting because of high correlation and
effectiveness between the hedging instruments and the hedged
items, valuation gains and losses on the foreign currency for-
ward contracts are recorded in the statements of operations.
For the interest rate swaps against the interest rate fluc-
tuations regarding loans, which qualify for hedge accounting
because of high correlation and effectiveness between the
hedging instruments and the hedged items, valuation gains and
losses on the interest rate swaps are deferred until the maturity
of the hedged transactions.
Deposits denominated in foreign currencies for which for-
ward foreign exchange contracts are used to hedge the foreign
currency fluctuations are translated at the contract rates if the
forward contracts qualify for specific hedge accounting. In this
case, exchange differences between the exchange rate on the
trade date and the forward contract rate are allocated to each
fiscal year from the date contracted to the date settled.
For judging the effectiveness of hedge used, ratio analysis
of comparing the fluctuations in the fair value or cash flows of
hedged items and hedging instruments is mostly applied.
(12) Accounting for consumption taxes
The Company accounts for consumption taxes by the tax-exclu-
sion method. The consumption taxes on certain assets, which
are not deductible from consumption taxes withheld and that
are stipulated to be deferred under the Tax Law, are deferred
as prepaid expenses and amortized equally over five years.
Consumption taxes other than deferred consumption taxes are
recognized as an expense when incurred.
(13) Policy reserve
Policy reserve is based on Article 116 of the Insurance Business
Law, and the premium reserve at the end of fiscal year is calcu-
lated by the following method:
In regard to the policies subject to the standard policy
reserve, the method as prescribed by the Commissioner of Fi-
nancial Services Agency (Ministry of Finance Ordinance No. 48,
1996) is applied.
In regard to the policies not subject to the standard policy
reserve, the net level premium method is applied.
(14) Software
The software for internal use is amortized based on straight-line
method over the estimated useful lives.
(15) Deferred assets
Discount on bonds is amortized equally over the period for
which interest on bonds is fixed. This amount is deducted from
bonds.
(16) Policy-reserve-matching bonds
Of the bonds corresponding to the sub-groups which are set
by insurance types and investment policies, the bonds that are
held to match the duration of liabilities are classified as policy-re-
serve-matching bonds in accordance with "Temporary Treatment
of Accounting and Auditing Concerning Policy-reserve-matching
Bonds in Insurance Industry" (Industry Audit Committee Report
No. 21 issued by the Japanese Institute of Certified Public Ac-
countants on November 16, 2000).
The amounts of policy-reserve-matching bonds recorded on
the balance sheets and the market value of these bonds were
¥598,156 million and ¥612,619 million as of March 31, 2008 and
¥628,570 million and ¥644,212 million as of March 31, 2009,
and ¥639,749 million (US$6,876 million) and ¥657,551 million
(US$7,067 million) as of March 31, 2010, respectively.
2. Changes in Accounting Policies(1) Effective for the year ended March 31, 2010, the Company
adopted “Partial Amendments to Accounting Standard for
Retirement Benefits (Part 3)“ (ASBJ Statement No.19 issued
by the Accounting Standards Board of Japan on July 31,
2008). There is no effect of the change on ordinary profit and
surplus before income taxes since the Company has decided
to use the same discount rate as before.
(2) Effective for the year ended March 31, 2009, the Company
adopted “Accounting Standard for Lease Transactions”
(ASBJ Statement No. 13 issued by the Accounting Standards
Board of Japan on March 30, 2007). As a result, ordinary
profits decreased by ¥2 million, compared to the previous
methods.
(3) Effective for the year ended March 31, 2008, in accordance
with the revision of Corporate Tax Law, depreciation of
tangible fixed assets acquired on or after April 1, 2007 is cal-
culated by the straight-line method and the declining-balance
method stipulated in the revised law. As a result, ordinary
profits decreased by ¥45 million, compared to the previous
methods.
The tangible fixed assets acquired on or before March 31,
2007 that are depreciated to their final depreciable limit are
depreciated equally over five years for their remaining book
value. As a result, ordinary profits decreased by ¥71 million.

23FUKOKU MUTUAL LIFE INSURANCE COMPANY
3. Financial InstrumentsAsset management of the general accounts other than the
separate accounts stipulated in Article 118 Paragraph 1 of the
Insurance Business Law is conducted on the principle of pru-
dent and profitable investments, considering public and social
responsibilities of the insurance business. Based on this policy,
the Company allocates the fund, securing its liquidity, from the
medium-to-long term viewpoints. The Company is diversifying
investments in assets such as foreign securities and equity se-
curities within the acceptable range of risk in order to enhance
the profitability, although yen-denominated interest bearing
assets including debt securities such as Japanese government
bonds and loans are the cores of the portfolios. Derivatives are
mainly used to mitigate the market risk regarding the securities
and loans. Major financial instruments including securities, loans
and derivatives are exposed to market risk and credit risk.
The Company manages its asset management risk by
establishing internal control systems including various rules
pursuant to the “Basic Policy for Risk Management” established
by the Board of Directors. Specifically, the Company eliminates
excessive risk deviating from the basic principle and secures the
safety of the assets by utilizing control functions of the Financial
and Investment Risk Management Department towards the
asset management sections, monitoring the status of market
risk and credit risk periodically on a daily or monthly basis. In
addition, the Company quantifies the market risk and credit risk
using value-at-risk (VaR) method in order to control the possible
maximum losses which may arise from the holding assets within
a certain range of risk buffers.
The carrying amounts, fair values and their related
differences of major financial assets and liabilities are as follows:
As of March 31,
2010
Millions of yen Millions of U.S. dollars
Carrying amount Fair value Difference Carrying amount Fair value Difference
Deposits:
Deposits not treated as securities ¥68,839 ¥68,839 ¥— $739 $739 $— Total deposits 68,839 68,839 — 739 739 —Call loans 91,000 91,000 — 978 978 —Monetary claims bought: — Claims treated as loans 1,752 1,743 (8) 18 18 (0) Total monetary claims bought 1,752 1,743 (8) 18 18 (0)Money held in trust:
Trading securities 31,902 31,902 — 342 342 — Total money held in trust 31,902 31,902 — 342 342 —Securities:
Trading securities 79,317 79,317 — 852 852 — Held-to-maturity dept securities 430,883 433,717 2,834 4,631 4,661 30 Policy-reserve-matching bonds 639,749 657,551 17,801 6,876 7,067 191 Investments in subsidiaries and affiliates 1,393 933 (459) 14 10 (4) Available-for-sale securities 2,516,197 2,516,197 — 27,044 27,044 — Total securities 3,667,541 3,687,718 20,176 39,418 39,635 216Loans:
Policy loans 74,186 74,186 (0) 797 797 (0) Ordinary loans 1,146,758 1,174,444 27,685 12,325 12,623 297 Total loans 1,220,945 1,248,630 27,685 13,122 13,420 297Derivative instruments:
Hedge accounting not applied (1,644) (1,644) — (17) (17) — Hedge accounting applied (4,006) (4,006) — (43) (43) — Total derivative instruments ¥(5,650) ¥(5,650) ¥— $(60) $(60) $—

24 FUKOKU MUTUAL LIFE INSURANCE COMPANY
(1) Deposits excluding those which are treated as securities
based on “Accounting Standards for Financial Instruments”
(ASBJ Statement No.10) and call loans:
The fair values of deposits and call loans are based on their
carrying values since fair values approximate carrying values
due to their short maturities.
(2) Securities including deposits and monetary claims bought
which are treated as securities based on “Accounting Stan-
dards for Financial Instruments” (ASBJ Statement No.10)
and securities managed as trust assets in money held in
trust:
The fair values of marketable securities are measured at the
quoted market price at the end of fiscal year. The fair val-
ues of other securities without the quoted market price are
based on the prices reasonably calculated such as the prices
offered by the information vendors or counterparty financial
institutions.
Investments in subsidiaries and affiliates, unlisted equity
securities and investments in partnerships whereby partner-
ship assets consist of unlisted equity securities whose fair
values are deemed extremely difficult to obtain, are excluded
from above securities. The carrying amounts of investments
in subsidiaries and affiliates, unlisted equity securities and
investments in partnerships as of March 31, 2010 were
¥26,132 million (US$280 million), ¥8,851 million (US$95 mil-
lion) and ¥8,306 million (US$89 million), respectively.
(3) Loans and monetary claims bought treated as loans:
The fair values of policy loans are deemed to approximate
carrying values, considering estimated repayment period and
interest rate conditions since their repayment deadline have
not been set up due to the characteristics that the loan is
limited to the amount of cash surrender values. Therefore,
the carrying values are used as the fair values of policy loans.
The fair values of floating interest rate loans among the
ordinary loans and monetary claims bought treated as loans
approximate the carrying values because the market inter-
est rates are reflected in future cash flows in a short period.
Therefore, the fair values of floating interest rate loans and
monetary claims bought treated as loans are based on their
carrying values. The fair values of fixed interest rate loans
are measured by discounting the future cash flows to the
present values. The fair values of loans receivable from
legally bankrupt borrowers, substantially bankrupt borrow-
ers and borrowers who are not currently bankrupt but have
a high possibility of bankruptcy and monetary claims bought
treated as loans are computed by deducting the amount of
the allowance for doubtful accounts from the carrying values
before direct write-offs.
(4) Derivative instruments:
The fair values of the futures and options traded at the
exchange are measured at the settlement price of the ex-
change.
The fair values of options and swaps traded over the coun-
ter are based on the quoted prices offered by counterparty
financial institutions.
The fair values of foreign currency forward contracts are
determined based on the spot exchange rate and forward
contract rate.
4. Investment and Rental PropertyThe Company holds investment and rental properties such as
office buildings in Tokyo and other areas. The carrying amount
and the fair value of these investment and rental properties as
of March 31, 2010 were ¥227,544 million (US$2,445 million)
and ¥298,967 million (US$3,213 million), respectively. The fair
value is mainly based on the value calculated by the Company in
accordance with real estate appraisal standards which includes
some adjustments using the reference prices.
5. Loans ReceivableThe total amounts of credits to bankrupt borrowers, delinquent
loans, delinquent loans past 3 months or more and restructured
loans, which were included in loans, were ¥11,032 million,
¥10,749 million and ¥2,638 million (US$28 million) as of March
31, 2008, 2009 and 2010, respectively.
The balances of credits to bankrupt borrowers were ¥492 mil-
lion, ¥471 million and ¥352 million (US$3 million) as of March
31, 2008, 2009 and 2010, respectively.
The balances of delinquent loans were ¥10,539 million,
¥10,277 million and ¥2,119 million (US$22 million) as of March
31, 2008, 2009 and 2010, respectively.
There were no balances of delinquent loans past 3 months or
more as of March 31, 2008, 2009 and 2010.
The balances of restructured loans were ¥166 million (US$1
million) as of March 31, 2010, and no balances as of March
31, 2008 and 2009.
Credits to bankrupt borrowers represent loans, excluding the
balances already written-off, which meet the conditions pre-
scribed in Article 96 Paragraph 1 Item 3 and 4 of the Enforce-
ment Regulations of the Corporate Tax Law. Moreover, accruing
interest of these loans is not recorded as income after determin-
ing that principal of or interest on these loans is unlikely to be
collected due to the significant delay in repayment of principal or
interest payment or for some other reasons.
Delinquent loans are credits whose accruing interest is not
recorded as income due to the same reasons as described
i)
ii)
iii)
iv)
i)
ii)
iii)

25FUKOKU MUTUAL LIFE INSURANCE COMPANY
above, and exclude credits to bankrupt borrowers and loans for
which interest payments have been suspended and rescheduled
to assist and support the borrowers in the restructuring of their
business.
Delinquent loans past 3 months or more are loans for which
interest payment or repayment of principal are delinquent for
3 months or more from the due date under the terms of the
related loan agreements, excluding those loans classified as
credits to bankrupt borrowers and delinquent loans.
Restructured loans are loans for which certain concessions
favorable to borrowers, such as interest reduction or exemp-
tions, rescheduling of due date of principal or interest payment,
waiver of claim or other terms, have been negotiated for the pur-
pose of assisting and supporting the borrowers in the restructur-
ing of their business. This category excludes loans classified as
credits to bankrupt borrowers, delinquent loans and delinquent
loans past 3 months or more.
The direct write-offs related to loans decreased credits to
bankrupt borrowers described above by ¥87 million, ¥66 million
and ¥8,097 million (US$87 million) as of March 31, 2008, 2009
and 2010, respectively.
The direct write-offs related to loans decreased delinquent
loans described above by ¥787 million, ¥786 million and ¥938
million (US$10 million) as of March 31, 2008, 2009 and 2010,
respectively.
6. Accumulated Depreciation of Tangible Fixed AssetsAccumulated depreciation of tangible fixed assets totaled
to ¥122,527 million, ¥124,586 million and ¥129,610 million
(US$1,393 million) as of March 31, 2008, 2009 and 2010, re-
spectively.
7. Separate AccountsTotal assets in separate accounts provided for in Article 118 of
the Insurance Business Law were ¥117,591 million, ¥113,498
million and ¥95,207 million (US$1,023 million) as of March 31,
2008, 2009 and 2010, respectively. The amounts of separate
account liabilities were the same as separate account assets.
8. Receivables from/Payables to SubsidiariesThe total amounts of receivables from/payables to subsidiaries
were ¥3,642 million and ¥1,479 million as of March 31, 2008,
¥3,579 million and ¥1,281 million as of March 31, 2009 and
¥3,463 million (US$37 million) and ¥1,433 million (US$15 mil-
lion), as of March 31, 2010, respectively.
9. Monetary Claims to DirectorsMonetary claims to directors as of March 31, 2008, 2009 and
2010 were ¥16 million, ¥12 million and ¥8 million (US$93 thou-
sand), respectively.
10. Income TaxesDeferred tax assets and deferred tax liabilities as of March 31,
2008 were ¥106,636 million and ¥67,693 million, respectively.
Valuation allowance for deferred tax assets was ¥2,836 million.
Major components of deferred tax assets were ¥60,587
million of policy reserves, ¥19,521 million of reserve for price
fluctuation of securities and ¥17,925 million of reserve for em-
ployees’ retirement benefits and major component of deferred
tax liabilities was ¥65,469 million of net unrealized gains on
available-for-sale securities as of March 31, 2008.
The statutory tax rate and the actual effective tax rate for the
year ended March 31, 2008 were 36.2% and 15.4%, respective-
ly. The major difference between the statutory tax rate and the
actual effective tax rate was (21.5%) of reserve for dividends to
policyholders.
Deferred tax assets and deferred tax liabilities as of March
31, 2009 were ¥115,089 million and ¥1,939 million, respectively.
Valuation allowance for deferred tax assets was ¥2,727 million.
Major components of deferred tax assets were ¥57,150 mil-
lion of policy reserves, ¥20,136 million of net unrealized losses
on available-for-sale securities and ¥17,849 million of reserve for
employees’ retirement benefits as of March 31, 2009.
The statutory tax rate and the actual effective tax rate for the
year ended March 31, 2009 were 36.2% and 20.8%, respec-
tively. The major differences between the statutory tax rate and
the actual effective tax rate were (9.0%) of reserve for dividends
to policyholders and (6.6%) of revaluation reserve for land.
Deferred tax assets and deferred tax liabilities as of March
31, 2010 were ¥94,720 million (US$1,018 million) and ¥29,692
million (US$319 million), respectively. Valuation allowance for
deferred tax assets was ¥2,857 million (US$30 million).
Major components of deferred tax assets were ¥57,349 mil-
lion (US$616 million) of policy reserves, ¥18,024 million (US$193
million) of reserve for employees’ retirement benefits and
¥9,577 million (US$102 million) of reserve for price fluctuation of
securities as of March 31, 2010. Major component of deferred
tax liabilities was ¥27,412 million (US$294 million) of net unreal-
ized gains on available-for-sale securities as of March 31, 2010.
The statutory tax rate and the actual effective tax rate for the
year ended March 31, 2010 were 36.2% and 14.3%, respective-
ly. The major difference between the statutory tax rate and the
actual effective tax rate was (23.1%) of reserve for dividends to
policyholders.

26 FUKOKU MUTUAL LIFE INSURANCE COMPANY
12. Stocks of Subsidiaries
The amounts of stocks of subsidiaries the Company held as of
March 31, 2008, 2009 and 2010 were ¥17,525 million, ¥27,525
million and ¥27,525 million (US$295 million), respectively.
13. Pledged Assets and Secured Debts
Assets pledged as collateral as of March 31, 2008 were ¥15,145
million of securities and ¥19 million of money held in trust. Se-
cured debts as of March 31, 2008 were ¥4,660 million.
Assets pledged as collateral as of March 31, 2009 were
¥25,959 million of securities. Secured debts as of March 31,
2009 were ¥4,645 million.
Assets pledged as collateral as of March 31, 2010 were
¥21,642 million (US$232 million) of securities. Secured debts as
of March 31, 2010 were ¥4,548 million (US$48 million).
14. Policy Reserves for the Reinsurance Contracts
Reserve for outstanding claims for the reinsurance contracts
provided in accordance with Article 71 Paragraph 1 of the En-
forcement Regulation of the Insurance Business Law (hereinafter
called "reserve for outstanding claims for ceded reinsurance")
were ¥31 million, ¥55 million and ¥32 million (US$353 thousand)
as of March 31, 2008, 2009 and 2010, respectively.
Policy reserve for the reinsurance contracts provided in ac-
cordance with Article 71 Paragraph 1 of the Enforcement Regu-
lation of the Insurance Business Law (hereinafter called "policy
reserve for ceded reinsurance") were ¥29 million, ¥30 million
and ¥30 million (US$330 thousand) as of March 31, 2008, 2009
and 2010, respectively.
15. Adjustment Items for Redemption of Foundation Funds
and Appropriation of Net Surplus
The total amounts of adjustment items for redemption of foun-
dation funds and appropriation of net surplus defined in Article
30 Paragraph 2 of the Enforcement Regulation of the Insur-
ance Business Law were ¥115,855 million, ¥1,406 million and
¥49,716 million (US$534 million) as of March 31, 2008, 2009 and
2010, respectively.
16. Additional Foundation Funds
The Company raised additional foundation funds of ¥15,000 mil-
lion (US$161 million) during the year ended March 31, 2010 in
accordance with Article 60 of the Insurance Business Law.
17. Redemption of Foundation Funds
In the year ended March 31, 2010, in connection with the
redemption of foundation funds of ¥15,000 million (US$161
million), the Company reversed the reserve for redemption of
foundation funds and provided the equivalent amount for accu-
mulated foundation funds redeemed in accordance with Article
56 of the Insurance Business Law.
18. Commitment Line
As of March 31, 2008, 2009 and 2010, there were unused
commitment line agreements under which the Company is the
lender of ¥1,681 million, ¥1,481 million and ¥5,653 million (US$60
million), respectively.
19. Subordinated Bonds
Repayments of subordinated bonds are subordinated to other
obligations.
20. Assets Denominated in Foreign Currencies
Assets denominated in foreign currencies as of March 31, 2008,
2009 and 2010 totaled to ¥716,763 million, ¥463,674 million and
¥482,896 million (US$5,190 million), respectively. The principal
foreign currency asset amounts were 2,401 million euros and
US$2,584 million as of March 31, 2008, 1,551 million euros and
US$2,465 million as of March 31, 2009 and 1,466 million euros
and US$2,937 million as of March 31, 2010, respectively.
11. Reserve for Dividends to Policyholders
Changes in reserve for dividends to policyholders were as follows: Year ended March 31, 2008 2009 2010 2010
Millions of Millions of yen U.S. dollars
Balance at the end of previous fiscal year .................................................. ¥ 52,872 ¥ 54,382 ¥57,317 $616Transfer from surplus in previous fiscal year .............................................. 35,525 31,868 17,856 191Dividends paid in the current fiscal year ..................................................... (34,216) (29,176) (20,571) (221)Increase in interest ..................................................................................... 200 242 157 1Balance at the end of fiscal year ................................................................. ¥ 54,382 ¥ 57,317 ¥54,759 $588
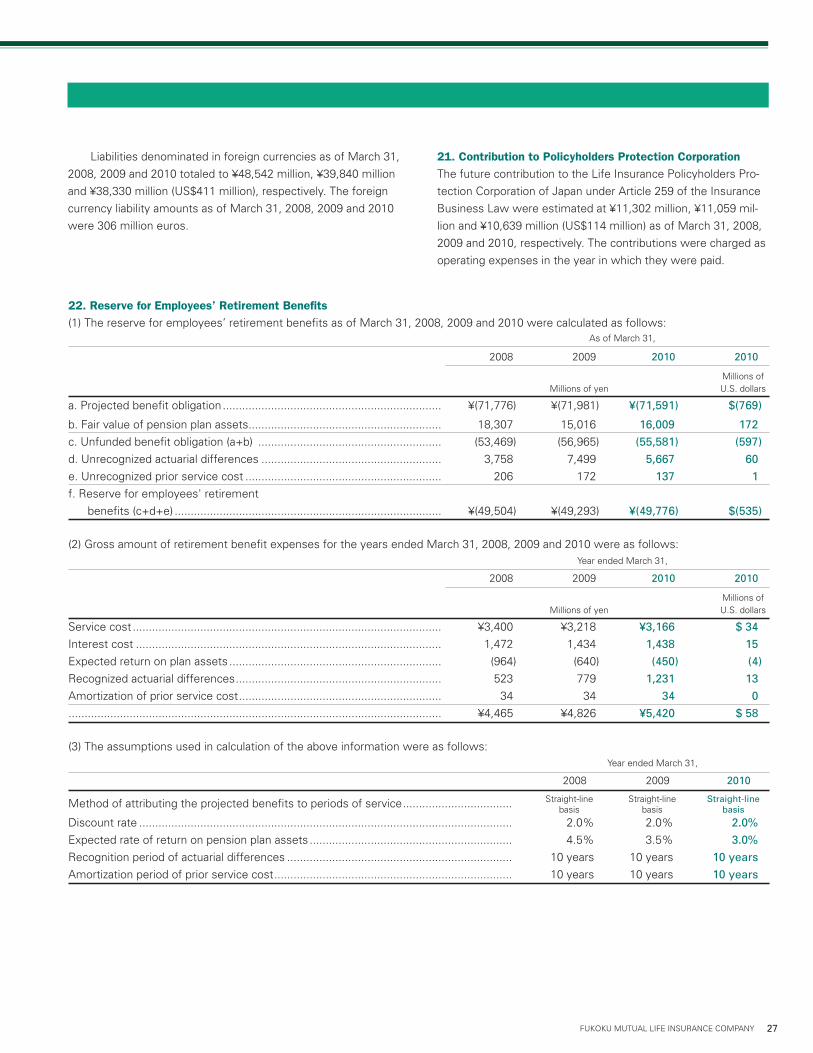
27FUKOKU MUTUAL LIFE INSURANCE COMPANY
22. Reserve for Employees’ Retirement Benefits
(1) The reserve for employees’ retirement benefits as of March 31, 2008, 2009 and 2010 were calculated as follows: As of March 31,
2008 2009 2010 2010
Millions of Millions of yen U.S. dollars
a. Projected benefit obligation .................................................................... ¥(71,776) ¥(71,981) ¥(71,591) $(769)
b. Fair value of pension plan assets ............................................................ 18,307 15,016 16,009 172c. Unfunded benefit obligation (a+b) ......................................................... (53,469) (56,965) (55,581) (597)d. Unrecognized actuarial differences ........................................................ 3,758 7,499 5,667 60e. Unrecognized prior service cost ............................................................. 206 172 137 1f. Reserve for employees' retirement
benefits (c+d+e) ................................................................................... ¥(49,504) ¥(49,293) ¥(49,776) $(535)
(2) Gross amount of retirement benefit expenses for the years ended March 31, 2008, 2009 and 2010 were as follows: Year ended March 31, 2008 2009 2010 2010
Millions of Millions of yen U.S. dollars
Service cost ................................................................................................ ¥3,400 ¥3,218 ¥3,166 $34Interest cost ............................................................................................... 1,472 1,434 1,438 15Expected return on plan assets .................................................................. (964) (640) (450) (4)Recognized actuarial differences ................................................................ 523 779 1,231 13Amortization of prior service cost ............................................................... 34 34 34 0.................................................................................................................... ¥4,465 ¥4,826 ¥5,420 $58
(3) The assumptions used in calculation of the above information were as follows: Year ended March 31, 2008 2009 2010
Method of attributing the projected benefits to periods of service ..................................
Discount rate .................................................................................................................... 2.0% 2.0% 2.0%Expected rate of return on pension plan assets ............................................................... 4.5% 3.5% 3.0%Recognition period of actuarial differences ...................................................................... 10 years 10 years 10yearsAmortization period of prior service cost .......................................................................... 10 years 10 years 10years
Liabilities denominated in foreign currencies as of March 31,
2008, 2009 and 2010 totaled to ¥48,542 million, ¥39,840 million
and ¥38,330 million (US$411 million), respectively. The foreign
currency liability amounts as of March 31, 2008, 2009 and 2010
were 306 million euros.
21. Contribution to Policyholders Protection Corporation
The future contribution to the Life Insurance Policyholders Pro-
tection Corporation of Japan under Article 259 of the Insurance
Business Law were estimated at ¥11,302 million, ¥11,059 mil-
lion and ¥10,639 million (US$114 million) as of March 31, 2008,
2009 and 2010, respectively. The contributions were charged as
operating expenses in the year in which they were paid.
Straight-line Straight-line Straight-line basis basis basis
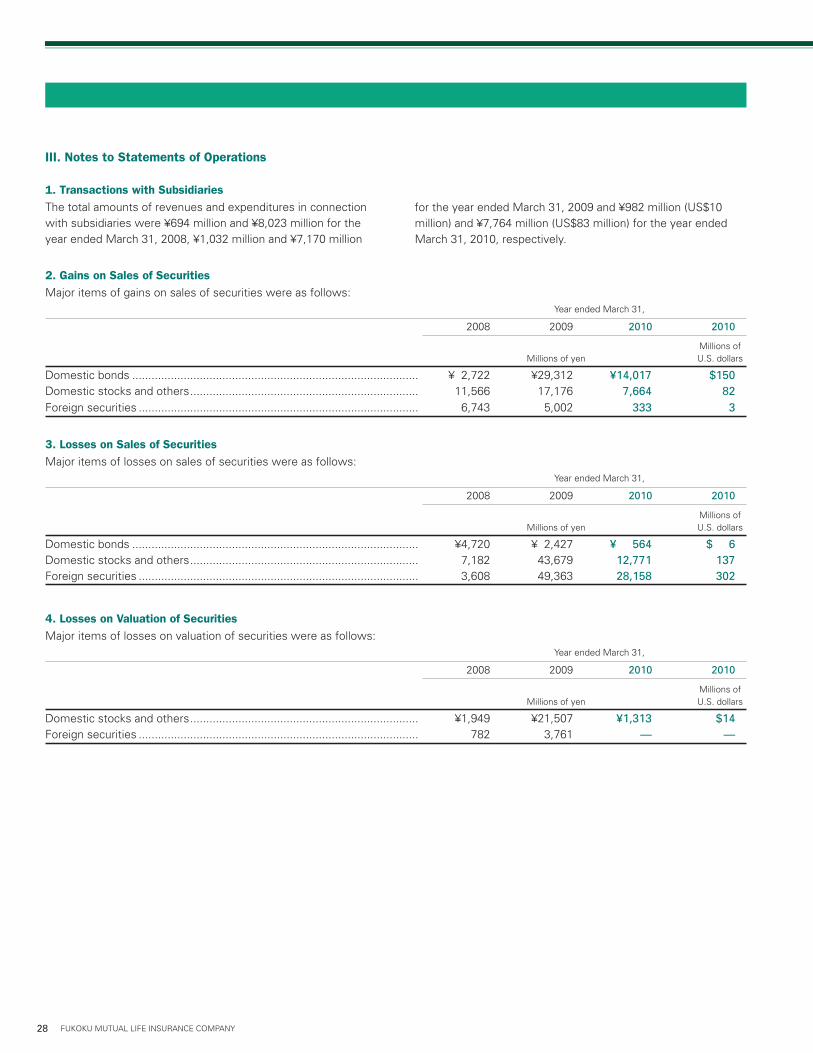
28 FUKOKU MUTUAL LIFE INSURANCE COMPANY
4. Losses on Valuation of Securities
Major items of losses on valuation of securities were as follows: Year ended March 31, 2008 2009 2010 2010
Millions of Millions of yen U.S. dollars
Domestic stocks and others ....................................................................... ¥1,949 ¥21,507 ¥1,313 $14Foreign securities ....................................................................................... 782 3,761 — —
III. Notes to Statements of Operations
1. Transactions with Subsidiaries
The total amounts of revenues and expenditures in connection with subsidiaries were ¥694 million and ¥8,023 million for the year ended March 31, 2008, ¥1,032 million and ¥7,170 million
for the year ended March 31, 2009 and ¥982 million (US$10 million) and ¥7,764 million (US$83 million) for the year ended March 31, 2010, respectively.
2. Gains on Sales of Securities
Major items of gains on sales of securities were as follows: Year ended March 31, 2008 2009 2010 2010
Millions of Millions of yen U.S. dollars
Domestic bonds ......................................................................................... ¥ 2,722 ¥29,312 ¥14,017 $150Domestic stocks and others ....................................................................... 11,566 17,176 7,664 82Foreign securities ....................................................................................... 6,743 5,002 333 3
3. Losses on Sales of Securities
Major items of losses on sales of securities were as follows: Year ended March 31, 2008 2009 2010 2010
Millions of Millions of yen U.S. dollars
Domestic bonds ......................................................................................... ¥4,720 ¥ 2,427 ¥564 $6Domestic stocks and others ....................................................................... 7,182 43,679 12,771 137Foreign securities ....................................................................................... 3,608 49,363 28,158 302

29FUKOKU MUTUAL LIFE INSURANCE COMPANY
5. Policy Reserves for the Reinsurance Contracts
For the year ended March 31, 2008, reversal of reserve for out-
standing claims for ceded reinsurance considered in calculation
of reversal of reserve for outstanding claims was ¥12 million and
reversal of policy reserve for ceded reinsurance considered in
calculation of provision for policy reserve was ¥2 million.
For the year ended March 31, 2009, provision for reserve
for outstanding claims for ceded reinsurance considered in cal-
culation of provision for reserve for outstanding claims was ¥24
million and provision for policy reserve for ceded reinsurance
considered in calculation of reversal of policy reserve was ¥0
million.
For the year ended March 31, 2010, reversal of reserve for
outstanding claims for ceded reinsurance considered in calcula-
tion of reversal of reserve for outstanding claims was ¥22 million
(US$244 thousand) and provision for policy reserve for ceded
reinsurance considered in calculation of provision for policy
reserve was ¥0 million (US$3 thousand).
6. Gains(Losses) from Trading Securities
Major items of gains(losses) from trading securities were as follows: Year ended March 31, 2008 2009 2010 2010
Millions of Millions of yen U.S. dollars
Interest, dividends and other income ......................................................... ¥ 3,798 ¥ 2,645 ¥2,527 $27Gains(Losses) on sales of trading securities .............................................. 1,920 734 (494) (5)Gains(Losses) on valuation of trading securities ........................................ (4,006) (6,724) (1,866) (20)
7. Losses from Money Held in Trust
Losses from money held in trust for the years ended March 31,
2008, 2009 and 2010 included valuation losses of ¥5,701 million,
valuation gains of ¥520 million and valuation gains of ¥0 million
(US$0 thousand), respectively.
8. Losses from derivative Instruments
Losses from derivative instruments for the years ended March
31, 2008, 2009 and 2010 included valuation gains of ¥95 million,
valuation losses of ¥6,298 million and valuation gains of ¥5,607
million (US$60 million), respectively.
9. Impairment of Fixed Assets
For the years ended March 31, 2009 and 2010, impairment
losses of fixed assets were as follows:
(1) Method of grouping
Real estate and other assets used for insurance business opera-
tions are classified as one asset group as a whole. Other assets
such as real estate for rent and unused real estate are classified
as one group individually.
(2) Background of recognizing the impairment losses
Profitability of certain real estate for rent dropped down signifi-
cantly due to a decrease in the level of rental income and a de-
clining trend of market prices of land. The Company reduced its
book values of such real estate for rent and unused real estate
to their recoverable amounts. The amounts reduced were recog-
nized as impairment losses and included in the extraordinary
losses.
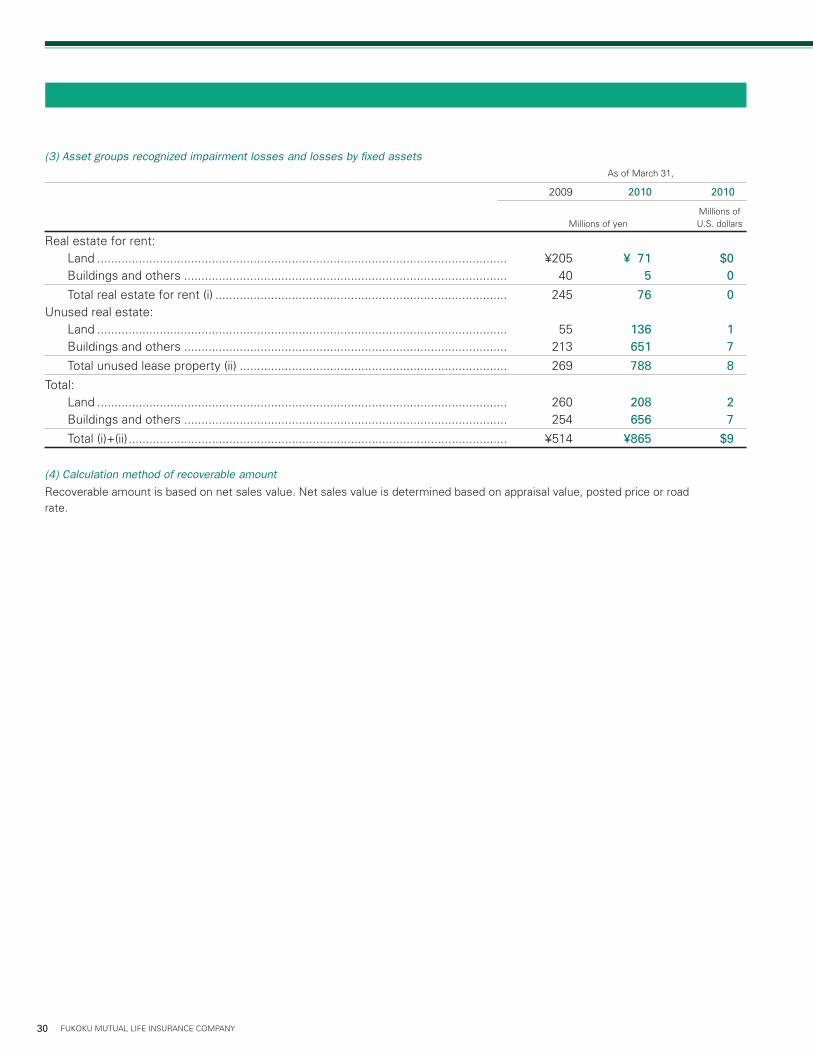
30 FUKOKU MUTUAL LIFE INSURANCE COMPANY
(3) Asset groups recognized impairment losses and losses by fixed assets
As of March 31,
2009 2010 2010
Millions of Millions of yen U.S. dollars
Real estate for rent: Land ...................................................................................................................... ¥205 ¥71 $0 Buildings and others ............................................................................................. 40 5 0
Total real estate for rent (i) .................................................................................... 245 76 0Unused real estate: Land ...................................................................................................................... 55 136 1 Buildings and others ............................................................................................. 213 651 7
Total unused lease property (ii) ............................................................................. 269 788 8
Total: Land ...................................................................................................................... 260 208 2 Buildings and others ............................................................................................. 254 656 7
Total (i)+(ii) ............................................................................................................. ¥514 ¥865 $9
(4) Calculation method of recoverable amount
Recoverable amount is based on net sales value. Net sales value is determined based on appraisal value, posted price or road rate.

31FUKOKU MUTUAL LIFE INSURANCE COMPANY
The Board of Directors of Fukoku Mutual Life Insurance Company
We have audited the accompanying non-consolidated balance sheets of Fukoku Mutual Life Insur-
ance Company as of March 31, 2008, 2009 and 2010, and the related non-consolidated statements
of operations, surplus and changes in net assets for the years then ended, all expressed in Japa-
nese yen. These non-consolidated financial statements are the responsibility of the Company's
management. Our responsibility is to independently express an opinion on these non-consolidated
financial statements based on our audits.
We conducted our audits in accordance with auditing standards generally accepted in Japan. Those
standards require that we plan and perform the audit to obtain reasonable assurance about wheth-
er the financial statements are free of material misstatement. An audit includes examining, on a
test basis, evidence supporting the amounts and disclosures in the financial statements. An audit
also includes assessing the accounting principles used and significant estimates made by manage-
ment, as well as evaluating the overall financial statement presentation. We believe that our audits
provide a reasonable basis for our opinion.
In our opinion, the non-consolidated financial statements referred to above present fairly, in all ma-
terial respects, the non-consolidated financial position of Fukoku Mutual Life Insurance Company
as of March 31, 2008, 2009 and 2010, and the non-consolidated results of their operations for the
years then ended in conformity with accounting principles generally accepted in Japan.
The amounts expressed in U.S. dollars, which are provided solely for the convenience of the read-
er, have been translated on the basis set forth in Note I. 2 to the accompanying non-consolidated
financial statements with respect to the year ended March 31, 2010.
Tokyo, Japan
May 20, 2010
Kisaragi Audit Corporation
Report of Independent Auditors
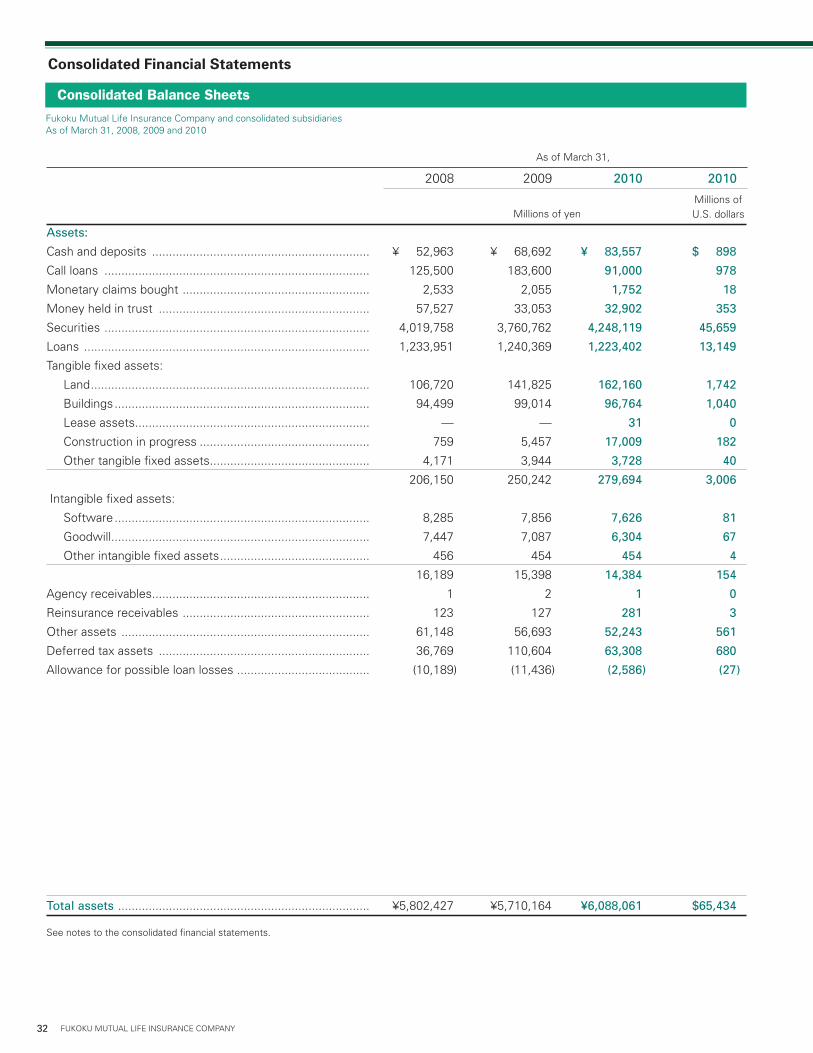
32 FUKOKU MUTUAL LIFE INSURANCE COMPANY
Assets:
Cash and deposits ................................................................ ¥ 52,963 ¥ 68,692 ¥ 83,557 $ 898
Call loans .............................................................................. 125,500 183,600 91,000 978
Monetary claims bought ....................................................... 2,533 2,055 1,752 18
Money held in trust .............................................................. 57,527 33,053 32,902 353
Securities .............................................................................. 4,019,758 3,760,762 4,248,119 45,659
Loans .................................................................................... 1,233,951 1,240,369 1,223,402 13,149
Tangible fixed assets:
Land .................................................................................. 106,720 141,825 162,160 1,742
Buildings ........................................................................... 94,499 99,014 96,764 1,040
Lease assets ..................................................................... — — 31 0
Construction in progress .................................................. 759 5,457 17,009 182
Other tangible fixed assets ............................................... 4,171 3,944 3,728 40
206,150 250,242 279,694 3,006
Intangible fixed assets:
Software ........................................................................... 8,285 7,856 7,626 81
Goodwill ............................................................................ 7,447 7,087 6,304 67
Other intangible fixed assets ............................................ 456 454 454 4
16,189 15,398 14,384 154
Agency receivables ................................................................ 1 2 1 0
Reinsurance receivables ....................................................... 123 127 281 3
Other assets ......................................................................... 61,148 56,693 52,243 561
Deferred tax assets .............................................................. 36,769 110,604 63,308 680
Allowance for possible loan losses ....................................... (10,189) (11,436) (2,586) (27)
Total assets .......................................................................... ¥5,802,427 ¥5,710,164 ¥6,088,061 $65,434
See notes to the consolidated financial statements.
Fukoku Mutual Life Insurance Company and consolidated subsidiariesAs of March 31, 2008, 2009 and 2010
2008 2009 2010 2010
Millions of U.S. dollarsMillions of yen
As of March 31,
Consolidated Balance Sheets
Consolidated Financial Statements

33FUKOKU MUTUAL LIFE INSURANCE COMPANY
Liabilities:
Policy reserves:
Reserve for outstanding claims ........................................ ¥ 27,073 ¥ 28,855 ¥ 26,407 $ 283
Policy reserve ................................................................... 5,252,471 5,327,274 5,612,304 60,321
Reserve for dividends to policyholders ............................. 55,063 57,317 54,759 588
Reserve for dividends to policyholders (subsidiary) ........... — 533 585 6
5,334,607 5,413,981 5,694,057 61,200
Agency payables ................................................................... 51 1,208 1,872 20
Reinsurance payables ........................................................... 138 113 140 1
Subordinated bonds .............................................................. 47,362 38,870 37,406 402
Other liabilities ...................................................................... 45,293 40,730 43,681 469
Reserve for employees' retirement benefits ........................ 49,519 49,313 49,803 535
Reserve for directors' and corporate auditors'
retirement benefits ............................................................. 27 — — —
Reserve for price fluctuation of securities ............................ 54,022 24,772 26,697 286
Deferred tax liabilities ........................................................... 0 0 — —
Deferred tax liabilities for revaluation reserve for land ......... 20,076 20,026 19,983 214
Total liabilities .................................................................... 5,551,101 5,589,016 5,873,642 63,130
Net assets:
Foundation funds .................................................................. 40,000 40,000 40,000 429
Accumulated foundation funds redeemed ........................... 31,000 31,000 46,000 494
Reserve for revaluation ......................................................... 112 112 112 1
Consolidated surplus ............................................................ 74,369 83,365 77,020 827
Total foundation funds and surplus ................................... 145,481 154,477 163,132 1,753
Net unrealized gains (losses) on available-for-sale
securities, net of tax ........................................................... 115,335 (36,210) 48,045 516
Deferred valuation gains
under hedge accounting ..................................................... 408 479 538 5
Revaluation reserve for land, net of tax ................................ (12,335) 814 773 8
Foreign currency translation adjustment .............................. (3) (667) (583) (6)
Total valuation and translation adjustments ...................... 103,405 (35,584) 48,774 524
Minority interests ................................................................. 2,438 2,254 2,513 27
Total net assets ................................................................... 251,325 121,147 214,419 2,304
Total liabilities and net assets ............................................ ¥5,802,427 ¥5,710,164 ¥6,088,061 $65,434
See notes to the consolidated financial statements.
2008 2009 2010 2010
Millions of U.S. dollarsMillions of yen
As of March 31,
Consolidated Balance Sheets (Continued)
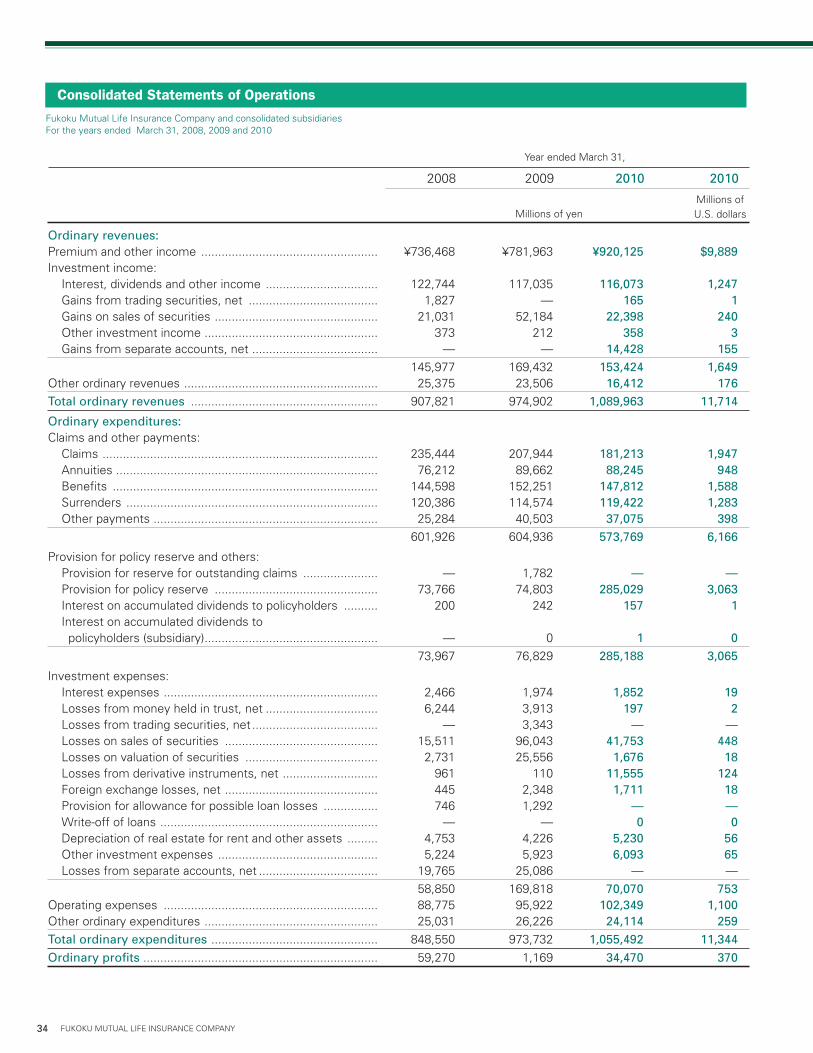
34 FUKOKU MUTUAL LIFE INSURANCE COMPANY
Ordinary revenues:Premium and other income .................................................... ¥736,468 ¥781,963 ¥920,125 $9,889Investment income: Interest, dividends and other income ................................. 122,744 117,035 116,073 1,247 Gains from trading securities, net ...................................... 1,827 — 165 1 Gains on sales of securities ................................................ 21,031 52,184 22,398 240 Other investment income ................................................... 373 212 358 3 Gains from separate accounts, net ..................................... — — 14,428 155 145,977 169,432 153,424 1,649Other ordinary revenues ......................................................... 25,375 23,506 16,412 176Total ordinary revenues ....................................................... 907,821 974,902 1,089,963 11,714
Ordinary expenditures:Claims and other payments: Claims ................................................................................. 235,444 207,944 181,213 1,947 Annuities ............................................................................. 76,212 89,662 88,245 948 Benefits .............................................................................. 144,598 152,251 147,812 1,588 Surrenders .......................................................................... 120,386 114,574 119,422 1,283 Other payments .................................................................. 25,284 40,503 37,075 398 601,926 604,936 573,769 6,166
Provision for policy reserve and others: Provision for reserve for outstanding claims ...................... — 1,782 — — Provision for policy reserve ................................................ 73,766 74,803 285,029 3,063 Interest on accumulated dividends to policyholders .......... 200 242 157 1 Interest on accumulated dividends to policyholders (subsidiary) ................................................... — 0 1 0 73,967 76,829 285,188 3,065
Investment expenses: Interest expenses ............................................................... 2,466 1,974 1,852 19 Losses from money held in trust, net ................................. 6,244 3,913 197 2 Losses from trading securities, net ..................................... — 3,343 — — Losses on sales of securities ............................................. 15,511 96,043 41,753 448 Losses on valuation of securities ....................................... 2,731 25,556 1,676 18 Losses from derivative instruments, net ............................ 961 110 11,555 124 Foreign exchange losses, net ............................................. 445 2,348 1,711 18 Provision for allowance for possible loan losses ................ 746 1,292 — — Write-off of loans ................................................................ — — 0 0 Depreciation of real estate for rent and other assets ......... 4,753 4,226 5,230 56 Other investment expenses ............................................... 5,224 5,923 6,093 65 Losses from separate accounts, net ................................... 19,765 25,086 — — 58,850 169,818 70,070 753Operating expenses ............................................................... 88,775 95,922 102,349 1,100Other ordinary expenditures ................................................... 25,031 26,226 24,114 259Total ordinary expenditures ................................................. 848,550 973,732 1,055,492 11,344Ordinary profits ..................................................................... 59,270 1,169 34,470 370
2008 2009 2010 2010
Millions of U.S. dollarsMillions of yen
Year ended March 31,
Fukoku Mutual Life Insurance Company and consolidated subsidiariesFor the years ended March 31, 2008, 2009 and 2010
Consolidated Statements of Operations

35FUKOKU MUTUAL LIFE INSURANCE COMPANY
Extraordinary gains:
Gains on disposal of fixed assets ....................................... ¥ 42 ¥41,724 ¥ 326 $ 3
Reversal of reserve for price fluctuation of securities ........ — 29,249 — —
Reversal of allowance for possible loan losses ................... — — 527 5
Other extraordinary gains .................................................... 3 — — —
Total extraordinary gains ..................................................... 46 70,974 853 9
Extraordinary losses:
Losses on disposal of fixed assets ..................................... 243 904 696 7
Impairment losses .............................................................. 398 514 865 9
Provision for reserve for price fluctuation of securities ...... 3,845 — 1,924 20
Other extraordinary losses .................................................. 6 8 — —
Total extraordinary losses ................................................... 4,493 1,427 3,486 37
Provision for reserve for dividends to
policyholders (subsidiary) ................................................ — 276 397 4
Surplus before income taxes ............................................... 54,823 70,440 31,439 337
Income taxes:
Current ................................................................................ 19,412 4,123 4,379 47
Deferred ............................................................................. (10,647) 11,970 (350) (3)
Total income taxes ................................................................ 8,765 16,094 4,029 43
Minority interests .................................................................. 167 (332) 227 2
Net surplus for the year ....................................................... ¥45,890 ¥54,678 ¥27,182 $292
See notes to the consolidated financial statements.
2008 2009 2010 2010
Millions of U.S. dollarsMillions of yen
Year ended March 31,
Consolidated Statements of Operations (Continued)
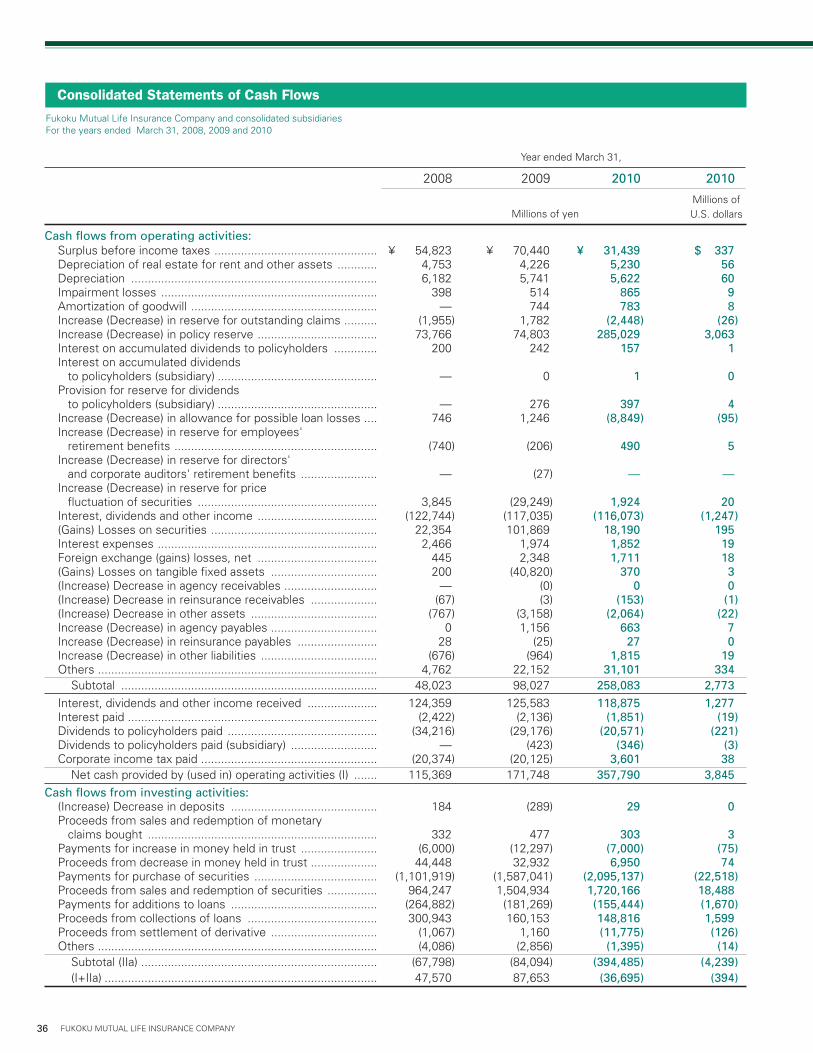
36 FUKOKU MUTUAL LIFE INSURANCE COMPANY
Cash flows from operating activities: Surplus before income taxes ................................................. ¥ 54,823 ¥ 70,440 ¥ 31,439 $ 337 Depreciation of real estate for rent and other assets ............ 4,753 4,226 5,230 56 Depreciation .......................................................................... 6,182 5,741 5,622 60 Impairment losses ................................................................. 398 514 865 9 Amortization of goodwill ........................................................ — 744 783 8 Increase (Decrease) in reserve for outstanding claims .......... (1,955) 1,782 (2,448) (26) Increase (Decrease) in policy reserve .................................... 73,766 74,803 285,029 3,063 Interest on accumulated dividends to policyholders ............. 200 242 157 1 Interest on accumulated dividends to policyholders (subsidiary) ................................................ — 0 1 0 Provision for reserve for dividends to policyholders (subsidiary) ................................................ — 276 397 4 Increase (Decrease) in allowance for possible loan losses .... 746 1,246 (8,849) (95) Increase (Decrease) in reserve for employees' retirement benefits ............................................................. (740) (206) 490 5 Increase (Decrease) in reserve for directors' and corporate auditors' retirement benefits ....................... — (27) — — Increase (Decrease) in reserve for price fluctuation of securities ...................................................... 3,845 (29,249) 1,924 20 Interest, dividends and other income .................................... (122,744) (117,035) (116,073) (1,247) (Gains) Losses on securities .................................................. 22,354 101,869 18,190 195 Interest expenses .................................................................. 2,466 1,974 1,852 19 Foreign exchange (gains) losses, net .................................... 445 2,348 1,711 18 (Gains) Losses on tangible fixed assets ................................ 200 (40,820) 370 3 (Increase) Decrease in agency receivables ............................ — (0) 0 0 (Increase) Decrease in reinsurance receivables .................... (67) (3) (153) (1) (Increase) Decrease in other assets ...................................... (767) (3,158) (2,064) (22) Increase (Decrease) in agency payables ................................ 0 1,156 663 7 Increase (Decrease) in reinsurance payables ........................ 28 (25) 27 0 Increase (Decrease) in other liabilities ................................... (676) (964) 1,815 19 Others .................................................................................... 4,762 22,152 31,101 334 Subtotal ............................................................................. 48,023 98,027 258,083 2,773 Interest, dividends and other income received ..................... 124,359 125,583 118,875 1,277 Interest paid ........................................................................... (2,422) (2,136) (1,851) (19) Dividends to policyholders paid ............................................. (34,216) (29,176) (20,571) (221) Dividends to policyholders paid (subsidiary) .......................... — (423) (346) (3) Corporate income tax paid ..................................................... (20,374) (20,125) 3,601 38 Net cash provided by (used in) operating activities (I) ....... 115,369 171,748 357,790 3,845Cash flows from investing activities: (Increase) Decrease in deposits ............................................ 184 (289) 29 0 Proceeds from sales and redemption of monetary claims bought ..................................................................... 332 477 303 3 Payments for increase in money held in trust ....................... (6,000) (12,297) (7,000) (75) Proceeds from decrease in money held in trust .................... 44,448 32,932 6,950 74 Payments for purchase of securities ..................................... (1,101,919) (1,587,041) (2,095,137) (22,518) Proceeds from sales and redemption of securities ............... 964,247 1,504,934 1,720,166 18,488 Payments for additions to loans ............................................ (264,882) (181,269) (155,444) (1,670) Proceeds from collections of loans ....................................... 300,943 160,153 148,816 1,599 Proceeds from settlement of derivative ................................ (1,067) 1,160 (11,775) (126) Others .................................................................................... (4,086) (2,856) (1,395) (14) Subtotal (IIa) ....................................................................... (67,798) (84,094) (394,485) (4,239) (I+IIa) .................................................................................. 47,570 87,653 (36,695) (394)
Fukoku Mutual Life Insurance Company and consolidated subsidiariesFor the years ended March 31, 2008, 2009 and 2010
2008 2009 2010 2010
Millions of U.S. dollarsMillions of yen
Year ended March 31,
Consolidated Statements of Cash Flows

37FUKOKU MUTUAL LIFE INSURANCE COMPANY
Payments for purchase of tangible fixed assets .................... (10,933) (67,428) (38,458) (413) Proceeds from sales of tangible fixed assets ........................ 387 58,176 753 8 Payments for purchase of intangible fixed assets .................. (1,949) (1,982) (2,156) (23) Proceeds from sales of intangible fixed assets ...................... 0 2 — — Acquisition of subsidiary, net of cash acquired ....................... (11,729) — — — Net cash provided by (used in) investing activities ............ (92,023) (95,327) (434,346) (4,668)
Cash flows from financing activities: Repayment of subordinated dept loans .................................. (5,000) — — — Financing of additional foundation funds ............................... — — 15,000 161 Redemption of foundation funds ........................................... — — (15,000) (161) Interest payment for foundation funds .................................. (716) (716) (716) (7) Dividends paid to minority interests ....................................... (52) (52) (23) (0) Net cash provided by (used in) financing activities ............ (5,768) (768) (739) (7)Effect of exchange rate changes on cash and cash equivalents ................................................................... (546) (1,983) (445) (4)Net increase (decrease) in cash and cash equivalents ......... 17,031 73,669 (77,740) (835)Cash and cash equivalents at the beginning of the year ..... 160,924 177,956 251,626 2,704Cash and cash equivalents at the end of the year ................ ¥177,956 ¥251,626 ¥173,885 $1,868
See notes to the consolidated financial statements.
2008 2009 2010 2010
Millions of U.S. dollarsMillions of yen
Year ended March 31,
Consolidated Statements of Cash Flows (Continued)

38 FUKOKU MUTUAL LIFE INSURANCE COMPANY
Fukoku Mutual Life Insurance Company and consolidated subsidiariesFor the years ended March 31, 2008, 2009 and 2010
Foundation funds and surplus: Foundation funds Balance at the end of previous fiscal year ...................... ¥ 40,000 ¥ 40,000 ¥ 40,000 $ 429 Changes in the current fiscal year: Financing of additional foundation funds ................... — — 15,000 161 Redemption of foundation funds ............................... — — (15,000) (161) Total changes in the current fiscal year ...................... — — — — Balance at the end of current fiscal year ........................ 40,000 40,000 40,000 429 Accumulated foundation funds redeemed Balance at the end of previous fiscal year ...................... 31,000 31,000 31,000 333 Changes in the current fiscal year: Additions to accumulated foundation funds redeemed ...................................................... — — 15,000 161 Total changes in the current fiscal year ...................... — — 15,000 161 Balance at the end of current fiscal year ........................ 31,000 31,000 46,000 494 Reserve for revaluation Balance at the end of previous fiscal year ...................... 112 112 112 1 Changes in the current fiscal year: Total changes in the current fiscal year ...................... — — — — Balance at the end of current fiscal year ........................ 112 112 112 1 Consolidated surplus Balance at the end of previous fiscal year ...................... 64,559 74,369 83,365 896 Changes in the current fiscal year: Additions to reserve for dividends to policyholders ... (35,525) (31,868) (17,856) (191) Payment of interest on foundation funds .................. (716) (716) (716) (7) Net surplus for the year ............................................. 45,890 54,678 27,182 292 Reversal of reserve for redemption of foundation funds ..................................................... — — (15,000) (161) Reversal of revaluation reserve for land ..................... 161 (13,098) 44 0 Total changes in the current fiscal year ...................... 9,810 8,995 (6,345) (68) Balance at the end of current fiscal year ........................ 74,369 83,365 77,020 827 Total foundation funds and surplus Balance at the end of previous fiscal year ...................... 135,671 145,481 154,477 1,660 Changes in the current fiscal year: Financing of additional foundation funds ................... — — 15,000 161 Additions to reserve for dividends to policyholders .... (35,525) (31,868) (17,856) (191) Additions to accumulated foundation funds redeemed ................................................................ — — 15,000 161 Payment of interest on foundation funds .................. (716) (716) (716) (7) Net surplus for the year ............................................. 45,890 54,678 27,182 292 Redemption of foundation funds ............................... — — (15,000) (161) Reversal of reserve for redemption of foundation funds ..................................................... — — (15,000) (161) Reversal of revaluation reserve for land ..................... 161 (13,098) 44 0 Total changes in the current fiscal year ...................... 9,810 8,995 8,654 93 Balance at the end of current fiscal year ........................ 145,481 154,477 163,132 1,753
2008 2009 2010 2010
Millions of U.S. dollarsMillions of yen
Year ended March 31,
Consolidated Statements of Changes in Net Assets

39FUKOKU MUTUAL LIFE INSURANCE COMPANY
Valuation and translation adjustments: Net unrealized gains (losses) on available-for-sale securities, net of tax Balance at the end of previous fiscal year ...................... 273,382 115,335 (36,210) (389) Changes in the current fiscal year: Net changes, excluding foundation funds and surplus .. (158,046) (151,546) 84,255 905 Total changes in the current fiscal year ...................... (158,046) (151,546) 84,255 905 Balance at the end of current fiscal year ........................ 115,335 (36,210) 48,045 516 Deferred valuation gains (losses) under hedge accounting Balance at the end of previous fiscal year ...................... (152) 408 479 5 Changes in the current fiscal year: Net changes, excluding foundation funds and surplus .. 560 70 59 0 Total changes in the current fiscal year ...................... 560 70 59 0 Balance at the end of current fiscal year ........................ 408 479 538 5 Revaluation reserve for land, net of tax Balance at the end of previous fiscal year ...................... (12,204) (12,335) 814 8 Changes in the current fiscal year: Net changes, excluding foundation funds and surplus .. (130) 13,149 (40) (0) Total changes in the current fiscal year ...................... (130) 13,149 (40) (0) Balance at the end of current fiscal year ........................ (12,335) 814 773 8 Foreign currency translation adjustment Balance at the end of previous fiscal year ...................... 53 (3) (667) (7) Changes in the current fiscal year: Net changes, excluding foundation funds and surplus .. (56) (663) 83 0 Total changes in the current fiscal year ...................... (56) (663) 83 0 Balance at the end of current fiscal year ........................ (3) (667) (583) (6) Total valuation and translaiton adjustments Balance at the end of previous fiscal year ...................... 261,079 103,405 (35,584) (382) Changes in the current fiscal year: Net changes, excluding foundation funds and surplus .. (157,673) (138,989) 84,358 906 Total changes in the current fiscal year ...................... (157,673) (138,989) 84,358 906 Balance at the end of current fiscal year ........................ 103,405 (35,584) 48,774 524Minority interests Balance at the end of previous fiscal year ........................... 511 2,438 2,254 24 Changes in the current fiscal year: Net changes, excluding foundation funds and surplus ... 1,927 (184) 258 2 Total changes in the current fiscal year .......................... 1,927 (184) 258 2 Balance at the end of current fiscal year ............................. 2,438 2,254 2,513 27Total net assets Balance at the end of previous fiscal year ........................... 397,261 251,325 121,147 1,302 Changes in the current fiscal year: Financing of additional foundation funds ........................ — — 15,000 161 Additions to reserve for dividends to policyholders........ (35,525) (31,868) (17,856) (191) Additions to accumulated foundation funds redeemed.. — — 15,000 161 Payment of interest on foundation funds ....................... (716) (716) (716) (7) Net surplus for the year .................................................. 45,890 54,678 27,182 292 Redemption of foundation funds .................................... — — (15,000) (161) Reversal of reserve for redemption of foundation funds ........................................................ — — (15,000) (161) Reversal of revaluation reserve for land ......................... 161 (13,098) 44 0 Net changes, excluding foundation funds and surplus ... (155,746) (139,173) 84,617 909 Total changes in the current fiscal year .......................... (145,935) (130,177) 93,271 1,002 Balance at the end of current fiscal year ............................. ¥ 251,325 ¥ 121,147 ¥ 214,419 $ 2,304
2008 2009 2010 2010
Millions of U.S. dollarsMillions of yen
Year ended March 31,
Consolidated Statements of Changes in Net Assets (Continued)

40 FUKOKU MUTUAL LIFE INSURANCE COMPANY
I. Presentation of the Consolidated Financial Statements
1. Basis of PresentationThe accompanying consolidated financial statements have been prepared from the accounts maintained by Fukoku Mutual Life Insurance Company (the "Company") and its consolidated subsid-iaries in accordance with the provisions set forth in the Insur-ance Business Law of Japan and its related rules and regulations and in conformity with accounting principles generally accepted in Japan, which are different in certain respects from accounting principles generally accepted in countries and jurisdictions other than Japan. In addition, the notes to the consolidated financial state-ments include information which is not required under account-ing principles generally accepted in Japan but is presented herein as additional information. Amounts of less than one million yen have been eliminated. As a result, total in yen shown herein do not necessarily agree with the sum of the individual amounts.
2. U.S. Dollar Amounts
The translations of yen amounts into U.S. dollar amounts are included solely for the convenience of the reader and have been made, as a matter of arithmetical computation only, at the rate of ¥93.04 = US$1.00, the effective rate of exchange at the bal-ance sheet date of March 31, 2010. The translations should not be construed as representations that such yen amounts have been or could in the future be, converted into U.S. dollars at that or any other rates.
3. Principles of Consolidation
(1) Scope of consolidation
Consolidated subsidiaries for the year ended March 31, 2010 are listed below:
Fukoku Shinyo Hosho Company LimitedFukoku Capital Management, Inc.Fukokushinrai Life Insurance CompanyFukoku Information Systems Co., Ltd.Fukoku Life International (U.K.) LimitedFukoku Life International (America) Inc.
Fukokushinrai Life Insurance Company, whose shares were ac-quired by the Company on January 31, 2008, has been consoli-dated as a consolidated subsidiary since the year ended March 31, 2008. Major unconsolidated subsidiary is Fukoku Seimei Building Company Limited. Seven subsidiaries are excluded from the scope of consoli-dation, as each one of them is small in its total assets, amount of sales, net surplus for the year and surplus and is sufficiently insignificant to reasonable judgement on its impact on the finan-cial position and results of operation of the Company's group.
(2) Application of equity method
Unconsolidated subsidiaries (such as Fukoku Seimei building Company Limited, etc.) are insignificant in their impact on net surplus for the year and surplus, and also immaterial as a whole, therefore, application of equity method is withheld. There are no affiliates for the years ended March 31, 2008, 2009 and 2010.
(3) Fiscal year of consolidated subsidiaries
Among the subsidiaries to be consolidated, fiscal year-end of overseas subsidiaries is December 31. For the preparation of consolidated financial statements, financial statements as of that date are used and concerning any important transaction tak-ing place in between December 31 and the consolidated closing date, necessary adjustments for consolidation are made.
(4) Valuation of subsidiary's assets and liabilities on acquisition
On acquisition of a subsidiary, all of the subsidiary’s assets and liabilities that exist at the date of acquisition are recorded at their fair value.
(5) Amortization of goodwill
For the years ended March 31, 2008, 2009 and 2010, goodwill was amortized by the straight-line method over a period of 10 years and in case of the immaterial amount of goodwill, such amount is fully charged to operating expenses when incurred.
II. Notes to Balance Sheets
1. Significant Accounting Policies
(1) Valuation methods of securities
The valuation of securities, including bank deposits and mon-etary claims bought which are equivalent to securities, and securities managed as trust assets in money held in trust, is as follows:
Trading securities are stated at fair market value. Costs of their sales are determined by the moving average method.Held-to-maturity debt securities are stated at amortized cost under the straight-line method, cost being determined by the moving average method.Policy-reserve-matching bonds are stated at amortized cost under the straight-line method, cost being determined by the moving average method in accordance with "Temporary Treatment of Accounting and Auditing Concerning Policy-re-serve-matching Bonds in Insurance Industry" (Industry Audit Committee Report No.21 issued by the Japanese Institute of Certified Public Accountants on November 16, 2000).
i)
ii)
iii)
Notes to the Consolidated Financial Statements

41FUKOKU MUTUAL LIFE INSURANCE COMPANY
Investments in non-consolidated subsidiaries and affiliates which are not accounted for under the equity method are stated at cost, cost being determined by the moving average method.Available-for-sale securities with fair market value are stated at fair market value based on the market prices at the end of fiscal year. Costs of their sales are determined by the mov-ing average method. Net unrealized gains or losses on these available-for-sale securities, net of taxes, are recorded as a separate component of net assets. Available-for-sale securities with no fair market value are stated at cost, cost being determined by the moving average method, except for public and corporate bonds including foreign bonds, of which the difference between acquisition cost and face value is considered to be an adjustment of interest. Such bonds are stated at amortized cost under the straight-line method, cost being determined by the moving average method.
(2) Valuation methods of derivative instruments
Derivative instruments are stated at fair market value.
(3) Revaluation of land
The Company revalued the land for business purposes based on the Law for Revaluation of Land (Law No.34 promulgated on March 31, 1998). The difference between fair value and book value resulting from the revaluation, net of related taxes, is re-corded as revaluation reserve for land as a separate component of net assets and the related tax is recorded as deferred tax liabilities for revaluation reserve for land.
Date of revaluation: March 31, 2002Method of revaluation as prescribed for in Article 3 Paragraph 3 of the said Law:Calculation is based on the appraisal value for property tax set forth in Article 2 item 3 of the Enforcement Ordinance of the Law for Revaluation of Land (Government Ordinance No.119 promulgated on March 31, 1998) and the road rate set forth in Article 2 item 4 of the said Ordinance with certain reasonable adjustments.
(4) Depreciation of tangible fixed assets
Depreciation of the Company's tangible fixed assets is calcu-lated by the following methods.
Buildings (excluding lease assets)Acquired on or before March 31, 1998: Previous declining-balance methodAcquired on or after April 1, 1998 but on or before March 31, 2007: Previous straight-line methodAcquired on or after April 1, 2007: Straight-line methodAssets other than buildings (excluding lease assets)Acquired on or before March 31, 2007: Previous declining-balance method
Acquired on or after April 1, 2007: Declining-balance method
Lease assets related to finance lease transactions that do not
transfer ownership: Straight-line method over the lease term
Other tangible fixed assets acquired for ¥100,000 or more but less than ¥200,000 are depreciated equally over three years.
(5) Foreign currency translation
Foreign currency-denominated assets and liabilities are trans-lated into Japanese yen at the effective exchange rate prevailing at the balance sheet date.
(6) Allowance for possible loan losses
Allowance for possible loan losses is provided in accordance with the Company's standards of self-assessment and write-offs and reserves on credit quality:
For the credits of borrowers who are legally bankrupt such as being in the proceedings of bankruptcy or civil rehabilita-tion (hereinafter called "legally bankrupt borrowers") and who are substantially bankrupt (hereinafter called "substantially bankrupt borrowers"), the Company provides the remaining amount of credits after the direct write-off described below and the deductions of the amount expected to be collected through the disposal of collateral or the execution of guaran-tees.For the credits of borrowers who are not currently bank-rupt but have a high possibility of bankruptcy, the Company provides the amounts deemed as necessary considering the borrowers' ability to pay, within the amounts after deductions of the amount expected to be collected through the disposal of collateral or the execution of guarantees.For the credits of borrowers other than the above, the Compa-ny provides the amounts calculated by multiplying the borrow-ers' balance by the actual ratio of bad debt losses on defaults during a certain past period.
All credits are assessed by the relevant departments in accor-dance with the Company's standards of self-assessment on credit quality. The results of the assessment are reviewed by the audit department, which is independent of business-related divisions. Subsequently, the allowance for possible loan losses are provided based on the results of these assessments. For the credits of legally bankrupt borrowers and substan-tially bankrupt borrowers, the amounts remaining after deduc-tions of collateral value or the amounts collectible through the execution of guarantees is written-off directly from the bor-rower's balance as the estimated uncollectible amounts. The amounts written-off as of March 31, 2008, 2009 and 2010 were ¥958 million, ¥941 million and ¥9,159 million (US$98 million), respectively.
iv)
v)
i)
ii)
iii)
i)
ii)
i)
ii)
iii)

42 FUKOKU MUTUAL LIFE INSURANCE COMPANY
(7) Reserve for employees' retirement benefits
The Company and its consolidated subsidiaries adopt account-ing standards for employees' retirement benefits (Business Accounting Council dated June 16, 1998) and account for the re-serve for employees’ retirement benefits based on the projected benefit obligation and plan assets at the balance sheet date.
(8) Reserve for directors' and corporate auditors' retirement benefits
Reserve for directors' and corporate auditors' retirement benefits of the consolidated subsidiaries as of March 31, 2008 represents the estimated amounts to be recognized to have ac-crued at the end of the fiscal year.
(9) Reserve for price fluctuation of securities
Reserve for price fluctuation of securities is calculated in accor-dance with Article 115 of the Insurance Business Law.
(10) Lease Transactions as a Lessee
Finance lease transactions that do not transfer ownership to the lessee whose commencement day was on or before March 31, 2008 continued to be accounted for in a manner similar to ac-counting treatment for ordinary rental transactions.
(11) Lease Transactions as a Lessor
For the years ended March 31, 2009 and 2010, as for the finance lease transactions where the Company is a lessor, the lease fee is recorded in “interest, dividends and other income” at the time of receiving lease fee. The corresponding cost of the lease assets is recorded in “other investment expenses”, which is calculated by deducting an amount equivalent to the interest allocated over the lease term from the lease fee received.
(12) Accounting for hedge activities
Hedge accounting is based on "Accounting Standards for Financial Instruments" (ASBJ Statement No. 10 issued by the Accounting Standards Board of Japan on August 11, 2006). For the foreign currency forward contracts against the exchange rate fluctuations in the value of foreign currency-de-nominated bonds classified as available-for-sale securities, which qualify for hedge accounting because of high correlation and effectiveness between the hedging instruments and the hedged items, valuation gains and losses on the foreign currency for-ward contracts are recorded in the statements of operations. For the interest rate swaps against the interest rate fluc-tuations regarding loans, which qualify for hedge accounting because of high correlation and effectiveness between the
hedging instruments and the hedged items, valuation gains and losses on the interest rate swaps are deferred until the maturity of the hedged transactions. Deposits denominated in foreign currencies for which for-ward foreign exchange contracts are used to hedge the foreign currency fluctuations are translated at the contract rates if the forward contracts qualify for specific hedge accounting. In this case, exchange differences between the exchange rate on the trade date and the forward contract rate are allocated to each fiscal year from the date contracted to the date settled. For judging the effectiveness of hedge used, ratio analysis of comparing the fluctuations in the fair value or cash flows of hedged items and hedging instruments is mostly applied.
(13) Accounting for consumption taxes
The Company and its consolidated subsidiaries account for con-sumption taxes by the tax-exclusion method. The consumption taxes on certain assets, which are not deductible from consump-tion taxes withheld and that are stipulated to be deferred under the Tax Law, are deferred as prepaid expenses and amortized equally over five years. Consumption taxes other than deferred consumption taxes are recognized as an expense when in-curred.
(14) Policy reserve
Policy reserve is based on Article 116 of the Insurance Business Law, and the premium reserve at the end of fiscal year is calcu-lated by the following method: In regard to the policies subject to the standard policy reserve, the method as prescribed by the Commissioner of Fi-nancial Services Agency (Ministry of Finance Ordinance No. 48, 1996) is applied. In regard to the policies not subject to the standard policy reserve, the net level premium method is applied.
(15) Software
The software for internal use is amortized based on straight-line method over the estimated useful lives.
(16) Deferred assets
Discount on bonds is amortized equally over the period for which interest on bonds is fixed. This amount is deducted from bonds.
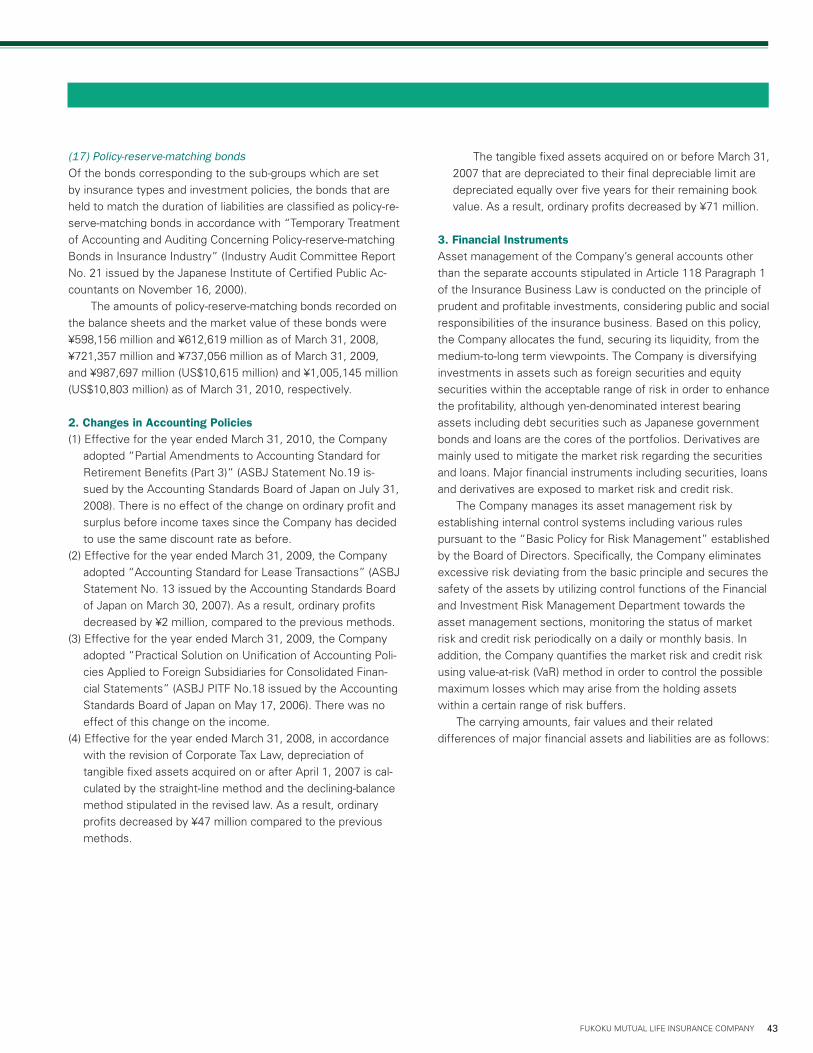
43FUKOKU MUTUAL LIFE INSURANCE COMPANY
(17) Policy-reserve-matching bonds
Of the bonds corresponding to the sub-groups which are set
by insurance types and investment policies, the bonds that are
held to match the duration of liabilities are classified as policy-re-
serve-matching bonds in accordance with “Temporary Treatment
of Accounting and Auditing Concerning Policy-reserve-matching
Bonds in Insurance Industry” (Industry Audit Committee Report
No. 21 issued by the Japanese Institute of Certified Public Ac-
countants on November 16, 2000).
The amounts of policy-reserve-matching bonds recorded on
the balance sheets and the market value of these bonds were
¥598,156 million and ¥612,619 million as of March 31, 2008,
¥721,357 million and ¥737,056 million as of March 31, 2009,
and ¥987,697 million (US$10,615 million) and ¥1,005,145 million
(US$10,803 million) as of March 31, 2010, respectively.
2. Changes in Accounting Policies(1) Effective for the year ended March 31, 2010, the Company
adopted “Partial Amendments to Accounting Standard for
Retirement Benefits (Part 3)“ (ASBJ Statement No.19 is-
sued by the Accounting Standards Board of Japan on July 31,
2008). There is no effect of the change on ordinary profit and
surplus before income taxes since the Company has decided
to use the same discount rate as before.
(2) Effective for the year ended March 31, 2009, the Company
adopted “Accounting Standard for Lease Transactions” (ASBJ
Statement No. 13 issued by the Accounting Standards Board
of Japan on March 30, 2007). As a result, ordinary profits
decreased by ¥2 million, compared to the previous methods.
(3) Effective for the year ended March 31, 2009, the Company
adopted “Practical Solution on Unification of Accounting Poli-
cies Applied to Foreign Subsidiaries for Consolidated Finan-
cial Statements” (ASBJ PITF No.18 issued by the Accounting
Standards Board of Japan on May 17, 2006). There was no
effect of this change on the income.
(4) Effective for the year ended March 31, 2008, in accordance
with the revision of Corporate Tax Law, depreciation of
tangible fixed assets acquired on or after April 1, 2007 is cal-
culated by the straight-line method and the declining-balance
method stipulated in the revised law. As a result, ordinary
profits decreased by ¥47 million compared to the previous
methods.
The tangible fixed assets acquired on or before March 31,
2007 that are depreciated to their final depreciable limit are
depreciated equally over five years for their remaining book
value. As a result, ordinary profits decreased by ¥71 million.
3. Financial InstrumentsAsset management of the Company’s general accounts other
than the separate accounts stipulated in Article 118 Paragraph 1
of the Insurance Business Law is conducted on the principle of
prudent and profitable investments, considering public and social
responsibilities of the insurance business. Based on this policy,
the Company allocates the fund, securing its liquidity, from the
medium-to-long term viewpoints. The Company is diversifying
investments in assets such as foreign securities and equity
securities within the acceptable range of risk in order to enhance
the profitability, although yen-denominated interest bearing
assets including debt securities such as Japanese government
bonds and loans are the cores of the portfolios. Derivatives are
mainly used to mitigate the market risk regarding the securities
and loans. Major financial instruments including securities, loans
and derivatives are exposed to market risk and credit risk.
The Company manages its asset management risk by
establishing internal control systems including various rules
pursuant to the “Basic Policy for Risk Management” established
by the Board of Directors. Specifically, the Company eliminates
excessive risk deviating from the basic principle and secures the
safety of the assets by utilizing control functions of the Financial
and Investment Risk Management Department towards the
asset management sections, monitoring the status of market
risk and credit risk periodically on a daily or monthly basis. In
addition, the Company quantifies the market risk and credit risk
using value-at-risk (VaR) method in order to control the possible
maximum losses which may arise from the holding assets
within a certain range of risk buffers.
The carrying amounts, fair values and their related
differences of major financial assets and liabilities are as follows:

44 FUKOKU MUTUAL LIFE INSURANCE COMPANY
(1) Securities including deposits and monetary claims bought
which are treated as securities based on “Accounting Stan-
dards for Financial Instruments” (ASBJ Statement No.10) and
securities managed as trust assets in money held in trust:
The fair values of marketable securities are measured at the
quoted market price at the end of fiscal year. The fair values
of other securities without the quoted market price are
based on the prices reasonably calculated such as the prices
offered by the information vendors or counterparty financial
institutions.
Investments in unconsolidated subsidiaries and affiliates,
unlisted equity securities and investments in partnerships
whereby partnership assets consist of unlisted equity
securities whose fair values are deemed extremely difficult
to obtain, are excluded from above securities. The carrying
amounts of investments in unconsolidated subsidiaries
and affiliates, unlisted equity securities and investments in
partnerships as of March 31, 2010 were ¥240 million (US$2
million), ¥8,863 million (US$95 million) and ¥8,306 million
(US$89 million), respectively.
(2) Loans and monetary claims bought treated as loans:
The fair values of policy loans are deemed to approximate
carrying values, considering estimated repayment period and
interest rate conditions since their repayment deadline have
not been set up due to the characteristics that the loan is
limited to the amount of cash surrender values. Therefore,
the carrying values are used as the fair values of policy loans.
The fair values of floating interest rate loans among the
ordinary loans and monetary claims bought treated as loans
approximate the carrying values because the market inter-
est rates are reflected in future cash flows in a short period.
Therefore, the fair values of floating interest rate loans and
monetary claims bought treated as loans are based on their
carrying values. The fair values of fixed interest rate loans are
measured by discounting the future cash flows to the present
values. The fair values of loans receivable from legally bank-
rupt borrowers, substantially bankrupt borrowers and borrow-
ers who are not currently bankrupt but have a high possibility
of bankruptcy and monetary claims bought treated as loans
are computed by deducting the amount of the allowance
for doubtful accounts from the carrying values before direct
write-offs.
(3) Derivative instruments:
The fair values of the futures and options traded at the
exchange are measured at the settlement price of the ex-
change.
As of March 31,
2010
Millions of yen Millions of U.S. dollars
Carrying amount Fair value Difference Carrying amount Fair value Difference
Monetary claims bought: Claims treated as loans ¥ 1,752 ¥ 1,743 ¥ (8) $ 18 $ 18 $ (0) Total monetary claims bought 1,752 1,743 (8) 18 18 (0)Money held in trust: Trading securities 31,902 31,902 — 342 342 — Total money held in trust 31,902 31,902 — 342 342 —Securities: Trading securities 79,317 79,317 — 852 852 — Held-to-maturity debt securities 514,566 519,051 4,485 5,530 5,578 48 Policy-reserve-matching bonds 987,697 1,005,145 17,448 10,615 10,803 187 Available-for-sale securities 2,558,975 2,558,975 — 27,504 27,504 — Total securities 4,140,556 4,162,490 21,933 44,502 44,738 235 Loans: Policy loans 76,695 76,694 (0) 824 824 (0) Ordinary loans 1,146,707 1,174,330 27,623 12,324 12,621 296 Total loans 1,223,402 1,251,025 27,623 13,149 13,446 296 Derivative instruments: Hedge accounting not applied (1,644) (1,644) — (17) (17) — Hedge accounting applied (4,006) (4,006) — (43) (43) — Total derivative instruments ¥ (5,650) ¥ (5,650) ¥ — $ (60) $ (60) $ —
i)

45FUKOKU MUTUAL LIFE INSURANCE COMPANY
i)
ii)
iii)
iv)
The fair values of options and swaps traded over the counter
are based on the quoted prices offered by counterparty finan-
cial institutions.
The fair values of foreign currency forward contracts are
determined based on the spot exchange rate and forward
contract rate.
4. Investment and Rental PropertyThe Company holds investment and rental properties such as
office buildings in Tokyo and other areas. The carrying amount
and the fair value of these investment and rental properties as
of March 31, 2010 were ¥223,701 million (US$2,404 million)
and ¥295,062 million (US$3,171 million), respectively. The fair
value is mainly based on the value calculated by the Company in
accordance with real estate appraisal standards which includes
some adjustments using the reference prices.
5. Loans ReceivableThe total amounts of credits to bankrupt borrowers, delinquent
loans, delinquent loans past 3 months or more and restructured
loans, which were included in loans, were ¥10,979 million,
¥10,712 million and ¥2,586 million (US$27 million) as of March
31, 2008, 2009 and 2010, respectively.
The balances of credits to bankrupt borrowers were ¥477 mil-
lion, ¥435 million and ¥300 million (US$3 million) as of March
31, 2008, 2009 and 2010, respectively.
The balances of delinquent loans were ¥10,502 million,
¥10,277 million and ¥2,119 million (US$22 million) as of March
31, 2008, 2009 and 2010, respectively.
There were no balances of delinquent loans past 3 months or
more as of March 31, 2008, 2009 and 2010.
The balances of restructured loans were ¥166 million (US$1
million) as of March 31, 2010, and no balances as of March
31, 2008 and 2009.
Credits to bankrupt borrowers represent loans, excluding the
balances already written-off, which meet the conditions pre-
scribed in Article 96 Paragraph 1 Item 3 and 4 of the Enforce-
ment Regulations of the Corporate Tax Law. Moreover, accruing
interest of these loans is not recorded as income after determin-
ing that principal of or interest on these loans is unlikely to be
collected due to the significant delay in repayment of principal or
interest payment or for some other reasons.
Delinquent loans are credits whose accruing interest is
not recorded as income due to the same reasons as described
above, and exclude credits to bankrupt borrowers and loans for
which interest payments have been suspended and rescheduled
to assist and support the borrowers in the restructuring of their
business.
Delinquent loans past 3 months or more are loans for which
interest payment or repayment of principal are delinquent for
3 months or more from the due date under the terms of the
related loan agreements, excluding those loans classified as
credits to bankrupt borrowers and delinquent loans.
Restructured loans are loans for which certain concessions
favorable to borrowers, such as interest reduction or exemp-
tions, rescheduling of due date of principal or interest payment,
waiver of claim or other terms, have been negotiated for the pur-
pose of assisting and supporting the borrowers in the restructur-
ing of their business. This category excludes loans classified as
credits to bankrupt borrowers, delinquent loans and delinquent
loans past 3 months or more.
The direct write-offs related to loans decreased credits to
bankrupt borrowers described above by ¥102 million, ¥102 mil-
lion and ¥8,149 million (US$87 million) as of March 31, 2008,
2009 and 2010, respectively.
The direct write-offs related to loans decreased delinquent
loans described above by ¥824 million, ¥786 million and ¥938
million (US$10 million) as of March 31, 2008, 2009 and 2010,
respectively.
6. Accumulated Depreciation of Tangible Fixed AssetsAccumulated depreciation of tangible fixed assets totaled
to ¥122,670 million, ¥124,761 million and ¥129,828 million
(US$1,395 million) as of March 31, 2008, 2009 and 2010, re-
spectively.
7. Separate AccountsTotal assets in separate accounts provided for in Article 118 of
the Insurance Business Law were ¥117,591 million, ¥113,498
million and ¥95,207 million (US$1,023 million) as of March 31,
2008, 2009 and 2010, respectively. The amounts of separate
account liabilities were the same as separate account assets.
8. Receivables from/Payables to Unconsolidated SubsidiariesThe total amounts of receivables from/payables to unconsoli-
dated subsidiaries were, ¥3,540 million and ¥162 million as of
March 31, 2008, ¥3,425 million and ¥165 million as of March 31,
2009, and ¥3,308 million (US$35 million) and ¥186 million (US$2
million) as of March 31, 2010, respectively.
9. Monetary Claims to DirectorsMonetary claims to directors of the Company as of March 31,
2008, 2009 and 2010 were ¥16 million, ¥12 million and ¥8 mil-
lion (US$93 thousand), respectively.
ii)
iii)

46 FUKOKU MUTUAL LIFE INSURANCE COMPANY
11. Reserve for Dividends to Policyholders
Changes in reserve for dividends to policyholders were as follows: Year ended March 31, 2008 2009 2010 2010
Millions of Millions of yen U.S. dollars
Balance at the end of previous fiscal year .................................................. ¥ 52,872 ¥ 54,382 ¥57,317 $616Transfer from surplus in previous fiscal year .............................................. 35,525 31,868 17,856 191Dividends paid in the current fiscal year ..................................................... (34,216) (29,176) (20,571) (221)Increase in interest ..................................................................................... 200 242 157 1Increase due to addition of consolidated subsidiary ................................... 680 — — —Balance at the end of fiscal year ................................................................. ¥ 55,063 ¥ 57,317 ¥54,759 $588
Reserve for dividends to policyholders as of March 31, 2008
on the balance sheet represented the total of the Company's reserve of ¥54,382 million and Fukokushinrai Life Insurance
Company's reserve of ¥680 million.
10. Income TaxesDeferred tax assets and deferred tax liabilities as of March 31,
2008 were ¥107,538 million and ¥67,932 million, respectively.
Valuation allowance for deferred tax assets was ¥2,836 million.
Major components of deferred tax assets were ¥61,054
million of policy reserves, ¥19,561 million of reserve for price
fluctuation of securities and ¥17,931 million of reserve for em-
ployees' retirement benefits and major component of deferred
tax liabilities was ¥65,707 million of net unrealized gains on
available-for-sale securities as of March 31, 2008.
For the year ended March 31, 2008, the Company's statu-
tory tax rate was 36.2%. The major difference between the
statutory tax rate and 16.0% of the actual effective tax rate was
(21.0%) of reserve for dividends to policyholders.
Deferred tax assets and deferred tax liabilities as of March
31, 2009 were ¥116,732 million and ¥1,939 million, respectively.
Valuation allowance for deferred tax assets was ¥4,188 million.
Major components of deferred tax assets were ¥57,809 mil-
lion of policy reserves, ¥20,318 million of net unrealized losses
on available-for-sale securities and ¥17,857 million of reserve for
employees' retirement benefits as of March 31, 2009.
For the year ended March 31, 2009, the Company's statu-
tory tax rate was 36.2%. The major differences between the
statutory tax rate and 22.8% of the actual effective tax rate
were (9.2%) of reserve for dividends to policyholders and (6.7%)
of revaluation reserve for land.
Deferred tax assets and deferred tax liabilities as of March
31, 2010 were ¥96,103 million (US$1,032 million) and ¥29,717
million (US$319 million), respectively. Valuation allowance for
deferred tax assets was ¥3,077 million (US$33 million).
Major components of deferred tax assets were ¥57,858
million (US$621 million) of policy reserves, ¥18,034 million
(US$193 million) of reserve for employees’ retirement benefits
and ¥9,667 million (US$103 million) of reserve for price
fluctuation of securities as of March 31, 2010. Major component
of deferred tax liabilities was ¥27,435 million (US$294 million) of
net unrealized gains on available-for-sale securities as of March
31, 2010.
For the year ended March 31, 2010, the Company’s statu-
tory tax rate was 36.2%. The major difference between the
statutory tax rate and 12.6% of the actual effective tax rate was
(22.5%) of reserve for dividends to policyholders.

47FUKOKU MUTUAL LIFE INSURANCE COMPANY
12. Reserve for Dividends to Policyholders (Fukokushinrai Life Insurance Company)
Changes in reserve for dividends to policyholders were as follows: Year ended March 31, 2009 2010 2010
Millions of Millions of yen U.S. dollars
Balance at the end of previous fiscal year .............................................................................. ¥680 ¥533 $5Dividends paid in the current fiscal year ................................................................................. (423) (346) (3)Increase in interest ................................................................................................................. 0 1 0Provision for reserve for dividends to policyholders ............................................................... 276 397 4
Balance at the end of fiscal year ............................................................................................. ¥533 ¥585 $6
13. Stocks of Unconsolidated SubsidiariesThe amounts of stocks of unconsolidated subsidiaries the Com-
pany held as of March 31, 2008, 2009 and 2010 were ¥240 mil-
lion, ¥240 million and ¥240 million (US$2 million), respectively.
14. Pledged Assets and Secured DebtsAssets pledged as collateral as of March 31, 2008 were ¥15,223
million of securities and ¥19 million of money held in trust. Se-
cured debts as of March 31, 2008 were ¥4,660 million.
Assets pledged as collateral as of March 31, 2009 were
¥26,010 million of securities. Secured debts as of March 31,
2009 were ¥4,645 million.
Assets pledged as collateral as of March 31, 2010 were
¥21,642 million (US$232 million) of securities. Secured debts as
of March 31, 2010 were ¥4,548 million (US$48 million).
15. Policy Reserves for the Reinsurance ContractsReserve for outstanding claims for the reinsurance contracts
provided in accordance with Article 71 Paragraph 1 of the En-
forcement Regulation of the Insurance Business Law (hereinafter
called "reserve for outstanding claims for ceded reinsurance")
were ¥55 million and ¥32 million (US$353 thousand) as of March
31, 2009 and 2010.
Policy reserve for the reinsurance contracts provided in ac-
cordance with Article 71 Paragraph 1 of the Enforcement Regu-
lation of the Insurance Business Law (hereinafter called "policy
reserve for ceded reinsurance") were ¥57 million and ¥56 million
(US$604 thousand), as of March 31, 2009 and 2010.
16. Additional Foundation FundsThe Company raised additional foundation funds of ¥15,000 mil-
lion (US$161 million) during the year ended March 31, 2010 in
accordance with Article 60 of the Insurance Business Law.
17. Redemption of Foundation FundsIn the year ended March 31, 2010, in connection with the
redemption of foundation funds of ¥15,000 million (US$161
million), the Company reversed the reserve for redemption of
foundation funds and provided the equivalent amount for accu-
mulated foundation funds redeemed in accordance with Article
56 of the Insurance Business Law.
18. Commitment LineAs of March 31, 2008, 2009 and 2010, there were unused
commitment line agreements under which the Company is the
lender of ¥1,681 million, ¥1,481 million and ¥5,653 million (US$60
million), respectively.

48 FUKOKU MUTUAL LIFE INSURANCE COMPANY
21. Reserve for Employees’ Retirement Benefits
(1) The reserve for employees’ retirement benefits as of March 31, 2008, 2009 and 2010 were calculated as follows: As of March 31,
2008 2009 2010 2010
Millions of Millions of yen U.S. dollars
a. Projected benefit obligation .................................................................... ¥(71,792) ¥(72,001) ¥(71,617) $769b. Fair value of pension plan assets ............................................................ 18,307 15,016 16,009 172c. Unfunded benefit obligation (a+b) .......................................................... (53,485) (56,985) (55,608) (597)d. Unrecognized actuarial differences ........................................................ 3,758 7,499 5,667 60e. Unrecognized prior service cost ............................................................. 206 172 137 1f. Reserve for employees' retirement benefits (c+d+e) ............................. ¥(49,519) ¥(49,313) ¥(49,803) $(535)
(2) Gross amount of retirement benefit expenses for the years ended March 31, 2008, 2009 and 2010 were as follows:
Year ended March 31, 2008 2009 2010 2010
Millions of Millions of yen U.S. dollars
Service cost ................................................................................................ ¥3,404 ¥3,224 ¥3,173 $34Interest cost ............................................................................................... 1,472 1,434 1,438 15Expected return on plan assets .................................................................. (964) (640) (450) (4)Recognized actuarial differences ................................................................ 523 779 1,231 13Amortization of prior service cost ............................................................... 34 34 34 0 ¥4,469 ¥4,831 ¥5,427 $58
(3) The Company’s assumptions used in calculation of the above information were as follows: Year ended March 31, 2008 2009 2010
Method of attributing the projected benefits to periods of service ................................
Discount rate .................................................................................................................. 2.0% 2.0% 2.0%Expected rate of return on pension plan assets ............................................................. 4.5% 3.5% 3.0%Recognition period of actuarial differences .................................................................... 10 years 10 years 10 yearsAmortization period of prior service cost ........................................................................ 10 years 10 years 10 years
19. Subordinated Bonds
Repayments of subordinated bonds are subordinated to other obligations.
20. Contribution to Policyholders Protection Corporation
The future contribution to the Life Insurance Policyholders Pro-
tection Corporation of Japan under Article 259 of the Insurance Business Law were estimated at ¥11,527 million, ¥11,283 mil-lion and ¥10,915 million (US$117 million) as of March 31, 2008, 2009 and 2010, respectively. The contributions were charged as operating expenses in the year in which they were paid.
Straight-line Straight-line Straight-line basis basis basis
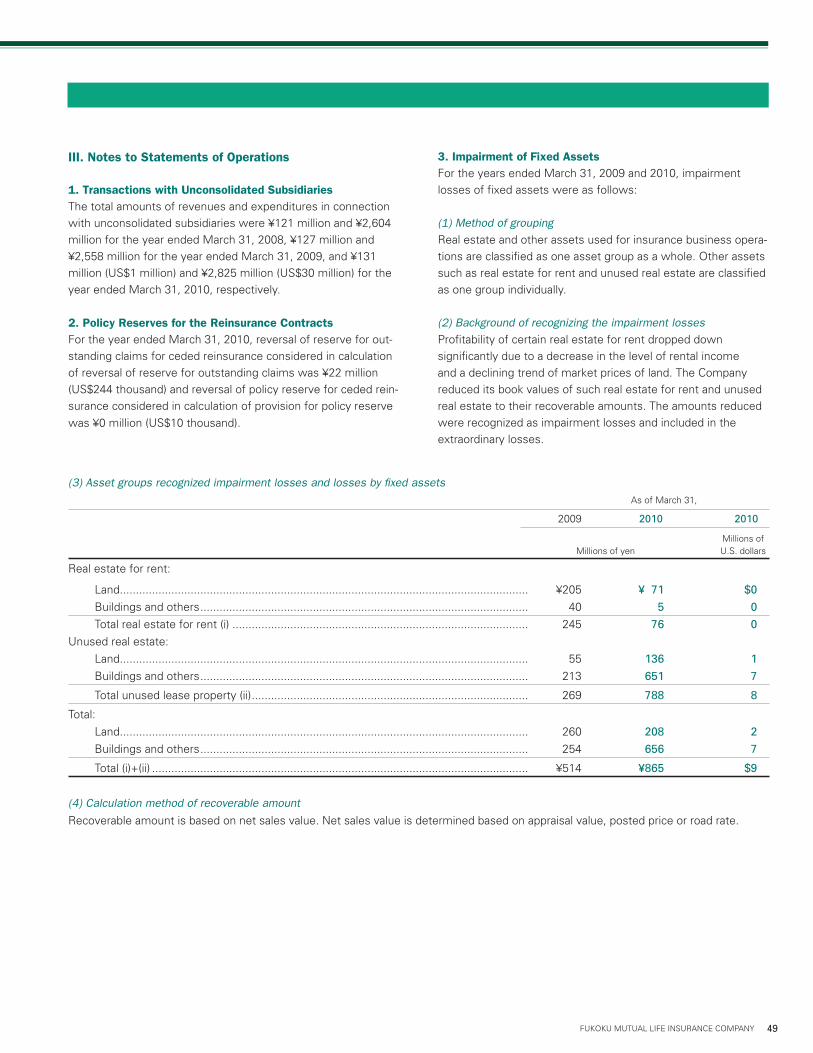
49FUKOKU MUTUAL LIFE INSURANCE COMPANY
(3) Asset groups recognized impairment losses and losses by fixed assets As of March 31,
2009 2010 2010
Millions of Millions of yen U.S. dollars
Real estate for rent:
Land............................................................................................................................... ¥205 ¥ 71 $0 Buildings and others ...................................................................................................... 40 5 0 Total real estate for rent (i) ............................................................................................ 245 76 0Unused real estate:
Land............................................................................................................................... 55 136 1 Buildings and others ...................................................................................................... 213 651 7
Total unused lease property (ii) ...................................................................................... 269 788 8
Total:
Land............................................................................................................................... 260 208 2 Buildings and others ...................................................................................................... 254 656 7
Total (i)+(ii) ..................................................................................................................... ¥514 ¥865 $9
(4) Calculation method of recoverable amount
Recoverable amount is based on net sales value. Net sales value is determined based on appraisal value, posted price or road rate.
III. Notes to Statements of Operations
1. Transactions with Unconsolidated SubsidiariesThe total amounts of revenues and expenditures in connection
with unconsolidated subsidiaries were ¥121 million and ¥2,604
million for the year ended March 31, 2008, ¥127 million and
¥2,558 million for the year ended March 31, 2009, and ¥131
million (US$1 million) and ¥2,825 million (US$30 million) for the
year ended March 31, 2010, respectively.
2. Policy Reserves for the Reinsurance ContractsFor the year ended March 31, 2010, reversal of reserve for out-
standing claims for ceded reinsurance considered in calculation
of reversal of reserve for outstanding claims was ¥22 million
(US$244 thousand) and reversal of policy reserve for ceded rein-
surance considered in calculation of provision for policy reserve
was ¥0 million (US$10 thousand).
3. Impairment of Fixed AssetsFor the years ended March 31, 2009 and 2010, impairment
losses of fixed assets were as follows:
(1) Method of grouping
Real estate and other assets used for insurance business opera-
tions are classified as one asset group as a whole. Other assets
such as real estate for rent and unused real estate are classified
as one group individually.
(2) Background of recognizing the impairment losses
Profitability of certain real estate for rent dropped down
significantly due to a decrease in the level of rental income
and a declining trend of market prices of land. The Company
reduced its book values of such real estate for rent and unused
real estate to their recoverable amounts. The amounts reduced
were recognized as impairment losses and included in the
extraordinary losses.

50 FUKOKU MUTUAL LIFE INSURANCE COMPANY
As of March 31,
2008 2009 2010 2010
Millions of Millions of yen U.S. dollars
Cash and deposits ................................................................................................... ¥ 52,963 ¥ 68,692 ¥83,557 $ 898Call loans ................................................................................................................. 125,500 183,600 91,000 978Monetary claims bought .......................................................................................... 2,533 2,055 1,752 18Time deposits maturing over 3 months of the date of acquisition .......................... (200) (300) (200) (2)Foreign currency deposits maturing over 3 months of the date of acquisition ....... (306) (366) (472) (5)Monetary claims bought maturing over 3 months of the date of acquisition .......... (2,533) (2,055) (1,752) (18)Cash and cash equivalents ...................................................................................... ¥177,956 ¥251,626 ¥173,885 $1,868
IV. Notes to Statements of Cash Flows
1. Scope of Cash and Cash EquivalentsCash and cash equivalents as of March 31, 2008, 2009 and 2010
consist of "Cash", "Deposits in transfer account", "Current depos-
its", "Ordinary deposits", "Notice deposits", "Time deposits matur-
ing within 3 months of the date of acquisition", "Foreign currency
deposits maturing within 3 months of the date of acquisition",
"Negotiable certificate of deposits maturing within 3 months of
the date of acquisition", "Call loans" and "Monetary claims bought
maturing within 3 months of the date of acquisition".
2. Reconciliations of Cash and Cash EquivalentsReconciliations of cash and cash equivalents in the consolidated
statements of cash flows to the consolidated balance sheets ac-
counts as of March 31, 2008, 2009 and 2010 were as follows:
As of March 31,
2008
Millions of yen
Assets ................................................................................................................................................ ¥81,897
Securities ........................................................................................................................................ 74,549
Goodwill ............................................................................................................................................. 7,447
Liabilities ............................................................................................................................................ (72,835)
Policy reserves ............................................................................................................................... (72,029)
Minority interests .............................................................................................................................. (1,812)
Acquisition value of Fukokushinrai Life Insurance Company ............................................................. 14,696
Cash and cash equivalents of Fukokushinrai Life Insurance Company ............................................. (2,966)
Net payment for acquisition of Fukokushinrai Life Insurance Company ........................................... ¥11,729
3. Acquisition of Fukokushinrai Life Insurance CompanyMajor components of assets and liabilities of Fukokushinrai Life
Insurance Company which was newly consolidated as a subsid-
iary during the year ended March 31, 2008 and net payment for
its acquisition were as follows:

51FUKOKU MUTUAL LIFE INSURANCE COMPANY
1. Matters relating to the basic framework of internal control over financial reportingTomofumi Akiyama, President of Fukoku Mutual Life Insurance Company (the "Company"), is responsible for the design and operation of internal control over financial reporting for the Company's financial statements, namely, consolidated balance sheet and the related consolidated statement of operations, changes in net assets and cash flows prepared in accordance with Paragraph 2, Article 110 of the Insurance Business Law. The Company designs and operates its internal control over financial reporting in accordance with the basic framework of internal control set forth in the "Standards and Practice Standards for Management Assessment and Audit concerning Internal Control Over Financial Reporting (Council Opinions)" issued by the Business Accounting Council of the Financial Service Agency of Japan.
Internal control aims at achieving the objectives to a reasonable extent with the organized and integrated function of individual components of internal control as a whole. Therefore, internal control over financial reporting cannot always ensure the prevention or detection of misstatements in the presentation of financial reporting.
2. Matters relating to the scope of assessment, the basis date of assessment and the assessment proceduresThe Company performed an assessment of internal control over financial reporting for its consolidated financial state-ments as of the end of the fiscal years, March 31, 2009 and 2010, in accordance with generally accepted assessment standards in Japan for internal control over financial reporting.
In the assessment of internal control over financial reporting, the Company first assessed internal controls that have a material impact on overall consolidated financial reporting ("company-level controls") and, based on the results, the Company selected the business processes to be assessed. In assessing those business processes, the Company analyzed selected business processes, identified a key control that would have a material impact on the reliability of financial reporting, and assessed the establishment and operation with regard to the key control. The Company as-sessed the effectiveness of internal control by the aforementioned procedures.
For the Company and its consolidated subsidiaries, the Company determined the scope of assessment of internal control over financial reporting from the perspective of their materiality to the reliability of financial reporting. The mate-riality to the reliability of financial reporting is determined in light of their degree of quantitative and qualitative impact. The Company rationally determined the scope of assessment of internal controls incorporated into business processes ("process-level controls") based on the results of assessment of company-level controls regarding the Company and one consolidated subsidiary. Other than those indicated above, five consolidated subsidiaries were determined to be immaterial from quantitative and qualitative perspectives. Consequently, they are excluded from the scope of assess-ment of company-level controls.
With respect to the scope of assessment of process-level controls, the locations or business units were selected in descending order of ordinary revenues (after elimination of inter-company transactions) in the previous fiscal year until their combined amount reached about two-thirds of consolidated ordinary revenues. As a result, the Company was selected as "significant locations or business units". At selected significant locations and business units (the Company), business processes related to accounting items that were closely associated with the company's business objectives, including securities, ordinary loans and policy reserves, as well as premium and other income and claims and other payments, which have a material impact on the calculation of policy reserves, were determined to be within the scope of assessment. Furthermore, at selected significant locations and business units and any other locations and business units, added to the scope of assessment were business processes relating to important accounting items that have a high possibility of material misstatements and involve estimates and judgments, and business processes relating to businesses or operations dealing with high-risk transactions.
3. Matters relating to the results of the assessmentAs a result of performing the assessment, the Company concluded that the design and operation of internal control over financial reporting for the Company were effective as of March 31, 2009 and 2010.
4. Supplementary Information (None)
May 19, 2010 Tomofumi Akiyama President
Fukoku Mutual Life Insurance Company
Management’s Report on Internal Control over Financial Reporting

52 FUKOKU MUTUAL LIFE INSURANCE COMPANY
Financial Statements AuditWe have audited the accompanying consolidated balance sheets of Fukoku Mutual Life Insurance Company and its consolidated subsidiaries as of March 31, 2008, 2009 and 2010, and the related consolidated state-ments of operations, changes in net assets and cash flows for the years then ended, all expressed in Japa-nese yen. These consolidated financial statements are the responsibility of the Company's management. Our responsibility is to independently express an opinion on these consolidated financial statements based on our audits.
We conducted our audits in accordance with auditing standards generally accepted in Japan. Those stan-dards require that we plan and perform the audit to obtain reasonable assurance about whether the finan-cial statements are free of material misstatement. An audit includes examining, on a test basis, evidence supporting the amounts and disclosures in the financial statements. An audit also includes assessing the accounting principles used and significant estimates made by management, as well as evaluating the overall financial statement presentation. We believe that our audits provide a reasonable basis for our opinion.
In our opinion, the consolidated financial statements referred to above present fairly, in all material respects, the consolidated financial position of Fukoku Mutual Life Insurance Company and its consolidated subsidiar-ies as of March 31, 2008, 2009 and 2010, and the consolidated results of their operations and their cash flows for the years then ended in conformity with accounting principles generally accepted in Japan.
The amounts expressed in U.S. dollars, which are provided solely for the convenience of the reader, have been translated on the basis set forth in Note I. 2 to the accompanying consolidated financial statements with respect to the year ended March 31, 2010.
Internal Control Audit We have also audited the management's report on internal control over financial reporting of the consoli-dated financial statements of Fukoku Mutual Life Insurance Company as of March 31, 2009 and 2010. The Company's management is responsible for designing and operating effective internal control over financial reporting and for preparing its report on internal control. Our responsibility is to express an opinion on man-agement's report on internal control based on our audit. There is a possibility that material misstatements may not be completely prevented or detected by internal control over financial reporting.
We conducted our internal control audit in accordance with auditing standards for internal control over financial reporting generally accepted in Japan. Those standards require that we plan and perform the audit to obtain reasonable assurance about whether management's report on internal control is free of material misstatement. An internal control audit includes examining, on a test basis, representations on the scope, procedures and results of the assessment of internal control over financial reporting made by management, as well as evaluating the overall presentation of management's report on internal control. We believe that our internal control audit provides a reasonable basis for our opinion.
In our opinion, management's report on internal control referred to above, which represents that the internal control over financial reporting of the consolidated financial statements of Fukoku Mutual Life Insurance Company as of March 31, 2009 and 2010, is effectively maintained, presents fairly, in all material respects, the assessment of internal control over financial reporting in conformity with assessment standards for inter-nal control over financial reporting generally accepted in Japan.
Tokyo, Japan May 20, 2010
Kisaragi Audit Corporation
The Board of Directors of Fukoku Mutual Life Insurance Company
Report of Independent Auditors

13FUKOKU MUTUAL LIFE INSURANCE COMPANY
Board of Representative Members of Policyholders
Board of Statutory Auditors
Independent Auditors
Assistant to the Statutory Auditors
Secretarial Div.
Strategic Planning Dept.
Compliance Control Dept.
Corporate Risk Management Dept.
General Affairs Dept.
Personnel Dept.
Marketing Headquarters
Market Planning Dept.
Retail Management Dept.
Market Developing Dept.
Strategic Market Promotion Dept.
Group Credit Div. Related to Japan Housing Finance Agency
Wholesale Management Dept.
Sales Personnel Training Dept.
Customer Service Headquarters
Group Insurance Dept.
Group Annuity Dept.
Pension Actuarial Div.
Customer Service Dept.
Underwriting and Medical Dept.
Claims Dept.
Policy Administration Dept.
Claim Inspection Dept.
Operation & System Planning Dept.
Fixed Income Dept.
Equities Dept.
Loans Dept.
Separate Accounts Management Div.
Real Estate Dept.
Financial and investment Planning Dept.
Investment Assets Administrative Div.
Financial and Investment Risk Management Dept.
Accounting Dept.
Actuarial Dept.
Internal Auditing Dept.
Affiliated Business Dept.
Committee for Editing History of the Company
Branch Offices
Nomination Committee of Candidates for Representative Members
Secretariat for Nomination Committee of Candidates for Representative Members
Board of Directors
Executive Committee
Council
Chief Actuary
Organization (as of July 2, 2010)
Branch Office 62
Field Office 487
Employees (as of March 31, 2010)
Office Staff 2,774
Sales Representative 11,433
Corporate Organization
53FUKOKU MUTUAL LIFE INSURANCE COMPANY

14 FUKOKU MUTUAL LIFE INSURANCE COMPANY
Board of Directors and Statutory Auditors
Head Office
2-2, Uchisaiwaicho 2-chome,
Chiyoda-ku, Tokyo 100-0011,
Japan
Phone: 81-3-3508-1101
Facsimile: 81-3-3591-6446
Fukoku Life International (America) Inc.
Times Square Tower,
7 Times Square, 35th Floor,
New York, NY 10036, U.S.A.
Phone: 1-212-221-7760
Facsimile: 1-212-221-7794
Fukoku Life International (U.K.) Ltd.From left: J. Doran, K. Sato, J. Morita, K. Ohkawa and D. Reynolds
Fukoku Life International (America) Inc.From left: M. Xu, M. Jensen, Y. Onodera, S. Nozaki and A. Chang
Statutory Auditors (Standing):
Shuichi MaedaAkio Imai
Executive Officers:
Tsutomu HirumaToshiaki KiwaToshiro EtoHaruki KawashimaToyoaki ObaToshimitsu Furuhashi
*Representative Director
(as of July 2, 2010)
Chairman of the Board
Tomofumi Akiyama
President and Chief
Executive Officer
Yoshiteru Yoneyama*
Deputy Presidents and Executive Officers:
Mikio YamamotoKatsumasa Furuya
Directors and Managing Executive Officers:
Kenji HiraiTadashi Akikawa
Directors:
Katsuhiro UtadaKozo Isshiki
Directors and Executive Officers:
Hitoshi SakaiToshihiro HayashiToshihide Fujiwara
Statutory Auditors:
Yoshizumi NezuMitsuo OhashiAkihiro Mochizuki
Directory Fukoku Life International (U.K.) Ltd.
3rd Floor, Baltic Exchange,
38 St. Mary Axe, London,
EC3A 8EX, U.K.
Phone: 44-20-7283-1331
Facsimile: 44-20-7626-7096
Corporate Information
54 FUKOKU MUTUAL LIFE INSURANCE COMPANY

17FUKOKU MUTUAL LIFE INSURANCE COMPANY
ContentsFinancial Highlights (Non-consolidated) ....................... 1Message from the President ......................................... 2Fukoku Life’s Management Philosophy ........................ 3Review of Operations (Non-consolidated) Overview ..................................................................... 4 Business Performance in FY2009 .............................. 5 Investment Performance in FY2009 (General Account) ..................................................... 7 Investment Policies for FY2010 ................................. 8Governance System ........................................................ 9Corporate Citizenship ...................................................... 10Non-consolidated Financial Statements ........................ 12Consolidated Financial Statements .............................. 32Corporate Organization ................................................. 53Corporate Information ................................................... 54

FUK
OK
U M
UTU
AL LIFE
INS
UR
AN
CE
CO
MPA
NY A
nn
ual R
epo
rt 2010
Annual Report 2010Year Ended March 31, 2010
Printed in Japan