fukushima incident preliminary analysis & … incident preliminary analysis, ... iffco plant at...
TRANSCRIPT
Fukushima Incident
Preliminary Analysis, Consequences
and
Safety Status of Indian NPPs
Dr. S.K.Jain
Chairman & Managing Director
NPCIL & BHAVINI

Contents
• Introduction
• Overview of the Incident
• Sequence of Events & Present Scenario
• Preliminary Analysis
• Safety Status of Indian NPPs
• Actions taken by Indian & International agencies
• Radiation & Emergency Preparedness aspects

Nuclear Power Reactors in Japan
Total Reactors in Operation : 54
Under Construction : 02
Reactors in the zone of event : 13
Fukushima-Daiichi(6), Daiini(4), Onagawa (3)
318 March 2011


Location of NPPs in Japan
In Operation :54, Construction:02

Reactors affected by Earthquake in Japan
• Fukushima Daiichi•Unit -1- Automatic Shutdown•Unit-2- Automatic Shutdown•Unit-3 - Automatic Shutdown•Unit-4 - Maintenance Outage•Unit-5- Maintenance Outage•Unit-6 - Maintenance Outage
•Fukushima Daiini•Unit -1- Automatic Shutdown•Unit-2- Automatic Shutdown•Unit-3 - Automatic Shutdown•Unit-4 – Automatic Shutdown
•Onagawa•Unit -1- Automatic Shutdown•Unit-2- Automatic Shutdown•Unit-3 - Automatic Shutdown
6
1.Automatic reactor
shutdown
terminated the
chain reaction-
Nuclear fission
stops within
seconds
2.The only issue is to
remove radioactive
decay heat from
fuel18 March 2011

Units at Fukushima-Daiichi
UnitCapacity
(MWe)
Construction
Start
Commercial
Operation startSupplier
No.1 460 April, 1967 March, 1971 GE
No.2 784 Jan, 1969 July, 1974 GE/Toshiba
No.3 784 Aug, 1970 March, 1976 Toshiba
No.4 784 Sep, 1972 Oct, 1978 Hitachi
No.5 784 Dec, 1971 April, 1978 Toshiba
No.6 1100 May, 1973 Oct, 1979 GE/Toshiba
Total Power : 4696 MWe
7
Events at Fukushima Dai-ichi NPP
Earthquake of magnitude 9.0 on 11 March 2011
followed by Tsunami of 14 meter high waves -
beyond the design basis.
All operating plants at the affected area
automatically shutdown - Terminating chain
reaction.
Reactor core Cooling – Continued for one hour,
got incapacitated after tsunami- caused fuel over
heating-Metal Water Reaction - Hydrogen
Generation- Explosion inside the outer Building. .
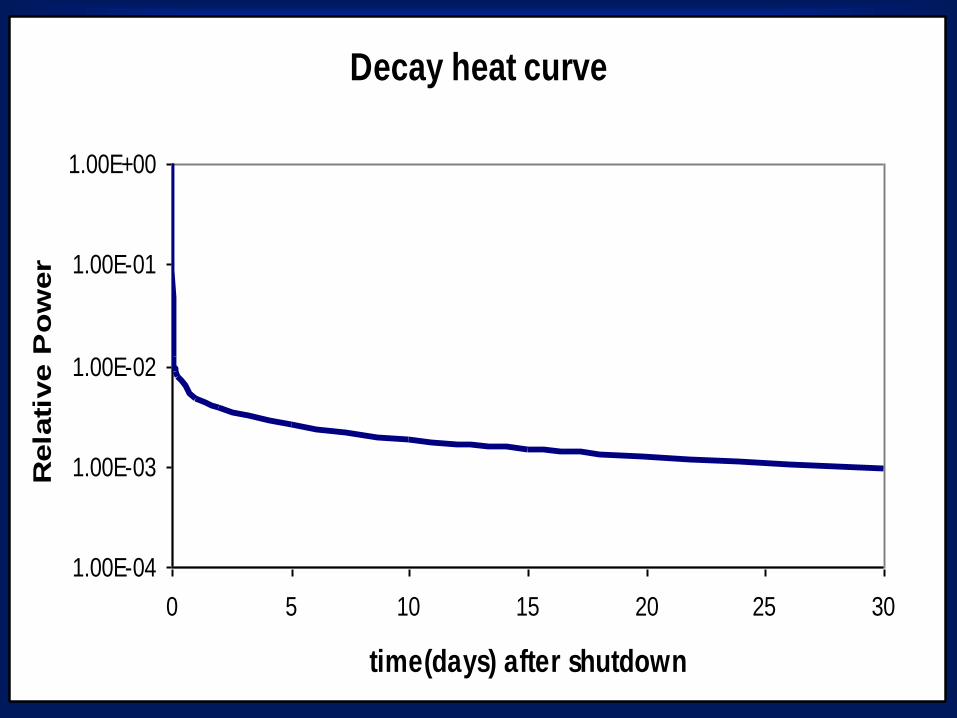
Decay heat curve
1.00E-04
1.00E-03
1.00E-02
1.00E-01
1.00E+00
0 5 10 15 20 25 30
time(days) after shutdown
Rela
tive P
ow
er

Incident Overview

IAEA
•
Information sources
NISA, Japan
JAIF

12

Events at Fukushima Dai-ichi NPP
No nuclear explosion.
Hydrogen generated led
to explosion damaging
the outer concrete
building .
The reactor pressure
vessels integrity
unaffected.
No death on account of
radiation exposure.

FUKUSHMIMA Daai-ichi - Before
14

FUKUSHMIMA Dai-ichi - After
15

Possible scenario
of
progression of events
16

Root Cause
~ 14 m

Developed scenarioBoth off site and on site electrical power supply was not available (SBO condition).
In such case Two actions are needed:
– Residual heat removal by cooling and depressurization
– Emergency feed
• For lining up both the above systems valves are to be operated which are DC operated, but these were not available
18

Developed scenario
• Tsunami waves damaged – pump house equipment-the water overflowed
the pumps for the cooling water system.
– Suppression pool heat exchangers.
– Cooling pumps that provide cooling water to DG sets-DG fuel oil tanks, located above ground, were carried away.
– AC and DC switch gears - hampered operator response as all indications and plant lighting were lost
19

20

BWR Schematic (Mark-1 type)

Fukushima Daiichi, Unit-1 Cross Section
Mark-1 containment
22
Spent
Fuel Pool
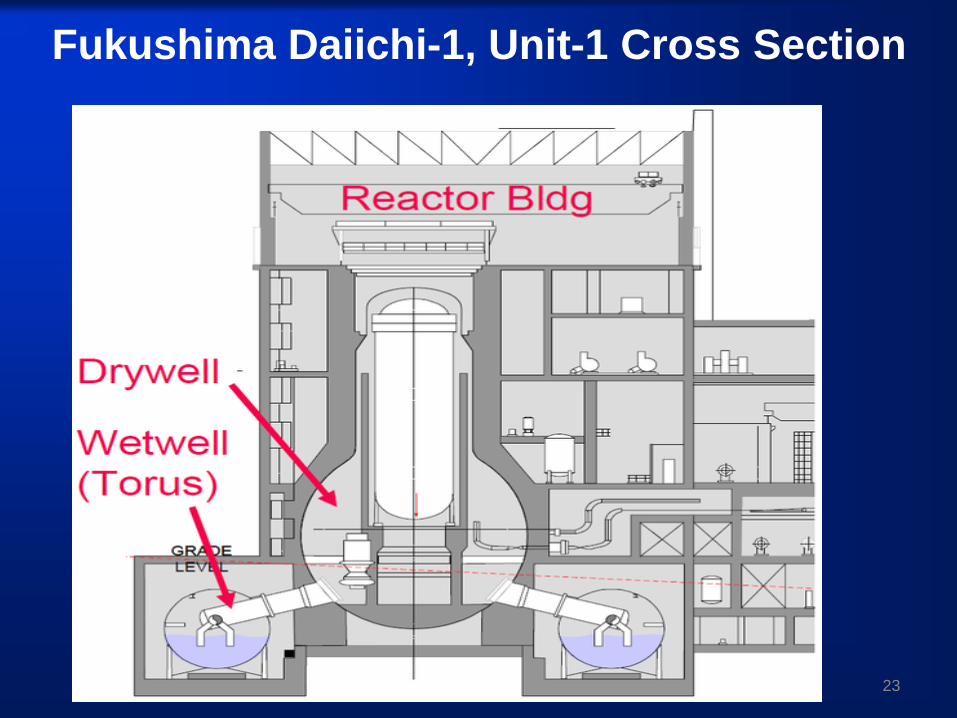
Fukushima Daiichi-1, Unit-1 Cross Section
23

Developed scenario
• The insufficient cooling pressure inside RPV increases and relieves it to the suppression pool through auto blow down system through instrumented relief valves/ mechanical RVs.
• This steam gets quenched in the suppression pool partly (as per efficiency) and remaining steam and non condensable comes to drywell, the primary containment and results in pressure rise of drywell also.
24

Developed scenario
•Suppression pool recirculation pumps which are part of emergency cooling were not available so heat removal efficiency comes down and suppression pool temp increases, which further raises containment pressure.
•The pressure inside the reactor containment was allowed to increase as high as twice the design pressure in order to control the release the radioactivity.
25

Normal operation

STAGE-1 : Steam relief to Wetwell

STAGE-2 : Pressurisation of Wetwell &
Opening of drywell

STAGE-3 : Steam carryover to Drywell

STAGE-4 : Drywell pressurisation
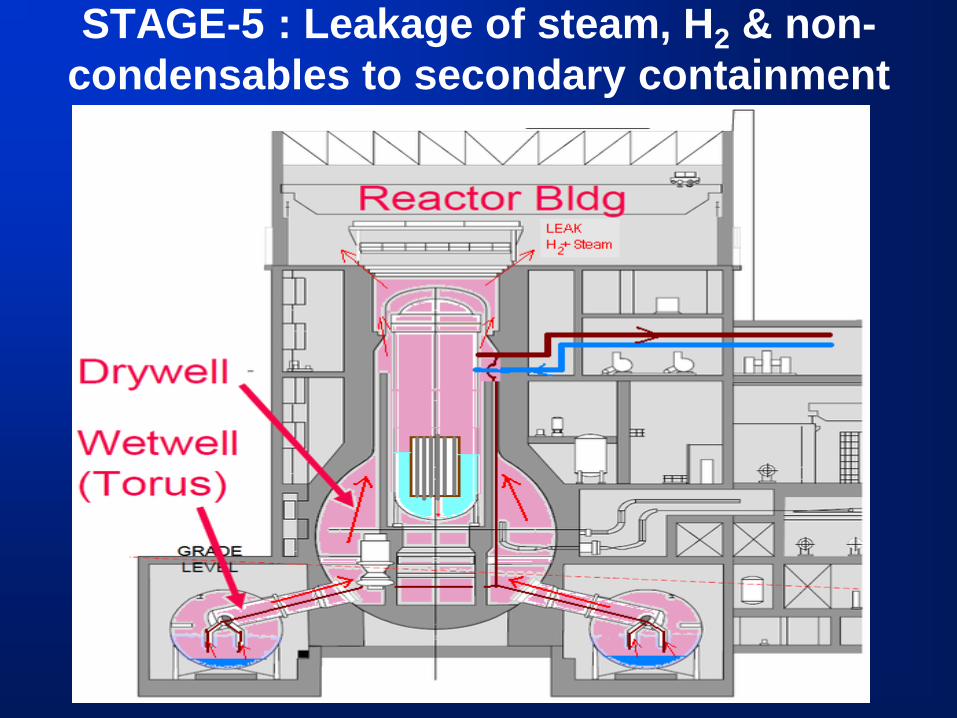
STAGE-5 : Leakage of steam, H2 & non-
condensables to secondary containment

STAGE-6 : Accumulation of H2 gas in
secondary containment and pressure build-up

STAGE-7 : Attainment of explosive H2 concentration
in secondary containment – BURSTING & release
(Units 1&3)
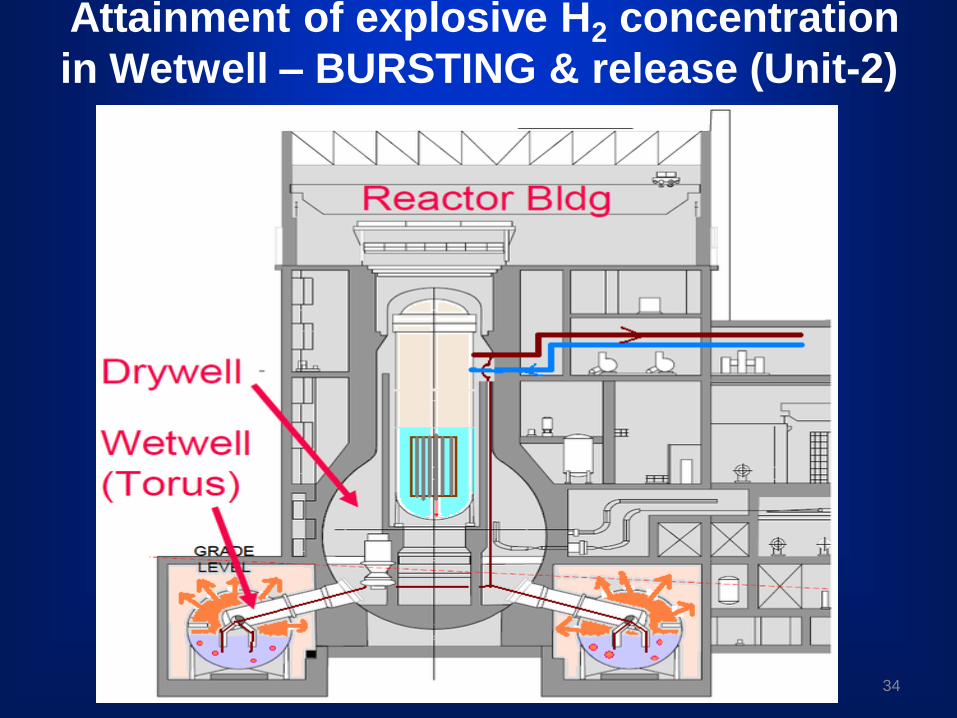
Attainment of explosive H2 concentration
in Wetwell – BURSTING & release (Unit-2)
34
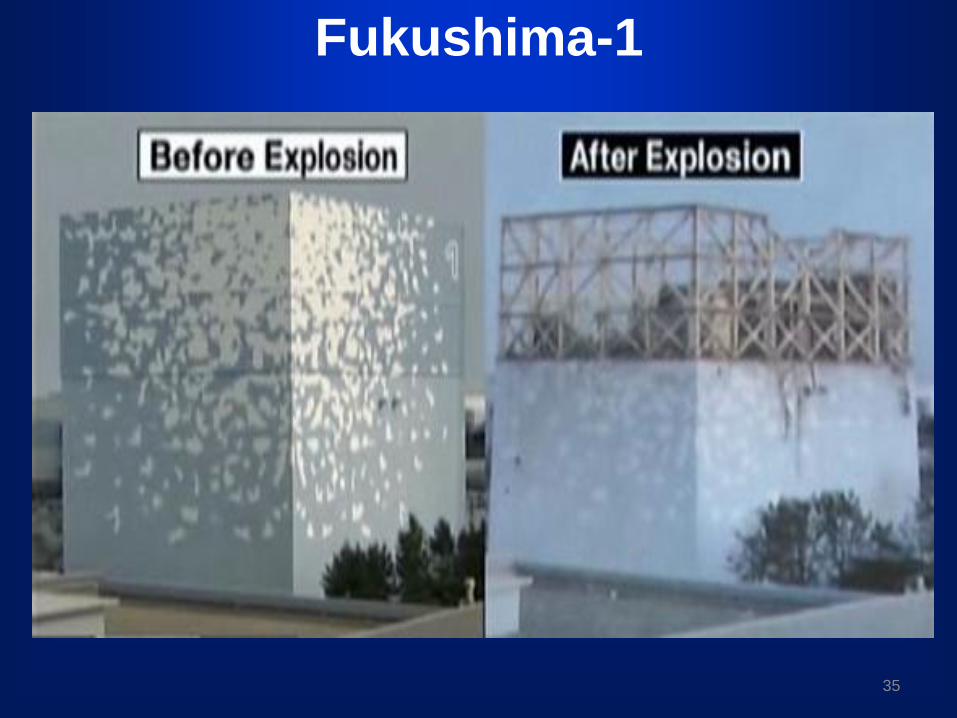
Fukushima-1
35

Possible area of
explosion at Fukushima
Daiichi 2
Spent Fuel Pool Status
• Unit- 3&4 :Low water level
• Unit- 3 :Fuel Rods Damaged
• Unit-5&6 : High Temperature
Core and Fuel
Damaged in Unit- 1,2&3
Updated on 17-0-2011

Preliminary AnalysisSource :IAEA

Earthquake Details

Earthquake details
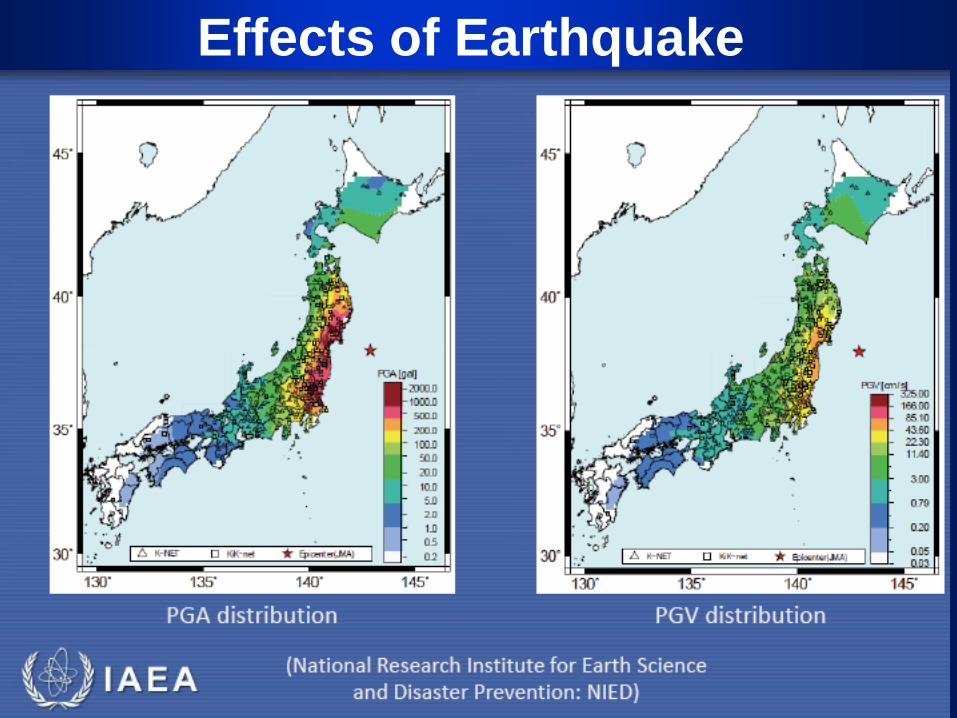
Effects of Earthquake

Tsunami Cast

TSUNAMIGENIC LOCATIONS IN JAPAN
BOUNDARY
BETWEEN
PACIFIC
PLATE &
ASIAN
PLATE
DISTANCE OF 8.9 EQ
IS 130 KMS EAST
FROM SENDAI
MANY NEAR
FIELD SOURCES 42

Design Basis
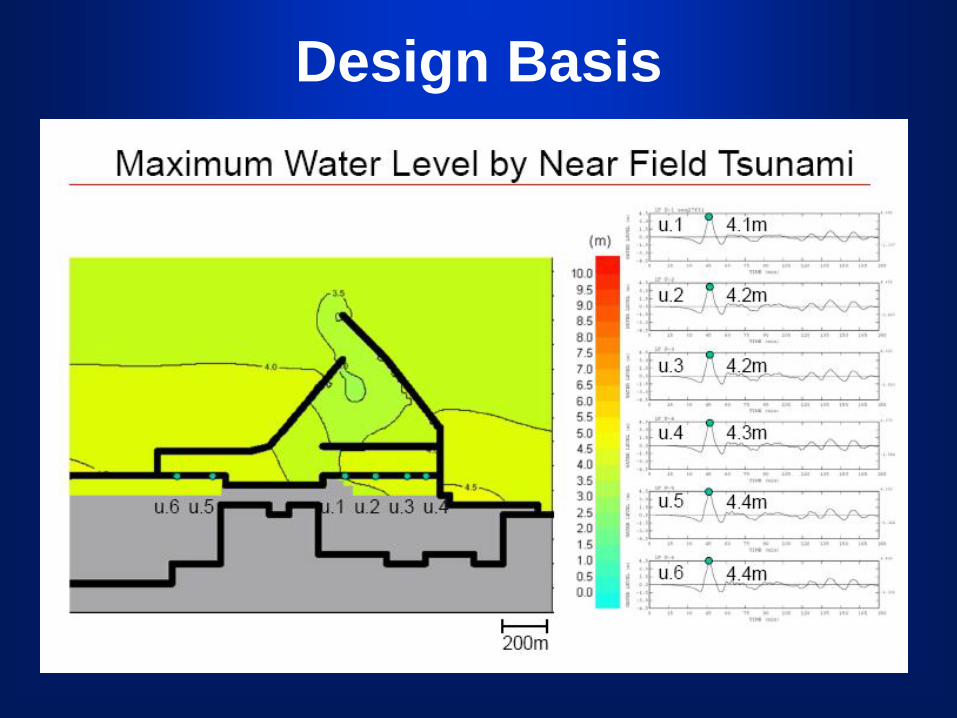
Design Basis

Design Basis

Design Basis

Design Basis

Major Events after Earthquake
and
Status at Fukushima reactors
AS Reported By NISA


Around Units 1&2

Operation (Control) Rooms–Units 1&2


Radiation Monitoring

Radiation Level at Plant Boundary

Radiation Levels at Fukushima Daiichi


Radiation Level in all Prefectures

Radiation Level in Sea Water at Plant outlet
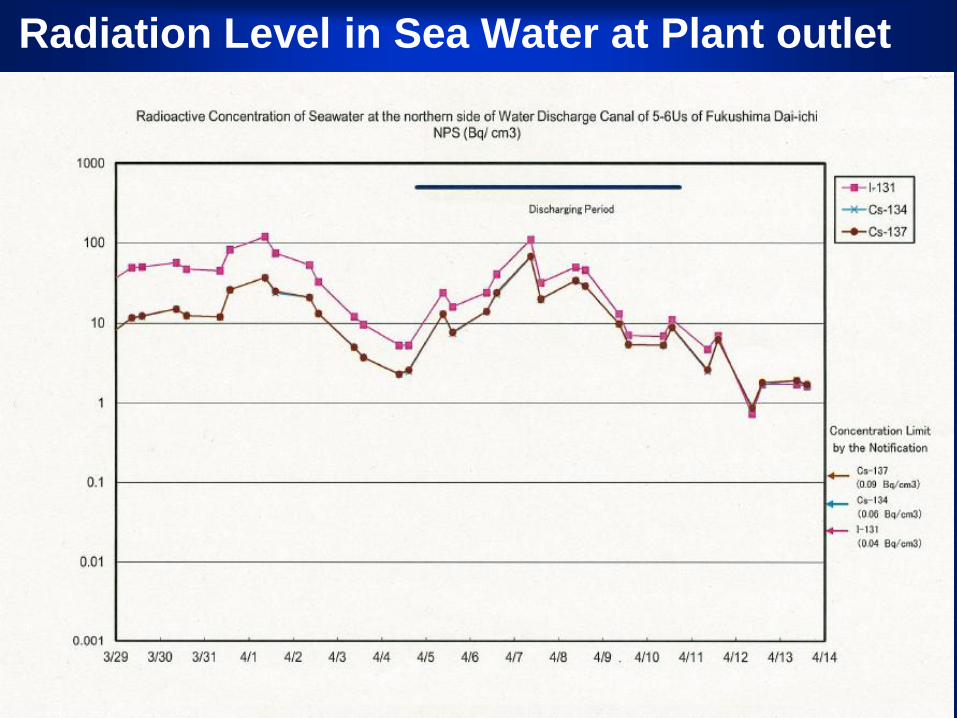
Radiation Level in Sea Water at Plant outlet

1 103 104 105 106102101 107 108
April 200530 km
Bq.m-3
[1 – 101]
1 103 104 105 106102101 107 108
24, 27 March 2011
Bq.m-3
[103– 104]
[105– 107]
Monitoring of the Marine environment • Comparison of Cs-137 seawater concentrations with historical data- 30
km offshore surface water concentrations - 3-4 orders of magnitude as measured in 2005
• 330 m East of Fukushima Dai-ichi concentrations were -3 orders of
magnitude higher values measured offshore, this showing the high
dilution capacity of the marine environment
Cs-137 Bq.m-3

Radiation Level in Seawater

Radiation Level in Seawater

Radioactivity in Foodstuffs(Absence)
• Results on 146 out of 150 samples from April 13 to 16
- various vegetables, spinach and other leafy vegetables, shitake mushrooms, fruit (strawberry), seafood and unprocessed raw milk in nine prefectures
Chiba, Fukushima, Gunma, Hyogo, Ibaraki, Kanagawa, Niigata, Saitama and Yamagata,
• I-131, Cs-134 and Cs-137 were either not detectedor were below the regulation values set by theJapanese authorities.
Radioactivity in Foodstuffs(presence)
• 4 of the 150 samples of :
In Fukushima prefecture, three samples of
shitake mushrooms taken on 14th April were
above the regulation value set by the Japanese
authorities for Cs-134 and Cs-137.
One sample of shitake mushrooms taken on
14th April was above the regulation values set
by the Japanese authorities for I-131 and/or Cs-
134 and Cs-137.

Restrictions on Food Products

Place Natural Background radiation level (microsievert per hour)
Manvalakurichi 0.456
Hyderabad 0.148
Shillong 0.125
Kolkata 0.105
New Delhi 0.075
Mumbai 0.061
Prefecture Dose Rate (Microsievert per hour) on Mar 17 18:00 hrs JST
Normal (Max.) natural radiation (Microsievert per hour)
Chiba 0.041 0.044 Tokyo 0.053 0.079 Kanagawa 0.056 0.069 Niigata 0.048 0.153 Ibaraki 0.244 0.056 Tochigi 0.213 0.067 Gunmag 0.109 0.045 Saitamg 0.068 0.060
Typical Background Radiation Levels of Indian Cities (IERMON)
Background Radiation Levels observed in Japanese Cities

Radiation ExposureA. Members of Public:
No cases of harmful influence on thyroid
of children were detected.– Of the 102,342 people screened (uptil Mar 28th) ,
only 101 people indicated the counts below
100,000cpm .There was no case which affects health.
B. Occupational Workers:
• 28 workers exceeded 100 mSv– 3 workers exceeded 170 mSv
– 2 workers had radioactive material on their legs,
estimated to be 2 to 3 Sv. Based on further monitoring
(March 25 -28) were discharged.

Chernobyl and Fukushima
Chernobyl Fukushima
• Reactor Operating Shutdown
• Chain reaction
of fission
Continuing Stopped
• Explosion Nuclear
explosion
Chemical explosion
of Hydrogen
• Moderator Graphite –
started burning
Ordinary water-
supported cooling

Chernobyl
TMI
Fukushima
Though Fukushima is rated at level 7, the amount of
radioactivity released is one tenth released in Chernobyl.

Post event Actions - Public Safety
Administration of Iodine tablets (0.01mSv/hr).
Evacuation within 20 km radius- 3,20,000 people
evacuated (1m Sv/hr)
Sheltering in 20 to 30 km radius.
Impounding of milk, water, grass, food, etc.

Responding to a Nuclear Emergency (contd.)

Responding to a Nuclear Emergency (contd.)

Responding to a Nuclear Emergency (contd.)

Responding to a Nuclear Emergency

Safety Status
at
Indian NPPs in the context

Seismic Hazard
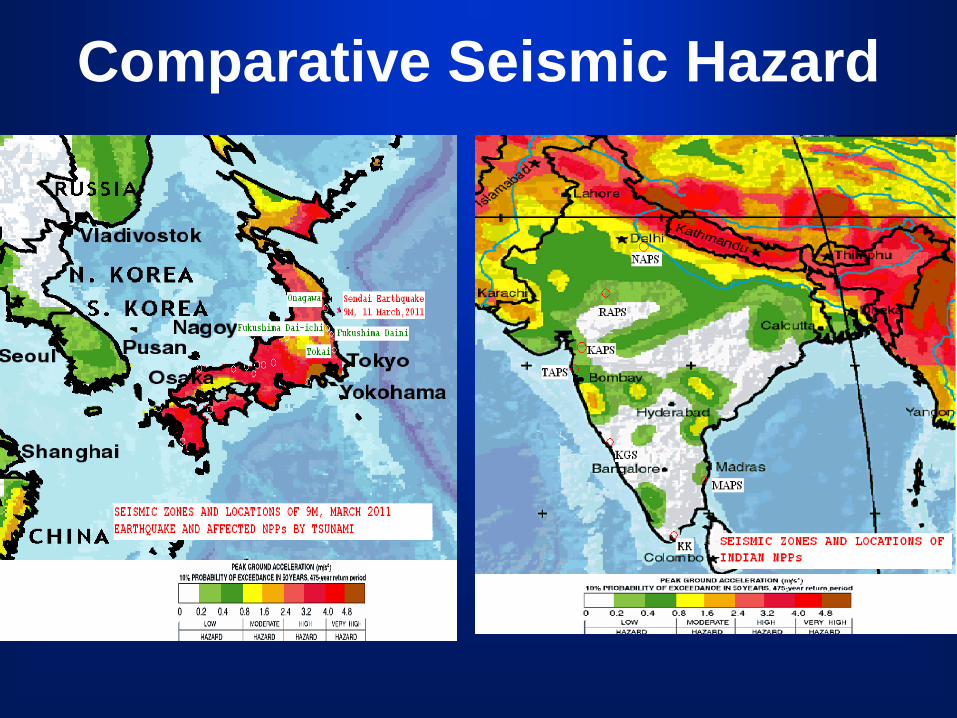
Comparative Seismic Hazard

Status of Seismicity – Indian NPPs
Site Seismic Zone
Narora IV
Rawatbhata II
Kakrapar III
Tarapur III
Jaitapur III
Kaiga III
Kalpakkam II
Kudankulam II
• Criteria - No Active fault within 5 km

Tsunamigenic locations for Indian coast
KALPAKKAM
TARAPUR
KUDANKULAM
TECTONIC PLATE BOUNDARIES
ONLY FAR FIELD
SOURCES
18 March 2011

TSUNAMIGENIC LOCATIONS IN JAPAN
BOUNDARY BETWEEN
PACIFIC PLATE &
ASIAN PLATE
DISTANCE OF 8.9 EQ IS 130 KMS EAST
FROM SENDAI
MANY NEAR FIELD SOURCES

Plant site Magnitude
(Richter scale)
Epicentral distance (KM)
Peak ground acceleration (g)
NAPS 6.7 12 0.3
RAPS 6.0 40 0.1
KAKRAPAR 6.5 30 0.2
KAIGA 5.7 12 0.2
TAPP 6.5 16 0.2
MAPS 6.0 20 0.156
KK 5.0 6 0.15
Earthquake –magnitude, parameters used for seismic
design of Indian nuclear power plants
5.0 Mag.(Richter) =2x10¹² Joules energy, equivalent to Hiroshima atom
bomb
5.0, 6.0, 7.0, 8.0, and 9.0 = 2x10¹², 6.31x10¹³, 2x10¹⁵, 6.31x10¹⁵ and 2x10¹⁸
Joules 87

Seismic Margin Assignment (SMA) PGA’s
Plant Design
PGA (g)
Seismic margin PGA
Based on
analysis (Note-1)
Based on judgment
(Note-2)
TAPS 0.2 0.337 to 1.83
RAPS 0.1 0.233 to 2.26
MAPS 0.2 0.233 to 2.26
NAPS 0.3 0.6
KAPS 0.2 0.6
KAIGA 0.2 0.6
KK 0.15 0.6
Note-1: These values are based on analysis conducted during the seismic re-evaluation of the
plants based on permissible stress values. Very few components are close to the low
PGA values, majority are close to 0.6g PGA.
Note-2: Design of new plants from NAPP onwards was done for allowable stress values However, the
actual stress values are much less than the allowable values. The actual SMA PGA values are
to be calculated referring to the analytical reports. But, based on the analytical values
calculated for TAPP, RAPP and MAPP and performance of Kasiwaziki Kariwa and Shika NPP’s
in Japan, GSECL’s plant at Jamnagar and Panendhro, IFFCO plant at Kandla, the SMA PGA will
be about two to three times those of the analytical values.
88

Containment (TAPS-
1&2)
Fukushima
Reactor

TAPS-1&2 Safety vis-a-vis Fukushima
TAPS 1&2- Primary Containment Volume to
Power ratio,10 times than Fukushima NPP- Slow
build up of pressure in containment .
Passive systems for decay heat removal
(Emergency Condenser) – Adequate to cool the
core for 8 hours.
Safety upgrades and renovation completed in
year 2005.
Detailed Evaluation and Review by AERB
periodically.

Handling of Station Black Out in TAPS-1&2
Provisions of Reactor Safety Functions
Reactor Shutdown/Scram
Reactor Scram due to de-energization of Reactor
Protection System (RPS) channels
Reactor sub-critical within 5 sec.
Reactor Core Cooling• Primary Steam Isolation Valves (PSIVs) go close on • de-energization of RPS channels.
• Additionally, PSIVs go close automatically on • Reactor water low level• Primary steam line low pressure• Primary steam line high radiation• Dry well high pressure• Primary steam line high flow• Primary steam line area high temperature 91

Provisions of Reactor Safety Functions
Reactor Core Cooling
Emergency Condenser valved in on PSIV closure
Automatically –battery powered valve
Manually operable from accessible area
Emergency Condenser de-pressurizes the core
and cools down RPV at the rate of 50oC/hr.
RPV cooled and maintained up to 8 hours
beyond which secondary side inventory of EC replenished.
Handling of Station Black Out in TAPS-1&2
92

Provisions of Reactor Safety Functions
Reactor Containment Isolation
High steam flow in respective steam line (s)
High temperature into pipe “tunnel area”
Low pressure in steam lines
Drywell high pressure
TAPS-1&2 would be maintained under sub-critical
and cooled state due to the provisions.
Handling of Station Black Out at TAPS-1&2
93

PHWR Schematic
94

Safety in Indian PHWRs
Reactor Safety
Safe
Shutdown
Decay Heat
Removal
Containment
Systems &
Features
• Fast Acting
• Independent
• Passive
(Control Rods,
ALPAS/ LPIS Boron
Injection for Long
term shutdown)
Systems &
Features
• Active & Passive
• Backup Systems
(ECCS,
Suppression Pool,
Inventory in
Calandria &
Calandria Vault,
Fire water injection
into SGs)
Systems & Features
• Double
Containment
•Inner Containment
for design pressure
IN DBA
• Secondary
Containment under
negative pressure
•ESFs

260 tons
(13 hours to boil off )
625 tons
(36 hours to boil off)
In case all power supplies are lost ….
Time available to restore heat sinks
TAPS-3&4 in light of Fukushima Event

MULTIPLE BARRIERS TO PREVENT RADIOACTIVITY RELEASE
• Encompassing all phases Siting, Design, Construction, Operation, Waste Management
• Robust Design – Defence in Depth
• Diversity & Redundancy
• Fail Safe Systems
• Highest Quality &Safety Standards
• Robust Regulatory Mechanism
1. PELLET
2. CLADDING
3. PHT
4. PRIMARY
CONTAINMENT
5. SECONDARY
CONTAINMENT
6. EXCLUSION ZONE
BARRIERS

Safety Features – EPRs at JNPP
• Four independent safety trains- Housed in
independent and Seismically qualified
buildings.
• Provision of Hydrogen Re- combiners ,
Containment heat removal system.
• Emergency Feed Water System with two SBO
DGs.
• Core Catcher –prevention of radioactivity
releases.
• Double Containment- designed to withstand
external air craft/ missile attack
Actions taken by NPCIL• Emergency Control Centre at HQ activated on
round o clock.
• Dissemination of Information to all sites & offices
• Quick Review of Events.
• Awareness to Public on Fukushima and Indian
NPPs Safety aspects through,
– Press & Media
– Members of Parliament, State Assembly ,
Government officials
– Posting of information on NPCIL and DAE
Website
• Undertook Safety Reviews of Indian NPPs

Briefings• Prime minister of India , Minister of State
briefings and keeping them posted regularly.
• Quick replies to the queries from various
sections .
• Appraisal to the Parliament on Fukushima event
and situation in India.
• Organized Number of press and media briefings
at HQ , each NPP site.
100
Review Committees• AERB has constituted high level committee for
review
• NPCIL has setup four committees for review of
safety in Indian NPPs to suggest improvements,
if any
–TAPS 1&2 (BWRs)
–RAPS 1&2 (First PHWRs)
–MAPS 1&2 (First generation Indigenous PHWRs)
–NAPS 1&2 and onwards (Standard Indian PHWRs)
The four committees have submitted their
preliminary reports and will continue for detailed
review

Recommendations - TAPS 1&2• Short Term
– Regular Training for EOPs, mockup drills, disaster
management training, Provisions for self sufficiency for 7
days without any external help.
• Long Term– Provision of Reliable Power – Raising tsunami resistant wall around
EDGs and tanks, Mobile DGs inside plant, CNG/ Gas generators
outside plant through overhead cables, relocating existing SBO DG
at higher elevation
– Core Cooling – provision of water sources, suction from intake
canal, underground raw water tank, overhead tank away from site
– Coolant Injection – into feed water lines, RPV using ACWS pumps,
into dry well and suppression pool, replenishment of secondary
side inventory
– Containment Venting, Hydrogen Management –passive
recombiners
– Spent Fuel Pool Management
– Alternate Communications Systems and Passive Instrumentation

Recommendations- RAPS 1&2
• Augmentation of - Water Sources and Feed / make
up capability
• Extension of Power Sources
• Systems Improvement – Automatic reactor trip on
very high intensity earthquake, bypass switch for
ECCS Injection, alternate pumping arrangements
for pumping water, Portable Instruments etc.
• Augmentation of long term resources – Up
gradation of Class II Electrical System, Hydrogen
Management, bund at out fall retaining emergency
feed in the event of break in RPS dam

Recommendations -MAPS 1&2• Short Term
– Procurement of medium size air cooled power packs,
– Engineering to delink process water emergency storage tanks from process water system.
– Procurement of small pumps with requisite head from power packs to pump water into SGs
– Pump for Deaerator water transfer to SGs and Strengthening Feed water line
– Helium purging from Calandria and hydrogen purging from generator
• Long Term– Underground concrete tank of 750 cum including pumps,
liquid nitrogen and power pack-100 cu m tank at HP heater floor
– Solar power lighting
– Hydrogen management devices
– Provision of Lub. oil reservoir on top of TG bearings

Recommendations NAPS onwards• Short Term
– Reactor trip on seismic event
– Additional batteries and emergency lights in SBO kits
– Surveillance of fire water lines, inclusion in ISI programme
– EOPs strengthening
– Provision of hand pumps for transferring diesel from Underground tanks
– Leak tightness of all JBs,
• Long Term– Suppression pool inventory with power pack operated pumps
– Instrumentation scheme in the event of extended power failure
– Injection of water in BDBAs/Severe accidents
– SSE qualified reservoirs of 5000 cu.m to be provided at NAPS, KApS and TAPS 3&4
– Supply of water to SFSBs
– Construction of tsunami wall / mangroves at TAPP 3&4
– Solar batteries , emergency lighting etc.
International cooperation
• WANO governing board meeting was held on
March, 15 on audio conference- CMD NPCIL
along with top 20 world nuclear industry
officials participated
• WANO officials from other 3 regional centers
camping at Tokyo for support
• IAEA governing board meeting held on 21
March 11, NISA official briefed governors,
Indian ambassador briefs about Indian situation
• IAEA deputes officials at Japan
• US, France sends experts to Japan.

107

WANO Global Meet
• WANO meeting later this year to discuss
lessons learnt from Fukushima event.
• High level commission to restructure WANO
organisation and approach to further
strengthen safety and reliability in NPPs world
over.

Thank You

Radiation Exposure-The right PerspectiveLife threatening dose- more than 3000 mSv
Radiation illness - Passing Symptoms
No symptoms, temporary changes in
blood picture (A Skyscraper)
No detectable effects (A House)
Limit for the
Occupational Worker
(A Man)
Limit for the public
(A Brick)
(Source: Adapted from IAEA (1997) Publication on Radiation, Health and Society - 97-05055 IAEA/PI/A56E)

Radiation Dose to Public is insignificantly
small fraction of natural background and the
Regulatory limit
Average dose from NPPs at 1.6 km (2003-2009)

Radiation - Basic Terms Used
• Becquerel (Bq) refers to one disintegration of a radioactive element per second
• When radiation interacts with human body it deposits energy in the body.
• The effect on human body will depend on the energy deposited per Kg and the type of radiation
• Sievert (Sv) refers to an effective dose of one Joule of energy per Kg of the body weight

Radiation –a Fact of Life
• Radiation is always present around
us and inside our body.
• An average effective dose of 2.4 milli
Sievert/ Year is received by us from
natural radiation background
