full file at ://fratstock.eu/sample/solutions-manual-project-management-a... · full file at...
TRANSCRIPT

Full file at https://fratstock.euChapter 2 - Instructor’s Resource Guide to
Project Management: A Managerial Approach, seventh edition
REV: July, 2008 Revision: Dwayne Whitten Page 1 of 30
Chapter Overview
1) Overview – This chapter discusses the process for selecting which of the
many projects a organization could pursue, it should pursue. It introduces
techniques for evaluating and making the selection. The chapter also
introduces concepts of risk and applies them to the analysis typically
performed during the project selection process.
2) Project Management Maturity – Many organizations use maturity models to
determine their level of mastery of project management processes and skills.
3) Project Selection and Criteria of Choice – Organizations should use consistent
and rational tools to select among the myriad of projects from which they
have to choose. There are many models for the selection process to choose
from as well. Good criteria for choosing the selection model are:
a) Realism – The model should take the organization’s situation into account
including limits on people, facilities and capital.
b) Capability – The model should be capable of dealing with the
complexities of the organization’s environment.
c) Flexibility – The model should work under a range of conditions.
d) Ease of use – The model should be relatively easy to use and understand.
e) Cost – The model should not be costly to use.
f) Easy computerization – The model should be easy to capture on a
computer.
4) The Nature of Project Selection Models – Models are useful tools to aid
decision making. They are not, however, the decision maker, nor do they ever
completely represent the reality confronting modern organizations. Any
criteria developed for project selection should be weighted to represent the
degree to which that factor contributes to the organization’s goals.
5) Types of Project Selection Models
a) Nonnumeric Models – These models do not attempt to reduce the
evaluation process to numbers, but instead look at other factors that make
for “obvious” choices for that organization. This could include senior
management mandates and regulatory necessities. Examples include The
Sacred Cow, The Operating Necessity, The Competitive Necessity, The
Product Line Extension, and Comparative Benefit Model.
b) Numeric Models: Profit/Profitability – These models analyze the potential
projects in terms of the single criteria of monetary return. The analysis
may or may not include the time value of money. These include
traditional measures such as Payback Period, Discounted Cash Flow (also
referred to as Net Present Value), IRR, and Profitability Index.

Full file at https://fratstock.euChapter 2 - Instructor’s Resource Guide to
Project Management: A Managerial Approach, seventh edition
REV: July, 2008 Revision: Dwayne Whitten Page 2 of 30
c) Numeric Models: Scoring – These models analyze the potential projects
based on multiple criteria the organization selects. The models use
numeric scales to rate the projects against the desired criteria. Then the
ratings can be analyzed using various techniques to determine the best
choices. Examples include Uweighted 0-1 Factor Model, Unweighted
Factor Scoring Model, Weighted Factor Scoring Model, and Window of
Opportunity Analysis.
d) Choosing a Project Selection Model – The authors strongly favor using
weighted scoring models.
6) Analysis Under Uncertainty – The Management of Risk – The text
distinguishes between risk and uncertainty. Risk applies to events that have a
known (or estimated) probability of occurrence. Uncertainty applies to events
where there is insufficient data to estimate the probability of occurrence. For
effective project management, decisions should be treated as risks rather than
uncertainties. That is probabilities of occurrence, if not otherwise known,
should be estimated for relevant issues and events.
a) Risk Analysis and Simulation – The techniques of risk analysis and
simulation are applicable to several areas of project management including
cost, schedule and resource. Software products make Monte Carlo
simulation relatively easy to perform in conjunction with spreadsheets
developed for project selection and analysis.
b) General Simulation Analysis – Simulation can be used to estimate the net
present value resulting from prospective R&D projects. Overhead costs
are generally not relevant to the decision and can be eliminated from the
analysis. Simulation software has no opinion concerning the quality of the
data or assumptions used to feed it so results must always be used with
caution.
c) PsychoCeramic Sciences Revisited – The text has a lengthy and detailed
example of the use of Crystal Ball® for the estimate of net present value
in an environment of risk.
7) Comments on the Information Base for Selection – To use these selection
techniques successfully a database of relevant input data must be created and
maintained.
a) Accounting Data – Managers need to understand the assumptions behind
accounting data to insure its relevance to the project selection process. In
particular, standard cost models and the methods used to allocate overhead
should be well understood.
b) Measurements – Estimation of expected performance against selection
criteria involves different types of measurement. The actual usefulness of
the different types is often counterintuitive to many people’s beliefs. In
general, measurements must be numeric, reliable and valid.

Full file at https://fratstock.euChapter 2 - Instructor’s Resource Guide to
Project Management: A Managerial Approach, seventh edition
REV: July, 2008 Revision: Dwayne Whitten Page 3 of 30
i) Subjective vs. Objective – Subjective measurements are those without
an external reference. An example would be the judging of
gymnastics at the Olympics. Subjective measures are not inherently
worse than objective ones.
ii) Quantitative vs. Qualitative – Quantities can be added together but
qualities cannot. The amount of water in a bucket is quantitative; its
density is qualitative. Qualitative measures are not inherently worse
than quantitative.
iii) Reliable vs. Unreliable – Measurements are reliable if they are
repeatable.
iv) Valid vs. Invalid – Valid measures accurately depict meaning of the
measurement.
c) Uncertain Information – Techniques used to determine numeric weights
and criteria scores for project selection can also be used for inputs to risk
analysis models.
8) Project Portfolio Process (PPP) – The Project Portfolio Process is used to
consistently and transparently select projects that match the organization’s
goals. The process has eight steps:
a) Step 1: Establish a Project Council – The council is established to
articulate strategic direction and allocate funds to projects it selects.
b) Step 2: Identify Project Categories and Criteria – Categories are
established by the Council to insure that a variety of projects are pursued.
Criteria for measuring prospective projects are established to form the
framework for the selection process. Common categories used for
classifying projects are:
i) Derivative projects – Projects that are only incrementally different
from previous efforts.
ii) Platform projects – Projects that impact organization outputs or the
processes that create them.
iii) Breakthrough projects – Projects that involve implementing new,
sometimes “disruptive” technology.
iv) R&D projects – Projects used to acquire new knowledge or create new
technology.
c) Step 3: Collect Project Data – Collect relevant data and assign scores to
prospective projects.
d) Step 4: Assess Resource Availability – Analyze the availability of
resources to execute the prospective projects.
e) Step 5: Reduce the Project and Criteria Set – Use multiple screens to
narrow down the number of projects under consideration.

Full file at https://fratstock.euChapter 2 - Instructor’s Resource Guide to
Project Management: A Managerial Approach, seventh edition
REV: July, 2008 Revision: Dwayne Whitten Page 4 of 30
f) Step 6: Prioritize the Projects within Categories – Using the analysis
developed, prioritize the projects within the previously identified
categories. This again is to ensure that a variety of projects are pursued,
not just the top few from a single, prioritized list.
g) Step 7: Select the Projects to be Funded and Held in Reserve – The best
projects within each category are selected for implementation, holding
some projects and some resources in reserve.
h) Step 8: Implement the Process – The results of the process must be
recorded, and then widely communicated within the organization.
9) Project Proposals – This section introduces the documentation necessary to
present a prospective project to a selection process. The text equates the
internal project selection process with that of a prospective customer using a
Request for Proposal (RFP) or Request for Quote (RFQ) process. This is
somewhat misleading, as organizations should have made a careful internal
analysis (sometimes known as a bid/no bid decision) before submitting a
proposal to a customer. In other words, the project is proposed twice: first
internally to the organization to win support, and then, if it’s a “bid,”
externally to the customer to win the job. The proposal documentation
required by the customer is much different than that needed for the internal
analysis. In fact, part of the bid/no bid analysis is evaluating the cost to
prepare the RFP or RFQ knowing that the organization could lose. For large
military or space projects the preparation costs can run into the millions of
dollars. Regardless of whether it’s for internal or external consumptions, or
for a technical or non-technical project, the proposal should be prepared with
care.
a) The Technical Approach – This section summarizes what the problem is
and how it will be approached by the project.
b) The Implementation Plan – This section summarizes the schedule, cost
and resources estimated to complete the project.
c) The Plan for Logistic Support and Administration – This section
summarizes the support that the project will need and how it will be
administered.
Teaching Tips
Most students will benefit from in-class examples to make the material come
alive. One area that will benefit from this approach is the use of Crystal Ball®.
In spite of the hype of software makers, all students will not have the ability to sit
down and use Crystal Ball® without some assistance. Demonstrating the
example in the text with a computer and a projector will help students understand
the process and generate a lot of good questions.
The other area that requires demonstration is the project selection process.
Students need to see the criteria in action, and see how a real scoring model would
work. A good way to accomplish these goals is to use the Pan-Europa Case Study

Full file at https://fratstock.euChapter 2 - Instructor’s Resource Guide to
Project Management: A Managerial Approach, seventh edition
REV: July, 2008 Revision: Dwayne Whitten Page 5 of 30
as an in-class exercise. There are a couple of ways to approach this. The simpler
process would be to have the students read the case in advance. Then questions 1,
2, and 3 would be discussed with the class as a whole. Questions 4 and 5 would
be addressed through pair-wise brainstorming (discussed in the Teaching Tips for
Chapter 1). The student teams would take notes on their answers to these
questions to then be discussed with the class as a whole. The result of this
discussion would be used to come up with a class consensus view on the screens
and criteria to be used for the project selection process. Then the students could
go back to working in pairs (preferably the same ones as before) to apply the
criteria and make their selections. Then another whole class discussion would be
used to share each group’s results and see if a class consensus emerges. This
whole process, depending on the vigor of the class would take 2-3 hours. It is
important for the instructor to circulate during the small group discussions to keep
the students on track and answer their questions. This is particularly important as
there are multiple questions embedded in Questions 4 and 5, and students will
have a tendency to get hung up on one to the exclusion of the others. The
instructor may wish to suggest a time budget for each question to assist the
group’s progress.
A more elaborate approach to this Case would involve students role-playing the
members of the Pan-Europa board. Then the “board members” would have the
opportunity to advocate their own projects and try to influence the selection
process in their favor. Depending on the size of the class, this technique may not
keep enough of the students involved. One way to address this would be to assign
a team of students to each board member to assist them in establishing their
position. Then the board member becomes essentially a spokesman for the group.
Again, it’s important to alternate between whole class and small group activities
to insure the maximum participation of each student. This could be accomplished
by the groups meeting to discuss their position, a “presentation” to the whole class
by each board member, then another group discussion of criteria, followed by
presentations to the whole class of the recommended criteria with an undoubtedly
vigorous discussion to follow.
A good reference case for this chapter follows:
9-305-101 Boeing 787: The Dreamliner (Harvard). This is an excellent strategy
case, and is so recent that it the 787 is reported on in the papers and business
magazines almost every week.
Material Review Questions
Question 1:
Refer to Section 2.8 of the text. A proposal should be responsive to the solicitation
document that the buyer prepared during the solicitation process. Usually, a technical
proposal will contain:

Full file at https://fratstock.euChapter 2 - Instructor’s Resource Guide to
Project Management: A Managerial Approach, seventh edition
REV: July, 2008 Revision: Dwayne Whitten Page 6 of 30
1) a description of the technical problem and the approach the performing
organization will use to solve it.
2) the plan for implementing the project once it has been accepted.
3) the plan for logistic support and administration of the project.
4) a description of the group proposing to do the work, plus its past experience in
similar work.
Question 2:
Managers often judge selection criteria by their own narrow interests. These could
include their own advancement, or sub-optimizing the products and processes of their
own department. This bias clearly could be to the detriment of the overall corporate
goals and well being.
Refer to Section 2.2 of the text. Instead, the project selection models should be able to
evaluate how well a project’s execution will contribute to the overall business strategy of
the performing organization. Some commonly used standards of judgment include:
1) Realism
2) Capability
3) Flexibility
4) Ease of use
5) Cost of use
6) Easy computerization
Question 3:
Refer to Section 2.4 of the text. Both models are examples of nonnumeric models.
Moreover, both models will tend to sustain an existing status quo and are subject to
misuse in pursuit of hidden agendas of key stakeholders.
1) Operating Necessity Model: The operating necessity project is perceived as one
necessary to maintain the status quo for operations. If the plant is flooded by a
hurricane, it’s an operating necessity to dry it out and restore production. The
advantage of this model is that it involves little data and fairly obvious decisions.
The disadvantage is that relying on it to solve problems may mask a long-term
issue that needs to be solved in a manner other than firefighting. Perhaps, for
example, the plant needs to be moved to a different location to prevent too
frequent flooding.
2) Competitive Necessity Model: The competitive necessity project is perceived as
one necessary to keep from losing the current competitive position. For example,
a video rental chain that operates in physical stores might decide to add an
Internet based ordering facility to stay competitive with Internet-only operations.
Again the decision making process can seem simple, but the danger is similar to
the operating necessity model. The “obvious” decision on what to do quickly to

Full file at https://fratstock.euChapter 2 - Instructor’s Resource Guide to
Project Management: A Managerial Approach, seventh edition
REV: July, 2008 Revision: Dwayne Whitten Page 7 of 30
maintain a competitive position may, in fact, be the wrong thing to do in the long
run.
Question 4:
Refer to Section 2.4 of the text. In the United States, the term “sacred cow” has become
an idiom used to denote someone or something that is exempt from criticism. A senior
manager’s blind loyalty to an obsolete product or process they introduced to the company
long ago is an example of a sacred cow. Another example would be a company’s loyalty
to a product line, like Hershey to chocolate, even if it were a money loser.
Question 5:
Refer to Section 2.4 of the text. Q-Sort is a nonnumeric technique managers can use to
evaluate comparative benefits associated with a list of potential projects. This type of
selection model is useful when a goal has many potential alternatives for implementation.
For example, what experiments should NASA engineers include in the next Mars Probe?
What projects should be included in the company’s R&D portfolio? Which archeology
projects would best illustrate the lifestyle of the cave dwellers that inhabited Colorado in
the first millennium AD?
A company may use this method to evaluate several projects to choose from. The
potential projects could be grouped by the level of strategic importance, then by cost,
then by time to complete. By using this method, the “best” projects to start could be
selected using these criteria.
Question 6:
Refer to Section 2.3 of the text. Models, like projects, have characteristics that influence
when a decision-maker should use the model.
Models cannot make decisions for its user. The user should understand the
advantages and disadvantages of each model in reference to the goals associated
with the scenario’s reality. Each model will provide a limited viewpoint about the
reality it represents. It may be beneficial to consider the model’s appropriateness
from different perspectives before actually using it to evaluate selection
alternatives.
Although not specifically mentioned in the text, the following can influence as well:
1) The applicability of a model is one such characteristic that reflects the range of
scenarios that the model can reasonably support.
2) The model should make a scenario more understandable by reducing its
complexity. However, when a model reduces a scenario’s complexity, an
important distortion of the scenario may also be experienced. The distortion may
happen because many important factors have been left out of the model in order to
make it easier to use or more understandable to the user.
3) Models are only as good as the data they receive. Bad data will lead to a bad
analysis.

Full file at https://fratstock.euChapter 2 - Instructor’s Resource Guide to
Project Management: A Managerial Approach, seventh edition
REV: July, 2008 Revision: Dwayne Whitten Page 8 of 30
Question 7:
Refer to Section 2.6 of the text. In the context of this question, a measure is any standard
of comparison or judgment. It is inaccurate to equate quantitative as being equivalent to
a numeric comparison. It is also inaccurate to equate qualitative as being equivalent to a
nonnumeric comparison. Thus, the true distinction is that you may apply the law of
addition to quantities, but not to qualities.
1) A measurer can use the mathematical operation of addition to combine quantities.
For example, the volume of water in one container can be added to the volume of
water in a larger container.
2) A measurer cannot use the mathematical operation of addition to combine
qualities. For example, the density of water will not be changed when the smaller
container is poured into the larger container.
Question 8:
Refer to Section 2.4 of the text. The models in this question fall into the general category
of profitability models.
1) Payback Period: This method assumes that the faster an investment can be
recovered, the lower its risk to the performing organization. Therefore, its most
glaring weakness is that it does not evaluate cash flows beyond the time required
to recover the initial investment.
2) Discounted Cash Flow Method: This method assumes that an organization will
use a required rate of return (hurdle rate) to justify a project’s selection. Also
known as net present value (NPV), it considers both the amount and timing of
cash flows that a project will generate.
3) Internal Rate of Return: This method considers the cash inflows and outflows in
conjunction with a discount rate.
4) Profitability Index: Also called benefit-cost ratio. It is the NPV of all future
expected cash flows divided by the initial investment.
Question 9:
Refer to Section 2.4 of the text. A profitability model will assess the financial gain on the
use of capital during a period of operations. Profitability models as a general class of
models have advantages and disadvantages that include:
1) Advantages:
a) They are simple to use and to understand.
b) Relevant data are available from the accounting system.
c) Business decision-makers are familiar with the output formats.

Full file at https://fratstock.euChapter 2 - Instructor’s Resource Guide to
Project Management: A Managerial Approach, seventh edition
REV: July, 2008 Revision: Dwayne Whitten Page 9 of 30
d) The decision-maker, with few exceptions, will assume that the output of
the model is absolute regarding a go or no go selection option. In this
context, absolute indicates a lack of ambiguity regarding the appropriate
decision.
e) Some profitability models can account for the amount, timing and risk of a
project’s cash flows.
2) Disadvantages:
a) Except for risk factors, the models ignore other nonmonetary factors.
b) Some of the profitability models do not evaluate the timing of cash flows.
c) Present-value models have a short-term bias that tends to ignore long-run
opportunities.
d) Payback models ignore cash flows beyond the time needed to recover the
original investment.
e) Algebraically, the IRR can generate multiple solutions. However,
modelers can address this problem by using graphical approximation
techniques capable of producing a satisfactory level of accuracy for most
planning purposes.
f) All models in this class are sensitive to data input errors, especially during
the early periods of the project’s planning horizon.
g) Because all discounting models are nonlinear, decision-makers are seldom
able to recognize the impact of errors in and changes to the values of
parameters used in the models.
h) The definition of cash flow for a project is subject to some degree of
ambiguity. Modelers will not always be able to apply the concept
consistently when evaluating the financial aspects of a project.
Question 10:
Refer to Section 2.5 of the text. In this context, sensitivity is the change in an output
variable produced when the modeler changes the value for an input parameter.
Sensitivity analysis allows the analyst to determine how sensitive the decision is to
changes in the input data. This is particularly useful when evaluating how uncertainty in
the input data affects the model outputs.
Question 11:
Refer to Section 2.5 of the text. The text distinguishes between the two terms as follows:
Risk is the condition when the probability of occurrence is known (or can be
readily estimated) for each possible outcome relevant to the project.
Uncertainty, in contrast, occurs when the probability of occurrence for outcomes
is unknown.
The window-of-opportunity approach defines the goal criteria for performance, time, and
cost and then evaluates options to see if the project can produce a satisfactory result.

Full file at https://fratstock.euChapter 2 - Instructor’s Resource Guide to
Project Management: A Managerial Approach, seventh edition
REV: July, 2008 Revision: Dwayne Whitten Page 10 of 30
Question 12:
Refer to Section 2.7 of the text. A portfolio contains projects undertaken to support
business goals. The eight-step process of selection is:
1) Establish a project council.
2) Identify project categories and criteria.
3) Collect project data.
4) Assess resource availability.
5) Reduce the project and criteria set.
6) Prioritize the projects within categories.
7) Select the projects to be funded and held in reserve.
8) Implement the process.
Question 13:
Refer to the glossary of the text. In the context of the text, maturity is “the sophistication
and experience of an organization in managing multiple projects”.
Question 14:
Refer to Section 2.5 of the text. The classic elements of risk analysis as defined in the
PMBOK are (although they aren’t explicitly stated in the text):
Identifying the potential risk events
Performing analysis to determine their probability and impact
Determining appropriate responses to those events deemed worthy of response
Monitoring the response plans to insure performance
As described in the text, risk analysis is based on probability distributions. These utilize
key parameters and variables that are associated with the decisions. In the application
presented in this chapter, the manager has selected a single risk event, the project not
generating planned cash flows in the future. Monte Carlo simulation is used to determine
the probability and impact of this occurring. The response is to determine whether the
risk is acceptable to the organization or not.
The manager would interpret the results by comparing them to other prospective projects.
All else being equal, the project with the highest likely net present value is the better
project to select.
Class Discussion Questions
Question 15:
Refer to Section 2.7 of the text.

Full file at https://fratstock.euChapter 2 - Instructor’s Resource Guide to
Project Management: A Managerial Approach, seventh edition
REV: July, 2008 Revision: Dwayne Whitten Page 11 of 30
1) Low project management maturity:
a) Make managers aware of the number of projects both proposed and underway.
b) Identify proposed projects that are not really projects so they can be handled using
other processes.
c) Have managers achieve consensus on what criteria should be used to select
projects.
d) Limit the number of projects so the important projects can get the resources and
attention they need for success.
e) Eliminate projects that by-passed a formal selection process and that may not
provide benefits corresponding to their risks and/or costs.
f) Avoid overloading the organization’s available capacity.
g) Balance short, medium, and long-term returns.
2) High project management maturity:
a) Prioritize the list of available projects.
b) Limit the number of projects so the important projects can get the resources and
attention they need for success.
c) Identify projects that best fit the organization’s goals and strategy.
d) Identify projects that support multiple organizational goals and cross-reinforce
other important projects.
e) Eliminate projects that incur excessive risk and/or cost.
f) Balance short, medium, and long term returns.
g) Balance the resources with the needs of the organization.
Question 16:
Refer to Section 2.4 of the text. It attempts to estimate the opportunity cost of performing
the project now versus deferring its execution to some time in the future. The cost of the
project is reduced by deferring it and there may also be a reduction in uncertainty.
Question 17:
Refer to Section 2.4 of the text. The profitability models evaluate the financial impact of
using assets to generate an operating cash flow. As such, the profitability model is
primarily a single criterion numeric model. The scoring models evaluate multiple criteria
by converting their values to a normalized scale that facilitates making a holistic decision
capable of using both numeric and nonnumeric variables. Any scoring model can include
profitability as a criterion, thus getting the best of both worlds.
Question 18:
Risk analysis can be used for any situation where a decision must be made with data that
is not certain. Anytime there is a range of possible outcomes, and a probability can be

Full file at https://fratstock.euChapter 2 - Instructor’s Resource Guide to
Project Management: A Managerial Approach, seventh edition
REV: July, 2008 Revision: Dwayne Whitten Page 12 of 30
estimated for each one, risk analysis is a valuable tool. One classic tool used in this
situation is a decision tree that organizes the calculation of the expected value of each
possible outcome.
Question 19:
1) Capital Investment with Discounted Cash flow: For short-term capital projects, the
impact of discounting rates may be insignificant to the overall project. Discounting is
a nonlinear algorithm that increases its impact as the duration of a project increases.
On long-term capital projects, the discounting models can be quite elaborate and may
even drive work plans by delaying one or more expenditures to increase return on
investment.
2) Simulation Models: Simulation models are easy to misuse, but when used properly
can be very helpful. For most applications suitable for such an analysis, the project
manager should seek competent advice from someone who has demonstrated
expertise in creating and manipulating these models. Simulation models, as will be
discussed later, can also be used to estimate the probability of the project completing
within a given time frame at a given cost. Some organizations will require that such
analysis be included in proposals they receive from prospective bidders.
Question 20:
There are several reasons why managers may underutilize these techniques:
1) In many organizations, the project managers are self-taught, so they may be
unaware of these techniques.
2) Even if some of the managers are aware, their senior management may not be
familiar or comfortable with selection models.
3) The managers may not think the models are worth the time and trouble. They
believe that they get good enough results with the techniques (or lack thereof)
they currently use.
4) Managers may believe that using analytic techniques will reduce their personal
ability to influence the selection process. They may not want to give up their
perceived power.
Question 21:
Uncertainty models can be classified as one of a variety o models depending on how they
are used. Uncertainty in this context means that the analyst has not estimated the
probability of occurrence of something related to the project. This could be cost, cash
flow, schedule, customer satisfaction, or environmental catastrophe. The list is endless.
Since any of these factors could be part of a selection model, uncertainty and how it is
handled could affect them all.
Question 22:
Refer to Section 2.6 of the text.
1) Validity: A piece of information actually means what we believe it to mean.

Full file at https://fratstock.euChapter 2 - Instructor’s Resource Guide to
Project Management: A Managerial Approach, seventh edition
REV: July, 2008 Revision: Dwayne Whitten Page 13 of 30
2) Reliability: A demonstration of consistent performance that is stable and
predictable.
In the not too distant past, the Mars Climate Orbiter was lost because invalid data was
used to estimate its distance from the planet’s surface during the orbital insertion process.
The spacecraft’s navigation team believed that the software they were using was
producing results in the metric system. Even though the software specification did call
for metric, the software actually used imperial units. The software performed its
calculations predictably, but the results were invalid to the users.
Question 23:
Refer to Section 2.6 of the text. In the context of this question, we are referring to the
type of measurement standard. A reference to an “external” standard is objective while a
reference to an “internal” standard is subjective.
In the recent judging for the building to replace the World Trade Center, an objective
measure for selecting the winning design would be the volume of office space created,
measured in square meters. A subjective measure would be the votes of a panel of
experts as to the aesthetics of the design.
Question 24:
Refer to answer 22 of this book and to Section 2.6 of the text. The short answer is yes.
Total reliability means getting the same answer every time. The answer may not be
useful, which makes it invalid.
Question 25:
Project management maturity measures the ability of the organization to manage projects;
it doesn’t distinguish between a multiple and a single project environment.
Question 26:
Refer to Section 2.4 of the text. When an organization can describe a project in terms of
a compelling need for action, and when the called-for action will produce benefits in
rough proportion to the costs of executing the project, nonnumeric selection models will
often be adequate to approve the project. The compelling reason may be responding to
an emergency situation like a flood. There isn’t a lot of need to analyze the necessity for
a response so non-numeric criteria are fine. In other cases, numeric methods may be more
suited as in a case where cost estimates can be obtained.
Question 27:
A number of ethical issues can come up during the RFP process, such as:
Gaining confidential knowledge of a competitor’s data or the customer’s criteria.
Deliberately bidding below cost to win the job believing that the real money will
be made in charging the customer for changes.
Bribes or other favors to the people who choose the winning proposal.
Collaborating with the competition (or the customer) to set the bids to favor a pre-
selected winner.

Full file at https://fratstock.euChapter 2 - Instructor’s Resource Guide to
Project Management: A Managerial Approach, seventh edition
REV: July, 2008 Revision: Dwayne Whitten Page 14 of 30
Question 28:
The hurdle rate used to compute NPV in Table 2-4 of the text is 15%. A positive NPV
means that cash inflows exceed cash outflows after they have been adjusted for the time
value of money. By definition, NPV is the difference between discounted cash inflows
and discounted cash outflows. In this case, the cash inflows generate a surplus cash flow
($10,968) above that required to cover the 15% hurdle rate with 3% inflation.
Question 29:
When using the Crystal Ball® forecast display, the left triangular slider can be moved to
the right until the corresponding box reads $20,000. The cumulative probability, labeled
“Certainty” will then be showing the probability of exceeding $20,000.
Question 30:
The original estimate was derived from the most likely values. The distribution for each
year, however, is skewed toward the low side. In other words, the Minimum is farther
away from the Most Likely than the Maximum for each year. When Crystal Ball®
applies the triangular distribution during the simulation, the output is then skewed toward
the low side. A pessimistic view of cash flow is probably more realistic because of the
complexity of the prospective project.
Question 31:
This visual display combines a number of important factors in an easy to understand
format. They include the number and type of projects, their relative size, timing, history
and where they fall on the scales of innovation for both products and processes. It is also
easy to see gaps and excesses in each category as well as the mix among the categories
and the degree of product and process change. This graphic allows comparison of the
types of projects being conducted, the number of projects in each type with the relative
size of the resources and investments. Different project portfolios’ proposals can be
readily compared for discussion purposes or with past years’ selections.
Question 32:
Unlike the aggregate plan, the Plan of Record records the results of the selection process.
It shows the mix across categories with the priority and resource needs (headcount) of
each project. The Plan of Record also shows “out-plan” projects, those that show
promise but haven’t yet made it through the decision process. This gives visibility to a
pool of possible projects if one of the chosen ones terminates early for some reason. It
also displays the relative priority and the rough schedule of performance for the selected
projects.
Questions for Project Management in Practice
Implementing Strategy through Projects at Blue Cross/Blue Shield

Full file at https://fratstock.euChapter 2 - Instructor’s Resource Guide to
Project Management: A Managerial Approach, seventh edition
REV: July, 2008 Revision: Dwayne Whitten Page 15 of 30
Question 33:
The approach is top down in that the goals are still set by the senior management team.
Using this approach, however, the senior management team is able to express their
strategic desires through the specific projects they select and monitor. This ties together
the day-to-day activities with the strategic point of view.
Question 34:
The role of projects and their management is to execute the activities that will bring life
to the corporate strategic vision. Using projects as opposed to functional organizations
leads to a number of benefits including:
Lower costs
Better management of projects
Improved project success
Question 35:
This system will give on-going visibility of the status of projects to important members of
the senior management team. This keeps senior management grounded in the problems
associated with executing real projects. It benefits the project teams by giving them the
benefit of senior management’s experience as the projects encounter issues during
execution. It insures senior management support for the project results while exposing
the talents of the project teams to them.
Project Selection for Spent Nuclear Fuel Cleanup
Question 36:
It is likely that some stakeholders simply did not believe the data because they mistrusted
its source. Others probably had very real fears that the proposed solutions would only
worsen the situation.
Question 37:
The presented data suggest that authorities were less than honest in past dealings with
some of the stakeholders.
Question 38:
1) Option 1 simply puts a band-aid on the problem by leaving the containers at their
present location, albeit in a second shell. Most stakeholders would probably view this
as unacceptable.
2) Option 2 is an example of one possible definition for insanity - doing the same thing
over again and expecting a different result. Most stakeholders probably would
recognize the potential for future leaks of a similar nature to the present situation.
3) Option 4 transfers the problem to another location and certainly raises some
interesting ethical dilemmas for the stakeholders.

Full file at https://fratstock.euChapter 2 - Instructor’s Resource Guide to
Project Management: A Managerial Approach, seventh edition
REV: July, 2008 Revision: Dwayne Whitten Page 16 of 30
Question 39:
Option 3 repackages the fuel until the government can reprocess it during a 40-year
period. The repackaging should prevent leaks until well after reprocessing has been
completed.
Question 40:
No. Special products divert management and workers’ attention and either require a
different process to produce the product, or hinder the improvement of standard processes
to produce the standard products.
On the other hand, it might be a good idea to choose some of the projects with a higher
potential payoff in order to diversify the project portfolio.
Question 41:
Part of the problem in this dilemma is defining what the investment is. Too often return
on investment (ROI) is narrowly interpreted to mean physical facilities, ignoring the
firm’s investment in people, maintenance, research, development, skills, training, etc.
Any manager can look good on short term ROI measures by quickly eliminating all these
long term investments, but the firm will eventually wither and go bankrupt.
Question 42:
In either situation, the critical issue is the break in a levee, whether due to a broad wave
hitting the levee wall or an earthquake splitting the wall. The chances, location, and
seriousness of each would vary with the natural disaster and surrounding topography of
course.
Question 43:
Clearly, the probability of each type of disaster such as the hurricane strength and the
earthquake Richter value would come into play, as well as the frequency of each disaster
per year. Then, the probability of various amounts of water leakage and the location of
such relative to the local situation would be analyzed.

Full file at https://fratstock.euChapter 2 - Instructor’s Resource Guide to
Project Management: A Managerial Approach, seventh edition
REV: July, 2008 Revision: Dwayne Whitten Page 17 of 30
Problems
Problem 1:
1) Project A: Payback Period = $250,000/$75,000 = 3.3 years.
2) Project B: Payback Period = $150,000/$52,000 = 2.9 years
3) Project B is better because it has a shorter payback period.
Problem 2:
Question 2 should be removed since this information is not provided in the 7th edition of
the book.
Problem 3:
Problem 4:
i = 24%
Investment Yr 1 Yr 2 Yr 3 Yr 4
Cashflow (75,000)$ 20,000$ 25,000$ 30,000$ 50,000$
PVIF 1.0000 1.2400 1.5376 1.9066 2.3642
PV $ (75,000)$ 16,129$ 16,259$ 15,735$ 21,149$
NPV (5,729)$
The addition of 4% inflation makes the investment unfavorable at a hurdle rate of 20%.
Problem 5:
1) Problem 3 PI:
2) Problem 4 PI:
i = 20%
Investment Yr 1 Yr 2 Yr 3 Yr 4
Cashflow (75,000)$ 20,000$ 25,000$ 30,000$ 50,000$
PVIF 1.0000 1.2000 1.4400 1.7280 2.0736
PV $ (75,000)$ 16,667$ 17,361$ 17,361$ 24,113$
NPV 502$
Discounted Cash Outflows 75,000$
Discounted Cash Inflows 75,502$
Profitability Index 1.007
Discounted Cash Outflows 75,000$
Discounted Cash Inflows 69,271$
Profitability Index 0.924

Full file at https://fratstock.euChapter 2 - Instructor’s Resource Guide to
Project Management: A Managerial Approach, seventh edition
REV: July, 2008 Revision: Dwayne Whitten Page 18 of 30
Problem 6:
Year Pessimistic Most Likely Optimistic Used PVIF PV$
0 $ (65,000) $ (65,000) $ (65,000) $(65,000) 1 $(65,000)
1 $ 14,000 $ 20,000 $ 22,000 $ 20,000 1.200 $ 16,667
2 $ 19,000 $ 25,000 $ 30,000 $ 25,000 1.44 $ 17,361
3 $ 27,000 $ 30,000 $ 36,000 $ 30,000 1.728 $ 17,361
4 $ 32,000 $ 35,000 $ 39,000 $ 35,000 2.0736 $ 16,879
Rate 20% NPV $ 3,268
The column labeled “Used” indicates the cash flow value used to calculate the net present
value.
The profitability index is the sum of the discounted cash flows divided by the initial
investment. For this problem it is the sum of the PV’s for years 1-4 divided by $65,000
or:
68,268/65,000 = 1.05
Since the value it greater than one, the project should be accepted (assuming everything
else is equal).
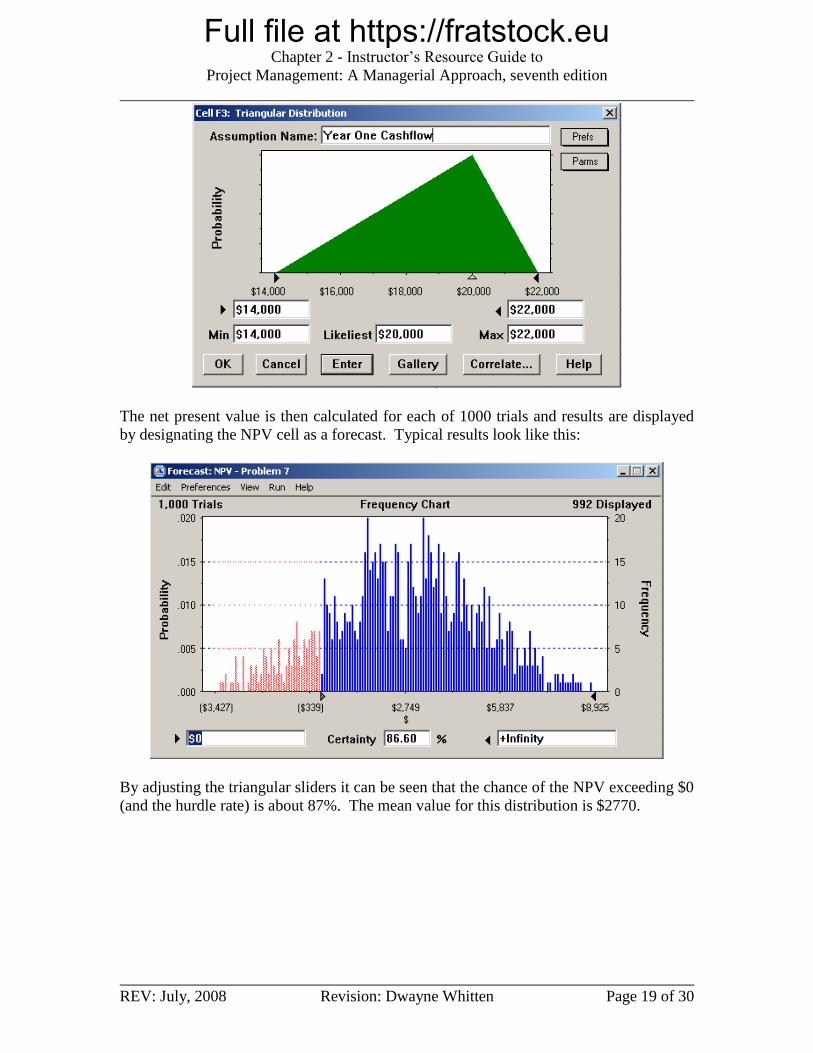
Problem 7:
Year Pessimistic Most Likely Optimistic Used PVIF PV$
0 $ (65,000) $ (65,000) $ (65,000) $(65,000) 1 $(65,000)
1 $ 14,000 $ 20,000 $ 22,000 $ 20,000 1.200 $ 16,667
2 $ 19,000 $ 25,000 $ 30,000 $ 25,000 1.44 $ 17,361
3 $ 27,000 $ 30,000 $ 36,000 $ 30,000 1.728 $ 17,361
4 $ 32,000 $ 35,000 $ 39,000 $ 35,000 2.0736 $ 16,879
Rate 20% NPV $ 3,268
Now the green (or shaded) cells in the column labeled “Used” (with the exception of the
initial investment of $65,000) are calculated by Crystal Ball® using a triangular
distribution with the end points selected based on the pessimistic and optimistic values
given. The setup for year one looks like this:
Full file at https://fratstock.euChapter 2 - Instructor’s Resource Guide to
Project Management: A Managerial Approach, seventh edition
REV: July, 2008 Revision: Dwayne Whitten Page 19 of 30
The net present value is then calculated for each of 1000 trials and results are displayed
by designating the NPV cell as a forecast. Typical results look like this:
By adjusting the triangular sliders it can be seen that the chance of the NPV exceeding $0
(and the hurdle rate) is about 87%. The mean value for this distribution is $2770.

Full file at https://fratstock.euChapter 2 - Instructor’s Resource Guide to
Project Management: A Managerial Approach, seventh edition
REV: July, 2008 Revision: Dwayne Whitten Page 20 of 30
Problem 8:
Year Pessimistic Most Likely Optimistic Inflation Used PVIF PV$
0 $ (65,000) $ (65,000) $ (65,000) - $(65,000) 1 $(65,000)
1 $ 14,000 $ 20,000 $ 22,000 2% $ 20,000 1.220 $ 16,393
2 $ 19,000 $ 25,000 $ 30,000 2% $ 25,000 1.4884 $ 16,797
3 $ 27,000 $ 30,000 $ 36,000 2% $ 30,000 1.8158 $ 16,521
4 $ 32,000 $ 35,000 $ 39,000 2% $ 35,000 2.2153 $ 15,799
Rate 20% NPV $ 510
Now the column labeled “Inflation” has been added. Each of these cells is individually
calculated by Crystal Ball® with a normal distribution using a standard deviation of
0.33% to allow different inflation values for each year. The result is added to the “PVIF”
calculation used to determine the individual PV results.
Now the forecast values for NPV look like this:
The probability that the NPV exceeds $0 is about 50%. The mean value for this
distribution is -$85. This analysis indicates that there is only a 50-50 chance that the
project will qualify (meet the hurdle rate).

Full file at https://fratstock.euChapter 2 - Instructor’s Resource Guide to
Project Management: A Managerial Approach, seventh edition
REV: July, 2008 Revision: Dwayne Whitten Page 21 of 30
Problem 9:
In this example, Method C has the highest score, so the decision-maker would regard it as
the best option. The instructor should emphasize that it is not necessary for the weights
to sum to 100. It is only necessary that the model use the same scoring categories to
evaluate each option.
Problem 10:
a) Implementation risks = 10 and cultural differences = 25
Due to the changes in weights for implementation risks and cultural differences, Method
B is now the best option.
b) Using the initial values from problem 6, make the changes so that Method A
implementation risks = 3 and Method C cultural differences = 2.
Category Weight A B C A B C
Consulting costs 20 1 2 3 20 40 60
Acquisition time 20 2 3 1 40 60 20
Disruption 10 2 1 3 20 10 30
Cultural differences 10 3 3 2 30 30 20
Skill redundencies 10 2 1 1 20 10 10
Implementation risks 25 1 2 3 25 50 75
Infrastructure 10 2 2 2 20 20 20
175 220 235
Method Options
Grade Score
Total Score
Category Weight A B C A B C
Consulting costs 20 1 2 3 20 40 60
Acquisition time 20 2 3 1 40 60 20
Disruption 10 2 1 3 20 10 30
Cultural differences 25 3 3 2 75 75 50
Skill redundencies 10 2 1 1 20 10 10
Implementation risks 10 1 2 3 10 20 30
Infrastructure 10 2 2 2 20 20 20
205 235 220Total Score
Method Options
Grade Score

Full file at https://fratstock.euChapter 2 - Instructor’s Resource Guide to
Project Management: A Managerial Approach, seventh edition
REV: July, 2008 Revision: Dwayne Whitten Page 22 of 30
The change for A’s implementation risks grade was not sufficient to replace Method C as
the best option. The grade for cultural differences at Method C had already been set to 2
in the initial evaluation of the problem.
c) Using the initial values from problem 6, insert Tax considerations = 15 and A = 3,
B = 2, and C = 1.
Due to the insertion of tax considerations, Methods B and C are now the best options.
Category Weight A B C A B C
Consulting costs 20 1 2 3 20 40 60
Acquisition time 20 2 3 1 40 60 20
Disruption 10 2 1 3 20 10 30
Cultural differences 10 3 3 2 30 30 20
Skill redundencies 10 2 1 1 20 10 10
Implementation risks 25 3 2 3 75 50 75
Infrastructure 10 2 2 2 20 20 20
225 220 235
Method Options
Grade Score
Total Score
Category Weight A B C A B C
Consulting costs 20 1 2 3 20 40 60
Acquisition time 20 2 3 1 40 60 20
Disruption 10 2 1 3 20 10 30
Cultural differences 10 3 3 2 30 30 20
Skill redundencies 10 2 1 1 20 10 10
Implementation risks 25 1 2 3 25 50 75
Infrastructure 10 2 2 2 20 20 20
Tax considerations 15 3 2 1 45 30 15
220 250 250
Method Options
Grade Score
Total Score

Full file at https://fratstock.euChapter 2 - Instructor’s Resource Guide to
Project Management: A Managerial Approach, seventh edition
REV: July, 2008 Revision: Dwayne Whitten Page 23 of 30
Problem 11:
Based upon the evaluation of categories, Nina should select Mall Option 1.
Problem 12:
Change the grade for Location 3’s rent to 3.
Due to the rent change, Location 3 moves up from last place to second place based upon
the grades assigned to the evaluated categories.
Category Weight 1 2 3 4 1 2 3 4
Class of clientele 1.000 2 3 1 3 2.000 3.000 1.000 3.000
Rent 0.900 3 2 1 3 2.700 1.800 0.900 2.700
Indoor mall 0.855 3 1 3 1 2.565 0.855 2.565 0.855
Traffic volume 0.720 3 2 3 1 2.160 1.440 2.160 0.720
9.425 7.095 6.625 7.275Total Score
Grade Score
Mall Options
Category Weight 1 2 3 4 1 2 3 4
Class of clientele 1.000 2 3 1 3 2.000 3.000 1.000 3.000
Rent 0.900 3 2 3 3 2.700 1.800 2.700 2.700
Indoor mall 0.855 3 1 3 1 2.565 0.855 2.565 0.855
Traffic volume 0.720 3 2 3 1 2.160 1.440 2.160 0.720
9.425 7.095 8.425 7.275
Mall Options
Grade Score
Total Score

Full file at https://fratstock.euChapter 2 - Instructor’s Resource Guide to
Project Management: A Managerial Approach, seventh edition
REV: July, 2008 Revision: Dwayne Whitten Page 24 of 30
Problem 13:
For the triangular distribution, the input values are contained in spreadsheet cells B3:D6
for the Windows platform and in cells F3:H6 for the UNIX platform. (The cell references
are for the problem’s source data in the student’s textbook.)
Statistic Windows Platform Value Unix Platform Value
Mean $513,218 $506,365
Median $503,879 $500.776
Standard Deviation $54,608 $66,011
Skewness 0.49 0.30
Kurtosis 2.62 2.42
Range Width $277,169 $330,473
Minimum Value $399,295 $360,049
Maximum Value $676,464 $690,522
Figure 2.10 Results of Crystal Ball Simulation. (Ref. p. 273 Project Management in
Practice [Mantel, Meredith, Shafer, Sutton; John Wiley & Sons, 2001.])
The UNIX platform offers a better (lower) potential cost but also exhibits higher
uncertainty (range, standard deviation) around the expected (mean) costs. In addition to
simulated cost and the company’s philosophy towards accepting risk, the selection
decision should consider the alliances and partnerships available to support the selected
platform.
Incidents for Discussion
Portillo, Inc.
This case is a good lead in to the whole subject of estimates. The students should, even at
the college level, be able to share experiences of estimate being manipulated either up or
down to support an agenda. This could be his or her own inflating of how long it will
take to get something done, or a supervisor arbitrarily cutting budgets.
Ms. Portillo has discovered a fundamental truth about estimates, namely that they are
always wrong. While the estimates that have been used to base the business decisions on
may be technically wrong, she needs to ask whether they have still been useful. In other
words do the errors and biases cancel each other out enough to still lead to the right
decision for the business? Nonetheless she needs to share her findings with the
Committee. Here are some things to do to improve the accuracy of the estimates:
1. For the projects that are selected, compare the actual outcomes to the estimates to
develop a database of estimating bias. The techniques for this are described in
Chapter 7.
2. Train her managers on a consistent tool set and process for estimating and then
follow it.
Full file at https://fratstock.euChapter 2 - Instructor’s Resource Guide to
Project Management: A Managerial Approach, seventh edition
REV: July, 2008 Revision: Dwayne Whitten Page 25 of 30
3. Allow the management team to challenge each other’s estimates during the
project selection process. An alternative would be to prohibit the sponsor from
taking part in the decision for his or her product.
4. Bring in outside consultants to independently estimate selected projects.
L & M Power
This case is a good opportunity, particularly for college students, to try and put
themselves in the place of a company promoting a high visibility project. What are all
the factors that must be considered to have both the reality and perception of a successful
project? How should these factors be considered in the internal process of selecting a
project?
These are expensive, high visibility projects dealing with politically sensitive issues. The
financial model has some useful information, but using it by itself would lead to a
woefully inadequate selection process. This simple financial model does not take into
account legal, environmental, safety or community issues. It says nothing about the risk
of either project completing within cost and schedule, or the risk of problems in the
subsequent operations. It’s not clear how this project fits into the organization’s long-
term goals, and this model does nothing to further that knowledge.
CASE: Pan-Europa Foods S.A.
Question 1:
1) Pan-Europa is currently trading at a price below comparable companies. This is
because of reduced profitability and a failure to gain sufficient market share for new
products. As analysts are giving a “sell” signal, raiders are potentially buying up the
stock. Clearly then they must pursue strategies that drive up their stock price. This
includes increasing net income and gross sales.
2) Pan-Europa needs to capitalize on their hard won increased market share.
3) Humboldt and Morin should be leading the charge on this strategy.

Full file at https://fratstock.euChapter 2 - Instructor’s Resource Guide to
Project Management: A Managerial Approach, seventh edition
REV: July, 2008 Revision: Dwayne Whitten Page 26 of 30
Question 2:
Exhibit 3 presents three different ways to look at the data. While the NPV at the
minimum accepted ROR includes a risk premium, it doesn’t correct for the varying
durations of the project. Instead the best available data would be the Equivalent Annuity
that corrects for the project durations. Using this analysis the preferred project would be
11, the Strategic Acquisition. Then following in order would be:
Eastward Expansion
Snack Foods
Southward Expansion
Inventory Control System
Artificial Sweeteners
New Plant
Expanded Plant
Automation and Conveyor System
Expand Truck Fleet
Effluent Treatment Program (which has no NPV)
While the Effluent Treatment Program has no formal NPV it can be considered an
investment of 4M now to save a cost of 10M in 4 years.
Question 3:
There are many aspects that could invalidate the simple NPV analysis of the projects.
They include:
1) Risk
2) Political considerations
3) Regulatory issues including health, safety and environmental
4) Incompatibility with corporate strategy
5) Resource availability
6) Impact on brand or corporate image
7) Quality and certainty of the data used for analyzing the various projects
8) Synergies between the projects
Different analysis techniques and different assumptions can be used to correct for the
various factors that affect each project differently. For example:
The time value of money can be accounted for by using discounting methods
such as NPV or IRR.
Unequal lifetimes of the projects can be accounted for by calculating the NPV to
infinity or using Equivalent Annuities
Risk can be accounted for (at least financially) by increasing the hurdle rate.

Full file at https://fratstock.euChapter 2 - Instructor’s Resource Guide to
Project Management: A Managerial Approach, seventh edition
REV: July, 2008 Revision: Dwayne Whitten Page 27 of 30
The different project sizes can be accounted for by multiplying the NPV by the
ratio of the size of the projects or by using a profitability ratio.
Question 4:
1) Project 6, the effluent water treatment plants is a “must do” project to meet regulatory
requirements; it’s just a question of when. Project 5 is potentially one as well
depending on the regulatory environment that Pan-Europa’s safety record is measured
in. Both safety and environment may be significant issues to the corporation’s image
and stockholders which would tend to elevate their importance.
2) Projects that involve small technology changes like expanding the truck fleet would
have low risk. Increasing levels of technological sophistication such as automation or
introducing artificial sweeteners into products would also increase implementation
risks. Another risk area for any producer in a capitalist environment is attempting to
increase markets with new products in new areas. The prospective customers may
simply choose to not buy the product. Other elements of risk include project size,
complexity and length of the period of return.
3) There are real synergies between the plant expansion/additions, automation, truck
upgrade and the geographic expansion projects.
4) Projects that have nonquantitative costs and benefits would include:
Projects that impact the company’s regulator compliance such as effluent
treatment (environment) and warehouse automation (safety).
Several of the projects could impact the company’s image. For example, the snack
food rollout could be positive because of its wholesome connotations while the
acquisition of the schnapps brand could be negative. The effluent project could
be positive by showing the company’s willingness to act on environmental
concerns early. Similarly the automation project could be cast a positive step
towards increased safety. The plant expansion project may be positive or
negative depending on whether the community reacts to new jobs or factory
encroachment.
Question 5:
1) I would recommend four screens be applied using the following factors:
Is the project a “Must Do” for reasons outside of the company’s control?
o Criteria – Yes/No
Does the project meet the company policy for minimum IRR?
o Criteria –Yes/No
Does the project meet the company policy for maximum payback period?
o Criteria – Yes/No

Full file at https://fratstock.euChapter 2 - Instructor’s Resource Guide to
Project Management: A Managerial Approach, seventh edition
REV: July, 2008 Revision: Dwayne Whitten Page 28 of 30
Does the project incur excessive risk?
o Criteria – Yes/No
Does the project meet the current corporate strategy?
o Criteria - Yes/No
2) Using these screens and criteria the following projects would be eliminated outright:
Truck Fleet (1) because it does not meet the minimum IRR and exceeds the
maximum payback period dictated by company policy.
New Plant (2), Plant Expansion (3), Artificial Sweetener (4) and Plant
Automation (5) all because they exceed the maximum payback period dictated by
company policy.
Strategic Acquisition (11) and Artificial Sweetener (4) would both be eliminated
due to excessive risk.
Strategic Acquisition (11) would also be eliminated because it does not match the
current strategy.
Question 6:
The projects would be arrayed as follows using the categories:

Full file at https://fratstock.euChapter 2 - Instructor’s Resource Guide to
Project Management: A Managerial Approach, seventh edition
REV: July, 2008 Revision: Dwayne Whitten Page 29 of 30
Question 7:
Applying the criteria to the projects would yield the following recommendations for the
1993 projects:
These projects would total 77 million ECU, leaving a prudent reserve for unforeseen
circumstances.
Reading: From Experience: Linking Projects to Strategy
Question 1:
Two thirds of the revenue at HP is derived from products introduced within the past two
years. Projects are an important component of business strategy to sustain profitable
products in a dynamic marketplace.
Question 2:
The team should establish criteria that support business goals rather than personal
agendas. The financial selection criteria are intended to ensure that the projects generate
a sufficient return on investment within a defined time frame. They are also intended to
recognize that financial success is reflected in the portfolio of projects rather than in the
financial contributions of individual projects.
As suggested in Figure 3, financial criteria are an important but small part of the business
value created by projects. Senior managers recognize the value of qualitative
contributions to business value, so it is not always necessary to quantify a project’s
contributions to business value.
Question 3:
The objective is to select the right mix of projects required to support business success.
Prioritizing projects and selecting the vital few from the necessary many help to get more
work done in support of business goals. By carefully defining criteria, people are aided
in developing an understanding of the company’s strategy and the types of projects
required to achieve success. From the improved understanding, proposed projects will be
better aligned with business objectives.

Full file at https://fratstock.euChapter 2 - Instructor’s Resource Guide to
Project Management: A Managerial Approach, seventh edition
REV: July, 2008 Revision: Dwayne Whitten Page 30 of 30
Question 4:
The Plan of Record records the results of the selection process. It shows the mix across
categories with the priority and resource needs (headcount) of each project. The Plan of
Record also shows “out-plan” projects, those that show promise but haven’t yet made it
through the decision process. This gives visibility to a pool of possible projects if one of
the chosen ones terminates early for some reason. It also displays the relative priority
and the rough schedule of performance for the selected projects.
The aggregate project plan combines a number of important factors in an easy to
understand visual format. As described in the text, this includes the number and type of
projects, their relative size, timing, history and where they fall on the scales of innovation
for both products and processes. It is easy to see gaps and excesses in each category as
well as the mix among the categories and the degree of product and process change. This
graphic allows comparison of the types of projects being conducted, the number of
projects in each type with the relative size of the resources and investments. Different
project portfolios’ proposals can be readily compared for discussion purposes or with past
years’ selections.
Question 5:
They should be considered for inclusion when it is favorable for the company to do so.
For example, if missing data becomes known, the project may be reconsidered. Or, if
another project is cancelled or completed, the freed-up funds could be applied to an out-
plan project. Additionally, out-plan projects might be placed in the pipeline during a
review of the portfolio of projects.
Question 6:
It reduced the number of projects authorized for execution and probably changed the mix
of projects approved for execution. In one case, the reported reduction decreased the
pipeline projects from 120 to 30. In another area, the projects were decreased from 50 to
17.
HP would be more mature than organizations that lacked a project selection process
attempting to link business success to project strategies. The discipline and focus
provided by techniques described in the article are indicators of a high level of project
management maturity.
Question 7:
New proposals have been altered to address the measurable criteria used to select
projects. This has helped to focus behavior on activities that win for the business. It also
uses the portfolio approach to help manage risks inherent in generating revenues from
outputs produced by projects. In addition to numeric criteria, nonnumeric projects are
handled in a separate category of projects. Also refer to the answers for questions 2 and 3
of this reading assignment.