full name of centre town - peterhead academypeterheadacademy.aberdeenshire.sch.uk/wp-content/... ·...
TRANSCRIPT

BIOLOGY HIGHER
©
X007/301
Fill in these boxes and read what is printed below.
Full name of centre Town
Forename(s) Surname
Date of birth
SECTION A—Questions 1–30 (30 marks)
Instructions for completion of Section A are given on page two.
For this section of the examination you must use an HB pencil.
SECTIONS B AND C (100 marks)
1 (a) All questions should be attempted.
(b) It should be noted that in Section C questions 1 and 2 each contain a choice.
2 The questions may be answered in any order but all answers are to be written in the spacesprovided in this answer book, and must be written clearly and legibly in ink.
3 Additional space for answers will be found at the end of the book. If further space is required,supplementary sheets may be obtained from the invigilator and should be inserted inside the frontcover of this book.
4 The numbers of questions must be clearly inserted with any answers written in the additional space.
5 Rough work, if any should be necessary, should be written in this book and then scored throughwhen the fair copy has been written. If further space is required a supplementary sheet for roughwork may be obtained from the invigilator.
6 Before leaving the examination room you must give this book to the invigilator. If you do not, youmay lose all the marks for this paper.
Day Month Year Number of seat Scottish candidate number
FOR OFFICIAL USE
Total forSectionsB and C
N A T I O N A L M O N D A Y , 2 1 M A YQ U A L I F I C A T I O N S 1 . 0 0 P M – 3 . 3 0 P M2 0 0 7
L I X007 /301 6 / 13020 *X007/301*

Page two[X007/301]
Read carefully1 Check that the answer sheet provided is for Biology Higher (Section A).2 For this section of the examination you must use an HB pencil, and where necessary, an eraser.
3 Check that the answer sheet you have been given has your name, date of birth, SCN (Scottish
Candidate Number) and Centre Name printed on it.
Do not change any of these details.
4 If any of this information is wrong, tell the Invigilator immediately.
5 If this information is correct, print your name and seat number in the boxes provided.
6 The answer to each question is either A, B, C or D. Decide what your answer is, then, using
your pencil, put a horizontal line in the space provided (see sample question below).
7 There is only one correct answer to each question.
8 Any rough working should be done on the question paper or the rough working sheet, not on
your answer sheet.
9 At the end of the exam, put the answer sheet for Section A inside the front cover of thisanswer book.
Sample Question
The apparatus used to determine the energy stored in a foodstuff is a
A calorimeter
B respirometer
C klinostat
D gas burette.
The correct answer is A—calorimeter. The answer A has been clearly marked in pencil with a
horizontal line (see below).
Changing an answer
If you decide to change your answer, carefully erase your first answer and using your pencil fill in the
answer you want. The answer below has been changed to D.
A B C D
A B C D

4. Which graph best illustrates the effect of
increasing temperature on the rate of active uptake
of ions by roots?
Page three
SECTION A
All questions in this section should be attempted.
Answers should be given on the separate answer sheet provided.
[X007/301] [Turn over
1. Which line in the table identifies correctly the
two cell structures shown in the diagram?
2. The phospholipid molecules in a cell
membrane allow the
A free passage of glucose molecules
B self-recognition of cells
C active transport of ions
D membrane to be fluid.
3. Red blood cells have a solute concentration of
around 0.9%.
Which of the following statements correctly
describes the fate of these cells when immersed
in a 1% salt solution?
A The cells will burst.
B The cells will shrink.
C The cells will expand but not burst.
D The cells will remain unaffected.
X Y
A Golgi body
B Golgi body
C Endoplasmic reticulum
D Endoplasmic reticulum
Vesicle
Ribosome
Vesicle
Ribosome
X
Y Rate of
uptake
Rate of
uptake
Temperature (°C)
Temperature (°C)
0 70
0 70
Rate of
uptake
Rate of
uptake
Temperature (°C)
Temperature (°C)
0 70
0 70
A
B
C
D
Page four[X007/301]
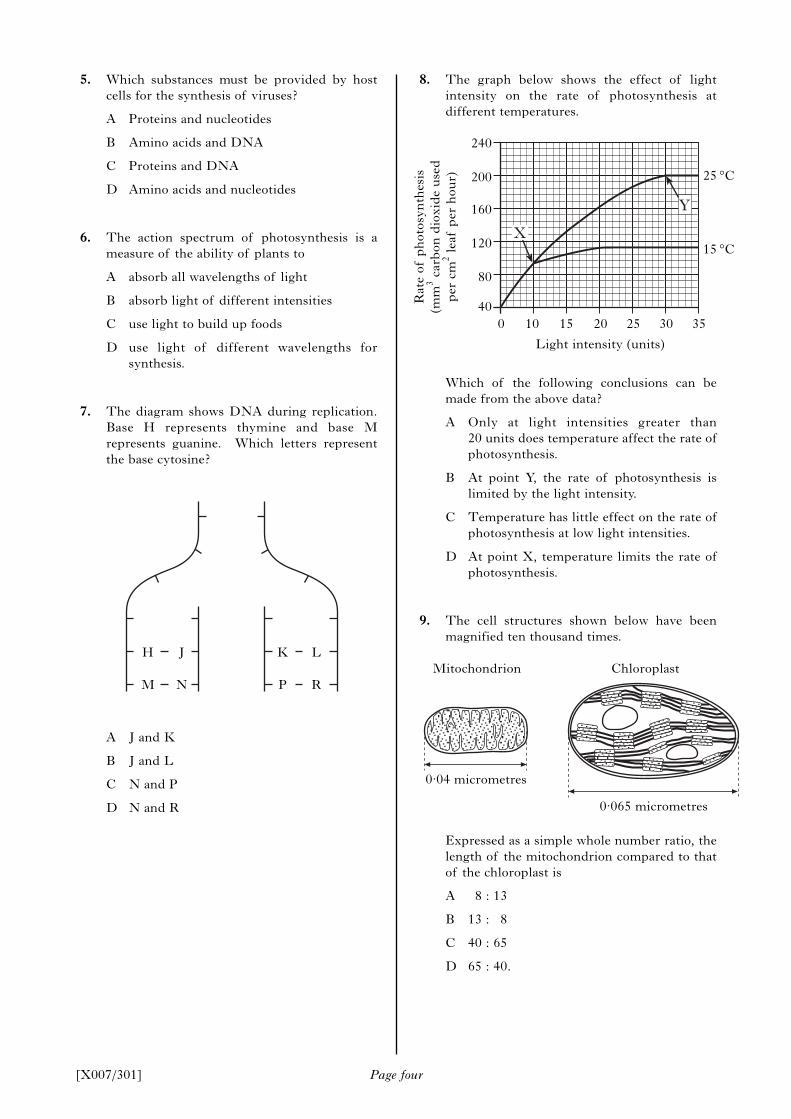
8. The graph below shows the effect of light
intensity on the rate of photosynthesis at
different temperatures.
Which of the following conclusions can be
made from the above data?
A Only at light intensities greater than
20 units does temperature affect the rate of
photosynthesis.
B At point Y, the rate of photosynthesis is
limited by the light intensity.
C Temperature has little effect on the rate of
photosynthesis at low light intensities.
D At point X, temperature limits the rate of
photosynthesis.
9. The cell structures shown below have been
magnified ten thousand times.
Expressed as a simple whole number ratio, the
length of the mitochondrion compared to that
of the chloroplast is
A 8 : 13
B 13 : 8
C 40 : 65
D 65 : 40.
5. Which substances must be provided by host
cells for the synthesis of viruses?
A Proteins and nucleotides
B Amino acids and DNA
C Proteins and DNA
D Amino acids and nucleotides
6. The action spectrum of photosynthesis is a
measure of the ability of plants to
A absorb all wavelengths of light
B absorb light of different intensities
C use light to build up foods
D use light of different wavelengths for
synthesis.
7. The diagram shows DNA during replication.
Base H represents thymine and base M
represents guanine. Which letters represent
the base cytosine?
A J and K
B J and L
C N and P
D N and R
H J K L
M N P R
X
Y
200
160
120
80
40
0 10 15 20 25 30 35
Light intensity (units)
Rate
of
ph
oto
syn
thesi
s
(mm
3carb
on
dio
xid
e u
sed
per
cm
2le
af
per
hou
r)
0.04 micrometres
0.065 micrometres
Mitochondrion Chloroplast
25 °C
15 °C
240

13. Apple crop yields have been increased by plant
breeders selecting for
A disease resistance
B flavour
C resistance to bruising
D sugar content.
14. Human insulin can be produced by the
bacterium E. coli using the following steps.
1 Culture large quantities of E. coli in vats of
nutrients.
2 Insert human insulin gene into E. coliplasmid DNA.
3 Cut insulin gene from human chromosome
using enzymes.
4 Extract insulin from culture vats.
The correct order for these steps is
A 3, 2, 1, 4
B 3, 1, 2, 4
C 1, 4, 3, 2
D 1, 2, 3, 4.
15. In a desert mammal, which of the following is
a physiological adaptation which helps to
conserve water?
A Nocturnal foraging
B Breathing humid air in a burrow
C Having few sweat glands
D Remaining underground by day
16. The following factors affect the transpiration
rate in a plant.
1 increasing wind speed
2 decreasing humidity
3 rising air pressure
4 falling temperature
Which two of these factors would cause an
increase in transpiration rate?
A 1 and 2
B 1 and 3
C 2 and 4
D 3 and 4
Page five[X007/301]
[Turn over
10. A section of a DNA molecule contains
300 bases. Of these bases, 90 are adenine.
How many cytosine bases would this section of
DNA contain?
A 60
B 90
C 120
D 180
11. What information can be derived from the
recombination frequencies of linked genes?
A The mutation rate of the genes
B The order and location of genes on a
chromosome
C Whether genes are recessive or dominant
D The genotype for a particular
characteristic
12. The diagram shows a family tree for a family
with a history of red-green colour deficiency.
The allele for red-green colour deficiency is
sex-linked.
Which of the following statements is true?
A Only the son is a carrier.
B Only the daughter is a carrier.
C Both son and daughter are carriers.
D Neither son nor daughter is a carrier.
Unaffected male
Affected male
Unaffected female
Affected female

[X007/301] Page six
17. When first exposed to a harmless stimulus, a
group of animals responded by showing
avoidance behaviour. When the stimulus was
repeated the animals became habituated to it.
What change in response would have shown
that habituation was taking place?
A An increase in the length of the response
B A decrease in the time taken to respond
C An increase in response to other stimuli
D A decrease in the percentage of animals
responding
18. In tomato plants, the allele for curled leaves is
dominant over the allele for straight leaves.
The allele for hairy stems is dominant over the
allele for hairless stems. The genes for
curliness and hairiness are located on different
chromosomes.
If plants heterozygous for both characteristics
were crossed, what ratio of phenotypes would
be expected in the offspring?
A All curly and hairy
B 3 curly and hairy: 1 straight and hairless
C 9 curly and hairy: 3 curly and hairless:
3 straight and hairy: 1 straight and hairless
D 1 curly and hairy: 1 curly and hairless:
1 straight and hairy: 1 straight and hairless
19. The bar graph below shows changes in the
DNA content per cell during stages of meiosis.
When do the homologous pairs of
chromosomes separate?
A Before the start of stage P
B Between stages P and Q
C Between stages Q and R
D Between stages R and S
20. The genes for two different characteristics are
located on separate chromosomes.
In a cross between individuals with the
genotypes AaBb and aabb, what is the chance
of any one of the offspring having the
genotype aabb?
A 0
B 1 in 2
C 1 in 4
D 1 in 8
21. Which line in the table identifies correctly
the main source of body heat and the method
of controlling body temperature in an
endotherm?
22. The following four statements relate to
meristems.
1 Some provide cells for increase in diameter
in stems
2 Some produce growth substances
3 They are found in all growing organisms
4 Their cells undergo division by meiosis
Which of the above statements are true?
A 1 and 2 only
B 1 and 3 only
C 2 and 3 only
D 2 and 4 only
Main source ofbody heat
A Respiration
Principal method of controlling body
temperature
Behavioural
Physiological
Behavioural
Physiological
Respiration
Absorbed from
environment
Absorbed from
environment
B
C
D
Meiosis
stage P stage Q stage R stage S
4
3
2
1
0
DNA
content
of cell
(units)

Page seven[X007/301]
25. Which of the following is triggered by the
hypothalamus in response to an increase in the
temperature of the body?
A Contraction of the hair erector muscles and
vasodilation of the skin capillaries
B Relaxation of the hair erector muscles and
vasodilation of the skin capillaries
C Contraction of the hair erector muscles and
vasoconstriction of the skin capillaries
D Relaxation of the hair erector muscles and
vasoconstriction of the skin capillaries
26. Plants require macro-elements for the
synthesis of various compounds. Identify
which macro-elements are required for
synthesis of the compounds shown in the table
below.
27. The following are events occurring during
germination in barley.
1 The embryo produces gibberellic acid
(GA)
2 α-amylase is produced
3 Gibberellic acid (GA) passes to the
aleurone layer
4 α-amylase converts starch to maltose
5 Maltose is used by the embryo
Which of the following indicates the correct
sequence of events?
A 1 2 4 5 3
B 1 3 2 4 5
C 3 2 1 4 5
D 5 1 3 2 4
23. The diagram below shows a transverse section
of a woody stem.
Which line of the table identifies correctly the
tissues P, Q and R?
24. The graph below shows changes which occur
in the masses of protein, fat and carbohydrate
in a girl’s body during seven weeks of starvation.
The girl weighs 60 kg at the start. Predict her
weight after two weeks without food.
A 43 kg
B 50 kg
C 54 kg
D 57 kg
[Turn over
P
Q
R
Protein
Fat
Carbohydrate
10
8
6
4
2
0
0 1 2 3 4 5 6 7
Weeks of starvation
Mass
(kg)
Chlorophyll
A phosphorus
B phosphorus
C magnesium
D magnesium
Protein
magnesium
nitrogen
nitrogen
phosphorus
ATP
nitrogen
magnesium
phosphorus
nitrogen
P
A cambium
B phloem
C xylem
D xylem
Q
xylem
xylem
phloem
cambium
R
phloem
cambium
cambium
phloem

Page eight[X007/301]
Candidates are reminded that the answer sheet MUST be returned INSIDE the front cover of this answer book.
28. The table shows the masses of various
substances in the glomerular filtrate and in the
urine over a period of 24 hours.
Which of the substances has the smallest
percentage of reabsorption from the
glomerular filtrate?
29. An investigation was carried out into the effect
of indole acetic acid (IAA) concentration on
the shoot growth of two species of plant. The
graph below shows a summary of the results.
Which one of the following conclusions is
justified?
A Species 1 shows its maximum stimulation at
a lower IAA concentration than species 2.
B Species 2 is more inhibited by the highest
concentrations of IAA than species 1.
C Species 2 is stimulated over a greater range
of IAA concentrations than species 1.
D Species 1 is stimulated by some IAA
concentrations which inhibit species 2.
30. An enzyme and its substrate were incubated with various concentrations of either copper or magnesium
salts.
The time taken for the complete breakdown of the substrate was measured.
The results are given in the table.
From the data, it may be deduced that
A high concentrations of copper salts promote the activity of the enzyme
B high concentrations of copper salts inhibit the activity of the enzyme
C low concentrations of magnesium salts inhibit the activity of the enzyme
D high concentrations of magnesium salts promote the activity of the enzyme.
SubstanceMass in
glomerularfiltrate (g)
Mass inurine(g)
A Sodium 600.0 6.0
B
C
D
Potassium 35.0 2.0
Uric acid 8.5 0.8
Calcium 5.0 0.2
species 1
species 2
Increasing concentration ofindole acetic acid (IAA)
Stimulation
Inhibition
Effect onshoot
growth
Salt Concentration(M)
0
1 × 10⁻⁸
1 × 10⁻⁶
1 × 10⁻⁴
39
42
380
1480
39
21
49
286
Time needed to break down substrate (s)
Copper salts Magnesium salts
incre
asi
ng
con
cen
trati
on

Page nine[X007/301]
[Turn over for Section B on Page ten
SECTION B
All questions in this section should be attempted.
All answers must be written clearly and legibly in ink.
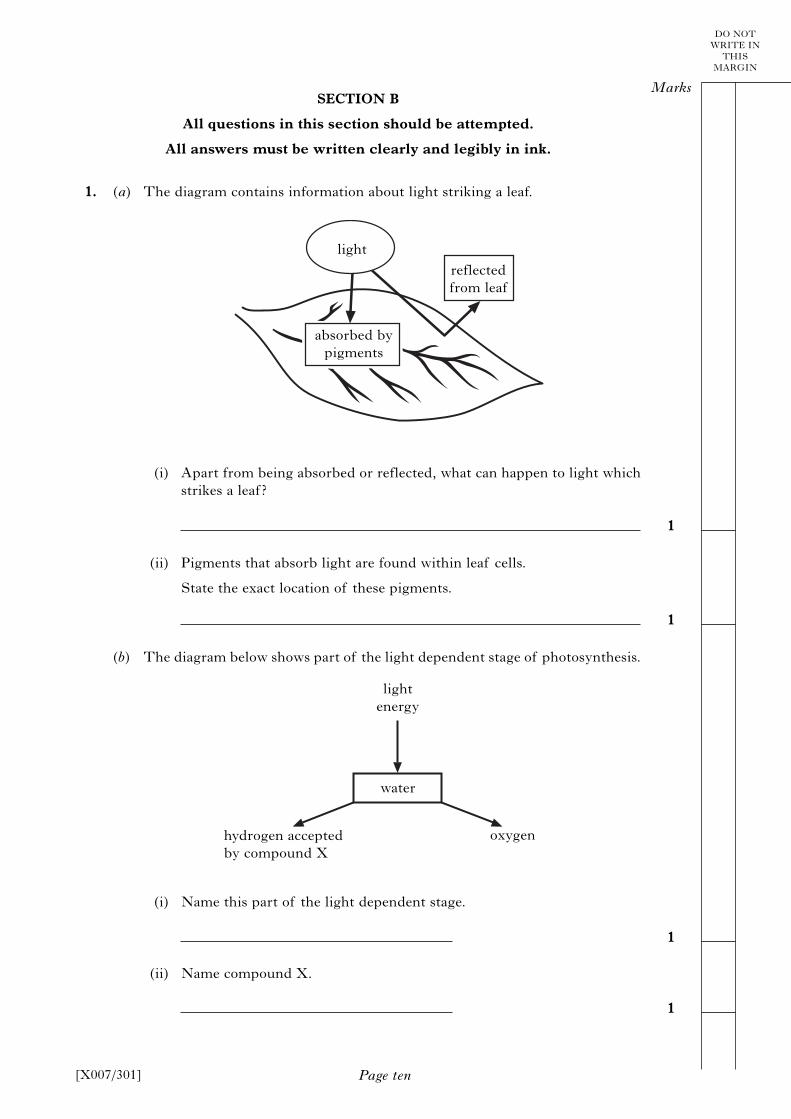
1. (a) The diagram contains information about light striking a leaf.
(i) Apart from being absorbed or reflected, what can happen to light which
strikes a leaf?
(ii) Pigments that absorb light are found within leaf cells.
State the exact location of these pigments.
(b) The diagram below shows part of the light dependent stage of photosynthesis.
(i) Name this part of the light dependent stage.
(ii) Name compound X.
oxygen
Page ten
DO NOT
WRITE IN
THIS
MARGIN
Marks
1
1
1
1
[X007/301]
reflected
from leaf
absorbed by
pigments
light
water
light
energy
hydrogen accepted
by compound X
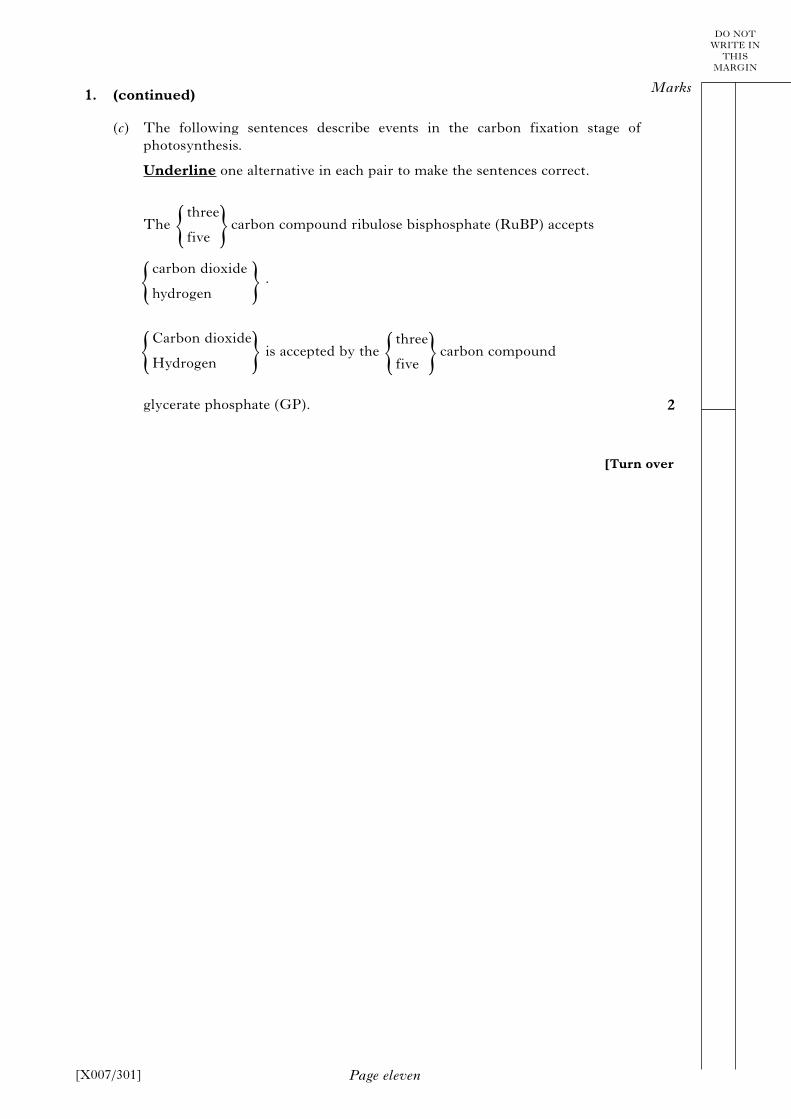
1. (continued)
(c) The following sentences describe events in the carbon fixation stage of
photosynthesis.
Underline one alternative in each pair to make the sentences correct.
The carbon compound ribulose bisphosphate (RuBP) accepts
.
is accepted by the carbon compound
glycerate phosphate (GP).
Page eleven
DO NOT
WRITE IN
THIS
MARGIN
Marks
2
[X007/301]
[Turn over
three
five{ }
three
five{ }
carbon dioxide
hydrogen{ }Carbon dioxide
Hydrogen{ }

2. The diagram shows apparatus set up to investigate the rate of respiration in an
earthworm. After 10 minutes at 20 °C the level of liquid in the capillary tube had
changed as shown.
(a) (i) What volume of oxygen is used by the earthworm during the 10 minute
period?
cm3
(ii) Describe a suitable control for this experiment.
(b) In a second experiment, a worm of 5 grams used 0.5 cm3
of oxygen in
10 minutes.
Calculate its rate of respiration in cm3
per minute per gram of worm.
Space for calculation
cm3 per minute per gram of worm
Page twelve
Marks
1
1
1
[X007/301]
DO NOT
WRITE IN
THIS
MARGIN
capillary tube
liquid
level at start
closed tap
earthworm
chemical to
absorb carbon
dioxide
cm3
0.5
0.4
0.3
0.2
0.1
level after
10 minutes
Page thirteen[X007/301]
[Turn over for Question 3 on Page fourteen
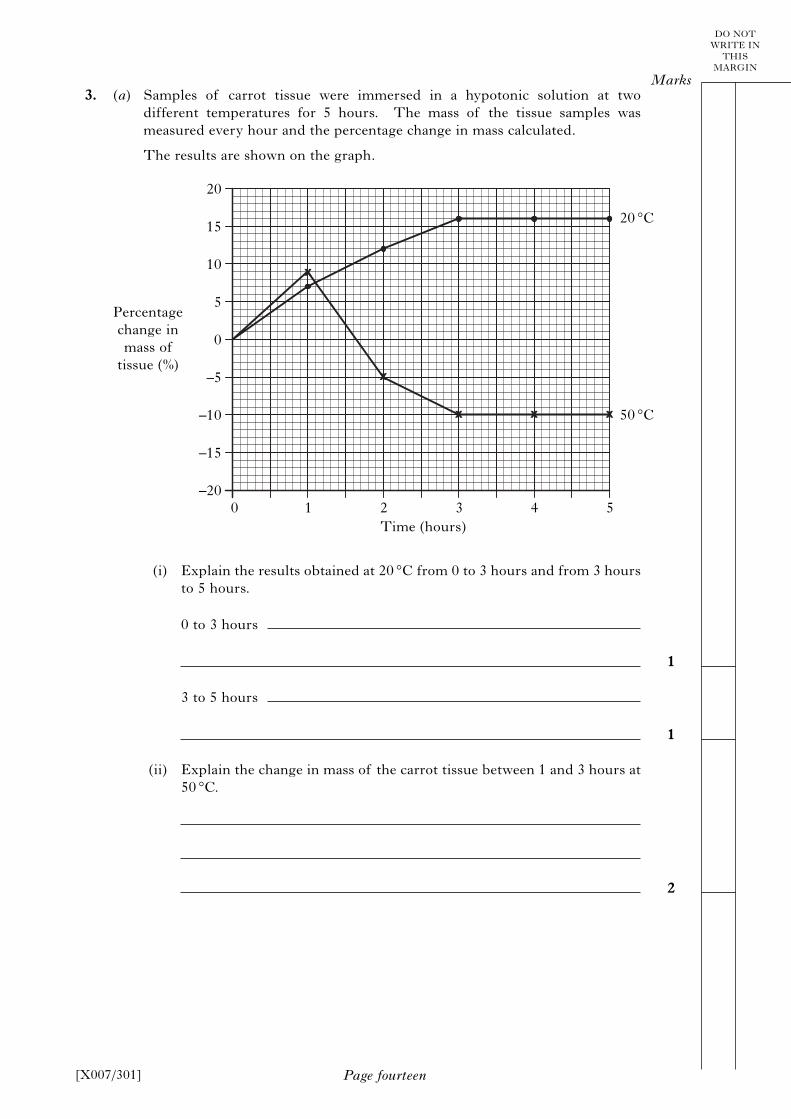
3. (a) Samples of carrot tissue were immersed in a hypotonic solution at two
different temperatures for 5 hours. The mass of the tissue samples was
measured every hour and the percentage change in mass calculated.
The results are shown on the graph.
(i) Explain the results obtained at 20 °C from 0 to 3 hours and from 3 hours
to 5 hours.
0 to 3 hours
3 to 5 hours
(ii) Explain the change in mass of the carrot tissue between 1 and 3 hours at
50 °C.
Page fourteen
DO NOT
WRITE IN
THIS
MARGIN
Marks
1
1
2
[X007/301]
20
15
10
5
0
–5
–10
–15
–20
0 1 2 3 4 5
Time (hours)
Percentage
change in
mass of
tissue (%)
20 °C
50 °C
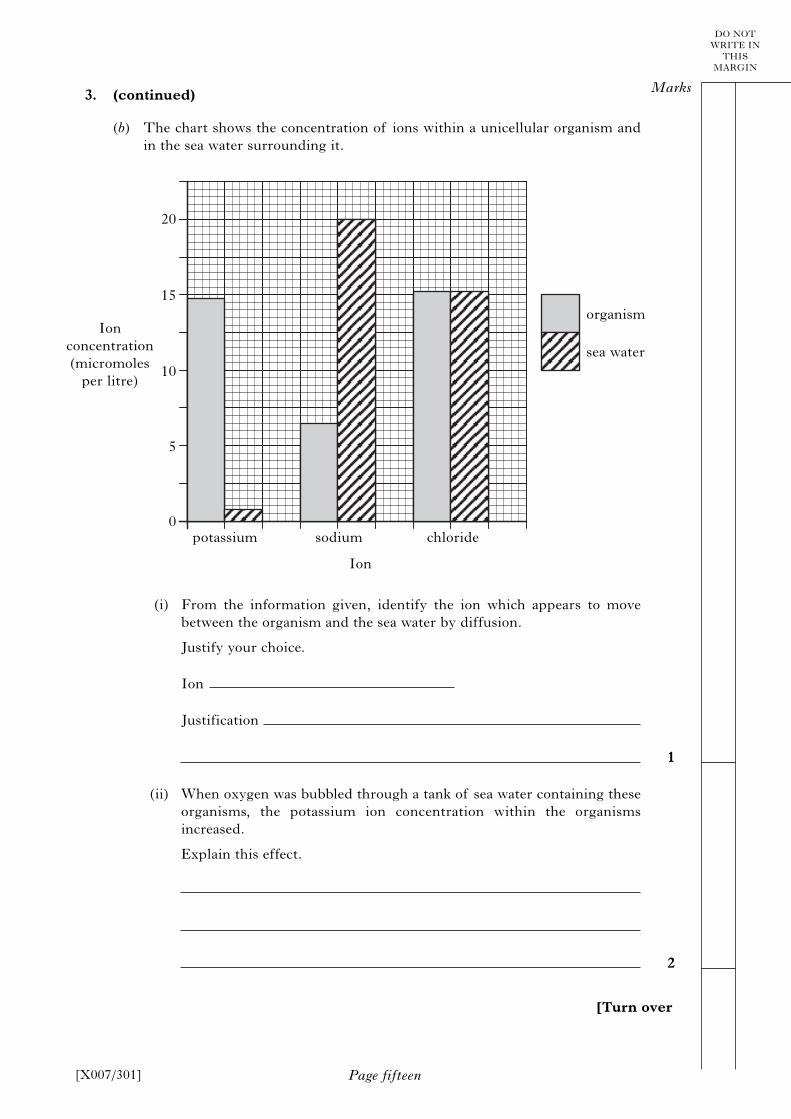
3. (continued)
(b) The chart shows the concentration of ions within a unicellular organism and
in the sea water surrounding it.
(i) From the information given, identify the ion which appears to move
between the organism and the sea water by diffusion.
Justify your choice.
Ion
Justification
(ii) When oxygen was bubbled through a tank of sea water containing these
organisms, the potassium ion concentration within the organisms
increased.
Explain this effect.
[X007/301] Page fifteen
DO NOT
WRITE IN
THIS
MARGIN
Marks
1
2
organism
sea water
potassium sodium chloride
Ion
20
15
10
5
0
Ion
concentration
(micromoles
per litre)
[Turn over

4. The diagram shows events occurring during the synthesis of a protein that is
secreted from a cell.
(a) (i) Name molecule X.
(ii) Name bond Y.
(b) What name is given to a group of three bases on mRNA that codes for an
amino acid?
(c) Give the sequence of DNA bases that codes for amino acid Z.
(d) Describe the roles of the endoplasmic reticulum and the Golgi apparatus
between the synthesis of the protein and its release from the cell.
Endoplasmic reticulum
Golgi apparatus
(e) The table contains some information about the structure and function of
proteins.
Add information to the boxes to complete the table.
Protein
Cellulase
Collagen
Structure(Globular or Fibrous)
Function
Page sixteen
DO NOT
WRITE IN
THIS
MARGIN
Marks
1
1
1
1
1
1
2
[X007/301]
��������
�������
�
������
� � � �
�������
����������������������
�����������
��������
�������
Structural protein in
skin

5. (a) The graph shows the relationship between plant species diversity in grassland
and grazing intensity by herbivores.
(i) Explain the effect on plant species diversity of increased grazing
intensity by herbivores between X and Y on the graph.
(ii) What evidence is there that grassland contains plant species tolerant of
grazing?
(b) State one feature of some plant species that allows them to tolerate grazing by
herbivores.
Page seventeen
DO NOT
WRITE IN
THIS
MARGIN
Marks
2
1
1
[X007/301]
Y
X
increasing grazing intensity by herbivores
increasing
plant species
diversity
[Turn over

6. Norway Spruce (Picea abies) is an evergreen species of tree with needle-like leaves, found in
regions with extremely cold winters.
The rate of photosynthesis of the species is at its maximum during spring then decreases from
June to December.
In an investigation, a sample of one-year-old seedlings was collected in each month from June
to December.
For each sample of seedlings, the following measurements were made and averages calculated.
• Dry mass of whole seedlings • Starch content in needles
• Dry mass of roots only • Sugar content in needles
The results are shown in Graphs 1 and 2.
Page eighteen[X007/301]
8
7
6
5
4
3
2
1
0
Jun Jul Aug Sep Oct Nov Dec
Month
Avera
ge d
ry m
ass
(g)
whole
seedlings
roots
only
120
100
80
60
40
20
0
200
180
160
140
120
100
80
Jun Jul Aug Sep Oct Nov Dec
Month
Avera
ge s
tarc
h c
on
ten
t (m
g p
er
g n
eed
les)
Avera
ge s
ugar
con
ten
t (m
g p
er
g n
eed
les)
averagestarch
content
averagesugar
contentGraph 1 Graph 2
(a) (i) Use values from Graph 1 to describe the changes in average dry mass
of whole seedlings from June to December.
(ii) Between which two months was there the greatest increase in average dry
mass of the seedlings’ roots only?
Tick (✓) one box.
(iii) From Graph 2, calculate the ratio of average starch content to average
sugar content in the needles in November.
Space for calculation
DO NOT
WRITE IN
THIS
MARGINMarks
2
1
1
Jun–Jul Jul–Aug Aug–Sept Sept–Oct Oct–Nov Nov–Dec
Starch: Sugar

Page nineteen
6. (a) (continued)
(iv) From Graph 2, calculate the percentage decrease in average starch
content in the needles between June and October.
Space for calculation
% decrease
(b) Explain the decrease in average starch content in the needles between June and
December.
(c) Raffinose is a sugar that prevents frost damage to needles.
The table shows the raffinose content of needles from the seedling samples.
(i) What evidence is there that raffinose is not the only sugar present in the
needles of Norway Spruce?
(ii) Suggest how the changing raffinose content of needles from June to
December is of survival value to Norway Spruce.
Marks
1
1
1
1
DO NOT
WRITE IN
THIS
MARGIN
[X007/301]
Month Raffinose content (mg per g of needles)
0
1
2
3
9
30
50
June
July
August
September
October
November
December
[Turn over
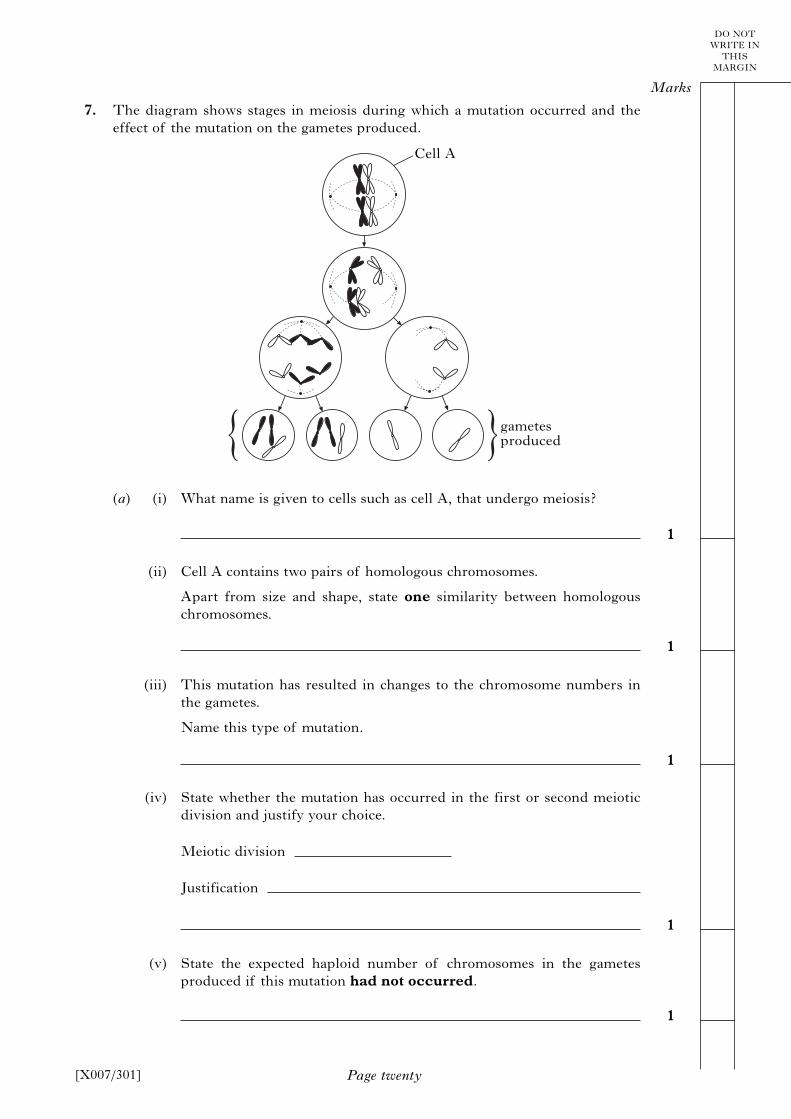
7. The diagram shows stages in meiosis during which a mutation occurred and the
effect of the mutation on the gametes produced.
(a) (i) What name is given to cells such as cell A, that undergo meiosis?
(ii) Cell A contains two pairs of homologous chromosomes.
Apart from size and shape, state one similarity between homologous
chromosomes.
(iii) This mutation has resulted in changes to the chromosome numbers in
the gametes.
Name this type of mutation.
(iv) State whether the mutation has occurred in the first or second meiotic
division and justify your choice.
Meiotic division
Justification
(v) State the expected haploid number of chromosomes in the gametes
produced if this mutation had not occurred.
Page twenty
DO NOT
WRITE IN
THIS
MARGIN
Marks
1
1
1
1
1
[X007/301]
gametesproduced
Cell A

Page twenty-one
7. (continued)
(b) The diagram represents the sequence of bases on part of one strand of a DNA
molecule.
Part of DNA molecule
The effects of two different gene mutations on the strand of DNA are shown
below.
Gene mutation 1
Gene mutation 2
Complete the table by naming the type of gene mutation that has occurred in
each case.
DO NOT
WRITE IN
THIS
MARGIN
Marks
2
[X007/301]
[Turn over
T G A A C T G
Gene Mutation
1
2
Name
T G A C C T G
T T G A A C T G

Page twenty-two
8. The table shows information about three species of oak tree that have evolved from
a common ancestor.
(a) (i) The Oak species have evolved in ecological isolation.
State the importance of isolating mechanisms in the evolution of new
species.
(ii) Use the information to explain how the evolution of the Oak species
illustrates adaptive radiation.
(b) The Kermes Oak grows to a maximum height of one metre.
Explain the benefit to this species of having leaves with sharp spines.
(c) To maintain genetic diversity, species must be conserved.
State two ways in which species can be conserved.
1
2
DO NOT
WRITE IN
THIS
MARGIN
[X007/301]
Marks
1
2
1
1
���������
����������� ���������� ��� !�����������
���"��!�#� ������������� �!��#��#���� ������$� !��!��#��#����
���$��� ���� ���� %�����������# &� �������� �����������
Page twenty-three
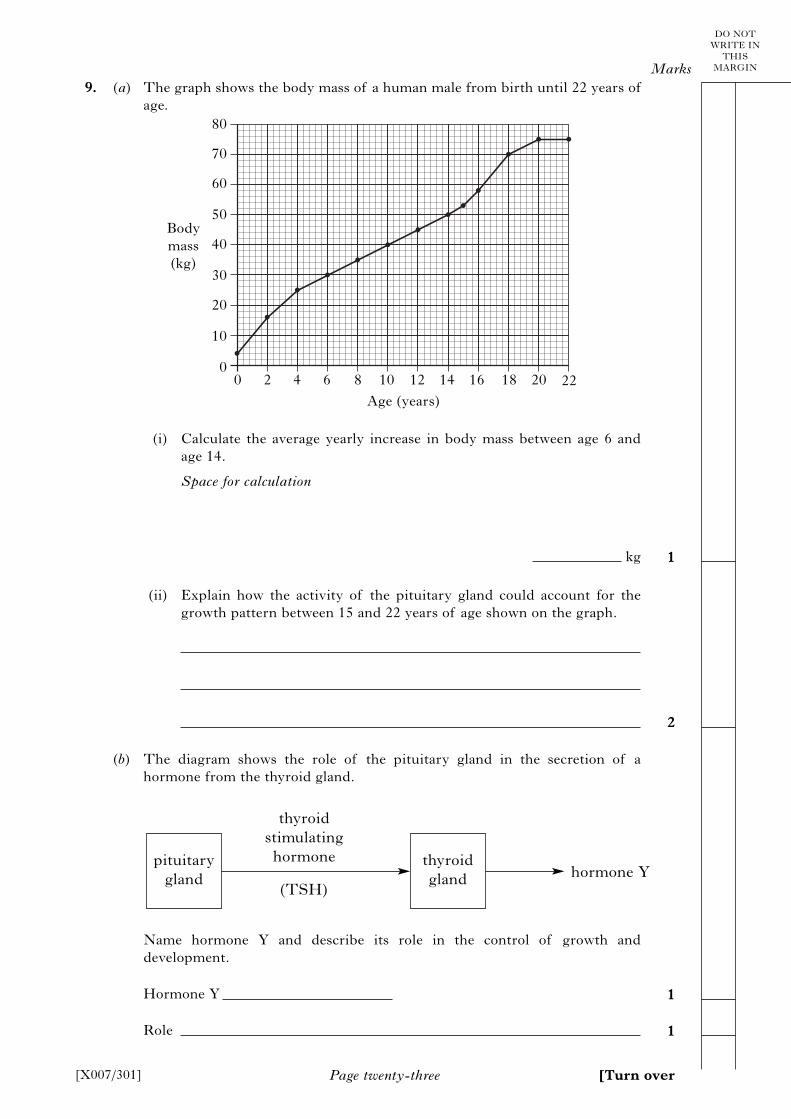
9. (a) The graph shows the body mass of a human male from birth until 22 years of
age.
(i) Calculate the average yearly increase in body mass between age 6 and
age 14.
Space for calculation
kg
(ii) Explain how the activity of the pituitary gland could account for the
growth pattern between 15 and 22 years of age shown on the graph.
(b) The diagram shows the role of the pituitary gland in the secretion of a
hormone from the thyroid gland.
Name hormone Y and describe its role in the control of growth and
development.
Hormone Y
Role
[X007/301] [Turn over
DO NOT
WRITE IN
THIS
MARGINMarks
1
2
1
1
80
70
60
50
40
30
20
10
00 2 4 6 8 10 12 14 16 18 20 22
Age (years)
Body
mass
(kg)
thyroid
stimulating
hormone
(TSH)
hormone Ypituitary
gland
thyroid
gland
Page twenty-four
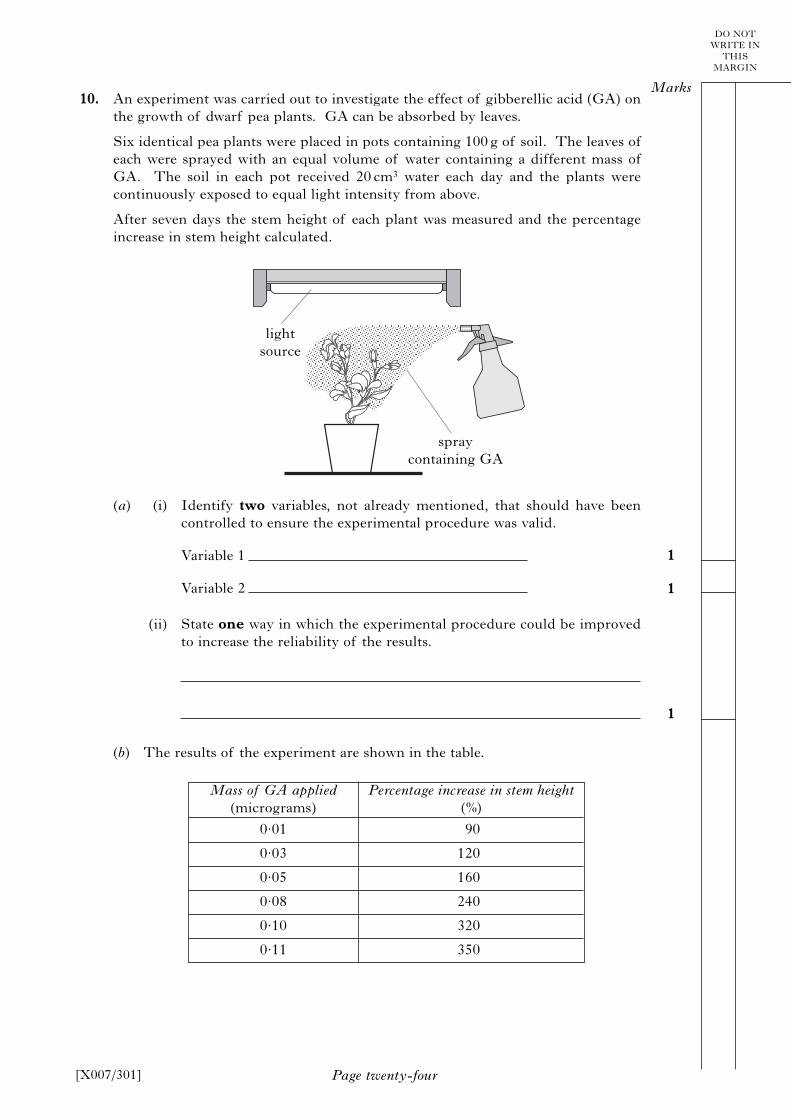
10. An experiment was carried out to investigate the effect of gibberellic acid (GA) on
the growth of dwarf pea plants. GA can be absorbed by leaves.
Six identical pea plants were placed in pots containing 100 g of soil. The leaves of
each were sprayed with an equal volume of water containing a different mass of
GA. The soil in each pot received 20 cm3 water each day and the plants were
continuously exposed to equal light intensity from above.
After seven days the stem height of each plant was measured and the percentage
increase in stem height calculated.
(a) (i) Identify two variables, not already mentioned, that should have been
controlled to ensure the experimental procedure was valid.
Variable 1
Variable 2
(ii) State one way in which the experimental procedure could be improved
to increase the reliability of the results.
(b) The results of the experiment are shown in the table.
DO NOT
WRITE IN
THIS
MARGIN
Marks
1
1
1
[X007/301]
light
source
spray
containing GA
Mass of GA applied(micrograms)
0.01 90
120
160
240
320
350
0.03
0.05
0.08
0.10
0.11
Percentage increase in stem height(%)
Page twenty-five
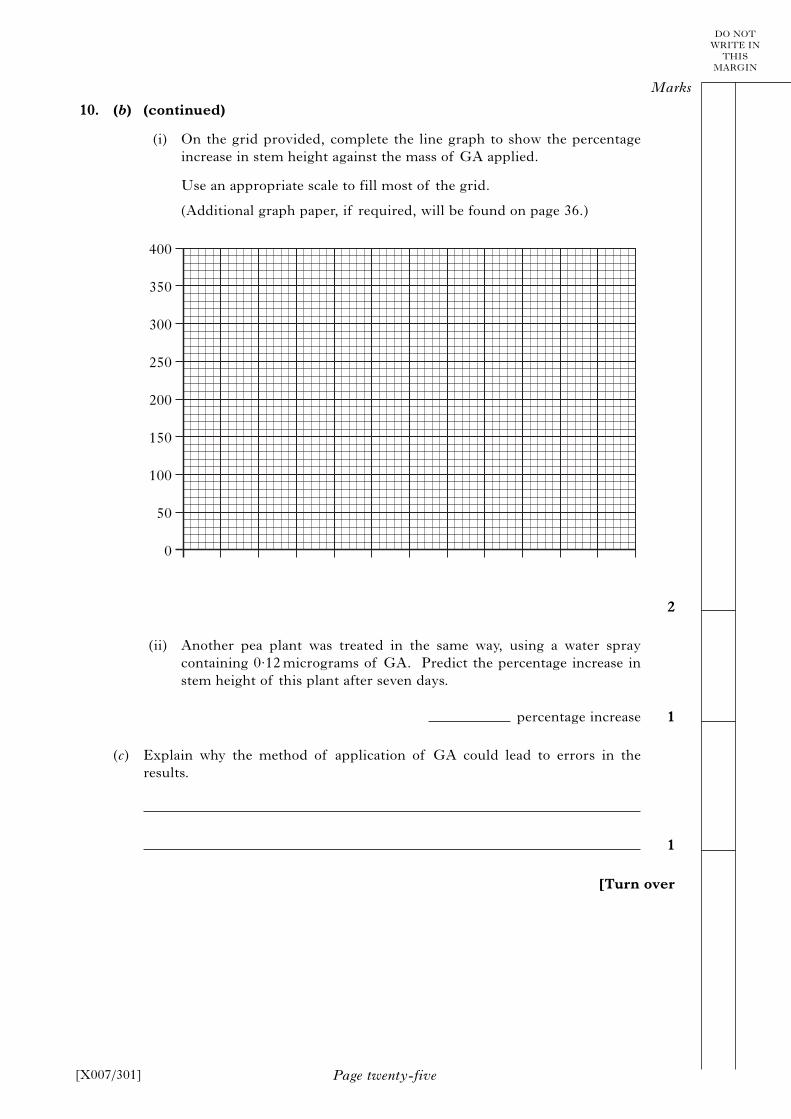
10. (b) (continued)
(i) On the grid provided, complete the line graph to show the percentage
increase in stem height against the mass of GA applied.
Use an appropriate scale to fill most of the grid.
(Additional graph paper, if required, will be found on page 36.)
(ii) Another pea plant was treated in the same way, using a water spray
containing 0.12 micrograms of GA. Predict the percentage increase in
stem height of this plant after seven days.
percentage increase
(c) Explain why the method of application of GA could lead to errors in the
results.
DO NOT
WRITE IN
THIS
MARGIN
Marks
2
1
1
[X007/301]
[Turn over
400
350
300
250
200
150
100
50
0

Page twenty-six
11. (a) The bacterium Escherichia coli can control its lactose metabolism.
Complete all boxes in the table to show whether each statement is true (T) or
false (F) if lactose is present or absent in the medium in which E. coli is
growing.
(b) Part of a metabolic pathway involving the amino acid phenylalanine is shown
in the diagram.
Phenylketonuria (PKU) is an inherited condition in which enzyme A is either
absent or does not function.
(i) Predict the effect on the concentrations of phenylalanine and tyrosine if
enzyme A is absent.
Phenylalanine
Tyrosine
(ii) PKU is caused by a mutation of the gene that codes for enzyme A.
Explain how a mutation of a gene can cause the production of an altered
enzyme.
DO NOT
WRITE IN
THIS
MARGIN
Marks
2
1
1
2
[X007/301]
Statement
Regulator gene produces the
repressor molecule
Repressor molecule binds to
inducer
Repressor molecule binds to
operator
Structural gene switched on
Lactose present
T F
Lactose absent
digestion ofprotein in diet
phenylalanine tyrosine other compounds
enzyme A enzyme B

12. An experiment was set up to investigate the effect of photoperiod on flowering in
Chrysanthemum plants. Four plants A, B, C and D were exposed to different
periods of light and dark in 24 hours. This was repeated every day for several
weeks and the effects on flowering noted.
The periods of light and dark and their effects on flowering are shown in the
diagram.
(a) From the information given, identify the conditions required for flowering in
Chrysanthemum plants. Justify your answer.
Conditions
Justification
(b) Flowering in response to photoperiod ensures plants within a population
flower at the same time. Explain how this enables genetic variation to be
maintained.
(c) Mammals also show photoperiodism.
Describe how one type of mammal behaviour can be affected by photoperiod.
Page twenty-seven
DO NOT
WRITE IN
THIS
MARGIN
Marks
1
1
1
[X007/301]
[Turn over
light dark
Plant A no flowering
Plant B flowering
Plant C no flowering
Plant D flowering
0 4 8 12 16 20 24
Periods of light and dark (hours)

Page twenty-eight
13. The homeostatic control of blood glucose concentration carried out by the human
liver is shown on the diagram.
(a) Name the storage carbohydrate found in the liver.
(b) (i) Name hormones X and Y.
Hormone X
Hormone Y
(ii) Name the organ that produces hormones X and Y.
(iii) Explain how negative feedback is involved in the homeostatic control of
blood glucose concentration.
DO NOT
WRITE IN
THIS
MARGIN
Marks
1
1
1
2
[X007/301]
hormone X
hormone Y
glucosestorage
carbohydrate
liver

Page twenty-nine
14. (a) The diagram shows some plant communities present at various time intervals
on farmland cleared of vegetation by a fire.
(i) State the term used to describe this sequence of plant communities.
(ii) Give a reason to explain why the shrub community is able to replace the
grass community after 15 years.
(iii) Oak forest is the climax community in this sequence.
Describe a feature of a climax community.
(b) The grid shows factors that can influence population change.
(i) Use all the letters from the grid to complete the table to show which
factors are density dependent and which are density independent.
(ii) Underline one alternative in each pair to make the sentences correct.
As population density the effect of density dependent
factors increases.
As a result, the population density then .
DO NOT
WRITE IN
THIS
MARGINMarks
1
1
1
2
1
[X007/301]
�����
'()������
�!����
'*(+,������
-����$���
+*(',,������
����"����
'*,(+,,������
-��� �������� ���
������" ���"���
food supply
competition predation rainfall
disease temperature
A B C
D E F
Density dependent Density independent
increases,
decreases,{ }increases
decreases{ }[Turn over for Section C on Page thirty

Page thirty[X007/301]
DO NOT
WRITE IN
THIS
MARGIN
SECTION C
Both questions in this section should be attempted.
Note that each question contains a choice.
Questions 1 and 2 should be attempted on the blank pages which follow.
Supplementary sheets, if required, may be obtained from the invigilator.
All answers must be written clearly and legibly in ink.
Labelled diagrams may be used where appropriate.
1. Answer either A or B.
A. Give an account of respiration under the following headings:
(i) glycolysis;
(ii) the Krebs (Citric acid) cycle.
OR
B. Give an account of cellular defence mechanisms in animals under the
following headings:
(i) phagocytosis;
(ii) antibody production and tissue rejection.
In question 2, ONE mark is available for coherence and ONE mark is availablefor relevance.
2. Answer either A or B.
A. Give an account of the problems of osmoregulation in freshwater bony fish
and outline their adaptations to overcome these problems.
OR
B. Give an account of obtaining food in animals by reference to co-operative
hunting, dominance hierarchy, and territorial behaviour.
[END OF QUESTION PAPER]
Marks
5
5(10)
4
6(10)
(10)
(10)
Page thirty-one
SPACE FOR ANSWERS
DO NOT
WRITE IN
THIS
MARGIN
[X007/301] [Turn over

Page thirty-two
SPACE FOR ANSWERS
DO NOT
WRITE IN
THIS
MARGIN
[X007/301]

Page thirty-three
SPACE FOR ANSWERS
DO NOT
WRITE IN
THIS
MARGIN
[X007/301] [Turn over
Page thirty-four
SPACE FOR ANSWERS
DO NOT
WRITE IN
THIS
MARGIN
[X007/301]

Page thirty-five
SPACE FOR ANSWERS
DO NOT
WRITE IN
THIS
MARGIN
[X007/301] [Turn over
Page thirty-six
SPACE FOR ANSWERS
ADDITIONAL GRAPH PAPER FOR QUESTION 10(b)
DO NOT
WRITE IN
THIS
MARGIN
[X007/301]
400
350
300
250
200
150
100
50
0