full network model expansion draft final proposal · california iso full network model expansion...
TRANSCRIPT

Full Network Model Expansion
Draft Final Proposal
December 30, 2013

California ISO Full Network Model Expansion Draft Final Proposal
CAISO/M&ID/DH 2 December 30, 2013
Table of Contents
1 Changes from 10/30/2013 second revised straw proposal ......................................................... 4
2 Executive summary ............................................................................................................................ 6
3 Introduction and purpose .................................................................................................................. 8
4 Plan for stakeholder engagement .................................................................................................. 11
5 Scope of initiative ............................................................................................................................. 12
6 Activity 1: model external balancing authority area generation, load, and transmission
facilities ...................................................................................................................................................... 14
6.1 Data for modeling the base schedules .................................................................................. 16
6.2 Methodology for modeling the base schedules ................................................................... 18
6.3 Impact of base schedules and separate treatment for COI ............................................... 20
6.4 Modeling imports and exports and Transaction IDs ........................................................... 23
7 Activity 2: enforce constraints for both scheduled and physical flow ....................................... 26
8 Activity 3: include variables in high voltage direct current transmission modeling ................. 28
9 Congestion revenue rights .............................................................................................................. 29
9.1 Loop flow modeling .................................................................................................................. 29
10 Examples ....................................................................................................................................... 30
10.1 Example 1: creating base schedules .................................................................................... 30
10.1.1 Establishing the base schedule ...................................................................................... 31
10.1.2 Import and export schedules .......................................................................................... 33
10.2 Example 2: enforcing scheduling and physical constraints on interties ........................... 34
10.3 Example 3: high voltage direct current model ...................................................................... 36
11 Pre-implementation analysis, benchmarking and data updates ........................................... 38
12 Next Steps ..................................................................................................................................... 39
Appendix 1: Phase 2 proposal ............................................................................................................... 40
13 Activity 1: scheduling point and hub definitions ....................................................................... 40
13.1 Modeling imports and exports and Transaction IDs ........................................................... 42
13.1.1 Modeling imports and exports at the BAA level ........................................................... 42
13.1.2 Modeling imports and exports at the scheduling hub level ........................................ 43
13.1.3 Transaction IDs ................................................................................................................. 44

California ISO Full Network Model Expansion Draft Final Proposal
CAISO/M&ID/DH 3 December 30, 2013
13.2 Scheduling hub definitions under Phase 2 implementation ............................................... 44
13.2.1 Scheduling hub and footprint definitions ....................................................................... 45
13.2.2 North and South scheduling hub definitions................................................................. 47
13.2.3 Scheduling hub considerations ...................................................................................... 49
13.2.4 IBAA specific modifications under Phase 2 implementation ..................................... 50
13.3 Modeling of CRRs at new scheduling hubs ......................................................................... 50
13.4 Examples ................................................................................................................................... 53
13.4.1 Example 1: imports (exports) as incremental (decremental) to the base schedules
53
13.4.2 Superimposing import and export schedules on the base generation schedules .. 55
13.5 Example 2: enforcing scheduling and physical constraints on interties ........................... 57
13.6 Example 2a: congestion on the interties ............................................................................... 60
13.7 Example 3: high voltage direct current model ...................................................................... 61
Appendix 2: WECC unscheduled flow transfer distribution factor matrix ........................................ 64
Appendix 3: detailed calculation of hub price ...................................................................................... 67

California ISO Full Network Model Expansion Draft Final Proposal
CAISO/M&ID/DH 4 December 30, 2013
1 Changes from 10/30/2013 second revised straw proposal
This is the draft final proposal in this initiative.1 Significant changes were made in the third
revised straw proposal and are summarized here. Based on stakeholder feedback, the full
proposal will be addressed and implemented in phases. This will allow the ISO to gain
experience with the proposed improvements incrementally, analyze and learn from data
collected, and propose refinements when appropriate. The ISO envisions two major phases
with elements of the full proposal included in Phase 1 to be presented to the ISO Board of
Governors at the February 2014 meeting with the intent of filing with the Federal Energy
Regulatory Commission (FERC) for implementation in Fall 2014. The remaining elements will
be included in Phase 2 which will continue in the stakeholder process and presented to the
Board at a later time. There may be additional phases as not yet identified at this time. The
table below summarizes the elements envisioned for each phase and the approximate timing for
major milestones.
Phase Elements of proposal Timing for milestones
Phase 1 1. Expansion of the full network model topology 2. Modeling of base schedules - fully modeling
September 8th entities and BAAs such as BPA to
support modeling of the EIM entities 3. Introduction of Transaction IDs 4. Enforce constraints for both scheduled and
physical flow 5. Incorporating base schedules into CRR model for
consistency 6. Import and export bids will continue to be
submitted, modeled, and priced at the current scheduling points at the interties (except for EIM entities)
7. Improvements to the HVDC modeling
Elements will be presented to Board of Governors in February 2014 and submitted to FERC as tariff amendment for Fall 2014 implementation.
Phase 2 1. Allow for the modeling of physical sources and sinks in the WECC for ISO market transactions through the creation of scheduling hubs
2. Consideration of additional tagging or settlement rules associated with scheduling at hubs
3. Remapping CRRs to scheduling hubs for consistency
4. Modeling of additional BAAs
Stakeholder process will restart after experience under Phase 1 implementation.
Future phases (TBD)
1. Modeling of additional BAAs TBD
1 The revised straw and straw proposals can be accessed at:
http://www.caiso.com/Documents/StrawProposal-FullNetworkModelExpansion.pdf and the issue paper was provided as a presentation at the April 10, 2013 Market Performance and Planning Forum (starting page 40) and can be accessed at: http://www.caiso.com/Documents/Agenda-Presentation-MarketPerformance-PlanningForumApr10_2013.pdf.

California ISO Full Network Model Expansion Draft Final Proposal
CAISO/M&ID/DH 5 December 30, 2013
Overall, stakeholders are supportive of the objectives of this initiative which is to increase
reliability and market efficiency by expanding the full network model. In order to achieve these
objectives in the necessary timeframe, the most critical elements of the proposal were selected
for inclusion in Phase 1. In order to address stakeholder comments, the remaining elements
were moved to Phase 2 for further discussion. The elements in Phase 2 would further improve
the ISO’s modeling and market efficiency.
First, phasing the proposal addresses numerous stakeholder concerns that the original proposal
was too expansive and that there was insufficient time to review and vet all the details. While
the ISO has kept critical elements in Phase 1, Phase 2 elements will be addressed in a
subsequent stakeholder process so that there is additional time for discussion. Moreover,
Phase 1 performance can be reported back to stakeholders to inform the Phase 2 discussion.
Second, stakeholders voiced concern over implementing scheduling hubs for intertie
transactions because this would be a major modeling change and affect congestion revenue
rights (CRRs). The ISO now proposes to address this in Phase 2 so that the ISO can collect
data from the Phase 1 implementation and create an analysis to compare the difference
between the current use of scheduling points at the interties and the proposed scheduling hubs.
Currently, there are also three major scheduling hubs proposed and this may also be refined
based on observations or analysis from Phase 1. Importantly, the Phase 1 elements need to be
implemented in order to create many of the analyses that stakeholders have requested.
Third, stakeholders objected to the proposed tagging rule that would accompany the
implementation of scheduling hubs. Since the scheduling hub approach has moved to Phase 2,
the ISO can work with stakeholders to develop an appropriate tagging or settlement rule.
Stakeholders have suggested various alternatives and these can now be discussed in the
continuing stakeholder process and perhaps be informed by data collected from Phase 1.
Fourth, stakeholders have asked that the implementation for the full proposal be delayed. The
ISO believes that with the phased approach, Phase 1 can move towards Fall 2014
implementation while Phase 2’s timing can be decided later. There has been, even before the
September 8th, 2011 event, a desire to expand the ISO’s full network model. The September 8th
event provided both the urgency to accomplish this as well as an opportunity as this
engendered greater cooperation from various parties throughout the WECC. However, the
importance of the Fall 2014 implementation date is related to the Energy Imbalance Market
(EIM) implementation. Though the impetus to expand the full network model did not come from
EIM implementation, it has become clear to the ISO over the last several months that accurate
modeling of the EIM Entities will also depend on modeling systems in which they are
embedded, for which they are transmission-dependent, or with which they are highly
interconnected. In addition, it will be important to include base flows in the ISO day-ahead
market so the market can incorporate flows resulting from EIM Entity base schedules submitted
in the day-ahead timeframe. Delaying Phase 1 elements may also delay EIM implementation.
We discuss this in Section 5.

California ISO Full Network Model Expansion Draft Final Proposal
CAISO/M&ID/DH 6 December 30, 2013
Lastly, stakeholders have requested an analysis showing that the Phase 1 elements would be
an improvement over today’s modeling. The ISO commits to conduct such an analysis before
implementation but would not be able to do so until we receive the software code around the
market simulation timeframe. We discuss this in Section 11.
All Phase 1 elements are in the body of this proposal whereas Phase 2 elements have been
moved to the appendix. The summaries below highlight the major changes or clarifications
between this and the third revised straw proposal.
Section 6.1 – The ISO provides additional clarification on the treatment of demand forecasts
and the net scheduled interchange data. The ISO also provides a link to the WECC Reliability
Coordinator’s data request for hourly demand forecasts.
Section 6.3 – The ISO corrected a link to the WECC Unscheduled Flow Mitigation Procedure.
Section 11 – The ISO provides details on a pre-implementation analysis with a potential for a
more robust analysis.
2 Executive summary
On September 8, 2011, a system disturbance in Arizona caused cascading outages and
blackouts through Arizona, Southern California, and the Baja peninsula portion of Mexico.
Given the severity and rapid propagation of the outages, the Federal Energy Regulatory
Commission and the North American Electric Reliability Corporation conducted an inquiry to
determine the causes of the outages and develop recommendations to prevent such events in
the future. Two of the major recommendations from this inquiry included the need for greater
visibility and modeling of external networks in the day-ahead timeframe leading to reliable real-
time operation. Pursuant to these recommendations, this stakeholder process seeks to
enhance the ISO’s modeling of electrical flows throughout the Western Interconnection by
expanding the Full Network Model to reflect both the ISO and its neighboring balancing authority
areas. The external visibility provided by the expansion will improve market efficiency and
reliability when the ISO uses its market processes to dispatch and schedule resources on the
ISO-controlled grid.
These improvements include a reduction in unscheduled loop flow on the ISO system.
Unscheduled loop flows occur because the rest of the Western Electricity Coordinating Council
relies on contract path scheduling, which assumes that electricity flows along a designated
point-to-point path, when in fact electricity flows over the path of least resistance. These flows
are currently not captured in the ISO’s Full Network Model, resulting in day-ahead modeled
flows that do not match real-time conditions and can lead to infeasible schedules that need to
be managed in the real-time. In addition, the current market model does not take into account
the actual flow resulting from intertie dispatches in the real-time market – leading to inefficient

California ISO Full Network Model Expansion Draft Final Proposal
CAISO/M&ID/DH 7 December 30, 2013
pricing. Therefore, this stakeholder process seeks to better align modeled and actual flows by
accounting for loop flows in the day-ahead timeframe and by more accurately modeling the
flows resulting from intertie dispatches in the real-time market. Improved day-ahead modeling
should decrease real-time congestion imbalance offset costs and exceptional dispatches.
Pursuant to federal recommendations after the September 8th, 2011 southwest outage, the ISO
proposes to model external balancing authority areas in the WECC in phases. This first phase,
targeted for an implementation date of Fall 2014, largely consists of entities involved in the
September 8th event and entities that are highly integrated with the Energy Imbalance Market
entity. Additional balancing authorities to model can be identified in later phases. Both the day-
ahead and real-time modeling will be reflected at the balancing authority area level and include
the native demand and generation to both serve native demand and support any net scheduled
interchange. Exchanges between balancing authority areas will also be modeled. The
collective modeling of these external balancing authority areas is to calculate a “base schedule”
that will provide to the ISO an indication of the loop flow we can expect from all external
transactions (i.e., transactions that do not involve the ISO). Incorporating base schedules will
result in feasible schedules for the real-time because the modeling will incorporate loop flows.
Moreover, calculating the loop flows in the day-ahead timeframe will provide the ISO with more
time to position the necessary resources to address expected real-time conditions. The
modeling framework will also be able to reflect the most recent information on outages, derates,
and contingencies.
Once we have the base schedules, we can then model cleared import and export bids with the
ISO. The current model uses the simplifying assumption that some of the interties have a radial
connection with the ISO and all of the sources and sinks of these imports and exports are
assumed to be located at the interties, even when there is no generation or load located there.
With full network model expansion, we can eliminate both of these simplifying assumptions by
expanding the network topology and mapping the import and export bids to sources or sinks
throughout the Western Electricity Coordinating Council. In previous papers, the ISO proposed
to address both assumptions simultaneously. Based on stakeholder feedback, we will phase
these two changes by incorporating the network topology expansion and base flow functionality
first and addressing modeling ISO market imports and exports back to physical sources and
sinks in a separate stakeholder process. For now, the ISO will continue to model imports and
exports and market participants will continue to bid at the current scheduling points at the
interties.
In Phase 2, the ISO the ISO will propose to schedule and price imports and exports at physical
points external to the ISO. In pricing import and export bids, the external WECC system will be
reflected via two major hubs, with some exceptions such as the Energy Imbalance Market
entities and the integrated balancing authority areas. These North and South hubs were
created to reflect the different flow impacts on Path 66 (or COI), a major WECC path under the
ISO’s control. While modeling is at the balancing authority area level, the hubs are
aggregations of the underlying balancing authority areas. Scheduling coordinators will be
allowed to schedule from either hub to any intertie, pursuant to obtaining the necessary
California ISO Full Network Model Expansion Draft Final Proposal
CAISO/M&ID/DH 8 December 30, 2013
transmission to support the schedule and adhering to settlement or tagging rules to be
developed.
The ISO will model the flow resulting from the base schedules and import and export bids
cleared in the ISO market to generate a congestion component of the locational marginal price
due to physical flow for each scheduling point under Phase 1. Under Phase 2, this will be
modeled to reflect each scheduling hub. This additional congestion component will be
incorporated into the locational marginal price for imports/exports in addition to the existing
congestion component that reflects congestion relative to an intertie’s contract path scheduling
limit. Thus, the price at an intertie will include two congestion components: (1) a new
congestion component that reflects congestion due to modeled physical flow, and (2) the
existing congestion component based on each intertie’s scheduling limit.
Lastly, this initiative proposes improvements to the ISO’s current modeling of high voltage direct
current transmission lines, which can be implemented in Phase 1.
3 Introduction and purpose
This stakeholder process is to enhance the ISO’s modeling of the electrical system (i.e., network
model) for operating the ISO controlled grid through its market process used for dispatching and
scheduling resources on the grid. These changes will improve the ISO’s modeling of electrical
flows throughout the Western Interconnection, which will result in improved reliability and market
solutions. More accurate modeling will allow the ISO to better reflect and more consistently
enforce constraints between the day-ahead and real-time markets. This should reduce the
incidences of infeasible schedules, including physical and virtual schedules, which result in real-
time congestion offset charges. Finally, more accurate modeling is a necessary compliment to
the EIM market design.
On September 8, 2011, a system disturbance in Arizona caused cascading outages and
blackouts through Arizona, Southern California, and the Baja peninsula portion of Mexico, which
affected the following five balancing authorities: ISO, Arizona Public Service Company (APS),
Imperial Irrigation District (IID), Western Area Power Administration-Lower Colorado (WALC),
and Comision Federal de Electricidad (CFE).2 The outages resulted in the loss of more than
7,000 MW of firm load.3 In the ISO, all of the San Diego area lost power. ISO markets were
temporarily suspended and prices were set administratively. Markets were not fully restored to
normal operations until about 12 hours later.4
2 Federal Energy Regulatory Commission and the North American Electric Reliability Corporation,
Arizona-Southern California Outages on September 8, 2011: Causes and Recommendations, April 2012. Available at: http://www.ferc.gov/legal/staff-reports/04-27-2012-ferc-nerc-report.pdf 3 Department of Market Monitoring, California ISO: Q3 Report on Market Issues and Performance,
November 8, 2011, page 4. 4 The disturbance occurred at about 3:27 p.m., leading to power outages at 3:38 p.m., and the ISO
market was fully restored at 4:00 a.m.

California ISO Full Network Model Expansion Draft Final Proposal
CAISO/M&ID/DH 9 December 30, 2013
Given the severity and rapid propagation of the outages, the Federal Energy Regulatory
Commission (FERC) and the North American Electric Reliability Corporation (NERC) conducted
an inquiry to determine the causes of the outages and develop recommendations to prevent
such events in the future. Following review of data, on-site visits at entities involved in the
outages, and interviews and depositions, FERC and NERC issued a joint staff report in April
2012 that found that certain aspects of systems within the Western Interconnection were not
operated in a secure state. The joint report offered 27 findings and recommendations for
improvement. The findings and recommendations apply to various aspects of the operation of
the Western Interconnection.
Two of these findings and recommendations in the joint report are the subject of this
stakeholder process. The ISO is considering them together because both address the need for
greater visibility and modeling of external networks leading to reliable real-time operation. The
findings are: Finding 2 – Lack of Updated External Networks in Next-Day Study Models and
Finding 11 – Lack of Real-Time External Visibility: Affected TOPs have limited real-time visibility
outside their systems, typically monitoring only one external bus. The two findings and
recommendations are set forth in their entirety in Table 1.
Table 1
FERC/NERC Joint Staff Report Findings and Recommendations
September 8th Event
Finding 2 – Lack of Updated External Networks in Next-Day Study Models: When conducting next-day studies, some affected TOPs use models for external networks that are not updated to reflect next-day operating conditions external to their systems, such as generation schedules and transmission outages. As a result, these TOPs’ next-day studies do not adequately predict the impact of external contingencies on their systems or internal contingencies on external systems.
Recommendation 2: TOPs and BAs should ensure that their next-day studies are updated to reflect next-day operating conditions external to their systems, such as generation and transmission outages and scheduled interchanges, which can significantly impact the operation of their systems. TOPs and BAs should take the necessary steps, such as executing nondisclosure agreements, to allow the free exchange of next-day operations data between operating entities. Also, RCs should review the procedures in the region for coordinating next-day studies, ensure adequate data exchange among BAs and TOPs, and facilitate the next-day studies of BAs and TOPs.
Finding 11 – Lack of Real-Time External Visibility: Affected TOPs have limited real-time visibility outside their systems, typically monitoring only one external bus. As a result, they lack adequate situational awareness of external contingencies that could impact their systems. They also may not fully understand how internal contingencies could affect SOLs in their neighbors’ systems.
Recommendation 11: TOPs should engage in more real-time data sharing to increase their visibility and situational awareness of external contingencies that could impact the reliability of their systems. They should obtain sufficient data to monitor significant external facilities in real time, especially those that are known to have a direct bearing on the reliability of their system, and properly assess the impact of internal contingencies on the SOLs of other TOPs. In addition, TOPs should review their real-time monitoring tools, such as State Estimator and RTCA, to ensure that such tools represent critical facilities needed for the reliable operation of the BPS.

California ISO Full Network Model Expansion Draft Final Proposal
CAISO/M&ID/DH 10 December 30, 2013
Source: Federal Energy Regulatory Commission and the North American Electric Reliability Corporation, Arizona-Southern
California Outages on September 8, 2011: Causes and Recommendations, April 2012. Available at: http://www.ferc.gov/legal/staff-
reports/04-27-2012-ferc-nerc-report.pdf
BA = Balancing Authority
BPS = Bulk Power System
RC = Reliability Coordinator
RTCA = Real-Time Contingency Analysis
TOP = Transmission Operators
SOL = System Operating Limit
In Finding 2, the joint staff report determined there was a failure to effectively share and
coordinate next-day studies within the Western Interconnection. Although the Western WECC
reliability coordinator receives some next-day study data, the joint staff report found that there
was a need for greater sharing of such data among transmission operators and balancing
authorities.
In Finding 11, the joint staff report found that entities lacked sufficient real-time situational
awareness of their neighbors. While many transmission operators had the appropriate tools for
internal analysis, the joint staff report found that improvements should be made to deal with
external contingencies.
The modeling improvements resulting from this stakeholder initiative will also improve the
reliability of the ISO grid and market solution accuracy. For the ISO, ensuring reliability and
operating efficient markets are inter-dependent. For example, the ISO uses the market to
reliably manage congestion on its transmission system and in turn account for transfers and
uses of the grid so that we can achieve a reliable and efficient market dispatch. Resources on
the ISO grid are dispatched and scheduled through the ISO markets. Only in exceptional
circumstances does the ISO dispatch resources outside of its market processes. Therefore, the
feasibility and accuracy of the market solution is an important element in the ISO’s ability to
operate the system reliably. To do this, it is essential we increase the accuracy of our day-
ahead and real-time market solutions. As the September 8th event demonstrated, events
outside of the ISO can significantly impact the reliability of the ISO grid and market operations.
Therefore, the ISO’s efforts to improve reliability and market operations encompass improved
modeling of our surrounding balancing authority areas and incorporating that information in the
market models. This aligns with Finding 2 and Finding 11, and related recommendations, in the
joint staff report.
While this initiative seeks to improve modeling of areas external to the ISO, we will in the first
instance rely on data that exists with the WECC reliability coordinator. To the extent
neighboring entities wish to share more information, we look forward to and appreciate further
cooperation.

California ISO Full Network Model Expansion Draft Final Proposal
CAISO/M&ID/DH 11 December 30, 2013
4 Plan for stakeholder engagement
The proposed schedule for stakeholder engagement is provided below. In April, we brought our
initial ideas to the ISO’s Market Performance and Planning Forum.5 Typically we publish an
issue paper to discuss the scope of the stakeholder process but since the recommendations in
the FERC/NERC joint staff report are clear, the ISO directly published a straw proposal after
that presentation. ISO management plans to presents its draft final proposal in this initiative to
the Board of Governors at its February meeting for elements of the proposal included in Phase
1. The tariff development process will follow the Board meeting leading to a FERC filing for
implementing the Phase 1 elements in Fall 2014. Elements not brought forth to the February
meeting will be discussed in a subsequent stakeholder process
5 See: http://www.caiso.com/Documents/Agenda-Presentation-MarketPerformance-
PlanningForumApr10_2013.pdf

California ISO Full Network Model Expansion Draft Final Proposal
CAISO/M&ID/DH 12 December 30, 2013
Date Event
Wed 4/10/13 Presentation at Market Performance and Planning Forum
Tue 6/11/13 Straw proposal posted
Tue 6/18/13 Stakeholder call
Tue 6/25/13 Stakeholder comments due
Wed 9/11/13 Revised straw proposal posted
Wed 9/18/13 Stakeholder in-person meeting
Wed 9/25/13 Stakeholder comments due on revised straw proposal
Wed 10/30/13 Second revised straw proposal posted
Mon 11/4/13 Stakeholder call
Wed 11/13/13 Stakeholder comments due on second revised straw proposal
Thu 12/5/13 Third revised straw proposal posted
Tue 12/10/13 Stakeholder call
Thu 12/19/13 Stakeholder comments due on third revised straw proposal
Mon 12/30/13 Draft final proposal posted
Tue 1/7/14 Stakeholder call
Tue 1/14/14 Stakeholder comments due on draft final proposal
Thu-Fri 2/6-2/7 February Board of Governors meeting for Phase 1
5 Scope of initiative
Given the recommendations in the FERC and NERC joint staff report, the ISO’s ultimate goal in
this stakeholder initiative is to improve reliability and market solution accuracy. The ISO can
achieve this by accurately modeling day-ahead and real-time conditions inside and outside of
the ISO to minimize the impact of loop flows. Loop flows can be particularly challenging to
manage if they create a significant divergence from day-ahead schedules. Within the WECC,
loop flows occur naturally because of the difference between scheduled flows over contract
paths and the resultant physical flows that abide by Kirchhoff's circuit laws. However, loop flows
can be countered through heightened situational awareness from accurate day-ahead and real-
time market solutions. For the ISO, increased awareness and improved modeling can help us
decrease the use of exceptional dispatch to manage real-time flows. Improved modeling should
also tend to reduce real-time congestion offset charges. This is accomplished by reducing the
amount of schedules awarded in the day-ahead market that are infeasible in real-time because
of loop flows. These infeasible schedules, including physical schedules and virtual schedules,
result in real-time congestion offset because generation on either side of the constraint causing
the infeasibility has to be dispatched up in the real-time market at a relatively higher price and
dispatched down at a relatively lower price.
To meet our goal and effectuate the recommendations by the joint staff report, the ISO will
enhance its full network model (FNM). The FNM is the logical point of change because it

California ISO Full Network Model Expansion Draft Final Proposal
CAISO/M&ID/DH 13 December 30, 2013
provides a detailed and accurate representation of the power system for operational purposes.
It contains both physical and commercial data for the reliable and efficient operation of our day-
ahead market (including the integrated forward market and residual unit commitment process),
the real-time market, and the congestion revenue rights auction and allocation process. The
FNM includes:6
ISO physical transmission system reflecting planned outages for each market;
ISO generation and pumped storage resources reflecting planned outages for
each market;
ISO loads;
Balancing authority areas embedded or adjacent to ISO;
Resources external to ISO;
Resources using dynamic schedules or pseudo-ties;
Groupings of generation or loads to reflect commercial arrangements; and
Aggregation of generation or load pricing nodes for bidding and settlement
purposes.
Table 2 below lists four major objectives of this stakeholder process and the activities to support
them. The objectives and activities seek to address reliability concerns while still respecting
each balancing authorities’ current operations and processes.
Table 2
Objectives and Activities for Full Network Model Expansion
Objectives Activities to support objectives
Accurate loop flow modeling
Enhanced security analysis
Better analysis and outage coordination
Accurate high voltage direct current modeling
1. Model external balancing authority area generation, load, and transmission facilities (Phase 1), and scheduling point and hub definitions (Phase 2)
2. Enforce constraints for both scheduled and physical flow (Phase 1)
3. Include variables in high voltage direct current transmission modeling (Phase 1)
Expansion of the FNM will take place in phases, conditioned on the availability of data such as
telemetry and outage information, time and resources, and priority. Phase 1 is targeted for
implementation by Fall 2014 and includes modeling of: i) the external balancing authority areas
involved in the September 8th event; ii) the entities that have signed an EIM agreement to
participate in the energy imbalance market when it goes live on October 1, 2014 (PacifiCorp
East and PacifiCorp West); and iii) an additional balancing authority area that is highly
6 See the Full Network Model Business Practice Manual at:
http://bpmcm.caiso.com/Pages/BPMDetails.aspx?BPM=Managing%20Full%20Network%20Model
California ISO Full Network Model Expansion Draft Final Proposal
CAISO/M&ID/DH 14 December 30, 2013
integrated with the EIM entity, Bonneville Power Authority (BPA). If time and data allows, we
would like to additionally model Idaho Power, which is integrated with the EIM entity, and Salt
River Project, which is integrated with the September 8th entities.7 The ISO has closely
cooperated with the September 8th entities and the EIM entities in data exchanges. This
proposal will help the ISO to use this data to accurately account for loop flows and get
reasonably accurate state estimator solutions for these areas. The ISO’s ultimate goal is to
improve the modeling of the entire WECC in later phases. The exact timing and scope of these
later phases has not been decided. Selection of additional areas to model may be driven by
where unscheduled flows are more significant.
The FNM expansion project is being undertaken to enhance the ISO’s modeling of its system.
The FNM expansion could be implemented independent of the Energy Imbalance Market
(EIM).8 If the ISO did not create an EIM, it would still pursue this initiative. Also, the policy
decisions under each initiative can be considered separately – one for creating an EIM
framework and another for addressing ISO’s reliability and market efficiency needs. However,
improvements provided by the FNM expansion are necessary for reliable modeling of the EIM
entities. The FNM expansion will provide improved power flow solutions with greater awareness
of external impacts on the combined ISO and EIM entity footprints. This is especially the case
for PacifiCorp West, which relies on BPA’s transmission system. Therefore, it is critical that
Phase 1 of the FNM expansion is implemented in Fall 2014, at the same time as the EIM. Over
the last several months, the ISO has worked closely with the EIM Entities to refine and prioritize
our modeling needs and we may find that additional BAAs will need to be included.9 From a
process point of view, simultaneously implementing these two initiatives can also provide
efficiency gains as they will require changes to similar systems, software, processes, and
business practices.
6 Activity 1: model external balancing authority area generation,
load, and transmission facilities
To accurately model the loop flow from other balancing authority areas (BAAs), the ISO must
first expand the FNM by modeling these BAAs in the day-ahead and real-time markets. Figure
1 below shows the approximate difference between the current and expanded FNM.
7 Additional high voltage transmission facilities may need to be added to the market FNM in other
neighboring BAAs, to maintain accuracy of power flow calculations, although such areas would not be modeled at the same detail in the initial phase. For example, Nevada has interties with the following: (1) BAAs in Arizona that were affected by the September 8
th outage; (2) PacifiCorp; (3) BPA; (4) Idaho
Power; and (5) the ISO. 8 http://www.caiso.com/informed/Pages/StakeholderProcesses/EnergyImbalanceMarket.aspx
9 As we have stated in Section 11, the ISO will provide a technical bulletin or similar announcement of the
final list of BAAs modeled in the expanded FNM.
California ISO Full Network Model Expansion Draft Final Proposal
CAISO/M&ID/DH 15 December 30, 2013
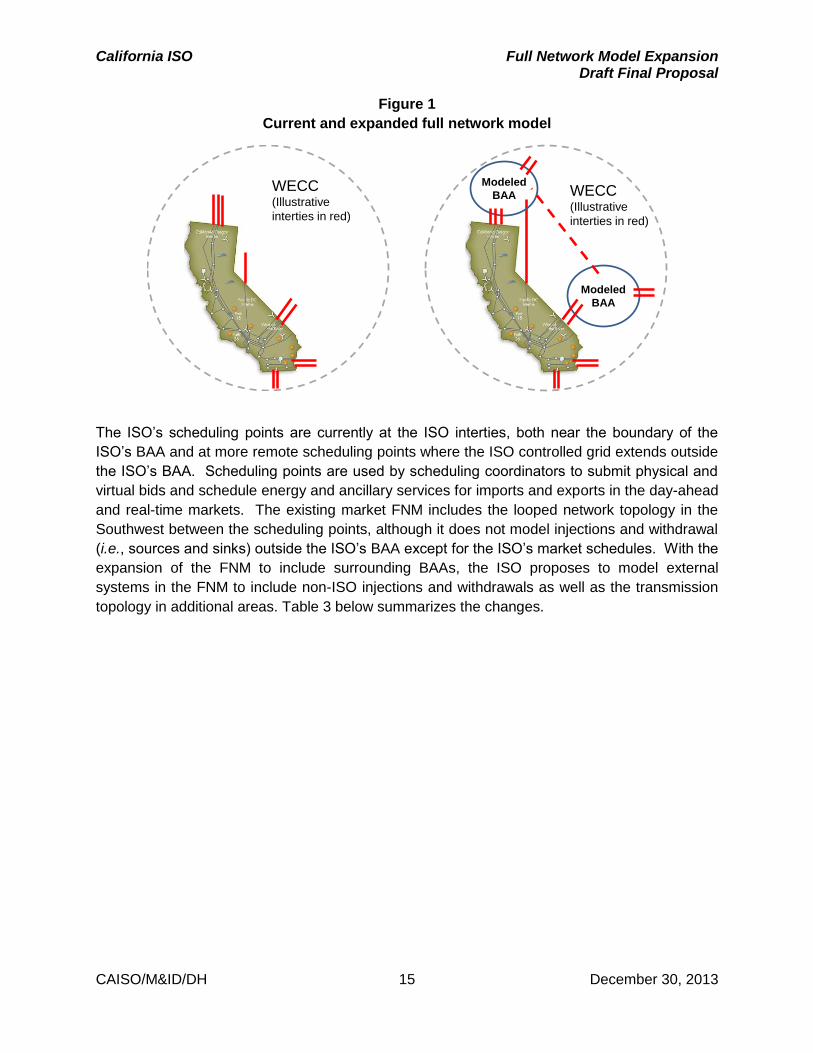
Figure 1
Current and expanded full network model
The ISO’s scheduling points are currently at the ISO interties, both near the boundary of the
ISO’s BAA and at more remote scheduling points where the ISO controlled grid extends outside
the ISO’s BAA. Scheduling points are used by scheduling coordinators to submit physical and
virtual bids and schedule energy and ancillary services for imports and exports in the day-ahead
and real-time markets. The existing market FNM includes the looped network topology in the
Southwest between the scheduling points, although it does not model injections and withdrawal
(i.e., sources and sinks) outside the ISO’s BAA except for the ISO’s market schedules. With the
expansion of the FNM to include surrounding BAAs, the ISO proposes to model external
systems in the FNM to include non-ISO injections and withdrawals as well as the transmission
topology in additional areas. Table 3 below summarizes the changes.
WECC(Illustrative
interties in red)
WECC(Illustrative
interties in red)
Modeled
BAA
Modeled
BAA
California ISO Full Network Model Expansion Draft Final Proposal
CAISO/M&ID/DH 16 December 30, 2013
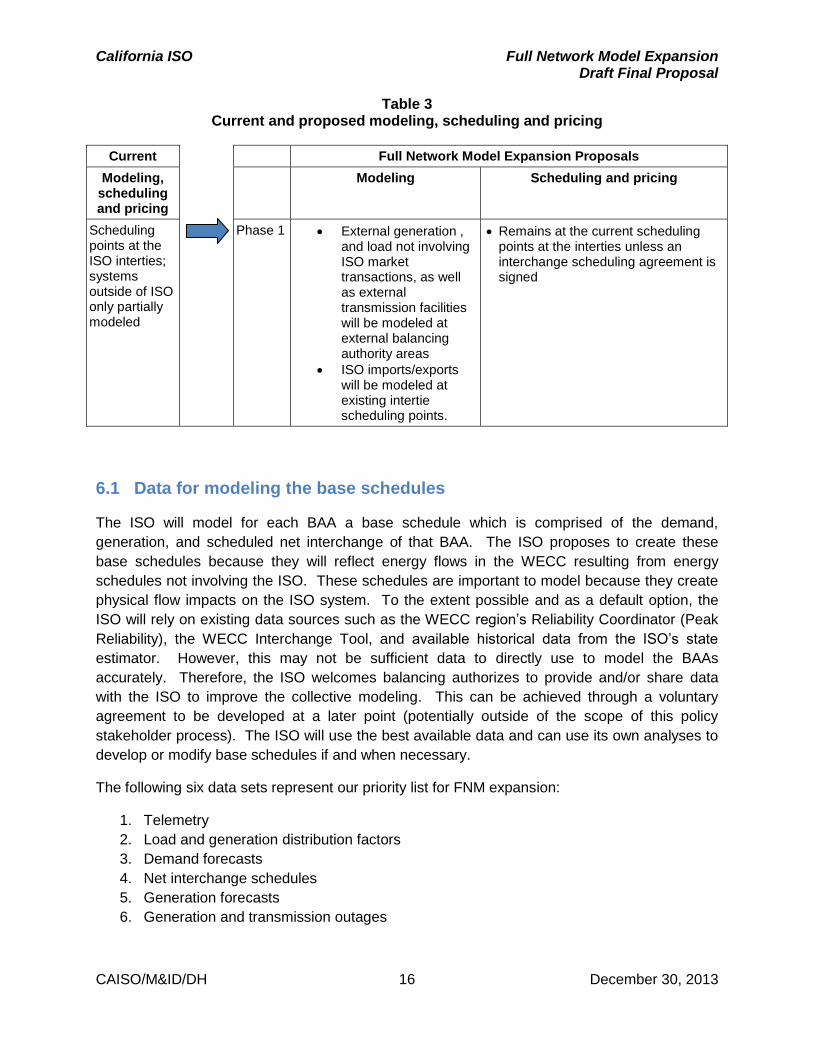
Table 3 Current and proposed modeling, scheduling and pricing
Current Full Network Model Expansion Proposals
Modeling, scheduling and pricing
Modeling
Scheduling and pricing
Scheduling points at the ISO interties; systems outside of ISO only partially modeled
Phase 1 External generation , and load not involving ISO market transactions, as well as external transmission facilities will be modeled at external balancing authority areas
ISO imports/exports will be modeled at existing intertie scheduling points.
Remains at the current scheduling points at the interties unless an interchange scheduling agreement is signed
6.1 Data for modeling the base schedules
The ISO will model for each BAA a base schedule which is comprised of the demand,
generation, and scheduled net interchange of that BAA. The ISO proposes to create these
base schedules because they will reflect energy flows in the WECC resulting from energy
schedules not involving the ISO. These schedules are important to model because they create
physical flow impacts on the ISO system. To the extent possible and as a default option, the
ISO will rely on existing data sources such as the WECC region’s Reliability Coordinator (Peak
Reliability), the WECC Interchange Tool, and available historical data from the ISO’s state
estimator. However, this may not be sufficient data to directly use to model the BAAs
accurately. Therefore, the ISO welcomes balancing authorizes to provide and/or share data
with the ISO to improve the collective modeling. This can be achieved through a voluntary
agreement to be developed at a later point (potentially outside of the scope of this policy
stakeholder process). The ISO will use the best available data and can use its own analyses to
develop or modify base schedules if and when necessary.
The following six data sets represent our priority list for FNM expansion:
1. Telemetry
2. Load and generation distribution factors
3. Demand forecasts
4. Net interchange schedules
5. Generation forecasts
6. Generation and transmission outages

California ISO Full Network Model Expansion Draft Final Proposal
CAISO/M&ID/DH 17 December 30, 2013
In the list above both telemetry and load and generation distribution factors will be based on the
ISO’s state estimator. For example, the default generation and load distribution factors will be
adapted from the state estimator solution and maintained in an electronic library for various
seasons, day types (e.g., workday, weekday/holiday), and day periods (e.g., on-peak, off-peak),
and normalized for known outages. Demand forecasts can be provided by the Reliability
Coordinator. In addition to daily updates, the Reliability Coordinator will also have demand
forecasts for the next several days for each BAA so there should consistently be data available
to pull by the ISO. Nonetheless the ISO will rely on its own analysis and validation, for example,
to true up or estimate missing information. In addition, compared to a historical analysis of
actual demand, the ISO can further fine tune the demand forecasts if needed by scaling the
forecast up or down. The net interchange schedules can be pulled via the WECC Interchange
Tool, which provides information by tie for each BAA. The ISO can use this data source as a
starting point and as we collect more information, we can compare the completeness of this
data at different reporting times. This can be accomplished via an historical statistical analysis
such as a regression technique to create the best available modeling input by scaling or
estimating the expected interchange levels. We discuss the difference in reporting times in
greater detail below. Since generation in a BAA must equal the sum of demand and net
schedule interchange, the generation can be derived from this simple equation.10 Lastly,
generation and transmission outages reported to the Reliability Coordinator or known to the ISO
can be included in the base schedule modeling. For all of the data points listed above, BAAs
can also directly provide the information to the ISO.
Another area that will require ISO estimation is the discrepancy between data submission
deadlines at the Reliability Coordinator at noon and the start of the ISO’s day-ahead market at
10 a.m. Since the Reliability Coordinator will not have a complete data set available by 10 a.m.,
the ISO will estimate schedules based on historical supply/demand schedules obtained from a
saved power flow solution with supply, demand, and any known or historical net interchange.
Once the data is obtained, the ISO can create base schedules for each BAA by distributing the
demand, net of tagged scheduled intertie transactions, to supply resources in each BAA using
generation distribution factors, normalized for known outages. Similarly, the ISO will derive
base schedules in the real-time market in a similar fashion for future intervals beyond the next
trading hour. However, by 3 p.m. when the ISO is ready to pull the data again in preparation for
the real-time market, the Reliability Coordinator will have data from all of the balancing
authorities based on its 10 a.m. deadline.11 Alternatively, the ISO can use more accurate
10
For example, if a BAA has 10,000 MW of native demand and 500 MW of net export, then its native generation must be 10,500 MW in order to meet demand and support the energy export. 11
The deadline for reporting to the Reliability Coordinator is 10 a.m. prevailing Pacific time. However, this data may not be available to the ISO in time to incorporate into the day-ahead market. To the extent it is, we may use it. If not, we can rely on the methodology described above. The reporting requirement is created by the WECC Reliability Coordinator pursuant to NERC Reliability Standard IRO-010-1a. See the data request from the WECC Reliability Coordinator available at: http://www.wecc.biz/awareness/Reliability/Documents/WECC%20RC%20Data%20Request%20Specification.pdf

California ISO Full Network Model Expansion Draft Final Proposal
CAISO/M&ID/DH 18 December 30, 2013
information for the current trading hour from the state estimator solution for these areas. If data
is provided directly from a BAA, that information can be used for both day-ahead and real-time.
While the ISO intends to leverage the data made available by the Reliability Coordinator, we will
also reserve the right to create, modify, or select amongst different data sources as appropriate.
Under the most drastic scenario, the base schedules can be “set” to zero, which would be
similar to our current FNM without base schedule modeling. To do this, we may adjust the net
schedule interchange up or down to better match the amount of unscheduled loop flow that
affects the ISO system. As described in the benchmarking analysis in Section 11, the ISO will
be tracking the difference between scheduled and actual flows to understand whether or not the
base schedules are effective. Based on these results, the ISO can calibrate the net scheduled
interchange. In a more extreme approach, all of the base schedule (demand, generation, and
net scheduled interchange) can be set to zero. This would occur in the most extreme scenario
because it would likely decrease the accuracy of the market solutions for the EIM entities.
Given these two options to “set” the base schedules, we believe this is a good starting point for
our proposal and the ISO can learn from the outcome of this modeling methodology. The ISO
will have the flexibility to further refine and adjust this methodology as we gain more experience
with the expanded FNM. As explained in Section 11, the ISO intends to test for the accuracy of
the base schedule modeling before implementation.
6.2 Methodology for modeling the base schedules
The ISO intends to model the networks and base schedules of all of the BAAs in the WECC so
that our modeling can reflect as much of the unscheduled loop flows as possible. However,
modeling the networks can be very data intensive and needs to be developed in phases with
sufficient time and resources. As noted in Section 5, Phase 1’s priority is the full modeling of
the September 8th entities and those BAAs needed for accurate modeling of the EIM entities.
To the extent time and resources allow, we can model additional BAAs. Either way, Phase 1
implementation will result in modeled and non-modeled BAAs. For external BAAs that are
modeled in the FNM, the ISO will define generation aggregation points comprised of the
generation distribution factors reflecting all supply resources in the respective BAAs. For load,
each modeled BAA will have defined a load aggregation point and, similar to generation, the
ISO can use historical load patterns to develop default load distribution factors to distribute the
demand forecast throughout the BAA.
For external BAAs that are not modeled in the FNM, the ISO will define a boundary point at the
FNM boundary at each intertie with these external BAAs. These boundary points, similar to the
existing scheduling points at the ISO interties, will be eventually replaced with the relevant
generation and load aggregation points after these external BAAs are included in the FNM.12
In the interim, these boundary points will be modeled as injections and withdrawals to a single
point.
12
If the FNM encompasses the entire WECC, there would be no need for these boundary points or the associated generic system resources.

California ISO Full Network Model Expansion Draft Final Proposal
CAISO/M&ID/DH 19 December 30, 2013
Figure 2 below shows a simplified example of FNM expansion. The ISO is shown in the lower
left and it is connected to two modeled balancing authority areas (BAA1 and BAA2). There is a
generation aggregation point composed of generators G1 and G2 for BAA1. Similarly, there is a
generation aggregation point composed of G3 and G4 for BAA2. A load aggregation point
composed of loads L1 and L2 is defined for BAA1, and a load aggregation point composed of L3
and L4 is defined for BAA2.
Under Phase 1, the demand forecast of each balancing authority area is distributed to the loads
in the respective load aggregation point using default load distribution factors. Consequently
BAA1’s load is allocated to L1 and L2 using load distribution factors the ISO developed for BAA1
and BAA2’s load is allocated to L3 and L4 using load distribution factors the ISO developed for
BAA2. The example also shows two system resources G5 and G6, where G5 is connected to the
FNM through an intertie with BAA1. These resources are used to model compensating
injections from/to external BAAs to represent BAAs that have not yet been modeled in the FNM.
These are FNM boundary points. The FNM boundary points will be used in the base schedule
modeling effort to model exchanges with non-modeled, non-ISO BAAs to reflect unscheduled
loop flows through the ISO.
In Section 10.1 we use this model as the foundation for numeric examples that step through
how base schedules are developed (to be implemented in Phase 1).
Figure 2
FNM Expansion Modeling Example
CAISO
BAA1
BAA2
G1 G2
L1 L2
G3 G4
L3 L4
T1
T3
T2
G5
BAA1 SP: G1, G2
BAA1 LAP: L1, L2
BAA2 SP: G3, G4
BAA2 LAP: L3, L4
System Resources: G5, G6
G6

California ISO Full Network Model Expansion Draft Final Proposal
CAISO/M&ID/DH 20 December 30, 2013
With these elements defined within the FNM, the ISO will be able to get a much more accurate
power flow solution based on day-ahead schedules and real-time dispatch starting with Phase
1.
6.3 Impact of base schedules and separate treatment for COI
Base schedules will be reflected as fixed schedules in the market optimization software under
both Phase 1 and 2 (but to be implemented with Phase 1). Some stakeholders have voiced a
concern that assuming all base schedules as fixed within the optimization “solves” other BAAs’
unscheduled flow problems. The central premise of the ISO’s proposal to model base flows, as
it relates to reducing real-time congestion uplift costs, is to protect the ISO market against
establishing schedules in the day-ahead market, and these schedules’ associated financial
entitlements, that exceed the transfer capability that is likely to be available in real-time. While
this entails accommodating other BAAs’ loop flow in the day-ahead market, the alternative is for
the ISO market to be left with the costs of re-dispatch to accommodate this unscheduled flow in
real-time. If real-time unscheduled flows are less than expected, the ISO will dispatch
generation up above the day-ahead market schedules and generate congestion rent surpluses
that will offset the days when it underestimates loop flows. It is also very important to note that
other BAAs are affected by the ISO’s unscheduled flows and will similarly need to redispatch
units to accommodate these flows in most instances.
Some stakeholders have also voiced a concern that assuming all base schedules as fixed within
the optimization is contrary to current WECC region practices for managing unscheduled flows.
This is incorrect. First, WECC’s agreement to provide relief for unscheduled flow stems from
WECC standard IRO-006-WECC-1, which allows for relief only on qualified transfer paths to the
extent that flows exceed or are anticipated to exceed limits.13 In all other instances, the WECC
procedure requires 100% accommodation of unscheduled flow. There are six qualified transfer
paths and the ISO is a path operator for only one, Path 66 (COI).14 The WECC standard does
not apply to ISO internal transmission constraints, which the FNM expansion proposal will
address and is likely contributing the most to the real-time congestion imbalance offset costs. In
the prescribed methods available to path operators to manage flows through WECC’s
procedure when scheduled and unscheduled flows exceed the transfer capability of a qualified
transfer path, curtailment of schedules is only one of the approved methods and only occurs
after the use of phase shifters and accommodating unscheduled flows has occurred up to a
certain percent.15 The current WECC procedures have been reaffirmed by the FERC in a
13
http://www.nerc.com/files/IRO-006-WECC-1.pdf 14
http://www.wecc.biz/committees/StandingCommittees/OC/UFAS/Shared%20Documents/USF%20Qualified%20Path%20Listing.pdf 15
http://www.wecc.biz/committees/standingcommittees/oc/ufas/shared%20documents/ufas%20mitigation%20plan.pdf; see Attachment 1.

California ISO Full Network Model Expansion Draft Final Proposal
CAISO/M&ID/DH 21 December 30, 2013
recent order on the subject.16 For other interties, the ISO is solely responsible for
accommodating schedule adjustments. As noted above, other BAAs are affected by the ISO’s
unscheduled flows and unless the flows are on one of the qualified paths, these BAAs also
provide 100% accommodation.
For COI only (and the Pacific AC Intertie (PACI), which is the major portion of COI that is within
the ISO’s market area), we can adjust our approach by not enforcing the proxy flow limit in the
day-ahead market. Instead, we will enforce the actual physical flow limits of COI’s underlying
system and the scheduling limit in the day-ahead market, which is what we do today. In other
words, this separate treatment will not change our existing practice with regard to steady state
limits and allows us to extend the current practice for paths where the ISO has sole
responsibility for flow management in the real-time to the day-ahead. This separate treatment
of COI is reinforced by the confluence of three factors: 1) enforcement of physical and
scheduling constraints in the FNM; 2) the availability of WECC’s unscheduled flow mitigation
procedure for COI; and 3) recognition that the proxy flow limits on COI do not accurately reflect
a physical limit.17 The separate treatment for COI addresses stakeholders’ comments regarding
adherence to WECC practices. As described in Section 7, one of the activities for the FNM
expansion initiative is to enforce both the scheduled and physical flow constraints. But as
noted above, ISO can take advantage of WECC’s unscheduled flow mitigation procedure for
COI in real-time so that would allow the ISO to not enforce the proxy flow limit in the day-ahead.
Instead, the ISO would only enforce the scheduling limit and the actual physical flow limits of
COI’s underlying system. If the proxy flow limit were enforced on COI in the day-ahead, it would
reduce all schedules in our market and basically function as 100% accommodation. On the
other hand, the separate treatment for COI will allow the ISO to use the WECC procedure by
accommodating up to the specified percentages, using phase shifters, and then curtailing ISO
market schedules as well as off-path schedules that contribute to COI flow but are outside of the
ISO market. There are established WECC rules for cost allocation of phase shifter use which
the ISO already participates in and we should not ignore the value they provide. For other
interties besides COI, we are responsible for 100% accommodation of loop flow in real-time,
and enforcing the flow limits in the day-ahead makes our day-ahead and real-time processes
more consistent.
WECC’s Path Operator Task Force recognizes that the flow capacities of the lines comprising
Path 66 itself are not the actual limit (being, in fact, much greater than the path limit) and instead
are essentially a proxy for the real transmission limits.18 Previously, the COI rating has been
16
See Federal Energy Regulatory Commission Docket No. EL13-11-000, “Order Denying Compliant,” issued February 1, 2013. 17
This proposal also continues the existing consistency between constraints enforced in the day-ahead and real-time markets. In real-time, the ISO manages its portion of physical flows on COI using nomograms on transmission within the ISO controlled grid, and monitors real-time flows across COI as part of the WECC unscheduled flow mitigation plan, which is a non-market mechanism, rather than using market dispatches to manage the COI path rating. The ISO uses the same nomograms near COI in the day-ahead and real-time markets, and will continue to do so. 18
See http://www.wecc.biz/committees/StandingCommittees/JGC/POTF/Documents/Forms/AllItems.aspx.
California ISO Full Network Model Expansion Draft Final Proposal
CAISO/M&ID/DH 22 December 30, 2013
used as a proxy limit that represented findings from off-line studies using assumed conditions.
With access now to more modern reliability assessment tools, the Path Operator Task Force
has observed that the result of enforcing the path rating as a flow limit, instead of modeling the
actual underlying constraints, has been both the reduction of schedules when no reliability
condition actually existed, and reliability risks at lower flow levels than the proxy limit. The
actual transmission constraints include limits within the ISO’s BAA, and have been represented
by nomograms with factors such as Northern California hydro output that are taken as fixed
inputs rather than being optimized against imports across COI and PACI. The modeling
improvements provided by the FNM expansion will now allow the underlying limits to be directly
modeled, thus eliminating the need for the proxy limit. This treatment for COI will also bring us
in line with how the BPA treats COI.19 BPA enforces several flow-based limits for scheduling
within its BAA, but does not enforce a flow limit on COI in the day-ahead timeframe. Instead,
BPA manages its side of COI using the scheduling limit, which the ISO will continue to use in
both day-ahead and real-time. Lastly, the Second Amended COI Path Operating Agreement
“requires unscheduled flow to be deducted from Operational Transfer Capability Limit and
Available transfer Capability only on a real-time basis, or for the hour-ahead pre-scheduling
period” unless an alternative procedure is established.20 Our proposed approach is line with this
agreement.
In summary, the ISO proposes to use the unscheduled flow mitigation procedure to curtail
schedules in the real-time beyond our required minimum accommodation percentage. The ISO
would still enforce the scheduling limit on PACI and both the scheduling and physical flow limits
in the day-ahead market for other interties that are not WECC qualified paths, where the flow
limits are typically equal to the intertie line’s thermal capacity and where the ISO is currently
required to provide 100% accommodation of unscheduled flow rather than being able to use
WECC’s unscheduled flow mitigation plan.
As is currently the case, the ISO will adhere to FERC’s ruling that losses will not be double-
charged on specific imports and exports from the existing IBAA users that demonstrate they pay
Transmission Agency of Northern California or the Western Area Power Administration for
losses.
For the future, the WECC has proposed to evaluate schedule curtailment based on transmission
priority in a new Unscheduled Flow Reduction Guideline. However, a recent memo from WECC
notes that the FERC has expressed some concerns with WECC’s proposal.21 WECC staff
considered four options ranging from: (1) a full filing at the FERC for the proposed guideline with
transmission priority curtailment; (2) modifications to the guideline and file; (3) file the guideline
19
See Appendix 3 in WECC Path Concept White Paper, September 20, 2013. http://www.wecc.biz/committees/StandingCommittees/PCC/Lists/Team%20Discussion/Attachments/88/PathCpnceptWhitepaper_clean_draft_2013-09-20_V0.pdf 20
Second Amended COI Path Operating Agreement, Section 8.2. 21
WECC Staff memo to WECC Operating Committee, “Unscheduled Flow Reduction Guideline Filing Discussion,” April 5, 2013, p. 1. http://www.wecc.biz/committees/StandingCommittees/OC/20130423/Lists/Minutes/1/UFMP%20Memo%20on%20Options.pdf

California ISO Full Network Model Expansion Draft Final Proposal
CAISO/M&ID/DH 23 December 30, 2013
as information only; or (4) not file at all. WECC decided to file the guideline as informational
only.22 In addition, WECC is also working on an Enhanced Curtailment Calculator, which has
not yet been finalized or approved by FERC.
Given this regulatory uncertainty, we propose to move forward with the FNM proposal to model
base schedules as fixed schedules in the market optimization. The ISO is an active participant
in WECC discussions. If and when these new procedures are implemented and approved by
FERC, the ISO could potentially make adjustments to the base schedule methodology to reflect
that portion of unscheduled flow that could be reduced through the WECC procedures.
6.4 Modeling imports and exports and Transaction IDs
As discussed at the September 18th stakeholder meeting, the current scheduling points at the
interties do not reflect where generation is actually located. In other words, the current FNM
represents imports as if generation is increasing at the interties when in fact there may not be
any generators located there. This is the case for Victorville, as discussed at the meeting.
Under Phase 1, the ISO will continue to reflect cleared bids at the current scheduling points at
the interties. The result of this modeling simplification is a decrease in the accuracy of the
physical flow impact of these schedules. In other words, the ISO may assume more energy is
flowing over specific interties where in reality the physical flow is more dispersed and therefore
causes more unscheduled loop flow for the ISO and other BAAs in WECC.23
The remainder of this section will discuss the treatment of dynamic and static (i.e., non-dynamic
resource) bids in Phase 1 of the expanded FNM. Dynamic resources can exist within a
modeled BAA or at the FNM boundary, are supported by resource-specific operating data
(schedules, metering, telemetry, outage reporting, etc.), and will continue to be modeled and
priced at resource-specific locations. A dynamic resource is registered with the ISO and
assigned a unique resource ID registered in the ISO’s Master File; it is modeled with the same
level of detail, telemetry, and revenue quality meter requirements as internal generating
resources. Dynamic resources may participate in the day-ahead market, as well as in the 15-
minute and 5-minute real-time markets. Static intertie bids24 may be submitted in the day-ahead
market, as well as in the 15-minute real-time market, but they may not participate in the 5-
minute real-time market. Static intertie bids are submitted at the current scheduling points at the
interties under Phase 1.25 FNM boundary points will not be used for scheduling. Unlike
dynamic resources, static intertie bids or schedules are not associated with a specific resource
22
http://www.wecc.biz/committees/StandingCommittees/OC/071513/Lists/Minutes/1/UFAS%20Report%20July%202013.pdf 23
Under Phase 2, the ISO proposes to eliminate this simplifying assumption by modeling bids for imports to and exports from the ISO as originating from generators or sinks in the WECC. See Appendix 1: Phase 2 proposal for a detailed discussion. 24
Meaning not dynamically scheduled. 25
The ISO proposes in Phase 2 to create scheduling hubs and the Location ID would instead be used for the selected scheduling hub or other configuration based on an executed interchange scheduling agreement, EIM entity, or other agreement. See Appendix 1: Phase 2 proposal for a detailed discussion.

California ISO Full Network Model Expansion Draft Final Proposal
CAISO/M&ID/DH 24 December 30, 2013
and are not required to have a resource ID registered in the Master File. Table 4 below
summarizes the general approach to modeling types of import/export bids in the ISO markets.
Table 4 General approach to modeling intertie bids
Intertie bids from dynamic resources are modeled at detailed registered resources with unique resource IDs
Static intertie bids are modeled at the relevant current scheduling point at the intertie (under Phase 1)
Exceptions to the above include the EIM entities and those resources under a Market Efficiency
Enhancement Agreement or an interchange scheduling agreement. The EIM entities will be
modeled as hubs in the day-ahead so day-ahead intertie bids with the EIM entity will need to
specify the EIM entity scheduling hub. In real-time, the EIM agreement provides the ISO with
detailed modeling information so that we can provide scheduling and pricing at a nodal level.
For integrated BAA entities that have signed a Market Efficiency Enhancement Agreement
(MEEA), those resources will receive more granular pricing that the current integrated BAA
import (Captain Jack) and export (SMUD Hub) points.
As part of this proposal, the ISO will also provide the opportunity for interested parties to provide
more generation modeling data in order to receive more accurate and granular pricing. If the
data is detailed enough, the ISO can provide pricing that reflects actual resource locations
rather than the intertie points. There is precedent in the ISO market for such an agreement in
the MEEA. MEEAs are currently only offered to IBAAs but this framework can be extended to
other WECC entities, potentially with some appropriate modifications. See ISO tariff Sections
27.5.3.2 through 27.5.3.7 for the current information required to develop a MEEA (noting that
this is only offered for IBAAs at the moment). The ISO proposes to develop such an
interchange scheduling agreement or dynamic transfer agreement with interested and affected
parties. Another alternative is available for EIM entities, which provide detailed generation data
and receive nodal real-time pricing in return.
Real-time compensating injections may be needed to reflect schedules not otherwise modeled.
Compensating injections are injections and withdrawals that are added to the network model at
locations external to the ISO system. Currently they are used to minimize the difference
between the actual flows on interties and the scheduled flows. In the FNM they will be used to
minimize the difference between the actual flows and modeled flows. While compensating
injections may not decrease overall with the FNM expansion, we expect this initiative to
increase the overall accuracy of our model solutions. Therefore, compensating injections may
be used more effectively.
Since resource IDs will not be required for static intertie bids, the ISO proposes to use a
“transaction ID” that will serve as a surrogate resource ID in order to uniquely identify these bids

California ISO Full Network Model Expansion Draft Final Proposal
CAISO/M&ID/DH 25 December 30, 2013
and any resultant schedules. Table 5 below shows the bid information that will be included in
the transaction ID. Unlike the resource ID, the transaction ID will not be registered in the Master
File, but it will be generated when bids are submitted and will persist through the ISO market
systems, from bid validation through market clearing and settlements. The transaction ID will
help the ISO identify bids and schedules, honor contract paths by enforcing scheduling limits,
and facilitate intertie schedule tagging of physical bids and intertie referencing for virtual bids,
without the need to register an unbounded number of resources in the Master File.
Furthermore, the use of a transaction ID as the main means of bid and schedule identification
will present a minimal change to market participants’ existing systems since it can simply
replace the existing resource ID. For Phase 1, the location ID is the scheduling point name
which is currently the scheduling points at the intertie.26 As part of the transaction ID, the
Scheduling Coordinator can provide an integer-based numeric ID. This numeric ID can persist
through the system and can be used over and over to help the Scheduling Coordinator identify
bids. The length of the numeric ID will be determined during the implementation phase. The
transaction ID will be specified in the OASIS field on e-tags. Specifically for wheeling
transactions, the counterpart transaction ID will be specified in the optional WECC field on e-
tags.
Table 5 Transaction ID details
Category Detail
Scheduling Coordinator ID
Same as today
Location ID Scheduling Point (under Phase 1)
Primary Intertie ID Used for schedule tagging and scheduling limit constraints
Alternate Intertie ID Used for schedule tagging and scheduling limit constraints when the primary intertie is open and the Scheduling Coordinator has alternate scheduling agreement (dynamic transfer)
Bid Type Physical or virtual, supply (import) or demand (export), firm/non-firm, wheeling, etc.
Counterpart transaction ID
For wheel through transactions only
Numeric ID Integer-based ID provided by Scheduling Coordinator to help identify bid
26
The ISO proposes in Phase 2 to create scheduling hubs and the Location ID would instead be used for the selected scheduling hub or other configuration based on an executed interchange scheduling agreement, EIM entity, or other agreement. See Appendix 1: Phase 2 proposal for a detailed discussion.
California ISO Full Network Model Expansion Draft Final Proposal
CAISO/M&ID/DH 26 December 30, 2013
As an exception, for static intertie bids associated with resource adequacy capacity, existing
transmission contracts, transmission ownership rights, ancillary services certification, or other
contractual agreements, it will still be necessary to set-up a resource ID in the Master File to link
these bids to their respective contract information. For all resources registered in the Master
File, the transaction ID will be the respective resource ID.
7 Activity 2: enforce constraints for both scheduled and physical
flow
As mentioned above, WECC entities use both scheduled and physical flows. The ISO proposal
under this initiative is to use a dual approach that will respect both scheduled and physical
flows. This, in conjunction with improved modeling of day-ahead and real-time conditions, will
help to minimize and manage unscheduled loop flows.
This initiative conforms with the dual constraint methodology with that proposed as a result of
the FERC Order 764 stakeholder initiative.27 Table 6 summarizes the dual constraint
methodology under FERC Order 764 market changes, which will allow virtual bids to provide
counterflow for contract path limits in the integrated forward market run. This will result in
consistent pricing for both physical and virtual awards. During residual unit commitment, the
optimization will consider physical awards only with respect to contract path limits. Under the
FERC Order 764 market design, only these physical awards that also clear the residual unit
commitment process will be allowed to be tagged prior to the fifteen minute market, ensuring
that tagged schedules do not exceed an intertie’s capacity. The dual constraint methodology is
not relevant to the real-time market as the real-time market does not consider virtual bids.
27
http://www.caiso.com/informed/Pages/StakeholderProcesses/FERCOrderNo764MarketChanges.aspx

California ISO Full Network Model Expansion Draft Final Proposal
CAISO/M&ID/DH 27 December 30, 2013
Table 6
FERC Order 764 and Full Network Model Expansion dual constraint methodology
FERC Order 764 terminology and explanation
Full Network Model terminology and explanation
Integrated forward market
Not enforce physical only constraint – in other words, allow virtual bids to provide counterflow for contract path limits
Impact: physical and virtual awards will have the same price
Revised straw proposal (9/11):
Scheduling constraint – considers physical bids only; does not allow virtual bids to provide counterflow for contract path limits
Physical flow constraint – considers both physical and virtual bids Impact: physical and virtual awards
may have different prices – differs from FERC Order 764 market changes
Second revised straw proposal (10/30):
Scheduling constraint – considers both physical and virtual bids
Physical flow constraint - considers both physical and virtual bids Impact: physical and virtual awards
will have the same price – same as FERC Order 764 market changes
Residual Unit Commitment
Enforce physical only constraint –only consider physical awards with respect to contract path limits (i.e., virtual awards cannot provide counterflow to physical awards). This determines which physical imports cleared in IFM for which the ISO will accept e-tags prior to the fifteen minute market.
Same as FERC Order 764 and no changes from previous proposal
Real-time market
Only physical schedules are considered by real-time market.
Same as FERC Order 764 and no changes from previous proposal
The ISO proposes to enforce two constraints on each ISO intertie in the day-ahead market and
each EIM intertie in the real-time market to manage transmission congestion.
The first is a scheduling constraint based on the intertie declared in intertie bids against
the operational limit of the intertie. This will ensure that contract paths are honored and will be
used for tagging intertie schedules. In enforcing the constraint, the ISO will net physical and
virtual import and export energy schedules against each other during the integrated forward
market run, as described above in Table 6. The entire schedule or award will be constrained
(i.e., no shift factors). During residual unit commitment, only physical import/export energy

California ISO Full Network Model Expansion Draft Final Proposal
CAISO/M&ID/DH 28 December 30, 2013
schedules will be considered.28 Ancillary services, on the other hand, because they require firm
transmission and would not be simultaneously dispatched for energy in both directions, will not
be netted. For example, a regulation down (export capacity) will not net against upward
ancillary services (import capacity). Furthermore, transmission capacity reserved for ancillary
services awards will not create counter flow transmission capacity for energy schedules. These
scheduling limit constraints will not be different than the constraints that are currently enforced
on ISO interties.
The second is a physical flow constraint based on the modeled flows for an intertie taking
into account the actual power flow contributions from all resource schedules in the FNM against
the operational limit of the intertie. The operational limit per intertie is the same in both
scheduling and physical constraints. This second constraint includes both physical and virtual
import/export energy schedules in the integrated forward market. Only physical import/export
energy schedules are considered in the residual unit commitment process and the real-time
market. This is consistent with the ISO’s implementation of FERC Order 764 where virtual
intertie schedules are only considered in the integrated forward market and only the physical
intertie schedules that clear the residual unit commitment are allowed to submit tags prior to the
fifteen minute market. Unlike the scheduling limit, the schedule contributions toward the
physical flow limit will be based on the power transfer distribution factors (i.e. shift factors)
calculated from the network topology so that we can accurately model loop flows. Refer to
Section 10.2 for an illustrative numeric example of how the two constraints are enforced.
The scheduling and physical flow limit constraints collapse to the same constraint in the case of
some radial interties in the current FNM, where the power transfer distribution factors are all 1 or
0 for these interties, but they need to be differentiated in the expanded FNM.
8 Activity 3: include variables in high voltage direct current
transmission modeling
The ISO currently models the Trans Bay Cable high voltage direct current (HVDC) transmission
line in the FNM. Since the line is internal to the ISO, the modeling is simplified so that the load
at the rectifier station is equal to the generation at the inverter station, using logical resources at
each converter station. Furthermore, that load and generation are fixed in the market. Under
Phase 1, the ISO proposes to enhance its current model for HVDC transmission for those lines
for which the ISO has and does not have direct operational control. We discuss each scenario.
For HVDC links where the ISO has direct operational control (e.g., Trans Bay Cable), the ISO
proposes to replace the fixed algebraic injections at the converter stations with free variables
(i.e., without a cost in the objective function). The ISO would no longer fix the two power
injections, but will still constrain them to be equal to each other by enforcing a balancing
28
More specifically, the residual unit commitment does not award additional exports but rather considers the exports awarded by the integrated forward market. The residual unit commitment can award additional imports.
California ISO Full Network Model Expansion Draft Final Proposal
CAISO/M&ID/DH 29 December 30, 2013
constraint. As an additional measure of accuracy, the ISO can even approximate the associated
DC losses in that balancing constraint. Furthermore, the magnitude of the algebraic power
injections would be limited by the HVDC link’s capacity allowing omnidirectional power flow.
For HVDC links where the ISO does not have direct operational control (e.g., Pacific DC Intertie,
InterMountain-Adelanto), the ISO proposes a similar model with algebraic injection variables at
the converter stations constrained by a balancing constraint. However, in these cases the
injections will be limited by the algebraic sum of all associated import and export schedules that
declare the use of the HVDC link in the corresponding bids. Furthermore, the injections will be
limited by applicable transmission rights. Verified tags for intertie schedules on the HVDC links
would provide a hedge for the locational marginal price difference between the inverter and
rectifier stations, in effect exempting these schedules from marginal loss and marginal
congestion charges between these stations since the associated energy is flowing on the HVDC
link as opposed to the AC network. Refer to Section 0 for an illustrative example.
9 Congestion revenue rights
Holders of monthly, seasonal, and long term congestion revenue rights (CRRs) with a source or
sink at the interties will be impacted by the FNM expansion. Enhancements to the FNM that are
incorporated into the running of the day-ahead market will be evaluated to determine how best
to incorporate it into the development of the CRR FNM. One of the key principles behind
maintaining revenue adequacy through the CRR allocation and auction processes is to mimic,
as much as possible, the same FNM as utilized in the day-ahead market. To maintain this
principle the CRR FNM will follow the objectives and activities as noted in Table 2.
9.1 Loop flow modeling
As part of the FNM expansion project one of the objectives will be to model loop flows in the
day-ahead market. In the CRR model we propose to model similar “base schedules” as utilized
in the day-ahead market with the exception that the CRR model will need to develop these base
schedules on a monthly/TOU basis. As noted further in this section the modeling of loop flow in
the CRR process will initially be done in the monthly CRR process only and can be revisited
after the first year of operation to determine whether modeling loop flow in the monthly CRR
processes is sufficient. The base schedules would be modeled as fixed injections and
withdrawals as CRR Options. We will conservatively reflect the base schedules as CRR options
at implementation of this first phase of the FNM expansion. Over time and with sufficient
analysis, the ISO may reflect the base schedules as CRR options and/or obligations. The
application of these base schedules into the CRR process will have some timing and possible
CRR simultaneous feasibility test impacts that need to be considered since the 2015 annual
allocation and auction markets will already have been completed when the expanded FNM is
implemented. The first available CRR process will likely be the monthly allocation and auction
period. Note that even for the monthly CRR, the typical monthly CRR process starts
approximately 30-45 days prior to the first operating day of the month. After further discussion

California ISO Full Network Model Expansion Draft Final Proposal
CAISO/M&ID/DH 30 December 30, 2013
it was determined that modeling of loop flow would only be applied during the monthly process
and the application of the break-even methodology29 would be applied in the annual process,
which would eventually capture the modeled loop flow from the day-ahead market. In other
words, as history is developed from the day-ahead market, the capacity available to fund CRRs
in the day-ahead market would be adjusted for the loop flow modeling and as such should be
reflected in the break-even methodology.
By including base schedules it is possible, though unlikely, that the existing CRRs might not
clear the CRR simultaneous feasibility test. We expect the CRRs to clear the test because the
annual CRR process only releases 75% of system capacity, and any shifting of flows across the
inter-ties should not exceed the difference between the annual release amount and the monthly
release capacity. If that situation arises the ISO will perform limit expansion, as is currently
done for any previously awarded CRRs that do not clear the CRR simultaneous feasibility test
due to modeling differences between when the CRRs were awarded and the running of a
subsequent CRR allocation or auction market. This is described in Section 36.4.2 in the tariff.
CRR “clawback” rules such as those in Section 11.2.4.6 and 11.2.4.7 in the tariff will still apply.
10 Examples
This section provides three illustrative examples of the market clearing process that will use the
expanded FNM. The first example will show how the ISO determines base schedules for each
BAA prior to the day-ahead and real-time market run as will be implemented in Phase 1. It then
provides a brief illustration of how import and export schedules are cleared today building the
foundation for the next example. The second example explains how both scheduled and
physical constraints are enforced as will be implemented in Phase 1. Finally, the third example
is about the HVDC modeling improvement that will be implemented in Phase 1. See also
Appendix 1: Phase 2 proposal for the same examples recalculated under the Phase 2 proposed
changes.
10.1 Example 1: creating base schedules
This example first describes how the base schedules are created. This process involves
distributing the demand forecast for each balancing authority area to load nodes using the
respective default load distribution factors. Similarly, the demand forecast net of any scheduled
interchanges (e.g., day-ahead schedules with the ISO or other balancing authority areas, prior
to the real-time market) will be distributed to the resources in each balancing authority area
based on historical generation patterns using generation distribution factors, or based on the
29
See http://www.caiso.com/Documents/RevisedDraftFinalProposal-
CongestionRevenueRights2011Enhancements.pdf.
California ISO Full Network Model Expansion Draft Final Proposal
CAISO/M&ID/DH 31 December 30, 2013
state estimator solution in the real-time market. The base schedule determination will include
information about resource and transmission outages and other relevant data to the extent they
are available. In the real-time market, the base schedules for the ISO are the day-ahead
schedules.
The ISO will then run an AC power flow with net interchange control for each BAA to maintain
its net schedule interchange. A distributed load slack will be used to distribute transmission
losses in each balancing authority area. The resultant adjusted base schedules will be used as
a reference in the subsequent market run.30
The ISO will then run its market performing congestion management for the ISO network and
ISO interties.31 The ISO market solution will ignore the impact of transmission losses in external
balancing authority areas on the locational marginal prices.32
10.1.1 Establishing the base schedule
Figure 3 shows the CAISO and two modeled external balancing authority areas: BAA1 and
BAA2. BAA1 has a generation aggregation point composed of G1 and G2 and a load aggregation
point composed of L1 and L2. BAA2 has a generation aggregation point composed of G3 and G4
and a load aggregation point composed of L3 and L4.
30
The process for determining and calculating adjusted base schedules is slightly different for EIM Entity BAAs in the RTM and it is described in detail in the EIM straw proposal. 31
Congestion management is also applicable to EIM Entity BAAs in the RTM. 32
With the exception of EIM Entity BAAs in the real-time market.

California ISO Full Network Model Expansion Draft Final Proposal
CAISO/M&ID/DH 32 December 30, 2013
Figure 3 Modeled BAAs in the full network model
Table 7 shows the calculation of the base generation and load for the two external BAAs. A
demand forecast of 1,000 MW is assumed for both BAAs; furthermore, a base net interchange
of 100 MW is assumed from BAA1 to BAA2. Column [B] lists the total generation and load for
each BAA; the total generation is equal to the demand forecast, adjusted by the net base
interchange; the demand forecast includes transmission losses. Column [C] shows the historical
generation distribution factors (GDF) and the historical load distribution factors (LDF) for each
BAA. Column [D] shows the distribution of the total generation and the demand forecast to the
resources and loads in each BAA based on the relevant historical distribution factors. As
mentioned earlier, historical GDFs and LDFs can be derived from the state estimator solutions
or received directly from the external BAA. Finally, column [E] shows the AC power flow
solution with a distributed load slack and net interchange control. The AC power flow adjusts
the load in each BAA (consistent with the LDFs) to absorb the transmission losses and maintain
the net base interchange. A 3% loss (30 MW) is assumed in each BAA. The AC power flow
solution yields the base generation and load schedules in each BAA at the resource level.
CAISO
BAA1
BAA2
G1 G2
L1 L2
G3 G4
L3 L4
T1
T3
T2

California ISO Full Network Model Expansion Draft Final Proposal
CAISO/M&ID/DH 33 December 30, 2013
Table 7 Base generation and load schedules
BAA Total generation, demand forecast, and base net interchange
(MW)
GDF and LDF (%)
Distributed generation and demand using
GDF/LDF (MW)
AC power flow solution
(MW)
[A] [B] [C] [D] [E]
BAA1 = [B] x [C]
G1 1,100 60 660 660
G2 40 440 440
L1 1,000 50 500 485
L2 50 500 485
Losses n/a 30
NSI 100 100 100
BAA2
G3 900 40 360 360
G4 60 540 540
L3 1,000 50 500 485
L4 50 500 485
Losses n/a 30
NSI –100 –100 –100
10.1.2 Import and export schedules
Assume next that Scheduling Coordinator 1 (SC1) bids a 100 MW import over T1 at $20/MWh,
SC2 bids a 100 MW import over T2 at $25/MWh, SC3 bids a 100 MW import over T1 at
$30/MWh, and SC4 bids a 100 MW export over T2 at $50/MWh. The four bids are identified as
follows in Table 8 below. Note Resource IDs are not used to identify import/export schedules.
Instead, Transaction IDs will be generated to identify each bid so that the information does not
need to be kept in the Master File.
Table 8 Import and export bids at current scheduling points at the interties
Bid SC Bid ($/MWh)
Bid (MW)
Type Intertie
B1 SC1 20 100 Import to ISO T1
B2 SC2 25 100 Import to ISO T2
B3 SC3 30 100 Import to ISO T1
B4 SC4 50 100 Export from ISO T2
In the day-ahead optimization, the ISO will enforce both a scheduling and a physical flow
constraint for each intertie. This is discussed in detail in the next subsection.
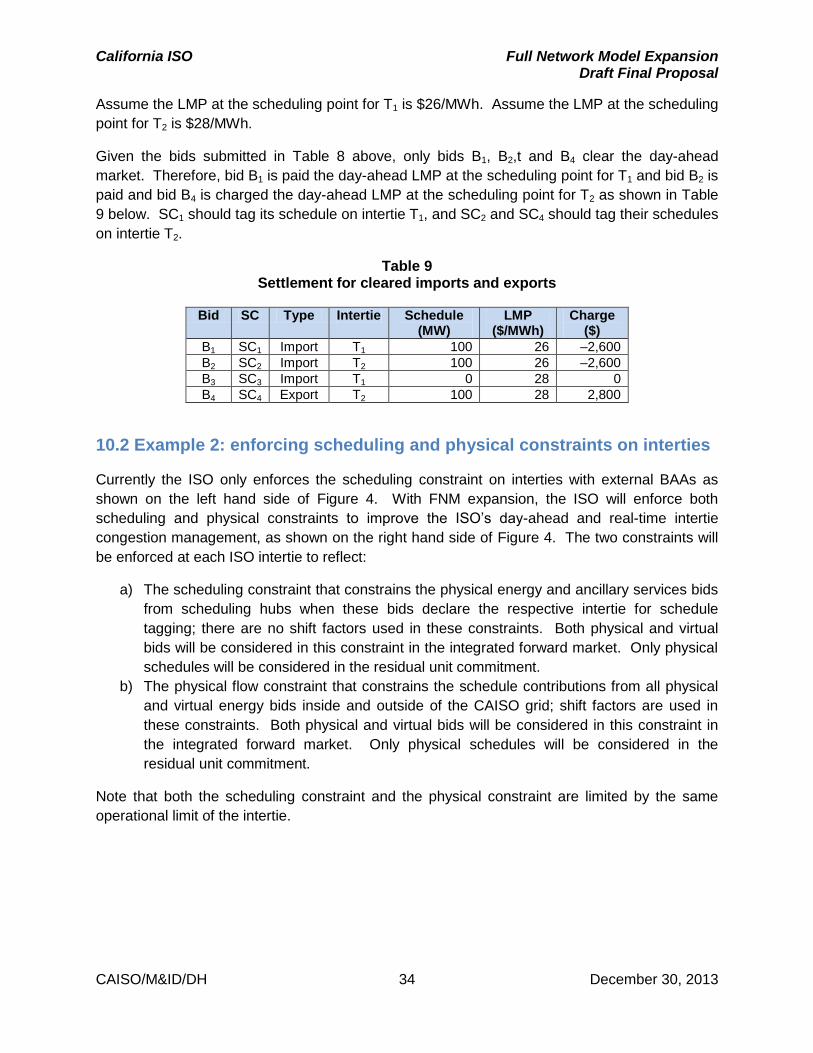
California ISO Full Network Model Expansion Draft Final Proposal
CAISO/M&ID/DH 34 December 30, 2013
Assume the LMP at the scheduling point for T1 is $26/MWh. Assume the LMP at the scheduling
point for T2 is $28/MWh.
Given the bids submitted in Table 8 above, only bids B1, B2,t and B4 clear the day-ahead
market. Therefore, bid B1 is paid the day-ahead LMP at the scheduling point for T1 and bid B2 is
paid and bid B4 is charged the day-ahead LMP at the scheduling point for T2 as shown in Table
9 below. SC1 should tag its schedule on intertie T1, and SC2 and SC4 should tag their schedules
on intertie T2.
Table 9 Settlement for cleared imports and exports
Bid SC Type Intertie Schedule (MW)
LMP ($/MWh)
Charge ($)
B1 SC1 Import T1 100 26 –2,600
B2 SC2 Import T2 100 26 –2,600
B3 SC3 Import T1 0 28 0
B4 SC4 Export T2 100 28 2,800
10.2 Example 2: enforcing scheduling and physical constraints on interties
Currently the ISO only enforces the scheduling constraint on interties with external BAAs as
shown on the left hand side of Figure 4. With FNM expansion, the ISO will enforce both
scheduling and physical constraints to improve the ISO’s day-ahead and real-time intertie
congestion management, as shown on the right hand side of Figure 4. The two constraints will
be enforced at each ISO intertie to reflect:
a) The scheduling constraint that constrains the physical energy and ancillary services bids
from scheduling hubs when these bids declare the respective intertie for schedule
tagging; there are no shift factors used in these constraints. Both physical and virtual
bids will be considered in this constraint in the integrated forward market. Only physical
schedules will be considered in the residual unit commitment.
b) The physical flow constraint that constrains the schedule contributions from all physical
and virtual energy bids inside and outside of the CAISO grid; shift factors are used in
these constraints. Both physical and virtual bids will be considered in this constraint in
the integrated forward market. Only physical schedules will be considered in the
residual unit commitment.
Note that both the scheduling constraint and the physical constraint are limited by the same
operational limit of the intertie.

California ISO Full Network Model Expansion Draft Final Proposal
CAISO/M&ID/DH 35 December 30, 2013
Figure 4 Current and expanded FNM constraint enforcement
The following example uses the same full network model topology from the example in Section
10.1 to show the intertie constraint formulation.
For the bid quantities originally submitted and provided in Table 8 (all were assumed to be
100 MW), the scheduling limit constraints are as follows:
T1: 𝑂𝑇𝐶1,min ≤ 𝐵1 + 𝐵3 ≤ 𝑂𝑇𝐶1,max
T2: 𝑂𝑇𝐶2,min ≤ 𝐵2 − 𝐵4 ≤ 𝑂𝑇𝐶2,max
Where:
OTC1,min is the minimum operational transfer capacity of T1
OTC1,max is the maximum operational transfer capacity of T1
OTC2,min is the minimum operational transfer capacity of T2
OTC2,min is the maximum operational transfer capacity of T2
A positive number reflects an import into and a negative number reflects an export out of the
ISO. These constraints would also include any ancillary services bids submitted at the
scheduling hubs. Note that ancillary services do not provide counter flow.
The physical flow limit constraints are as follows:
T1: 𝑂𝑇𝐶1,min ≤ 𝐹1 + 0.72 𝐵1 + 0.72 𝐵2 + 0.32 𝐵3 − 0.32 𝐵4 + ⋯ ≤ 𝑂𝑇𝐶1,max
T2: 𝑂𝑇𝐶2,min ≤ 𝐹2 + 0.28 𝐵1 + 0.28 𝐵2 + 0.68 𝐵3 − 0.68 𝐵4 + ⋯ ≤ 𝑂𝑇𝐶2,max
Where: F1 and F2 are the base power flows on T1 and T2, respectively. These constraints
include the power flow contributions from all energy bids, physical and virtual alike, submitted at
scheduling points, and internal resources (represented by the ellipsis in the equations above).
The formula includes illustrative shift factors of 0.72, 0.32, 0.28. and 0.68.
BAA1
Current FNM
Enforce scheduling
limit
BAA2 ISO
BAA1 Enforce
scheduling and physical limit
BAA2 ISO
With FNM expansion
North
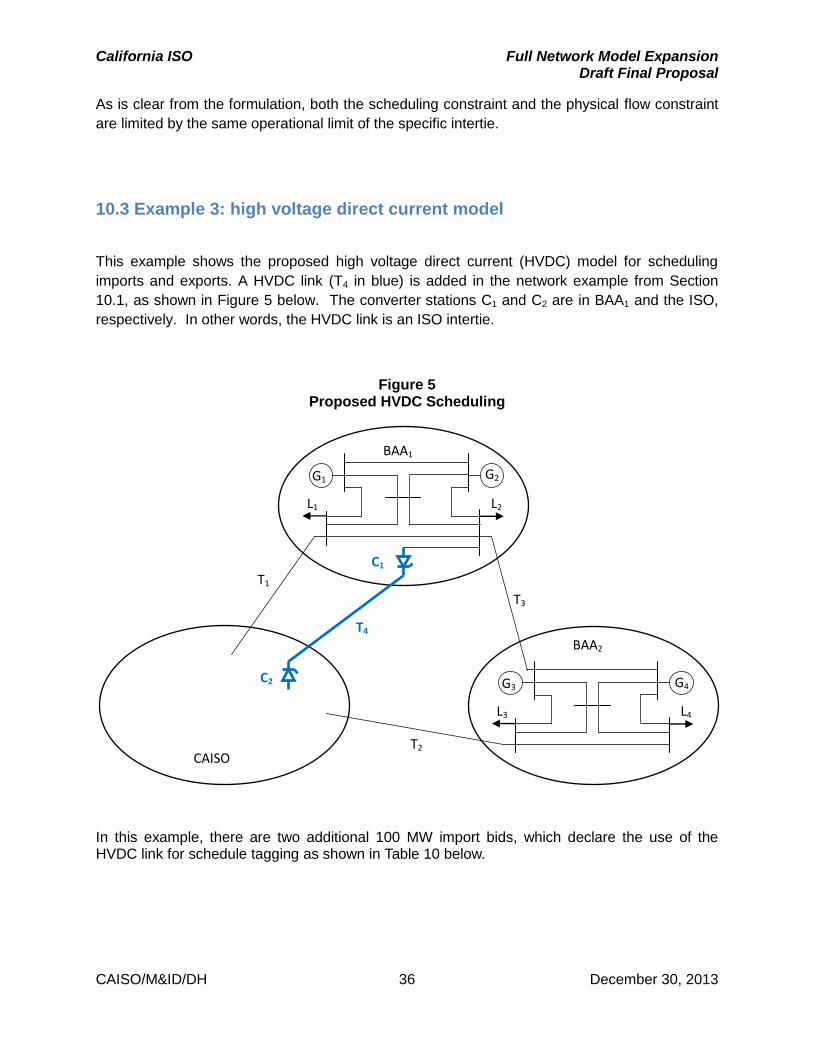
California ISO Full Network Model Expansion Draft Final Proposal
CAISO/M&ID/DH 36 December 30, 2013
As is clear from the formulation, both the scheduling constraint and the physical flow constraint
are limited by the same operational limit of the specific intertie.
10.3 Example 3: high voltage direct current model
This example shows the proposed high voltage direct current (HVDC) model for scheduling
imports and exports. A HVDC link (T4 in blue) is added in the network example from Section
10.1, as shown in Figure 5 below. The converter stations C1 and C2 are in BAA1 and the ISO,
respectively. In other words, the HVDC link is an ISO intertie.
Figure 5 Proposed HVDC Scheduling
In this example, there are two additional 100 MW import bids, which declare the use of the HVDC link for schedule tagging as shown in Table 10 below.
CAISO
BAA1
BAA2
G1 G2
L1 L2
G3 G4
L3 L4
T1
T3
T2
T4
C1
C2
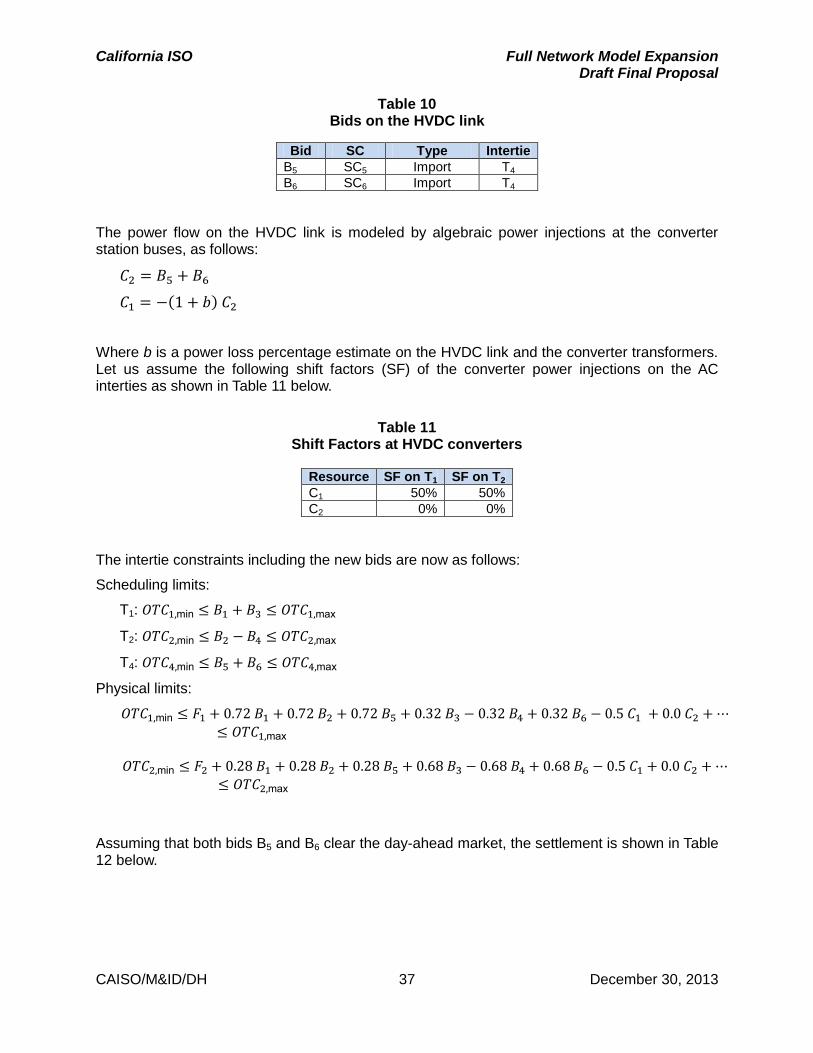
California ISO Full Network Model Expansion Draft Final Proposal
CAISO/M&ID/DH 37 December 30, 2013
Table 10 Bids on the HVDC link
Bid SC Type Intertie
B5 SC5 Import T4
B6 SC6 Import T4
The power flow on the HVDC link is modeled by algebraic power injections at the converter station buses, as follows:
𝐶2 = 𝐵5 + 𝐵6
𝐶1 = −(1 + 𝑏) 𝐶2
Where b is a power loss percentage estimate on the HVDC link and the converter transformers. Let us assume the following shift factors (SF) of the converter power injections on the AC interties as shown in Table 11 below.
Table 11
Shift Factors at HVDC converters
Resource SF on T1 SF on T2
C1 50% 50%
C2 0% 0%
The intertie constraints including the new bids are now as follows:
Scheduling limits:
T1: 𝑂𝑇𝐶1,min ≤ 𝐵1 + 𝐵3 ≤ 𝑂𝑇𝐶1,max
T2: 𝑂𝑇𝐶2,min ≤ 𝐵2 − 𝐵4 ≤ 𝑂𝑇𝐶2,max
T4: 𝑂𝑇𝐶4,min ≤ 𝐵5 + 𝐵6 ≤ 𝑂𝑇𝐶4,max
Physical limits:
𝑂𝑇𝐶1,min ≤ 𝐹1 + 0.72 𝐵1 + 0.72 𝐵2 + 0.72 𝐵5 + 0.32 𝐵3 − 0.32 𝐵4 + 0.32 𝐵6 − 0.5 𝐶1 + 0.0 𝐶2 + ⋯≤ 𝑂𝑇𝐶1,max
𝑂𝑇𝐶2,min ≤ 𝐹2 + 0.28 𝐵1 + 0.28 𝐵2 + 0.28 𝐵5 + 0.68 𝐵3 − 0.68 𝐵4 + 0.68 𝐵6 − 0.5 𝐶1 + 0.0 𝐶2 + ⋯≤ 𝑂𝑇𝐶2,max
Assuming that both bids B5 and B6 clear the day-ahead market, the settlement is shown in Table 12 below.

California ISO Full Network Model Expansion Draft Final Proposal
CAISO/M&ID/DH 38 December 30, 2013
Table 12 Settlement for cleared imports and exports including HVDC
Bid SC Type Intertie Schedule (MW)
LMP ($/MWh)
Charge ($)
B1 SC1 Import T1 100 26 –2,600
B2 SC2 Import T2 100 26 –2,600
B3 SC3 Import T1 0 28 0
B4 SC4 Export T2 100 28 2,800
B5 SC5 Import T4 100 26 –2,600
B6 SC6 Import T4 100 28 –2,800
Furthermore, assuming that the LMPs at the converter stations C1 and C2 are $27/MWh and
$30/MWh, respectively, SC5 and SC6 receive the LMP difference ($3/MWh), i.e., a supplemental
charge of –$300 each, because their energy schedules for bids B5 and B6 flow on the HVDC link
instead of the AC network. However, that supplemental charge is contingent on tagging the
respective schedules on the HVDC intertie. SC5 and SC6 would also be responsible for their
share on the HVDC losses, but this is not an ISO settlement.
Assuming a 1% power loss on the HVDC link (2MW), the rectifier (C1) and inverter (C2) power
injections are fixed at –202 MW and 200 MW, respectively, in the AC power flow solution.
11 Pre-implementation analysis, benchmarking and data updates
The ISO believes the accuracy of its estimation of base schedules is the most important factor
that will affect the accuracy of its loop flow modeling. The ISO plans to calibrate this estimation
prior to implementing the FNM functionality and has already begun activities to support this. In
addition, the ISO plans to conduct a pre-implementation analysis showing that the Phase 1
elements would be an improvement over today’s modeling. This analysis would use the data
and methodology proposed for creating base schedules in the day-ahead timeframe. At a
minimum, the ISO envisions a conservative analysis comparing a day-ahead solution with and
without the base schedules for selected BAAs to show the potential congestion caused by the
unscheduled flow stemming from the base schedules. This congestion would serve as a proxy
for real-time congestion imbalance offset costs from infeasible day-ahead schedules because
those schedules did not account for unscheduled flow. The ISO would need to have the
software code in order to complete this analysis. We are also working to provide a more robust
pre-implementation analysis. This will likely involve additional requirements for our vendors and
we will work with them on a plan of action. We will report the progress of any such plans to
stakeholders by the February Board of Governors meeting. A more robust analysis would also
require the software code. Therefore we expect to conduct the selected analysis (either the
currently proposed analysis or the proposed more robust analysis if feasible) around the same
time as the market simulation timeframe in Summer 2014.

California ISO Full Network Model Expansion Draft Final Proposal
CAISO/M&ID/DH 39 December 30, 2013
The ISO proposes the following benchmarking metrics starting with Phase 1. These metrics
and analyses will help the ISO improve modeling for the reliable, efficient operations of our
markets and inform the stakeholder process for Phase 2.
1. Market flows and actual flows - As the ISO improves modeling in the expanded FNM,
we expect market flows to come closer to actual (metered) flows. If they do not, we want
to be able to understand the extent to which there is a mismatch, when, where, and how
to improve. We propose to compare the following: (1) day-ahead market flows versus
actual flows; and (2) real-time (both 15 minute and 5 minute) market flows versus actual
flows.
2. Compensating injections in real-time – Though this initiative seeks to reduce the use
of compensating injections by modeling the majority of unscheduled flows in the day-
ahead, there will still be a need for compensating injections in the real-time. We propose
to analyze the use of compensating injections in the real-time to better understand its
effectiveness (volume used, location, timing) and the underlying reasons for its use. If
the underlying reasons point to a modeling discrepancy, this can help us improve our
modeling efforts and potentially account for this in the day-ahead timeframe.
3. Real-time congestion imbalance offset cost tracking – As mentioned in this
proposal, there are several drivers of real-time congestion imbalance offset costs, one of
which is the lack of unscheduled flow consideration in the day-ahead (causing
congestion in the real-time). The ISO proposes to track real-time congestion imbalance
offset costs by constraint that are caused by inaccurate day-head modeling of market
flows, due to unscheduled flow from the interties. To the extent possible, the ISO will
expand this analysis to other drivers of these costs but for the purpose of this initiative,
the focus will be on improvements in day-ahead modeling.
For each of these analyses, granular data may not be available at go-live. However, we expect
this to change so that we can provide more detailed analyses over time. The ISO is pro-actively
analyzing the data needs and accessibility for FNM expansion go-live today. The ISO commits
to release a technical bulletin or similar announcement providing the final list of modeled BAAs
for Phase 1.
12 Next Steps
The ISO will discuss this third revised straw proposal with stakeholders on a conference call on
January 7, 2014. Written comments are due by January 14, 2014 to [email protected].

California ISO Full Network Model Expansion Draft Final Proposal
CAISO/M&ID/DH 40 December 30, 2013
Appendix 1: Phase 2 proposal
The ISO is dividing the proposal into two phases. Phase 2 will continue in the stakeholder
process and be brought to the ISO’s Board of Governors at a later date. All of the subsections
below are part of Phase 2.
13 Activity 1: scheduling point and hub definitions
Of the three major activities to support the objectives of the full network model expansion shown
below in Table 13, the creation of scheduling points and hub definitions were part of Phase 2
rather than Phase 1.
Table 13
Objectives and Activities for Full Network Model Expansion
Objectives Activities to support objectives
Accurate loop flow modeling
Enhanced security analysis
Better analysis and outage coordination
Accurate high voltage direct current modeling
1. Model external balancing authority area generation, load, and transmission facilities (Phase 1), and scheduling point and hub definitions (Phase 2)
2. Enforce constraints for both scheduled and physical flow (Phase 1)
3. Include variables in high voltage direct current transmission modeling (Phase 1)
In Phase 2, the ISO proposes to define new scheduling hubs and points for pricing CAISO
imports and exports as summarized in Table 14 below. The table shows the full transition from
today’s current model to Phase 1 and then Phase 2.

California ISO Full Network Model Expansion Draft Final Proposal
CAISO/M&ID/DH 41 December 30, 2013
Table 14 Current and proposed modeling, scheduling and pricing
Current Full Network Model Expansion Proposals
Modeling, scheduling and pricing
Modeling
Scheduling and pricing
Scheduling points at the ISO interties; systems outside of ISO only partially modeled
Phase 1 External generation , and load not involving ISO market transactions, as well as external transmission facilities will be modeled at external balancing authority areas
ISO imports/exports will be modeled at existing intertie scheduling points
Remains at the current scheduling points at the interties unless an interchange scheduling agreement is signed
Phase 2 ISO imports/exports will be modeled in the same manner as they are scheduled and priced (scheduling hub, IBAA, etc.)
Scheduling hubs: o North o South
IBAA export hub, and MEEA hubs
EIM Entity BAAs
CFE
Custom scheduling hubs at external BAA level or more granular depending on interchange scheduling agreements with the ISO
The straw proposal used the BAA footprint as the basis for modeling, scheduling, and pricing.
Based on the revised straw proposal, we will keep the modeling of the expanded FNM at the
BAA footprint but propose several different footprints for scheduling and pricing in Phase 2. As
explained in more detail in Section 13.1, the different scheduling and pricing footprints will allow
the ISO to ensure better convergence between import and export schedules and real-time flows.
As we briefly explain here, the ISO’s current proposal under Phase 2 will create five major
categories of scheduling and pricing footprints. The first category is a scheduling hub which is
an aggregation of balancing authorities in WECC. We have defined one for North and South
and they are explained in detail in Section 13.2. Other scheduling points that will be used in the
ISO’s model for the WECC area include the existing export hub used by the integrated
balancing authority areas (IBAAs) embedded in the ISO’s footprint (and hubs created for
modeling of Market Efficiency Enhancement Agreements within the IBAA), the energy
imbalance market (EIM) entity, and the scheduling hub for the Comision Federal de Electricidad
(CFE). The ISO may also define custom scheduling hubs at the external BAA level or at a more
granular level depending on interchange scheduling agreements between interested and
affected parties (such as scheduling coordinators or the appropriate resource owners) and the
ISO. We explain our rationale for each of these in the following sections. The current

California ISO Full Network Model Expansion Draft Final Proposal
CAISO/M&ID/DH 42 December 30, 2013
scheduling points at the ISO interties would no longer be used for scheduling imports or
exports.33
The scheduling hubs create a framework for the modeling to support Activity 1. In the next
sections, we will discuss how the modeling is achieved in two “layers” under the Phase 2
approach. The first layer is the creation of a “base schedule,” which reflects energy flows in the
WECC resulting from energy schedules not involving the ISO. These schedules are important
to model because they create physical flow impacts on the ISO system. This will be completed
in Phase 1. The second layer is to superimpose on the base schedules imports from BAAs to
(exports to BAAs from) the ISO. These will be modeled as incremental (or decremental)
changes to the base schedule. The expanded model will also allow scheduling coordinators to
submit physical or virtual import or export bids at each of the new scheduling hubs under Phase
2, as discussed below
13.1 Modeling imports and exports and Transaction IDs
The current model simplification (which will persist under Phase 1) assumes generation and
load are located at exactly the ISO boundary, when this is clearly not realistic.34 To reflect this,
injections and withdrawals are modeled at the ISO interties when in fact actual generation and
load are located elsewhere in WECC. The result of this modeling simplification is a decrease in
the accuracy of the physical flow impact of these schedules. In other words, the ISO may
assume more energy is flowing over specific interties where in reality the physical flow is more
dispersed and therefore causes more unscheduled loop flow for the ISO and other BAAs in
WECC. Under Phase 2, the ISO proposes to eliminate this simplifying assumption by modeling
bids for imports to and exports from the ISO as originating from generators or sinks in the
WECC. The distribution of the import/export schedules to the relevant supply resources is
required to obtain a network solution (power flow solution) for the entire FNM to accurately
represent loop flows in enforcing transmission constraints in the ISO and the ISO interties.
Therefore, Phase 2 of the FNM expansion attempts to “move” the generation closer to the
actual source, which will make pricing more accurate, even with aggregated scheduling hubs as
discussed below.
13.1.1 Modeling imports and exports at the BAA level
Using the base schedules as the foundation, imports (exports) will be reflected as incremental
(decremental) to those BAA base schedules. In other words, an import from a BAA into the ISO
assumes that generation within the BAA is incrementing to support the import schedule.
Conversely, an export from the ISO to the BAA assumes that generation in the BAA is
33
However, the current scheduling points may be used to transition existing CRRs to the expanded FNM under Phase 2. See Section 13.3 for CRR discussion. 34
See Section 6.4 for a discussion on the Victorville intertie.
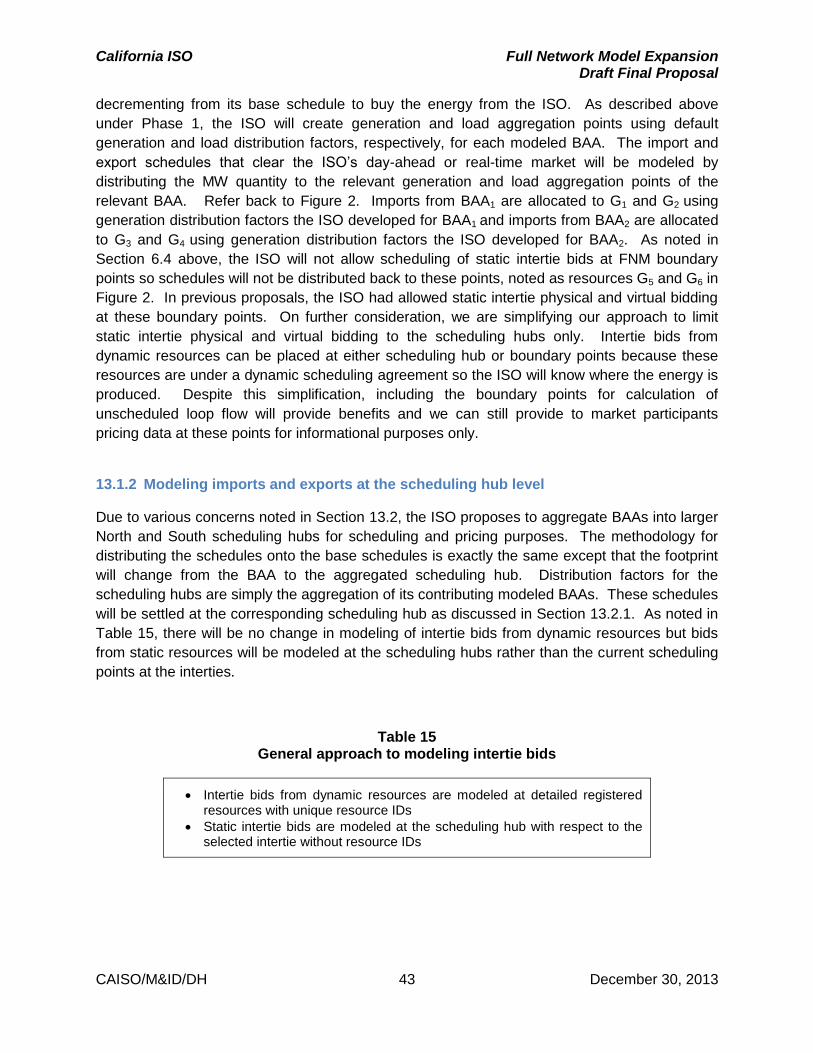
California ISO Full Network Model Expansion Draft Final Proposal
CAISO/M&ID/DH 43 December 30, 2013
decrementing from its base schedule to buy the energy from the ISO. As described above
under Phase 1, the ISO will create generation and load aggregation points using default
generation and load distribution factors, respectively, for each modeled BAA. The import and
export schedules that clear the ISO’s day-ahead or real-time market will be modeled by
distributing the MW quantity to the relevant generation and load aggregation points of the
relevant BAA. Refer back to Figure 2. Imports from BAA1 are allocated to G1 and G2 using
generation distribution factors the ISO developed for BAA1 and imports from BAA2 are allocated
to G3 and G4 using generation distribution factors the ISO developed for BAA2. As noted in
Section 6.4 above, the ISO will not allow scheduling of static intertie bids at FNM boundary
points so schedules will not be distributed back to these points, noted as resources G5 and G6 in
Figure 2. In previous proposals, the ISO had allowed static intertie physical and virtual bidding
at these boundary points. On further consideration, we are simplifying our approach to limit
static intertie physical and virtual bidding to the scheduling hubs only. Intertie bids from
dynamic resources can be placed at either scheduling hub or boundary points because these
resources are under a dynamic scheduling agreement so the ISO will know where the energy is
produced. Despite this simplification, including the boundary points for calculation of
unscheduled loop flow will provide benefits and we can still provide to market participants
pricing data at these points for informational purposes only.
13.1.2 Modeling imports and exports at the scheduling hub level
Due to various concerns noted in Section 13.2, the ISO proposes to aggregate BAAs into larger
North and South scheduling hubs for scheduling and pricing purposes. The methodology for
distributing the schedules onto the base schedules is exactly the same except that the footprint
will change from the BAA to the aggregated scheduling hub. Distribution factors for the
scheduling hubs are simply the aggregation of its contributing modeled BAAs. These schedules
will be settled at the corresponding scheduling hub as discussed in Section 13.2.1. As noted in
Table 15, there will be no change in modeling of intertie bids from dynamic resources but bids
from static resources will be modeled at the scheduling hubs rather than the current scheduling
points at the interties.
Table 15 General approach to modeling intertie bids
Intertie bids from dynamic resources are modeled at detailed registered resources with unique resource IDs
Static intertie bids are modeled at the scheduling hub with respect to the selected intertie without resource IDs

California ISO Full Network Model Expansion Draft Final Proposal
CAISO/M&ID/DH 44 December 30, 2013
13.1.3 Transaction IDs
Transactions IDs will still be used with Phase 2 implementation with the only noticeable change
limited to the “Location ID” field as noted in Table 5. In this field, market participants should
note the appropriate scheduling hub rather than the current scheduling points at the interties.
Note that under either phase, there may be other available locations such as the EIM entities or
other configurations based on an executed interchange scheduling agreement.
Table 16 Transaction ID details
Category Detail
Scheduling Coordinator ID
Same as today
Location ID Scheduling Point (under Phase 1); Scheduling Hub (under Phase 2)
Primary Intertie ID Used for schedule tagging and scheduling limit constraints
Alternate Intertie ID Used for schedule tagging and scheduling limit constraints when the primary intertie is open and the Scheduling Coordinator has alternate scheduling agreement (dynamic transfer)
Bid Type Physical or virtual, supply (import) or demand (export), firm/non-firm, wheeling, etc.
Counterpart transaction ID
For wheel through transactions only
Numeric ID Integer-based ID provided by Scheduling Coordinator to help identify bid
13.2 Scheduling hub definitions under Phase 2 implementation
The ISO originally proposed to align the modeling of the FNM (at the BAA level) with scheduling
and pricing (also at the BAA level). This would have allowed the ISO to calculate a shadow
price for flow constraints from every BAA to every intertie. However, based on experience and
lessons learned from the eastern ISOs35, the CAISO proposes to limit the number of scheduling
and pricing points used to calculate the shadow price of the flow constraints by aggregating
most BAAs into two large scheduling hubs. The reason for this is because the source of an
35
See testimony from of Dr. Scott Harvey in Exhibit ISO-3 and referenced report in Exhibit ISO-4 in FERC Docket No. ER08-1113, June 17, 2008. Available at: http://www.caiso.com/Documents/June17_2008ProposedRevisions-tariffsre-IntegratedBalancingAuthorityAreainDocketNo_ER08-1113-000.pdf

California ISO Full Network Model Expansion Draft Final Proposal
CAISO/M&ID/DH 45 December 30, 2013
import listed on e-tags may not reflect the actual incremental generation that is moved to
provide the import. For example, a scheduling coordinator tags generator A as the source of an
ISO import. In reality, the scheduling coordinator may have previously planned for generator A
to serve load outside the ISO. Simultaneously, the scheduling coordinator schedules and tags
generator B as serving that load outside the ISO. The result is that generator B is the generator
dispatched up pursuant to the ISO import schedule while generator A is tagged as the source of
the ISO import. By consolidating the scheduling and pricing points to two major hubs, there is a
limit to how the scheduling coordinator in this example can reconfigure its portfolio to achieve
more favorable pricing.
The other ISOs’ experiences highlight the difficulty in associating a schedule’s source as
indicated on the relevant e-tag(s) with the actual generation that was incremented to support the
schedule, which may occur at another location. This disconnect would lead to a divergence
between the schedules calculated by the model and actual flows. This situation would be
exacerbated if there is a significant price differential between the two scheduling points. Again,
consolidating the scheduling and pricing points will not eliminate but can decrease the error in
modeled and actual flows.
The ISO considered an alternative proposal to aggregate all external BAAs into a single
scheduling hub. The ISO rejected this proposal as an overly conservative starting point.
Instead, we believe aggregating the majority of WECC into two major scheduling hubs provides
some flexibility while allowing the ISO to model schedules that will reflect actual flows with a
good measure of accuracy. While we expect the majority of e-tags to reflect the incremental
generator, the ISO will monitor the convergence between modeled flows and real-time flows.
The ISO expects data provided on e-tags to be accurate and in accordance with the North
American Energy Standards Board standards. During the Phase 2 stakeholder process, the
ISO will develop with stakeholders settlement or tagging rules, as appropriate, to reinforce the
expectation that e-tags should support schedules.
13.2.1 Scheduling hub and footprint definitions
Currently the ISO only defines scheduling points at the interties, which are used by scheduling
coordinators for submitting bids and for pricing the cleared bids. Phase 2 of the FNM expansion
will model external areas on a BAA footprint while scheduling and pricing may occur at a hub
that could be different than the BAA footprint. Table 17 below shows the three different types of
scheduling and pricing footprints introduced in this proposal.

California ISO Full Network Model Expansion Draft Final Proposal
CAISO/M&ID/DH 46 December 30, 2013
Table 17
Scheduling hubs and custom options
Scheduling hub (single BAA)
Scheduling hub (multiple BAAs)
Custom scheduling point or hub
Definition Single BAA that can be accurately modeled as radial
Aggregation of several BAAs
Custom point or hub based on detailed data exchanged with ISO
Example Comision Federal de Electricidad
North and South Can be single generator, part of BAA, or entire BAA
Physical and virtual bid submission in the integrated forward market
Submit at scheduling hub specifying intertie
Submit at scheduling hub specifying intertie
Submit at custom point or hub specifying intertie
Physical and virtual bid settlement in the integrated forward market
LMP calculated from scheduling hub to an intertie to reflect tie-specific congestion
LMP calculated from scheduling hub to an intertie to reflect tie-specific congestion
LMP calculated from custom point or hub to an intertie to reflect tie-specific congestion
Residual unit commitment and real-time
Physical bids only Physical bids only Physical bids only
The most basic scheduling hub contains only one BAA, which is also radially connected to the
ISO and not impacted by external loop flow. Thus, such a scheduling hub will have its
modeling, scheduling, and pricing footprints aligned at the BAA level. Comision Federal de
Electricidad will be modeled in this manner. For most BAAs, the modeling will be at the BAA
level but the scheduling and pricing will be aggregated to a scheduling hub. The scheduling
hubs are aggregations of BAAs and are discussed detail below. There is also the potential for
creating custom scheduling points or hubs. If the ISO receives more granular information from
interested and affected parties, a custom scheduling point or hub can be created with pricing
that reflects actual resources, through an interchange scheduling agreement. This is discussed
in more detail in Section 13.2.3.
In addition to the categories shown in Table 17, the EIM agreement will provide the ISO with
detailed modeling information so that we will know where generation within each EIM entity is
incrementing or decrementing to provide the schedules that clear the market. With this granular
information, we can allow nodal scheduling and pricing within each EIM entity in the real-time
market.36 We discuss integrated balancing authority areas in Section 13.2.4.
36
This is a simplified discussion of the EIM. Please see the separate EIM initiative for more details. http://www.caiso.com/informed/Pages/StakeholderProcesses/EnergyImbalanceMarket.aspx
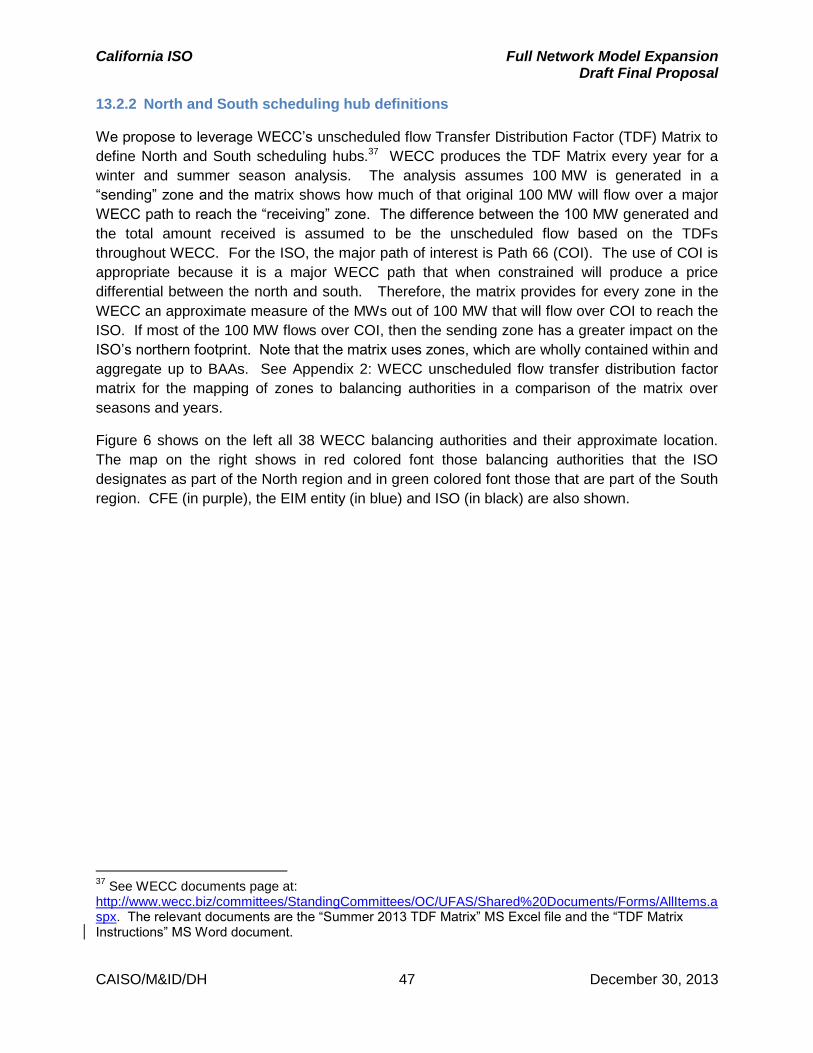
California ISO Full Network Model Expansion Draft Final Proposal
CAISO/M&ID/DH 47 December 30, 2013
13.2.2 North and South scheduling hub definitions
We propose to leverage WECC’s unscheduled flow Transfer Distribution Factor (TDF) Matrix to
define North and South scheduling hubs.37 WECC produces the TDF Matrix every year for a
winter and summer season analysis. The analysis assumes 100 MW is generated in a
“sending” zone and the matrix shows how much of that original 100 MW will flow over a major
WECC path to reach the “receiving” zone. The difference between the 100 MW generated and
the total amount received is assumed to be the unscheduled flow based on the TDFs
throughout WECC. For the ISO, the major path of interest is Path 66 (COI). The use of COI is
appropriate because it is a major WECC path that when constrained will produce a price
differential between the north and south. Therefore, the matrix provides for every zone in the
WECC an approximate measure of the MWs out of 100 MW that will flow over COI to reach the
ISO. If most of the 100 MW flows over COI, then the sending zone has a greater impact on the
ISO’s northern footprint. Note that the matrix uses zones, which are wholly contained within and
aggregate up to BAAs. See Appendix 2: WECC unscheduled flow transfer distribution factor
matrix for the mapping of zones to balancing authorities in a comparison of the matrix over
seasons and years.
Figure 6 shows on the left all 38 WECC balancing authorities and their approximate location.
The map on the right shows in red colored font those balancing authorities that the ISO
designates as part of the North region and in green colored font those that are part of the South
region. CFE (in purple), the EIM entity (in blue) and ISO (in black) are also shown.
37
See WECC documents page at: http://www.wecc.biz/committees/StandingCommittees/OC/UFAS/Shared%20Documents/Forms/AllItems.aspx. The relevant documents are the “Summer 2013 TDF Matrix” MS Excel file and the “TDF Matrix Instructions” MS Word document.
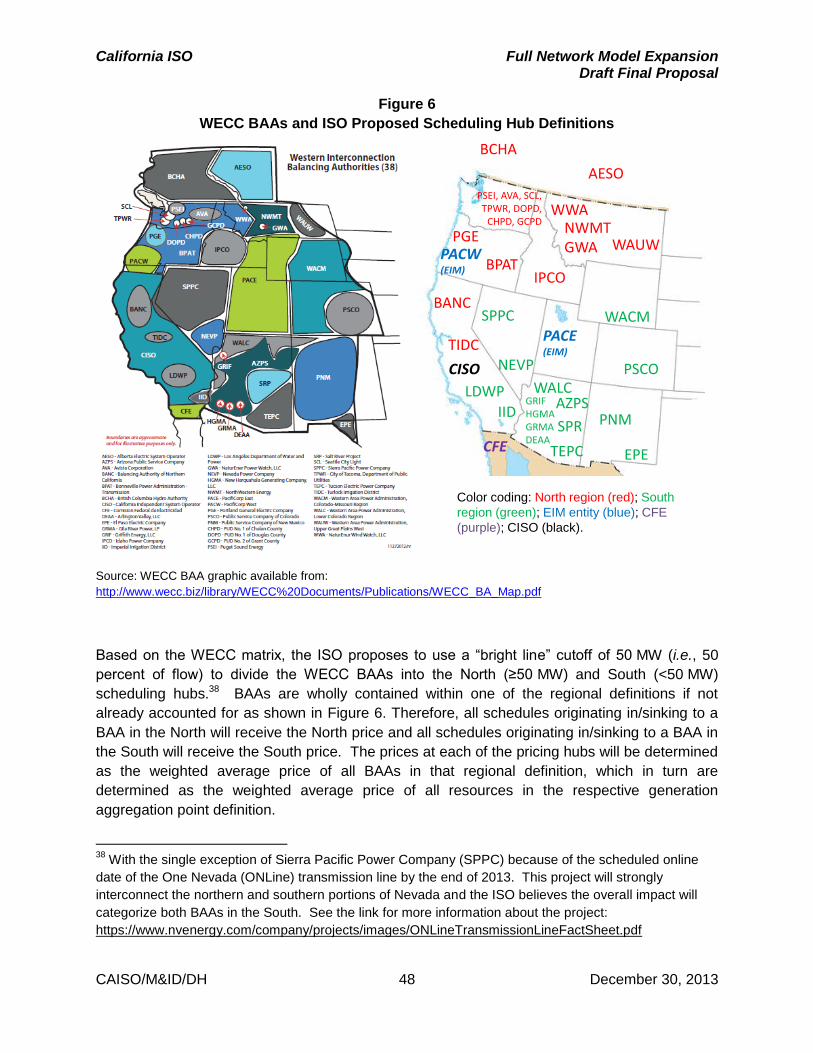
California ISO Full Network Model Expansion Draft Final Proposal
CAISO/M&ID/DH 48 December 30, 2013
Figure 6
WECC BAAs and ISO Proposed Scheduling Hub Definitions
Source: WECC BAA graphic available from:
http://www.wecc.biz/library/WECC%20Documents/Publications/WECC_BA_Map.pdf
Based on the WECC matrix, the ISO proposes to use a “bright line” cutoff of 50 MW (i.e., 50
percent of flow) to divide the WECC BAAs into the North (≥50 MW) and South (<50 MW)
scheduling hubs.38 BAAs are wholly contained within one of the regional definitions if not
already accounted for as shown in Figure 6. Therefore, all schedules originating in/sinking to a
BAA in the North will receive the North price and all schedules originating in/sinking to a BAA in
the South will receive the South price. The prices at each of the pricing hubs will be determined
as the weighted average price of all BAAs in that regional definition, which in turn are
determined as the weighted average price of all resources in the respective generation
aggregation point definition.
38
With the single exception of Sierra Pacific Power Company (SPPC) because of the scheduled online
date of the One Nevada (ONLine) transmission line by the end of 2013. This project will strongly
interconnect the northern and southern portions of Nevada and the ISO believes the overall impact will
categorize both BAAs in the South. See the link for more information about the project:
https://www.nvenergy.com/company/projects/images/ONLineTransmissionLineFactSheet.pdf
BCHA
AESO
NWMTGWA
WWA
WACM
PSCO
PNM
EPETEPC
SPR
AZPSWALC
PACE (EIM)
PACW (EIM)
CISO
CFE
IPCO
SPPC
NEVP
PGE
PSEI, AVA, SCL, TPWR, DOPD,
CHPD, GCPD
BPAT
GRIFHGMAGRMADEAA
BANC
TIDC
LDWP
IID
WAUW
Color coding: North region (red); South
region (green); EIM entity (blue); CFE
(purple); CISO (black).
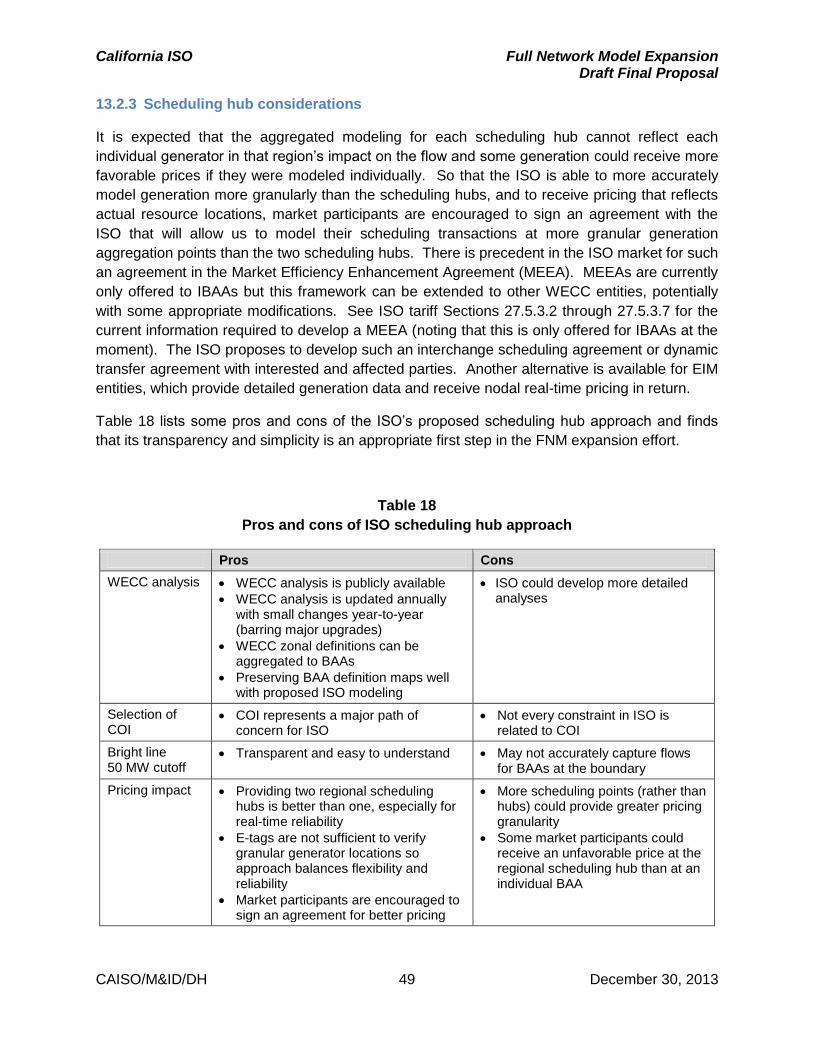
California ISO Full Network Model Expansion Draft Final Proposal
CAISO/M&ID/DH 49 December 30, 2013
13.2.3 Scheduling hub considerations
It is expected that the aggregated modeling for each scheduling hub cannot reflect each
individual generator in that region’s impact on the flow and some generation could receive more
favorable prices if they were modeled individually. So that the ISO is able to more accurately
model generation more granularly than the scheduling hubs, and to receive pricing that reflects
actual resource locations, market participants are encouraged to sign an agreement with the
ISO that will allow us to model their scheduling transactions at more granular generation
aggregation points than the two scheduling hubs. There is precedent in the ISO market for such
an agreement in the Market Efficiency Enhancement Agreement (MEEA). MEEAs are currently
only offered to IBAAs but this framework can be extended to other WECC entities, potentially
with some appropriate modifications. See ISO tariff Sections 27.5.3.2 through 27.5.3.7 for the
current information required to develop a MEEA (noting that this is only offered for IBAAs at the
moment). The ISO proposes to develop such an interchange scheduling agreement or dynamic
transfer agreement with interested and affected parties. Another alternative is available for EIM
entities, which provide detailed generation data and receive nodal real-time pricing in return.
Table 18 lists some pros and cons of the ISO’s proposed scheduling hub approach and finds
that its transparency and simplicity is an appropriate first step in the FNM expansion effort.
Table 18
Pros and cons of ISO scheduling hub approach
Pros Cons
WECC analysis WECC analysis is publicly available
WECC analysis is updated annually with small changes year-to-year (barring major upgrades)
WECC zonal definitions can be aggregated to BAAs
Preserving BAA definition maps well with proposed ISO modeling
ISO could develop more detailed analyses
Selection of COI
COI represents a major path of concern for ISO
Not every constraint in ISO is related to COI
Bright line 50 MW cutoff
Transparent and easy to understand May not accurately capture flows for BAAs at the boundary
Pricing impact Providing two regional scheduling hubs is better than one, especially for real-time reliability
E-tags are not sufficient to verify granular generator locations so approach balances flexibility and reliability
Market participants are encouraged to sign an agreement for better pricing
More scheduling points (rather than hubs) could provide greater pricing granularity
Some market participants could receive an unfavorable price at the regional scheduling hub than at an individual BAA
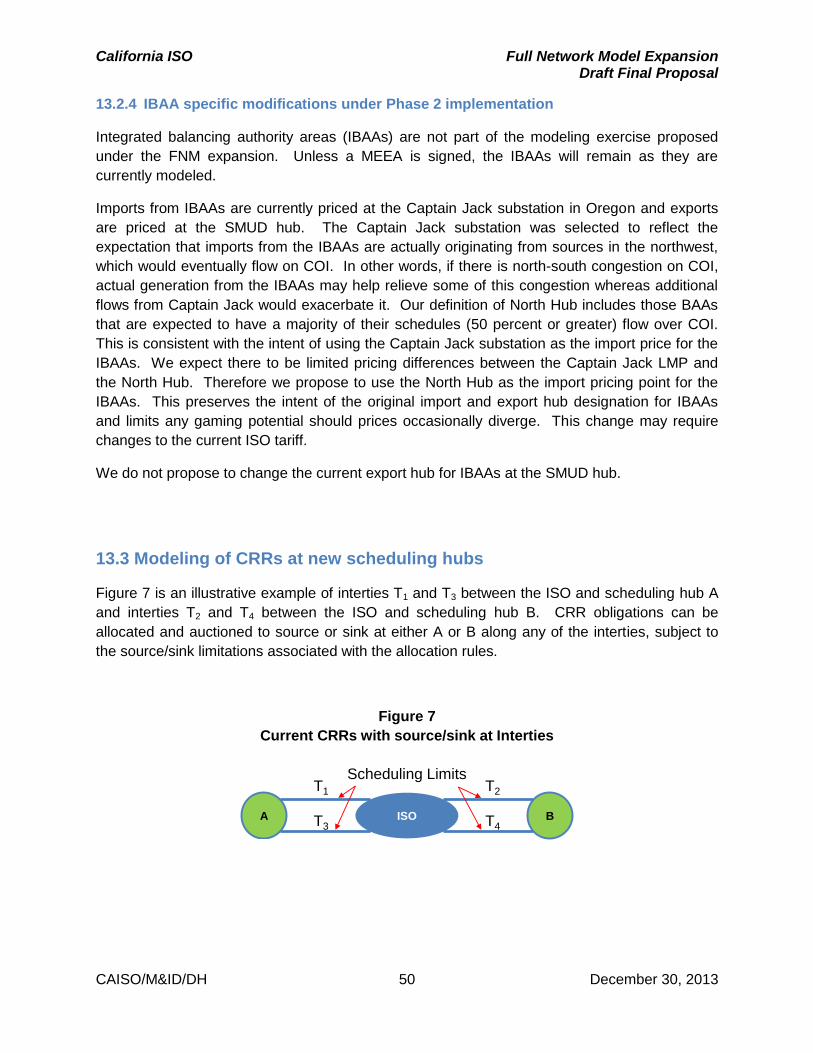
California ISO Full Network Model Expansion Draft Final Proposal
CAISO/M&ID/DH 50 December 30, 2013
13.2.4 IBAA specific modifications under Phase 2 implementation
Integrated balancing authority areas (IBAAs) are not part of the modeling exercise proposed
under the FNM expansion. Unless a MEEA is signed, the IBAAs will remain as they are
currently modeled.
Imports from IBAAs are currently priced at the Captain Jack substation in Oregon and exports
are priced at the SMUD hub. The Captain Jack substation was selected to reflect the
expectation that imports from the IBAAs are actually originating from sources in the northwest,
which would eventually flow on COI. In other words, if there is north-south congestion on COI,
actual generation from the IBAAs may help relieve some of this congestion whereas additional
flows from Captain Jack would exacerbate it. Our definition of North Hub includes those BAAs
that are expected to have a majority of their schedules (50 percent or greater) flow over COI.
This is consistent with the intent of using the Captain Jack substation as the import price for the
IBAAs. We expect there to be limited pricing differences between the Captain Jack LMP and
the North Hub. Therefore we propose to use the North Hub as the import pricing point for the
IBAAs. This preserves the intent of the original import and export hub designation for IBAAs
and limits any gaming potential should prices occasionally diverge. This change may require
changes to the current ISO tariff.
We do not propose to change the current export hub for IBAAs at the SMUD hub.
13.3 Modeling of CRRs at new scheduling hubs
Figure 7 is an illustrative example of interties T1 and T3 between the ISO and scheduling hub A
and interties T2 and T4 between the ISO and scheduling hub B. CRR obligations can be
allocated and auctioned to source or sink at either A or B along any of the interties, subject to
the source/sink limitations associated with the allocation rules.
Figure 7
Current CRRs with source/sink at Interties
A BISO
T1
T3
T2
T4
Scheduling Limits

California ISO Full Network Model Expansion Draft Final Proposal
CAISO/M&ID/DH 51 December 30, 2013
Figure 8 is an illustrative example of the new scheduling hubs under the FNM expansion. To
facilitate bidding, scheduling, settlement, and CRRs, multiple scheduling points will be defined
for each of these new scheduling hubs, one for each ISO intertie39 associated with the
respective scheduling hub for enforcing scheduling limits and submitting e-tags. (Refer also to
the discussion in Section 13.6 below.) Physical and virtual bids in the day-ahead market and
real-time market must be submitted at one of the scheduling hubs that is defined to a specific
ISO intertie, which will be used to enforce the applicable scheduling limit and for submitting e-
tags for the schedule that clears the relevant market. Virtual bids do not tag but the intertie
information is still required by the ISO. Therefore, these physical and virtual schedules will be
settled at the LMP of the relevant scheduling point, which may be different than the LMP of its
associated scheduling hub due to a binding scheduling limit on the relevant ISO intertie. The
scheduling points associated with the scheduling hub (i.e., the hub and intertie pair) may be
used as a CRR source or sink to provide the desired hedge for congestion cost in the day-
ahead market. Scheduling limits will be enforced for CRR bids and nominations at a scheduling
point on the associated intertie.
Figure 8, shows the scheduling points associated with two scheduling hubs: A and B.
Scheduling point A-T1 is associated with intertie T1 and scheduling point A-T3 is associated with
intertie T3. Similarly, scheduling point B-T2 is associated with intertie T2 and scheduling point B-
T4 is associated with intertie T4.
Figure 8
CRRs at new scheduling hubs and associated points under FNM expansion
For previously released seasonal and long term CRRs still in effect at the time of the expanded
FNM release, the ISO proposes to re-map existing CRRs at the interties to the new scheduling
hubs, which will become the ultimate CRR source or sink. Table 19 below shows the mapping
for each intertie and Cnode that allows CRRs to its corresponding CFE, North, or South Hub.
This mapping process will be performed in the same manner that APNode name changes or
retirements are handled in the current CRR process.
39 And EIM interties in general in real-time market.
A-T1 B-T2
A-T3 B-T4
A BISO
T1
T3
T2
T4
Physical LimitsScheduling Limits Scheduling Limits

California ISO Full Network Model Expansion Draft Final Proposal
CAISO/M&ID/DH 52 December 30, 2013
Table 19
Intertie to scheduling hub mapping
In previous papers an optional “bridging” mechanism had been proposed but upon further
consideration, this would complicate matters if one scheduling coordinator opted to bridge a
CRR and there did not exist a counterflow that was required in the original simultaneous
Hub Intertie Cnode
CFE CFE ROA-230_2_N101
CFE CFE TJI-230_2_N101
North WESTLYLBNS CAPTJACK_5_N003
North TRACY500 CAPTJACK_5_N015
North WESTLYTSLA CAPTJACK_5_N504
North TRACY500 CAPTJACK_5_N505
North TRACY230 CAPTJACK_5_N506
North RNCHLAKE CAPTJACK_5_N507
North RNCHLAKE CAPTJACK_5_N508
North LLNL CAPTJACK_5_N509
North CTW230 CAPTJACK_5_N510
North RDM230 CAPTJACK_5_N511
North COTPISO CAPTJACK_5_N512
North CASCADE CRAGVIEW_1_GN001
North PACI MALIN_5_N101
North NOB SYLMARDC_2_N501
South VEA AMARGOSA_1_SN001
South BLYTHE BLYTHE_1_N101
South IID-SCE COACHELV_2_N101
South IID-SDGE ELCENTRO_2_N001
South ELDORADO FOURCORN_3_N501
South ELDORADO FOURCORN_5_N501
South ADLANTO-SP GONDER_2_N501
South ADLANTO-SP INTERM1G_7_N501
South ADLANTO-SP MARKETPL_5_N501
South MCCULLGH MCCULLGH_5_N101
South ADLANTO-SP MCCULLGX_5_N501
South ADLANTO-SP MEAD_5_N501
South MEAD MEADN_2_N501
South MEAD MEADS_2_N101
South MERCHANT MERCHANT_2_N101
South ELDORADO MOENKOPI_5_N101
South ADLANTO-SP MONA_3_N501
South NGILABK4 NGILA1_5_N001
South NWEST NWEST_ASR-APND
South PALOVRDE PALOVRDE_ASR-APND
South PARKER PARKER_2_N101
South SILVERPK SLVRPS2_7_N001
South SUMMIT SUMMIT_ASR-APND
South SYLMAR-AC SYLMARLA_2_N501
South VICTVL VICTORVL_5_N101
South ADLANTO-SP WESTWING_5_N501
California ISO Full Network Model Expansion Draft Final Proposal
CAISO/M&ID/DH 53 December 30, 2013
feasibility test that did not elect the same bridging. To simplify the process, we will be applying
the re-mapping option only.
13.4 Examples
This section provides three illustrative examples of the market clearing process that will use the
expanded FNM. The first example will show how the ISO determines base schedules for each
BAA prior to the day-ahead and real-time market run as will be implemented in Phase 1. It then
explains how import and export schedules are superimposed on a base schedule (as an
increment and decrement, respectively) and how they are settled as will be implemented in
Phase 2. The second example explains how both scheduled and physical constraints are
enforced and what the results are with and without congestion on the interties as will be
implemented in Phase 1. The example provides the more complicated accounting under the
Phase 2 approach. Finally, the third example is about the HVDC model that will be
implemented in Phase 1. The example provides the more complicated accounting under the
Phase 2 approach. See Appendix 3: detailed calculation of hub price for more detailed
calculations of the locational marginal price at each hub that will be implemented in Phase 2.
13.4.1 Example 1: imports (exports) as incremental (decremental) to the base schedules
This example first describes how the base schedules are established. This process involves
distributing the demand forecast for each balancing authority area to load nodes using the
respective default load distribution factors. Similarly, the demand forecast net of any scheduled
interchanges (e.g., day-ahead schedules with the ISO or other balancing authority areas, prior
to the real-time market) will be distributed to the resources in each balancing authority area
based on historical generation patterns using generation distribution factors, or based on the
state estimator solution in the real-time market. The base schedule determination will include
information about resource and transmission outages and other relevant data to the extent they
are available. In the real-time market, the base schedules for the ISO are the day-ahead
schedules.
The ISO will then run an AC power flow with net interchange control for each BAA to maintain
its net schedule interchange. A distributed load slack will be used to distribute transmission
losses in each balancing authority area. The resultant adjusted base schedules will be used as
a reference in the subsequent market run.40
The ISO will then run its market performing congestion management for the ISO network and
ISO interties.41 Import and export schedules from bids at scheduling hubs that clear the market
will be modeled as incremental and decremental market adjustments, respectively, on the base
40
The process for determining and calculating adjusted base schedules is slightly different for EIM Entity BAAs in the RTM and it is described in detail in the EIM straw proposal. 41
Congestion management is also applicable to EIM Entity BAAs in the RTM.
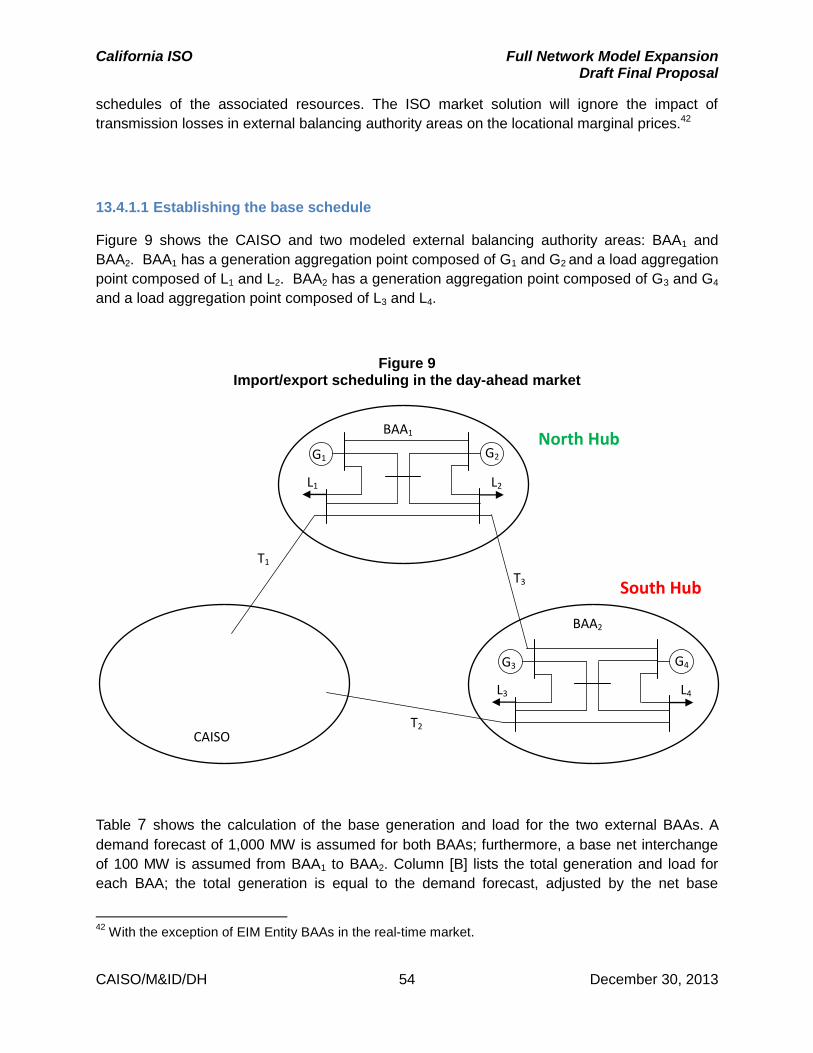
California ISO Full Network Model Expansion Draft Final Proposal
CAISO/M&ID/DH 54 December 30, 2013
schedules of the associated resources. The ISO market solution will ignore the impact of
transmission losses in external balancing authority areas on the locational marginal prices.42
13.4.1.1 Establishing the base schedule
Figure 9 shows the CAISO and two modeled external balancing authority areas: BAA1 and
BAA2. BAA1 has a generation aggregation point composed of G1 and G2 and a load aggregation
point composed of L1 and L2. BAA2 has a generation aggregation point composed of G3 and G4
and a load aggregation point composed of L3 and L4.
Figure 9 Import/export scheduling in the day-ahead market
Table 7 shows the calculation of the base generation and load for the two external BAAs. A
demand forecast of 1,000 MW is assumed for both BAAs; furthermore, a base net interchange
of 100 MW is assumed from BAA1 to BAA2. Column [B] lists the total generation and load for
each BAA; the total generation is equal to the demand forecast, adjusted by the net base
42
With the exception of EIM Entity BAAs in the real-time market.
CAISO
BAA1
BAA2
G1 G2
L1 L2
G3 G4
L3 L4
T1
T3
T2
North Hub
South Hub

California ISO Full Network Model Expansion Draft Final Proposal
CAISO/M&ID/DH 55 December 30, 2013
interchange; the demand forecast includes transmission losses. Column [C] shows the historical
generation distribution factors (GDF) and the historical load distribution factors (LDF) for each
BAA. Column [D] shows the distribution of the total generation and the demand forecast to the
resources and loads in each BAA based on the relevant historical distribution factors. As
mentioned earlier, historical GDFs and LDFs can be derived from the state estimator solutions
or received directly from the external BAA. Finally, column [E] shows the AC power flow
solution with a distributed load slack and net interchange control. The AC power flow adjusts
the load in each BAA (consistent with the LDFs) to absorb the transmission losses and maintain
the net base interchange. A 3% loss (30 MW) is assumed in each BAA. The AC power flow
solution yields the base generation and load schedules in each BAA at the resource level. Once
this base schedule is established, import/export schedules from/to each BAA are superimposed
on base generation schedules in the relevant BAA.
Table 20 Base generation and load schedules
BAA Total generation, demand forecast, and base net interchange
(MW)
GDF and LDF (%)
Distributed generation and demand using
GDF/LDF (MW)
AC power flow solution
(MW)
[A] [B] [C] [D] [E]
BAA1 = [B] x [C]
G1 1,100 60 660 660
G2 40 440 440
L1 1,000 50 500 485
L2 50 500 485
Losses n/a 30
NSI 100 100 100
BAA2
G3 900 40 360 360
G4 60 540 540
L3 1,000 50 500 485
L4 50 500 485
Losses n/a 30
NSI –100 –100 –100
13.4.2 Superimposing import and export schedules on the base generation schedules
Assume next that Scheduling Coordinator 1 (SC1) bids a 100 MW import from BAA1 at
$20/MWh, SC2 bids a 100 MW import from BAA1 at $25/MWh, SC3 bids a 100 MW import from
BAA2 at $30/MWh, and SC4 bids a 100 MW export to BAA2 at $50/MWh. Furthermore, SC1 and
SC3 declare intertie T1 and SC2 and SC4 declare intertie T2 for schedule tagging. The four bids
are identified as follows in Table 21 below. Note Resource IDs are not used to identify
import/export schedules. Instead, Transaction IDs will be generated to identify each bid so that
the information does not need to be kept in the Master File. Multiple SCs may submit bids at
each scheduling hub.

California ISO Full Network Model Expansion Draft Final Proposal
CAISO/M&ID/DH 56 December 30, 2013
Table 21 Import and export bids at scheduling hubs
Bid SC Bid ($/MWh)
Bid (MW)
Scheduling hub
Type Intertie
B1 SC1 20 100 BAA1 Import to ISO T1
B2 SC2 25 100 BAA1 Import to ISO T2
B3 SC3 30 100 BAA2 Import to ISO T1
B4 SC4 50 100 BAA2 Export from ISO T2
In the day-ahead optimization, the ISO will enforce both a scheduling and a physical flow
constraint for each intertie. This is discussed in detail in the next subsection.
If a bid clears the day-ahead market, the day-ahead schedule from that bid is distributed to the
physical resources based on the default GDFs of the respective generation aggregation point as
shown in Column [C] in Table 7 above. These GDFs are also used as weights in calculating the
aggregate LMP for each scheduling hub from the LMPs of all generating resources in that hub.
Assume the LMP at BAA1 is $26/MWh and reflects the North Hub. Assume the LMP at BAA2 is
$28/MWh and reflects the South Hub. For BAA1, this aggregate LMP is derived from the LMPs
at G1 and G2, weighted by the corresponding GDFs. Similarly for BAA2, the aggregate LMP is
derived from the LMPs at G3 and G4, weighted by the corresponding GDFs. We have simplified
this example to show only one BAA in each North or South region. For multiple BAAs in each
region, the LMP would reflect a weighted average price of all the generators in that region
weighted by GDFs for distribution throughout the regional footprint, not just the individual BAAs.
Given the bids submitted in Table 8 above, only B1 and B2 at BAA1, and B4 at BAA2 clear the
day-ahead market. Since bids B1 and B2 are accepted, the day-ahead interchange of BAA1 is a
200 MW import to ISO, in addition to the 100 MW base net interchange. Bid B4 is also accepted
as an export from ISO so the day-ahead interchange of BAA2 is a 100 MW import from ISO,
also in addition to the –100 MW base net interchange. It is important to note that the metering
end of ISO interties is at the ISO side of the intertie; therefore transmission losses on the ISO
interties are not part of the ISO net interchange.
These import and export schedules are then superimposed on the resource base schedules in
the relevant BAAs. Table 22 below shows as a starting point the base schedule (from Column
[E] in Table 8) in Column [B]. The net schedule interchange from the day-ahead market (DA
NSI inclusive of ISO bids) is shown in Column [C] and its distribution to the resources in each
BAA by the respective GDF is shown in Column [E]. Column [F] shows the result of
superimposing the day-ahead schedules on the base generation in each BAA. Lastly, Column
[G] shows the AC power flow solution with a distributed generation slack and net interchange
control to maintain the net scheduled interchange for each BAA. This results in an increase in
losses from 30 MW to 35 MW in BAA1 and a decrease in losses from 30 MW to 25 MW in BAA2.
The change in the losses is absorbed by the resources in each BAA according to the relevant
GDFs.

California ISO Full Network Model Expansion Draft Final Proposal
CAISO/M&ID/DH 57 December 30, 2013
Table 22 Imports (exports) incremental (decremental) to base schedule
BAA Base schedule
(MW)
DA NSI inclusive of ISO bids (MW)
GDF and LDF (%)
DA NSI distribution
based on GDF (MW)
Base and Day-
Ahead Schedules
(MW)
Loss adjustment in AC power flow (MW)
[A] [B] [C] [D] [E] [F] [G]
BAA1 = [C] x [D] = [B] + [E]
G1 660 200 60 120 780 783
G2 440 40 80 520 522
L1 485 50 485 485
L2 485 50 485 485
Losses 30 30 35
NSI 100 300 300 300
BAA2
G3 360 -100 40 –40 320 318
G4 540 60 –60 480 477
L3 485 50 485 485
L4 485 50 485 485
Losses 30 30 25
NSI –100 –200 –200 –200
The base schedules and the loss adjustment are not subject to settlement in the day-ahead
market; only the cleared bids are subject to day-ahead settlement. Therefore, bids B1 and B2 are
paid the day-ahead LMP at the BAA1 North Hub and bid B4 is charged the day-ahead LMP at
the BAA2 South Hub as shown in Table 9 below. SC1 should tag its schedule on intertie T1, and
SC2 and SC4 should tag their schedules on intertie T2.
Table 23 Settlement for cleared imports and exports
Bid SC Scheduling hub
Type Intertie Schedule (MW)
LMP ($/MWh)
Charge ($)
B1 SC1 BAA1 Import T1 100 26 –2,600
B2 SC2 BAA1 Import T2 100 26 –2,600
B3 SC3 BAA2 Import T1 0 28 0
B4 SC4 BAA2 Export T2 100 28 2,800
13.5 Example 2: enforcing scheduling and physical constraints on interties
Currently the ISO only enforces the scheduling constraint on interties with external BAAs as
shown on the left hand side of Figure 4. With FNM expansion, the ISO will enforce both
scheduling and physical constraints to improve the ISO’s day-ahead and real-time intertie

California ISO Full Network Model Expansion Draft Final Proposal
CAISO/M&ID/DH 58 December 30, 2013
congestion management, as shown on the right hand side of Figure 4. The two constraints will
be enforced at each ISO intertie to reflect:
c) The scheduling constraint that constrains the physical energy and ancillary services bids
from scheduling hubs when these bids declare the respective intertie for schedule
tagging; there are no shift factors used in these constraints. Both physical and virtual
bids will be considered in this constraint in the integrated forward market. Only physical
schedules will be considered in the residual unit commitment.
d) The physical flow constraint that constrains the schedule contributions from all physical
and virtual energy bids inside and outside of the CAISO grid; shift factors are used in
these constraints. Both physical and virtual bids will be considered in this constraint in
the integrated forward market. Only physical schedules will be considered in the
residual unit commitment.
Note that both the scheduling constraint and the physical constraint are limited by the same
operational limit of the intertie.
Figure 10 Current and expanded FNM constraint enforcement
The following example uses the same full network model topology from the example in Section
13.4 to show the intertie constraint formulation. The resources in Column [A] and GDFs in
Column [B] shown in Table 24 below are the same as provided in Table 7 earlier. Assume that
the shift factors (SF) from external resources to the ISO distributed load slack43 are as shown in
Table 24 Column [C] for intertie 1 (T1) and Column [E] for intertie 2 (T2). Column [D] shows the
aggregate SF for T1 and Column [F] the aggregate SF for T2. The rows for “Aggregate BAA1”
and “Aggregate BAA2” show the aggregate shift factor calculation for each BAA on the two ISO
interties.
43
The distributed load slack for the entire EIM footprint is used in RTM.
BAA1
Current FNM
Enforce scheduling
limit
BAA2 ISO
BAA1 Enforce
scheduling and physical limit
BAA2 ISO
With FNM expansion
North
South
North
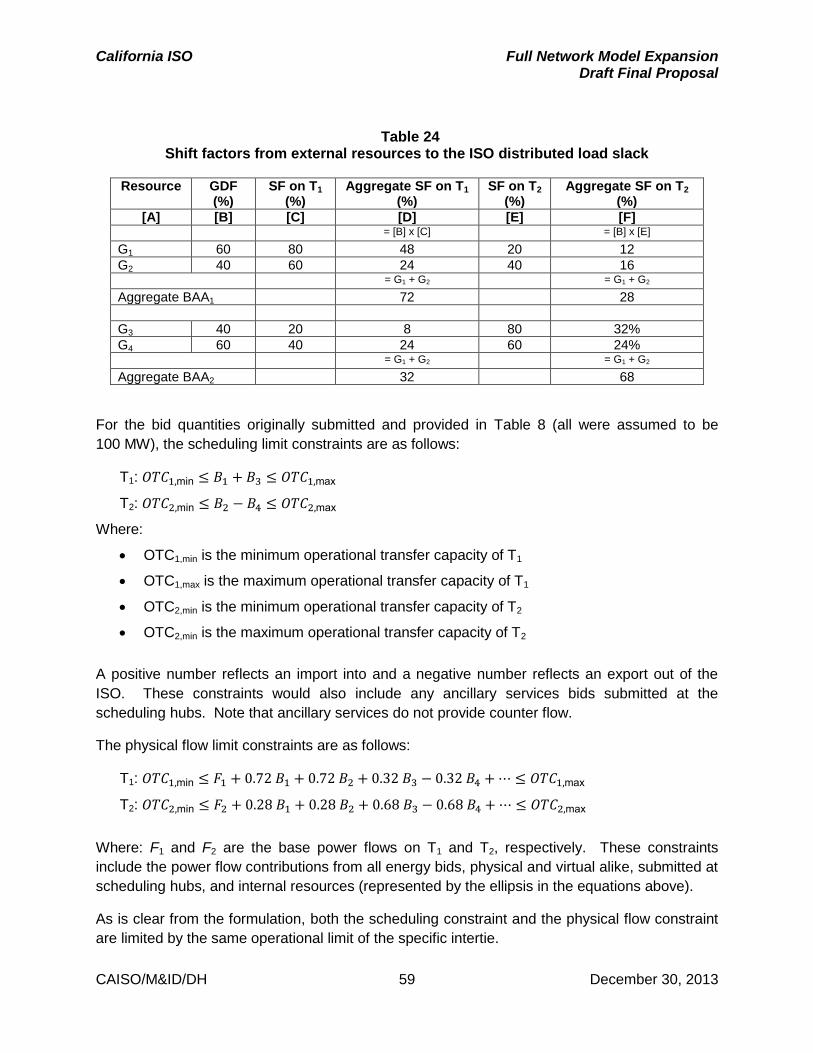
California ISO Full Network Model Expansion Draft Final Proposal
CAISO/M&ID/DH 59 December 30, 2013
Table 24 Shift factors from external resources to the ISO distributed load slack
Resource GDF (%)
SF on T1
(%)
Aggregate SF on T1
(%) SF on T2
(%) Aggregate SF on T2
(%)
[A] [B] [C] [D] [E] [F]
= [B] x [C] = [B] x [E]
G1 60 80 48 20 12
G2 40 60 24 40 16
= G1 + G2 = G1 + G2
Aggregate BAA1 72 28
G3 40 20 8 80 32%
G4 60 40 24 60 24%
= G1 + G2 = G1 + G2
Aggregate BAA2 32 68
For the bid quantities originally submitted and provided in Table 8 (all were assumed to be
100 MW), the scheduling limit constraints are as follows:
T1: 𝑂𝑇𝐶1,min ≤ 𝐵1 + 𝐵3 ≤ 𝑂𝑇𝐶1,max
T2: 𝑂𝑇𝐶2,min ≤ 𝐵2 − 𝐵4 ≤ 𝑂𝑇𝐶2,max
Where:
OTC1,min is the minimum operational transfer capacity of T1
OTC1,max is the maximum operational transfer capacity of T1
OTC2,min is the minimum operational transfer capacity of T2
OTC2,min is the maximum operational transfer capacity of T2
A positive number reflects an import into and a negative number reflects an export out of the
ISO. These constraints would also include any ancillary services bids submitted at the
scheduling hubs. Note that ancillary services do not provide counter flow.
The physical flow limit constraints are as follows:
T1: 𝑂𝑇𝐶1,min ≤ 𝐹1 + 0.72 𝐵1 + 0.72 𝐵2 + 0.32 𝐵3 − 0.32 𝐵4 + ⋯ ≤ 𝑂𝑇𝐶1,max
T2: 𝑂𝑇𝐶2,min ≤ 𝐹2 + 0.28 𝐵1 + 0.28 𝐵2 + 0.68 𝐵3 − 0.68 𝐵4 + ⋯ ≤ 𝑂𝑇𝐶2,max
Where: F1 and F2 are the base power flows on T1 and T2, respectively. These constraints
include the power flow contributions from all energy bids, physical and virtual alike, submitted at
scheduling hubs, and internal resources (represented by the ellipsis in the equations above).
As is clear from the formulation, both the scheduling constraint and the physical flow constraint
are limited by the same operational limit of the specific intertie.

California ISO Full Network Model Expansion Draft Final Proposal
CAISO/M&ID/DH 60 December 30, 2013
13.6 Example 2a: congestion on the interties
Examples 1 and 2 above have been simplified to assume that there is no scheduling congestion
on the interties. This is demonstrated from the LMPs in Table 9. For example, the LMPs for
scheduling hub BAA1 is $26/MWh for both interties T1 and T2. However, if the scheduling
constraint were to bind, it would create a shadow price that would lead to a price differential
between the intertie and the scheduling hub. In this example, the interties are considered to be
radial to the scheduling hub so T1 may bind while T2 does not. Table 10 below shows how the
intertie specific LMP from a scheduling hub may be different from the scheduling hub itself.
Table 25 LMPs with intertie congestion
LMP ($/MWh) at: No congestion Congestion on T1 Congestion on T2 Congestion on T1 and T2
Scheduling hub BAA1
26 26 26 26
Scheduling hub BAA1 to T1
26 21 26 21
Scheduling hub BAA1 to T2 26 26 24 24
Table 26 should be understood in conjunction with the scheduling hub discussion summarized
in Table 17. Note that a LMP differential only occurs when scheduling constraints bind. This is
because a physical constraint will impact all of the system equally whereas the scheduling limits
are specific to physical bids tagged to and virtual bids that specify that intertie. Therefore, Table
26 above notes that for physical bid settlement, the LMP will be calculated from the scheduling
hub to an intertie to reflect tie-specific congestion.
Figure 8 from the CRR discussion is reproduced below (relabeled as Figure 11) to illustrate the
example above with congestion (and to show how the CRR model and FNM are aligned).
Assume A and B are scheduling hubs, each with an LMP. The physical and scheduling
constraints on interties T1, T2, T3, and T4 are enforced. If there is congestion on each of the
interties, then a separate LMP will be calculated for each scheduling hub to intertie pair,
modeled as a radial connection. This is represented as scheduling points A-T1 and A-T3 for
scheduling hub A to interties T1 and T3, respectively, and B-T2 and B-T4 for scheduling hub B
to interties T2 and T4, respectively.

California ISO Full Network Model Expansion Draft Final Proposal
CAISO/M&ID/DH 61 December 30, 2013
Figure 11
CRRs at new aggregate scheduling points under FNM expansion
13.7 Example 3: high voltage direct current model
This example shows the proposed high voltage direct current (HVDC) model for scheduling
imports and exports. A HVDC link (T4 in blue) is added in the network example from Section
13.4, as shown in Figure 5 below. The converter stations C1 and C2 are in BAA1 and the ISO,
respectively. In other words, the HVDC link is an ISO intertie.
Figure 12 Proposed HVDC Scheduling
A-T1 B-T2
A-T3 B-T4
A BISO
T1
T3
T2
T4
Physical LimitsScheduling Limits Scheduling Limits
CAISO
BAA1
BAA2
G1 G2
L1 L2
G3 G4
L3 L4
T1
T3
T2
T4
C1
C2
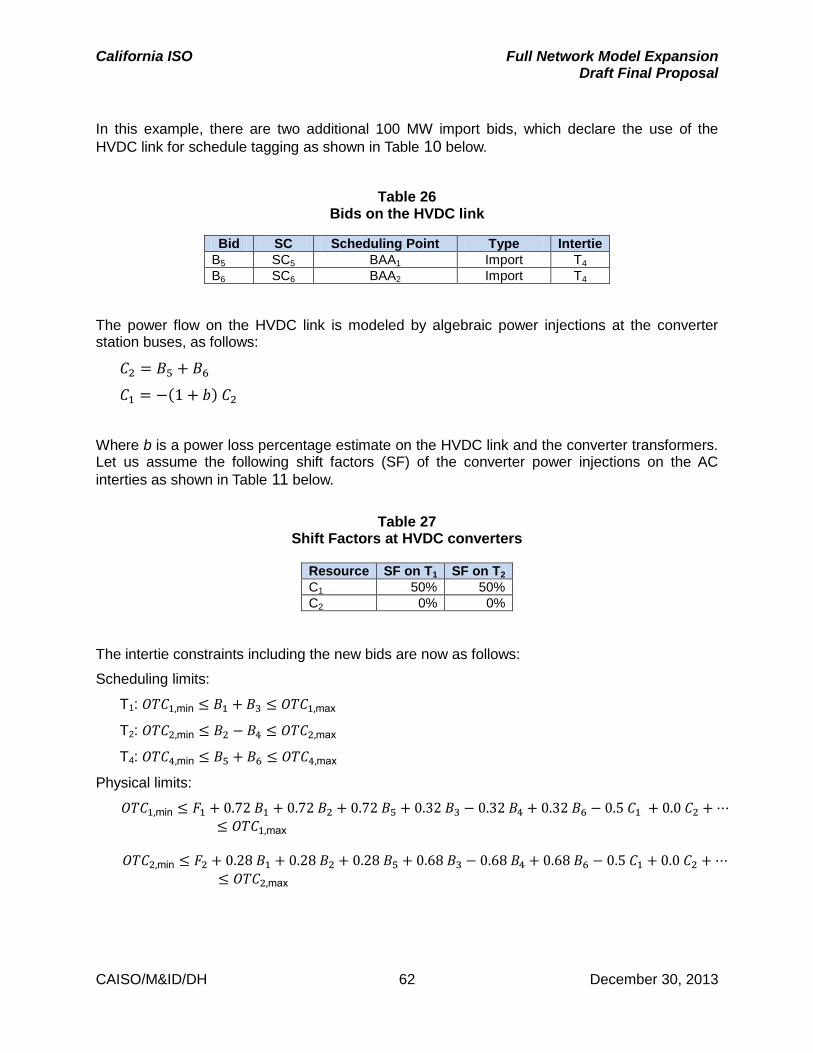
California ISO Full Network Model Expansion Draft Final Proposal
CAISO/M&ID/DH 62 December 30, 2013
In this example, there are two additional 100 MW import bids, which declare the use of the
HVDC link for schedule tagging as shown in Table 10 below.
Table 26 Bids on the HVDC link
Bid SC Scheduling Point Type Intertie
B5 SC5 BAA1 Import T4
B6 SC6 BAA2 Import T4
The power flow on the HVDC link is modeled by algebraic power injections at the converter station buses, as follows:
𝐶2 = 𝐵5 + 𝐵6
𝐶1 = −(1 + 𝑏) 𝐶2
Where b is a power loss percentage estimate on the HVDC link and the converter transformers. Let us assume the following shift factors (SF) of the converter power injections on the AC
interties as shown in Table 11 below.
Table 27
Shift Factors at HVDC converters
Resource SF on T1 SF on T2
C1 50% 50%
C2 0% 0%
The intertie constraints including the new bids are now as follows:
Scheduling limits:
T1: 𝑂𝑇𝐶1,min ≤ 𝐵1 + 𝐵3 ≤ 𝑂𝑇𝐶1,max
T2: 𝑂𝑇𝐶2,min ≤ 𝐵2 − 𝐵4 ≤ 𝑂𝑇𝐶2,max
T4: 𝑂𝑇𝐶4,min ≤ 𝐵5 + 𝐵6 ≤ 𝑂𝑇𝐶4,max
Physical limits:
𝑂𝑇𝐶1,min ≤ 𝐹1 + 0.72 𝐵1 + 0.72 𝐵2 + 0.72 𝐵5 + 0.32 𝐵3 − 0.32 𝐵4 + 0.32 𝐵6 − 0.5 𝐶1 + 0.0 𝐶2 + ⋯≤ 𝑂𝑇𝐶1,max
𝑂𝑇𝐶2,min ≤ 𝐹2 + 0.28 𝐵1 + 0.28 𝐵2 + 0.28 𝐵5 + 0.68 𝐵3 − 0.68 𝐵4 + 0.68 𝐵6 − 0.5 𝐶1 + 0.0 𝐶2 + ⋯≤ 𝑂𝑇𝐶2,max
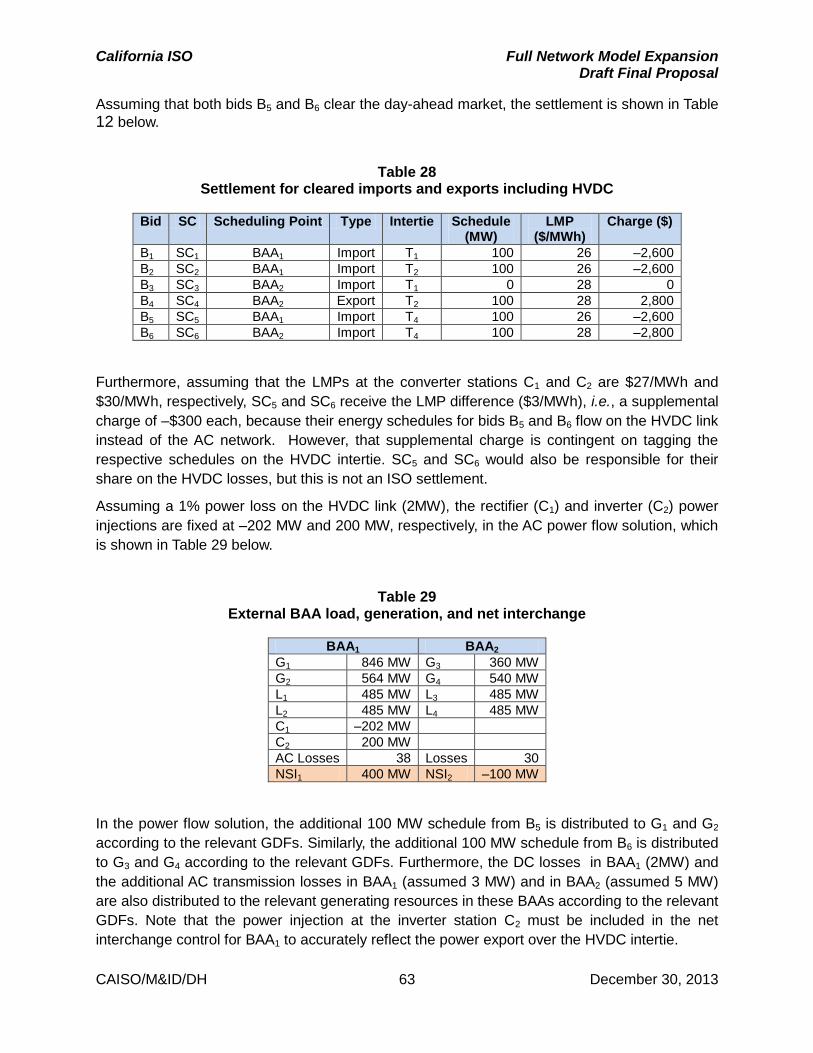
California ISO Full Network Model Expansion Draft Final Proposal
CAISO/M&ID/DH 63 December 30, 2013
Assuming that both bids B5 and B6 clear the day-ahead market, the settlement is shown in Table 12 below.
Table 28 Settlement for cleared imports and exports including HVDC
Bid SC Scheduling Point Type Intertie Schedule (MW)
LMP ($/MWh)
Charge ($)
B1 SC1 BAA1 Import T1 100 26 –2,600
B2 SC2 BAA1 Import T2 100 26 –2,600
B3 SC3 BAA2 Import T1 0 28 0
B4 SC4 BAA2 Export T2 100 28 2,800
B5 SC5 BAA1 Import T4 100 26 –2,600
B6 SC6 BAA2 Import T4 100 28 –2,800
Furthermore, assuming that the LMPs at the converter stations C1 and C2 are $27/MWh and
$30/MWh, respectively, SC5 and SC6 receive the LMP difference ($3/MWh), i.e., a supplemental
charge of –$300 each, because their energy schedules for bids B5 and B6 flow on the HVDC link
instead of the AC network. However, that supplemental charge is contingent on tagging the
respective schedules on the HVDC intertie. SC5 and SC6 would also be responsible for their
share on the HVDC losses, but this is not an ISO settlement.
Assuming a 1% power loss on the HVDC link (2MW), the rectifier (C1) and inverter (C2) power
injections are fixed at –202 MW and 200 MW, respectively, in the AC power flow solution, which
is shown in Table 29 below.
Table 29 External BAA load, generation, and net interchange
BAA1 BAA2
G1 846 MW G3 360 MW
G2 564 MW G4 540 MW
L1 485 MW L3 485 MW
L2 485 MW L4 485 MW
C1 –202 MW
C2 200 MW
AC Losses 38 Losses 30
NSI1 400 MW NSI2 –100 MW
In the power flow solution, the additional 100 MW schedule from B5 is distributed to G1 and G2
according to the relevant GDFs. Similarly, the additional 100 MW schedule from B6 is distributed
to G3 and G4 according to the relevant GDFs. Furthermore, the DC losses in BAA1 (2MW) and
the additional AC transmission losses in BAA1 (assumed 3 MW) and in BAA2 (assumed 5 MW)
are also distributed to the relevant generating resources in these BAAs according to the relevant
GDFs. Note that the power injection at the inverter station C2 must be included in the net
interchange control for BAA1 to accurately reflect the power export over the HVDC intertie.

California ISO Full Network Model Expansion Draft Final Proposal
CAISO/M&ID/DH 64 December 30, 2013
Appendix 2: WECC unscheduled flow transfer distribution factor matrix
WECC Unscheduled Flow Transfer Distribution Factor Matrix for Receiving in CAISO - comparison of seasonal and annual
2013 Summer 2012 Summer 2011 Summer Summer 2010 2009 Summer 2008 Summer 2007 Summer 2012-13 - Winter 2011-12 Winter 2010-2011 Winter 2009-10 Winter 2008-09 Winter
BAA
Unsch. Flow
zone ISO
N
ISO
S
ISO
N
ISO
S
ISO
N
ISO
S
ISO
N
ISO
S
ISO
N
ISO
S
ISO
N
ISO
S
ISO
N
ISO
S
ISO
N
ISO
S
ISO
N
ISO
S
ISO
N
ISO
S
ISO
N
ISO
S
ISO
N
ISO
S
AESO ALBERTA 87 75 87 75 86 75 87 77 88 77 88 77 88 77 87 76 86 74 87 75 88 77 88 77
AVA AVA 86 75 86 75 86 74 87 77 87 77 87 76 87 76 87 75 87 75 87 75 87 77 87 77
AVA COLSTRIP 81 69 81 70 81 69 82 72 82 72 82 72 82 72 82 70 82 70 82 70 82 72 83 72
AVA MIDC 87 76 87 76 87 75 88 77 88 78 88 78 88 78 88 76 88 76 88 76 88 78 88 78
AZPS AZEAST 21 9 21 9 21 10 20 9 19 9 20 9 20 9 22 10 21 10 22 10 20 10 20 10
AZPS AZSOUTH 20 8 20 8 20 8 19 8 18 8 19 8 19 8 20 9 20 9 21 9 19 8 19 8
A AZPS AZSOWEST 15 4 15 0 15 0 14 3 14 0 14 0 14 3 16 0 16 0 16 0 14 0 14 0
E AZPS FCNAREA 24 13 24 13 25 14 23 13 23 12 23 13 23 13 25 13 25 13 25 13 23 13 23 13
R AZPS FCNUNIT5 23 11 23 11 23 12 21 11 21 11 21 11 21 11 23 12 23 11 23 11 21 11 22 11
A AZPS PHOENIX 18 6 18 6 18 6 17 6 16 6 16 6 17 6 19 7 19 7 19 7 17 7 17 6
AZPS PVAREA 17 5 17 0 17 0 15 5 15 0 15 0 15 5 18 6 17 6 18 6 16 6 16 0
G BANC SMUD -1 -13 0 -12 0 -12 -1 -11 0 -11 0 -11 -1 -11 0 -12 0 -12 0 -12 0 -11 0 -11
N BCTC BC HYDRO 87 75 87 75 87 75 88 77 88 77 88 77 88 77 87 76 87 76 87 75 88 77 88 77
I BPA ASHE 88 76 87 76 87 76 88 78 88 78 88 78 88 78 88 76 88 76 88 76 88 78 89 78
D BPA BPA 87 76 87 76 87 76 88 78 88 78 88 78 88 77 88 76 88 76 88 76 88 78 89 78
N CFE CFE 14 3 14 0 14 0 13 2 13 0 13 0 13 2 15 0 15 0 15 0 13 0 14 0
E CISO ISON 0 -11 0 -11 0 -11 0 -10 0 -10 0 -10 0 -10 0 -11 0 -11 0 -11 0 -10 0 -10
S CISO ISOS 11 0 11 0 11 0 10 0 10 0 10 0 10 0 11 0 11 0 11 0 10 0 10 0
DOPD DOPD 87 75 87 76 87 75 88 77 88 78 88 78 88 77 88 76 88 76 87 76 88 77 88 78
EPE EPE 22 10 22 11 22 11 21 10 20 10 21 10 21 10 23 11 22 11 23 11 21 11 21 11
EPE EPEDC 25 13 25 13 25 14 24 13 23 13 23 13 23 13 25 14 25 13 25 13 24 13 24 13
IID IID 14 3 14 0 14 0 13 2 13 0 12 0 13 2 14 0 14 0 15 0 13 0 13 0
IPCO BRIDGER 66 54 66 54 65 54 69 58 69 59 69 59 70 60 67 55 66 55 66 54 69 58 70 59
IPCO IPC 78 66 78 66 77 66 80 69 81 70 81 70 80 70 79 68 79 67 79 67 81 70 81 71

California ISO Full Network Model Expansion Draft Final Proposal
CAISO/M&ID/DH 65 December 30, 2013
WECC Unscheduled Flow Transfer Distribution Factor Matrix for Receiving in CAISO - comparison of seasonal and annual
2013 Summer 2012 Summer 2011 Summer Summer 2010 2009 Summer 2008 Summer 2007 Summer 2012-13 - Winter 2011-12 Winter 2010-2011 Winter 2009-10 Winter 2008-09 Winter
BAA
Unsch. Flow
zone ISO
N
ISO
S
ISO
N
ISO
S
ISO
N
ISO
S
ISO
N
ISO
S
ISO
N
ISO
S
ISO
N
ISO
S
ISO
N
ISO
S
ISO
N
ISO
S
ISO
N
ISO
S
ISO
N
ISO
S
ISO
N
ISO
S
ISO
N
ISO
S
LDWP INTERMOU 56 44 56 44 55 43 53 42 53 42 53 42 53 42 57 45 56 45 56 44 52 41 53 43
LDWP LDWP 12 0 11 0 12 0 10 0 10 0 10 0 10 0 12 0 12 0 12 0 10 0 11 0
NEVP NEVP 16 5 16 0 16 0 14 4 14 0 14 0 14 4 17 0 17 0 17 0 15 0 15 0
NWMT NWMT 81 70 81 70 81 70 82 72 83 72 83 72 83 72 82 70 82 71 82 70 82 72 83 72
PACE BOZ/NEUT 54 42 54 42 53 42 52 42 53 42 53 42 53 42 54 43 54 42 54 43 52 42 53 43
A PACE FCNUNIT4 25 13 25 13 25 14 23 13 23 12 23 13 23 13 25 14 25 13 25 13 23 13 24 13
E PACE GLENCANY 21 9 21 10 21 10 20 10 20 10 20 10 21 10 22 11 22 10 23 11 21 10 21 11
R PACE PACE/ID 68 56 68 56 66 55 70 59 70 59 71 60 71 60 68 57 67 56 68 56 69 59 71 60
A PACE PACE/UT 55 44 55 43 54 43 51 41 52 41 51 41 52 41 56 44 55 44 55 43 51 40 51 41
PACE PACE/WYO 63 51 63 51 62 50 62 51 62 51 62 52 62 52 63 52 63 51 63 51 61 51 63 52
G PACW PACW/SOR 89 77 89 78 89 77 90 80 90 80 90 80 90 80 90 78 90 78 90 78 90 80 91 80
N PACW PACW/SWW 88 76 88 76 88 76 88 78 88 78 88 78 88 78 88 77 88 77 88 76 89 78 89 78
I PGE PGE 88 77 88 77 88 76 89 78 89 79 89 79 89 78 89 77 89 77 89 77 89 78 89 79
D PNM PNM 25 13 25 14 25 14 24 13 23 13 23 13 23 13 26 14 25 14 25 13 24 13 24 13
N PSCO COLO/NE 49 38 50 38 49 38 49 38 48 38 48 38 49 38 50 38 50 38 50 38 48 38 49 38
E PSCO COLO/SE 48 37 48 37 48 37 47 37 46 36 47 36 47 37 49 37 49 37 49 37 46 36 47 36
S PSCO CRG/HAY 48 36 48 37 48 36 47 37 47 36 47 37 47 37 49 37 48 37 49 37 46 36 47 37
PSE PSE 87 75 87 76 87 75 88 77 88 78 88 78 88 77 88 76 88 76 87 76 88 77 88 78
SCL SCL 87 75 87 75 86 75 87 77 87 77 87 77 87 77 87 76 87 75 87 75 88 77 88 77
SCL WKPL 87 75 87 75 86 75 87 77 87 77 87 77 87 77 87 76 87 75 87 75 87 77 88 77
SPPC SPP 72 61 72 61 73 61 73 62 73 63 73 63 73 62 72 60 74 62 73 61 72 62 73 63
SRP NAVAJO 17 5 17 0 17 0 15 5 15 0 15 0 15 5 17 6 17 0 17 0 15 0 15 0
TPWR TPWR 88 76 87 76 87 76 88 78 88 78 88 78 88 78 88 76 88 76 88 76 88 78 89 78
WACM COLO/SW 39 27 40 29 40 28 39 29 38 28 38 28 39 29 39 28 40 28 40 28 38 28 39 28
WACM WYO/CENT 60 48 60 48 59 48 59 49 60 49 60 50 60 50 60 49 60 48 60 48 60 49 60 50
WACM WYO/NE 61 50 62 50 62 50 62 52 61 51 61 51 61 51 62 50 63 51 62 50 63 52 62 51
WACM WYO/SE 53 41 53 42 53 42 53 42 53 42 53 42 53 43 54 42 54 42 54 42 52 42 53 42
WACM YTBIGHRN 72 61 72 61 72 60 73 63 74 64 74 64 74 64 73 61 73 61 73 61 73 63 74 64
WALC BLYE 14 3 14 0 14 0 13 2 14 0 14 0 14 3 15 0 7 0 15 0 14 0 14 0
WALC CALPINE 16 4 16 0 16 0 14 4 14 0 14 0 14 4 17 0 17 0 16 0 15 0 15 0
WALC HOOVER 16 4 16 0 16 0 14 3 14 0 14 0 14 3 16 0 16 0 16 0 14 0 14 0
WALC SUN 18 7 18 7 18 7 17 6 17 6 17 7 17 7 19 7 19 7 19 7 18 7 18 7
WALC WALCDAVS 16 4 16 0 16 0 14 4 14 0 14 0 14 4 16 0 16 0 16 0 15 0 15 0
WAUW WAUM 82 70 82 70 81 70 83 72 83 73 83 73 83 73 82 71 83 71 82 70 83 72 83 73
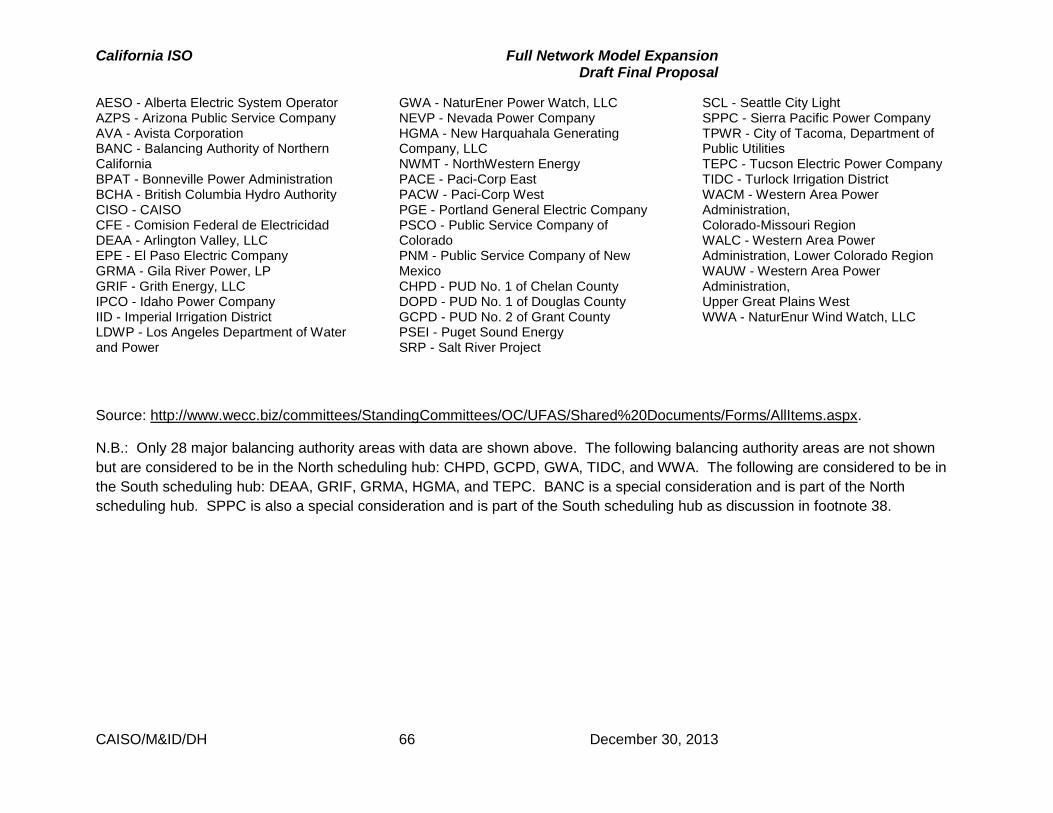
California ISO Full Network Model Expansion Draft Final Proposal
CAISO/M&ID/DH 66 December 30, 2013
AESO - Alberta Electric System Operator AZPS - Arizona Public Service Company AVA - Avista Corporation BANC - Balancing Authority of Northern California BPAT - Bonneville Power Administration BCHA - British Columbia Hydro Authority CISO - CAISO CFE - Comision Federal de Electricidad DEAA - Arlington Valley, LLC EPE - El Paso Electric Company GRMA - Gila River Power, LP GRIF - Grith Energy, LLC IPCO - Idaho Power Company IID - Imperial Irrigation District LDWP - Los Angeles Department of Water and Power
GWA - NaturEner Power Watch, LLC NEVP - Nevada Power Company HGMA - New Harquahala Generating Company, LLC NWMT - NorthWestern Energy PACE - Paci-Corp East PACW - Paci-Corp West PGE - Portland General Electric Company PSCO - Public Service Company of Colorado PNM - Public Service Company of New Mexico CHPD - PUD No. 1 of Chelan County DOPD - PUD No. 1 of Douglas County GCPD - PUD No. 2 of Grant County PSEI - Puget Sound Energy SRP - Salt River Project
SCL - Seattle City Light SPPC - Sierra Pacific Power Company TPWR - City of Tacoma, Department of Public Utilities TEPC - Tucson Electric Power Company TIDC - Turlock Irrigation District WACM - Western Area Power Administration, Colorado-Missouri Region WALC - Western Area Power Administration, Lower Colorado Region WAUW - Western Area Power Administration, Upper Great Plains West WWA - NaturEnur Wind Watch, LLC
Source: http://www.wecc.biz/committees/StandingCommittees/OC/UFAS/Shared%20Documents/Forms/AllItems.aspx.
N.B.: Only 28 major balancing authority areas with data are shown above. The following balancing authority areas are not shown
but are considered to be in the North scheduling hub: CHPD, GCPD, GWA, TIDC, and WWA. The following are considered to be in
the South scheduling hub: DEAA, GRIF, GRMA, HGMA, and TEPC. BANC is a special consideration and is part of the North
scheduling hub. SPPC is also a special consideration and is part of the South scheduling hub as discussion in footnote 38.

California ISO Full Network Model Expansion Draft Final Proposal
CAISO/M&ID/DH 67 December 30, 2013
Appendix 3: detailed calculation of hub price
Assumptions: A two intertie (T1 and T2), lossless world with one generator per BAA (BAA1 and
BAA2) and both BAA’s are in the North Scheduling Hub.
The following notation is used in this Appendix:
SFBAA1,t1 is the aggregate shift factor of BAA1 with respect to intertie T1
SFBAA1,t2 is the aggregate shift factor of BAA1 with respect to intertie T2
SFBAA2,t1 is the aggregate shift factor of BAA2 with respect to intertie T1
SFBAA2,t2 is the aggregate shift factor of BAA2 with respect to intertie T2
SFNhub,t1 is the aggregate shift factor of North Hub with respect to intertie T1
SFNhub,t2 is the aggregate shift factor of North Hub with respect to intertie T2
µ1p is the shadow price of the physical flow constraint on T1
µ2p is the shadow price of the physical flow constraint on T2
µ1s is the shadow price of the scheduling constraint on T1
µ2s is the shadow price of the scheduling constraint on T2
Recall, LMP = (System Marginal Energy Cost) + (Marginal Congestion Cost) + (Marginal Loss
Cost). The contribution from each binding constraint to the MCC is the negative product of the
shift factor (SF) and the shadow price (µ). The LMPs for each BAA is calculated just like
internal nodes.
BAA1 LMP = (SMEC) + (SFBAA1,t1 * µ1p + SF BAA1,t2 * µ2p) + (0)
BAA2 LMP = (SMEC) + (SFBAA2,t1 * µ1p + SF BAA2,t2 * µ2p) + (0)
Note that the shadow price is non-zero only when the constraint is binding at the optimal
solution.
Assume that we expect 80% of the energy to come from generation in BAA2 and 20% to come
from generation in BAA1.
GDF of BAA1 = 20%
GDF of BAA2 = 80%
The North Hub is calculated as the weighted average of these two BAAs.

California ISO Full Network Model Expansion Draft Final Proposal
CAISO/M&ID/DH 68 December 30, 2013
North Hub = [SMEC + SFBAA1,t1 * µ1p + SF BAA1,t2* µ2p] * 20% + [SMEC + SFBAA2,t1 * µ1p +
SF BAA2,t2 * µ2p] * 80%
Which is the same as:
North Hub = SMEC + SFNhub,t1 * µ1p + SF Nhub,t2 * µ2p
where the aggregate shift factors for the North Hub are the average of the BAA shift
factors weighted by the GDFs.
If the scheduling constraint on an intertie also binds, then that intertie price is bound by an extra
constraint, so the hub price separates for T1 and T2.
North HubT1price = SMEC + SFNhub,t1* µ1p + SF Nhub,t2* µ2p + µ1s
North HubT2price = SMEC + SFNhub,t1* µ1p + SF Nhub,t2* µ2p + µ2s
This calculation can be repeated for South Hub. The aggregate shift factor of South Hub with
respect to each of the interties will be different than North Hub but the shadow prices of the
physical flow constraints and the scheduling constraints with respect to T1 and T2 will be the
same.