full paper - click here
TRANSCRIPT

JOURNAL OF ENVIRONMENTAL HYDROLOGY
The Open Access Electronic Journal of the International Association for Environmental Hydrology
VOLUME 23 2015
ASSESSMENT OF GROUNDWATER RECHARGE AND DISCHARGEPROCESSES IN A LOESSICAL AQUIFER USING A NEW COMPUTER
CODE M. Blarasin 1
L. Maldonado 2
F. Becher Quinodoz 2
N. Alincastro 3
A. Cabrera 1
E. Matteoda 1
J. Giuliano Albo 2
1 Department of Geology, FCEFQyN. National University of Río Cuarto, Rio Cuarto, Argentina2 CONICET3 Telecommunications Engineer
Rio Cuarto city and its rural surrounding area (400 km2) shows two major geological environments,formed by eolian and fluvial sediments. The main source of groundwater recharge is precipitation (P),with an annual mean rainfall of 799 mm; 75-80% concentrated in spring and summer. The aim of thispaper is to show the water table behavior in the unconfined eolian aquifer (very fine sands and silts)taking into consideration recharge (R) and discharge (D) events. R was calculated using the watertable fluctuation method for a selected period (2002-2009) with a new computer code Likqo 1.0. Therecharge was estimated for both the hydrologic and calendar year. The first result was better accordingto the higher R-P regression coefficient obtained. It is important to highlight the recharge delay (daysor weeks) in relation to rain storms; a fact that can be linked to water table depth. The average R valuefor the entire series was 12% of P, the largest recharge occurring in the hydrologic periods 2002-2003and 2007-2008 (14% P) and the lowest in 2004-2005 (10 % P). The best correlation P-R occurs insummer (r 0.9) and autumn (r 0.8). There is a similar behavior of R between seasons, with slightdecrease in winter, when precipitation is scarce. However, low rates of actual evapotranspirationappear to be able to maintain the recharge process efficiency, which results in a water table rise duringwinter as was observed in 70% of the analyzed years. This effect can be related to delayed wettingfronts. The greatest value of groundwater discharge occurred in the 2005-2006 cycle (110 mm, 13.7%P). The ratio R/D was maximum and negative in 2005-2006, coinciding with the lowest recordedlevels. The ratio R/D for the total series was slightly negative, which means that aquifer discharge wasdominant, coinciding with the lowest position of the water table.
Journal of Environmental Hydrology 1 Volume 23 Paper 5 May 2015

INTRODUCTION AND OBJECTIVESKnowledge about aquifer recharge processes is basic in the development of management and
protection strategies for groundwater, since they are involved in the water abstraction for several usesand in ecosystems behavior (Vrba and Verhagen, 2011). Specifically, recharge processes in largeunconfined loessical aquifers of the Pampean plain must be described and quantified, not only toevaluate groundwater resources to be used but also because groundwater is susceptible tocontamination, which is able to reach the water table through recharge water (Giuliano Albo y Blarasin,2014).
In Río Cuarto city (Córdoba province) and its surrounding rural area (Figure 1) ground water studiesare carried out periodically due to the importance of the unconfined aquifer for urban and rural watersupply. Some results of these studies are presented in this paper whose main objective is to show theestimation of the recharge rate in the unconfined aquifer located in the eolian environment of the studyarea. The method employed was the water table fluctuation (WTF) method which was used with a newcomputer software. Several considerations in relation to the aquifer discharge were also included in thispaper.
MATERIALS AND METHODSThis research is based on regional hydrogeological data collected by the Geohydrology research
team of the Department of Geology at the National University of Río Cuarto (Blarasin et al, 2011,Blarasin et al 2014). Rainfall data and water table levels were collected and analyzed. Water tablefluctuations are being registered with a pressure sensor that was installed in a monitoring well by theend of 2001 (Figure 2). For this paper, an 8-year period (2002-2009) was selected in which animportant dry cycle occurred. The aquifer recharge was estimated using the known WTF methodfollowing the Healy (2010) suggestions. New software was developed (Liqko 1.0, Alincastro andAlgozino, 2010) as a calculation and graphic tool. This software was used for the analysis related towater table fluctuations, rainfall and recharge estimation. The software communicates with a MySQLdatabase, makes the calculations and then generates the output charts which can be saved in differentformats (JPG, JPEG, BMP, PNG and GIF). More specific aspects of the recharge quantification aregiven in the following paragraphs.
GEOLOGY, HYDROGEOLOGY AND CLIMATETwo major environments of different genesis, relief and lithology were identified: eolian and fluvial.
The first is a gentle to undulating plain, whose regional slope is of 1% to 2%, characterized by loessicalsediments (very fine sands and silts) (Figure 1). The second environment includes the area where theRio Cuarto river and the Santa Catalina stream flow. The typical fluvial geoforms of this environmentare associated to the different hydrodynamic stages of both streams (terraces, meanders and so on)while the typical sediments are silts, sand and gravels.
There are also two major hydrogeological environments: one in which the unconfined aquifer ishighly heterogeneous with medium-high hydraulic conductivity (modern fluvial area of the Río Cuartoriver, Unit 2.a, Figure 1) and the other in which the aquifer is homogeneous with low hydraulicconductivity (aeolian plain, Unit 1.a ). There are also other transition sectors such as 1.b (eolian withpaleo-channels) and 2.b (fine fluvial sediments and aeolian intercalations). The hydraulic parameters ofthe aquifer were defined according to the textural characteristics of the sediments and in situ aquifertests (Blarasin, 2003). In relation to the eolian environment, where water table fluctuation is evaluated
Journal of Environmental Hydrology 2 Volume 23 Paper 5 May 2015
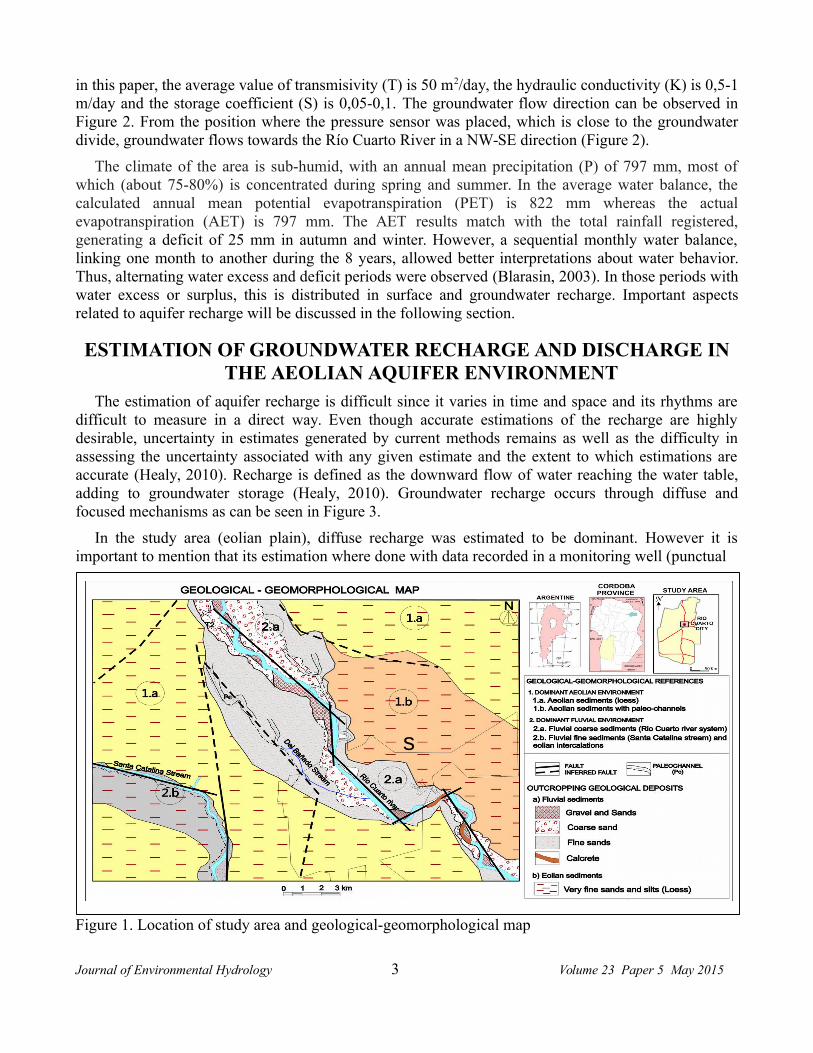
in this paper, the average value of transmisivity (T) is 50 m2/day, the hydraulic conductivity (K) is 0,5-1m/day and the storage coefficient (S) is 0,05-0,1. The groundwater flow direction can be observed inFigure 2. From the position where the pressure sensor was placed, which is close to the groundwaterdivide, groundwater flows towards the Río Cuarto River in a NW-SE direction (Figure 2).
The climate of the area is sub-humid, with an annual mean precipitation (P) of 797 mm, most ofwhich (about 75-80%) is concentrated during spring and summer. In the average water balance, thecalculated annual mean potential evapotranspiration (PET) is 822 mm whereas the actualevapotranspiration (AET) is 797 mm. The AET results match with the total rainfall registered,generating a deficit of 25 mm in autumn and winter. However, a sequential monthly water balance,linking one month to another during the 8 years, allowed better interpretations about water behavior.Thus, alternating water excess and deficit periods were observed (Blarasin, 2003). In those periods withwater excess or surplus, this is distributed in surface and groundwater recharge. Important aspectsrelated to aquifer recharge will be discussed in the following section.
ESTIMATION OF GROUNDWATER RECHARGE AND DISCHARGE INTHE AEOLIAN AQUIFER ENVIRONMENT
The estimation of aquifer recharge is difficult since it varies in time and space and its rhythms aredifficult to measure in a direct way. Even though accurate estimations of the recharge are highlydesirable, uncertainty in estimates generated by current methods remains as well as the difficulty inassessing the uncertainty associated with any given estimate and the extent to which estimations areaccurate (Healy, 2010). Recharge is defined as the downward flow of water reaching the water table,adding to groundwater storage (Healy, 2010). Groundwater recharge occurs through diffuse andfocused mechanisms as can be seen in Figure 3.
In the study area (eolian plain), diffuse recharge was estimated to be dominant. However it isimportant to mention that its estimation where done with data recorded in a monitoring well (punctual
Figure 1. Location of study area and geological-geomorphological map
Journal of Environmental Hydrology 3 Volume 23 Paper 5 May 2015
s

Figure 2. Potentiometric map of the study area (unconfined aquifer).
Figure 3. Types of aquifer recharge.
site) where the water level is being measured every 15 minutes. These data were re-calculated on adaily time step (an average of the measures taken daily) in order to use the same time step that isavailable for rainfalls. As was mentioned, the method applied was the WTF which is only applicable tounconfined aquifers. In these cases, it is not only necessary the constant monitoring of groundwaterlevel, but also effective porosity (equivalent to S in this type of aquifer) at the level fluctuation area. Itis important to check that the fluctuation levels are not affected by pumping or other causes whencalculation is being done.
Journal of Environmental Hydrology 4 Volume 23 Paper 5 May 2015

A water balance for the aquifer can be defined as follows: (Healy, 2010, Figure 4):
gw bf gw gw gwoff onS R Q ET Q Q (1)
where:
ΔSgw is change in saturated-zone storage (it includes all the changes that can occur at depths that arehigher than the zero-flux plane),
R is aquifer recharge rate,
Qbf is base flux,
ETgw is evapotranspiration from the aquifer and
Qgwoff and Qgw
on are water flow onto and off the aquifer, including pumping.
WTF is based on the premise that rises in groundwater levels in unconfined aquifers are due torecharge water arriving at the water table. If it is assumed that the amount of water available in acolumn of unitary base is as many times as S multiplied by the height of the water column, rechargecan be calculated as:
gw dh hS R Sy Sydt t (2)
where:
R: recharge,
Sy: specific yield,
h: water-table height and
t: time
According to Healy (2010) and in order to equation 2 be correct, it is assumed that the water thatreaches the water table becomes part of the groundwater storage; and that evapotranspiration from thegroundwater level, the contribution to the base flux or to the groundwater regional flux and otheroutputs or inputs to the groundwater system are zero.
Figure 4. Diagram through a watershed showing water budget components and directions of watermovement (Healy, 2010).
Journal of Environmental Hydrology 5 Volume 23 Paper 5 May 2015

There is a delay between the recharge contribution to the water table and its redistribution to otherterms, such as base flux or evapotranspiration. Therefore, if the method is applied during this delay, allthe water input will be recorded as recharge. This is valid especially in short lapses of time that rangefrom hours to a few days, although the method has been applied successfully in periods of years anddecades (Healy, 2010). In relation to time steps, Morgan and Stolt (2004) found that the rechargeestimated using weekly groundwater levels was 33% lower than the one calculated with those levelsmeasured every 30 minutes in the same well and period of time. In general it is recommended to havevalues with weekly or major frequencies.
If the WTF method is applied to every individual water-level rise, an estimation of the total or“gross” recharge can be made, where Δh is equal to the difference between the peak of the rise and thelowest point in the curves of the extrapolated antecedent recession curve at the time of the peak (Δhtotal or Δht) (Figure 5). The recession curve is the trace that the hydrograph would have followed in theabsence of a rise-producing precipitation. According to Scanlon et al. (2003) the effect of regionalgroundwater discharge is taken into account by this extrapolation. For the WTF method to produce avalue for total or “gross” recharge it requires application of Equation (2) for each individual water-levelrise and the corresponding recession curve. Equation (2) can also be applied over longer time intervals(seasonal or annual) to produce an estimate of change in subsurface storage, ΔSgw. This value issometimes referred to as “net” recharge (Healy and Cook, 2002) and is calculated in the same way,but considering the net storage change in the saturated zone for any time interval (days, months, years)and placing the value Δh in equation 2, which is the difference of the height between the beginning andthe end of the interval (Healy, 2010), Figure 5.
In this paper the rise of groundwater levels observed in the registered water level series(phreatigram) were considered and net recharge using Δh was calculated by Likqo 1.0, which makethe calculus employing Equation (2). This software permits to leave out any level rise that may be dueto factors other than the actual recharge. In this case, it was left out any value of change under 3 mmrelated to fluctuations linked with the equipment itself. This was evaluated in relation to constant waterlevels tests made in laboratory and checked with the equipment manufacturer.
Regarding to the storage coefficient S (effective porosity of the unconfined aquifer), the use of auniform value can produce errors in the estimations (Varni, 2002). In spite of this, the available averagevalue of S is used (Blarasin, 2003).
Figure 5. Measurements to be performed for the recharge estimation
Journal of Environmental Hydrology 6 Volume 23 Paper 5 May 2015
The depth of the water table is important in the analysis of the recharge (R). Normally, the applicationof the WTF method for estimating recharge requires identification of the water-level rises that areattributable to precipitation or surface water, which can be a difficult task (Healy, 2010). If theunsaturated zone is of small thickness, the water that percolates into the fractures can rapidly arrive tothe water table, and the recharge would thus be episodic, in response to rain events. Moreover, shallowdepths to the water table are also susceptible to discharge by evapotranspiration. Thick unsaturatedzones are less susceptible to having episodic recharge events and thus a stable recharge is expected tooccur. This can be explained by the fact that wetting fronts that go down the unsaturated zone tend tomove more slowly and several wetting fronts can join and become indistinguishable (Healy, 2010).Bearing in mind all these aspects, and the fact that depth to the water table was average 11.5 m at theplace where the measurements were done, it was decided to evaluate all the measurable water-rises thatare believed to be caused by the arrival of a wetting front.
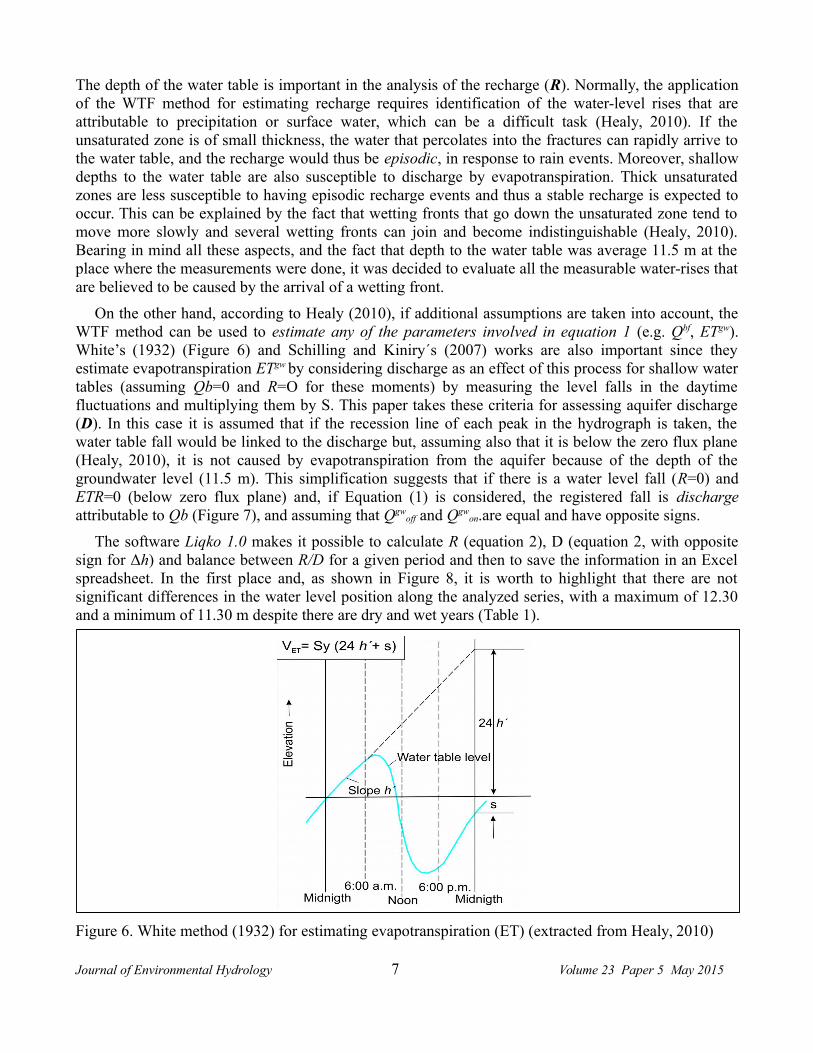
On the other hand, according to Healy (2010), if additional assumptions are taken into account, theWTF method can be used to estimate any of the parameters involved in equation 1 (e.g. Qbf, ETgw).White’s (1932) (Figure 6) and Schilling and Kiniry´s (2007) works are also important since theyestimate evapotranspiration ETgw by considering discharge as an effect of this process for shallow watertables (assuming Qb=0 and R=O for these moments) by measuring the level falls in the daytimefluctuations and multiplying them by S. This paper takes these criteria for assessing aquifer discharge(D). In this case it is assumed that if the recession line of each peak in the hydrograph is taken, thewater table fall would be linked to the discharge but, assuming also that it is below the zero flux plane(Healy, 2010), it is not caused by evapotranspiration from the aquifer because of the depth of thegroundwater level (11.5 m). This simplification suggests that if there is a water level fall (R=0) andETR=0 (below zero flux plane) and, if Equation (1) is considered, the registered fall is dischargeattributable to Qb (Figure 7), and assuming that Qgw
off and Qgwon.are equal and have opposite signs.
The software Liqko 1.0 makes it possible to calculate R (equation 2), D (equation 2, with oppositesign for Δh) and balance between R/D for a given period and then to save the information in an Excelspreadsheet. In the first place and, as shown in Figure 8, it is worth to highlight that there are notsignificant differences in the water level position along the analyzed series, with a maximum of 12.30and a minimum of 11.30 m despite there are dry and wet years (Table 1).
Figure 6. White method (1932) for estimating evapotranspiration (ET) (extracted from Healy, 2010)
Journal of Environmental Hydrology 7 Volume 23 Paper 5 May 2015
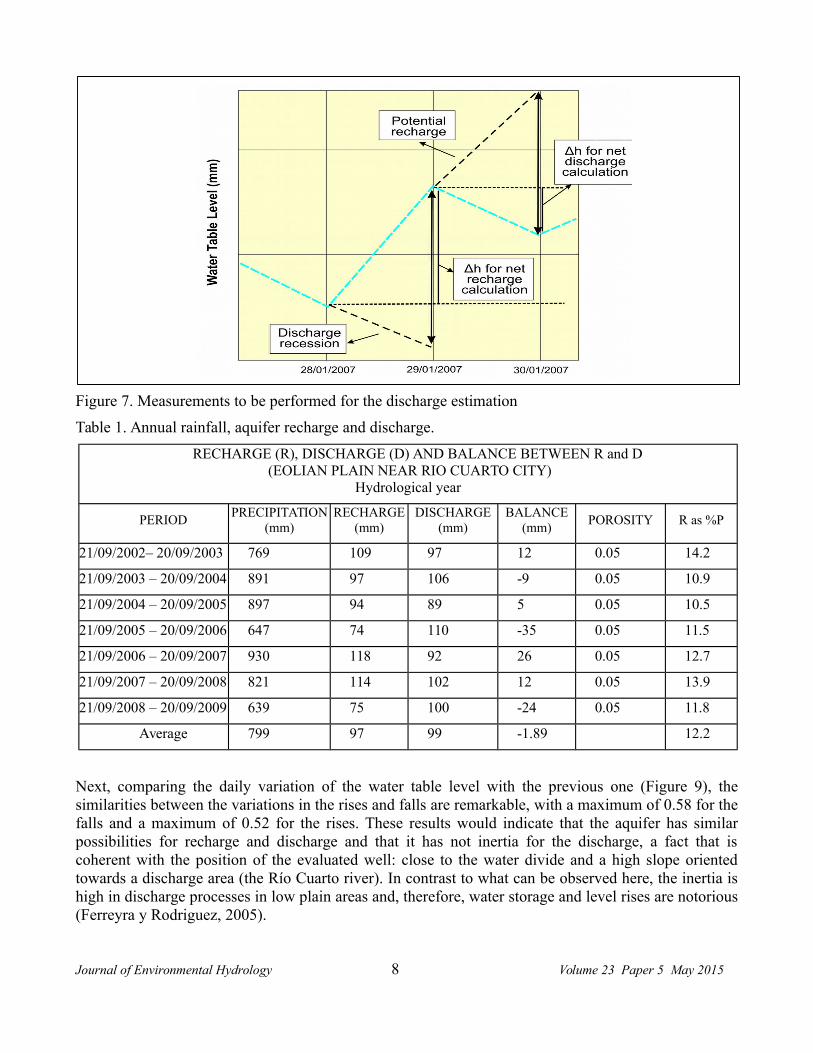
Figure 7. Measurements to be performed for the discharge estimation
Table 1. Annual rainfall, aquifer recharge and discharge.
RECHARGE (R), DISCHARGE (D) AND BALANCE BETWEEN R and D (EOLIAN PLAIN NEAR RIO CUARTO CITY)
Hydrological year
PERIODPRECIPITATION
(mm)RECHARGE
(mm)DISCHARGE
(mm)BALANCE
(mm)POROSITY R as %P
21/09/2002– 20/09/2003 769 109 97 12 0.05 14.2
21/09/2003 – 20/09/2004 891 97 106 -9 0.05 10.9
21/09/2004 – 20/09/2005 897 94 89 5 0.05 10.5
21/09/2005 – 20/09/2006 647 74 110 -35 0.05 11.5
21/09/2006 – 20/09/2007 930 118 92 26 0.05 12.7
21/09/2007 – 20/09/2008 821 114 102 12 0.05 13.9
21/09/2008 – 20/09/2009 639 75 100 -24 0.05 11.8
Average 799 97 99 -1.89 12.2
Next, comparing the daily variation of the water table level with the previous one (Figure 9), thesimilarities between the variations in the rises and falls are remarkable, with a maximum of 0.58 for thefalls and a maximum of 0.52 for the rises. These results would indicate that the aquifer has similarpossibilities for recharge and discharge and that it has not inertia for the discharge, a fact that iscoherent with the position of the evaluated well: close to the water divide and a high slope orientedtowards a discharge area (the Río Cuarto river). In contrast to what can be observed here, the inertia ishigh in discharge processes in low plain areas and, therefore, water storage and level rises are notorious(Ferreyra y Rodriguez, 2005).
Journal of Environmental Hydrology 8 Volume 23 Paper 5 May 2015
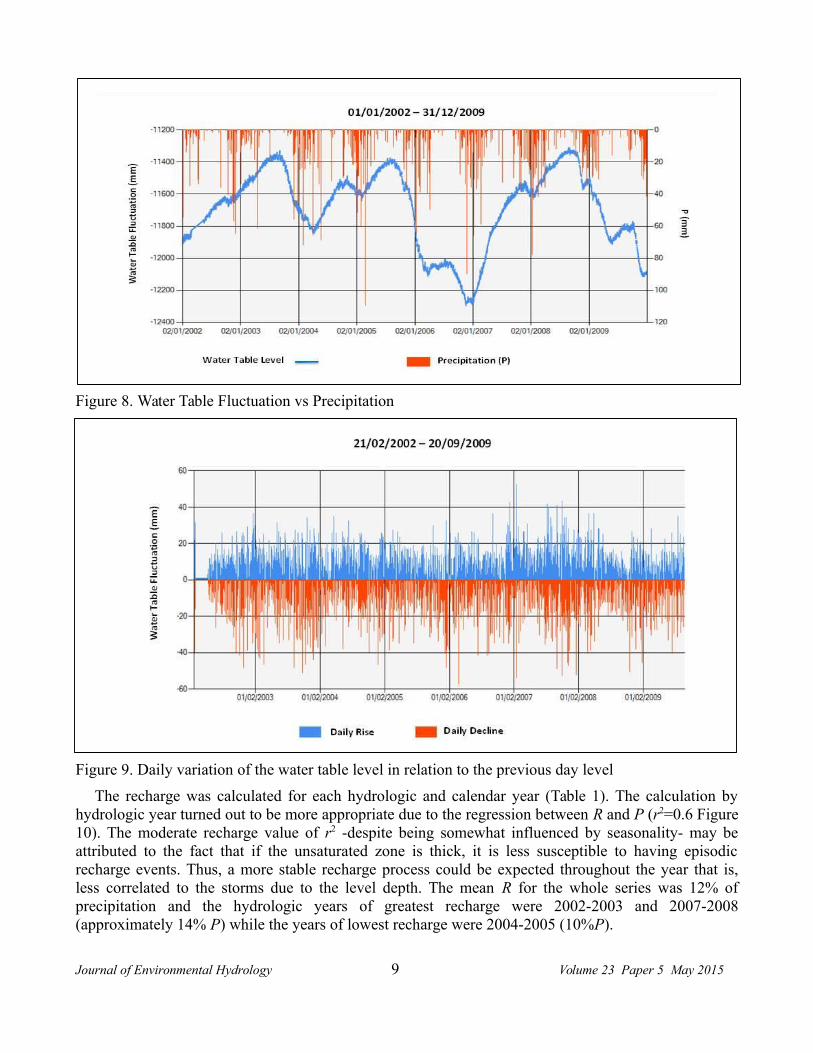
Figure 8. Water Table Fluctuation vs Precipitation
Figure 9. Daily variation of the water table level in relation to the previous day level
The recharge was calculated for each hydrologic and calendar year (Table 1). The calculation byhydrologic year turned out to be more appropriate due to the regression between R and P (r2=0.6 Figure10). The moderate recharge value of r2 -despite being somewhat influenced by seasonality- may beattributed to the fact that if the unsaturated zone is thick, it is less susceptible to having episodicrecharge events. Thus, a more stable recharge process could be expected throughout the year that is,less correlated to the storms due to the level depth. The mean R for the whole series was 12% ofprecipitation and the hydrologic years of greatest recharge were 2002-2003 and 2007-2008(approximately 14% P) while the years of lowest recharge were 2004-2005 (10%P).
Journal of Environmental Hydrology 9 Volume 23 Paper 5 May 2015

Figure 10. Relationship between rainfall and recharge
Similarities are observed in the behavior of the recharge between seasons (Figure 11) although there isa slight decline in winter when precipitations are scarce. However, efficiency in the recharge isobserved and it is interpreted as a result of delayed wetting fronts and the low rates of AET in thisseason. This may explain the high correlation between the Precipitation and Recharge in winter (Figure12), which accounts for an increasing water table level in 70% of the years under analysis (Figure 13).In spite of the fact that the seasonal differences of the recharge are not great, the best correlationbetween the annual P (hydrological year) and the aquifer recharge occurs in winter (r=0.9) and autumn(r= 0.8). This correlation goes down to r= 0.6 and 0.5 in spring and winter respectively. It is importantto show up the delay of the rises of the water table level (days or months) in relation to some storms, aphenomenon which can be attributable to the water table depth.
As explained earlier, the computer software Liqko 1.0 makes possible the calculation of the aquiferdischarge (D). The highest discharge (110 mm) was observed in the period 2005-2006 and the lowest(89 mm) in the period 2004-2005 (Table 1). The relation recharge-discharge (R/D) is maximum andnegative (-35 mm) in the period 2005-2006 (26 mm), which coincides with the maximum recorded
Figure 11. Recharge estimation for each season (hydrological year)
Journal of Environmental Hydrology 10 Volume 23 Paper 5 May 2015

Figure 12. Correlation between the Precipitation and Recharge (winter season).
level fall, and it is maximum positive in 2006-2007 (26 mm), which agrees with the maximum rises,when a water table level recovery is observed. The latter can be attributed to the fact that in July 2007there was an important snowfall (more than 30 cm) that lasted for a week (Figure 13). The ratio R/D forthe whole series was slightly negative (Table 1), which means that the aquifer discharge was dominant,a fact that is coherent with the lower position of the water table at the end of the series.
Finally, it is important to point out the fact that very similar values were obtained in the same place(the overall R value lying between 10-12% of P) when calculated with other methods (chlorides andtotal balance methods) for other similar humid-dry cycles (Blarasin, 2003).
Figure 13. Precipitation vs Recharge during 2006-2007 (hydrological year)
Journal of Environmental Hydrology 11 Volume 23 Paper 5 May 2015

CONCLUSIONSThe average aquifer recharge value for the entire series was 12% of precipitation, the highest
recharge occurring in the hydrological periods 2002-2003 and 2007-2008 (14%) and the lowest in2004-2005 (10 %).
The aquifer recharge was calculated for both the hydrological and calendar year, where the firstresulted more appropriate given the higher R-P correlation obtained (related to seasonal water tablerises). The best correlation of the annual P-R (hydrological year) occurs in summer (r 0.9) and autumn(r 0.8).
There is a similar behavior of R between seasons, with slight falls in winter, when P are scarce.However, low rates of actual evapotranspiration appear to be able to maintain the recharge processefficiency which results in a water table rise during winter as observed in 70% of the years underanalysis. This effect can be related to delayed wetting fronts. It is important to highlight the rechargedelay (2-6 days) in relation to what would be expected from storms; a fact that can be related to thedepth of the water table.
The new software Liqko 1.0 made the calculation of the aquifer discharge (D) possible. It showedthat the greatest value of groundwater discharge occurred in the 2005-2006 cycles, the highest recordedof 110 mm, 13.7% of P. The ratio R/D was slightly negative, which means that aquifer discharge wasdominant, coinciding with the lowest position of the water table at the end of the studied period.
Taking into account the easily management of the computer code, the calculus may be done veryquickly for different period of hydrological interest.
ACKNOWLEDGEMENTSThis paper was reviewed by Dr. Monica D´Elia and Dr. Marcela Perez from Faculty of Engineering
and Water Sciences (Litoral National University, Santa Fe, Argentina). This paper was financed by PID35 /08 Foncyt, Mincty Cba and UNRC.
REFERENCES
Alincastro N. y R. Algozino. 2010. Aplicación Liqko 1.0 para cálculo de recarga de aguas subterráneas.Práctica Profesional. Informe Inédito. UNRC.
Blarasin, M. 2003. Geohidrología ambiental de Sur de Córdoba, con énfasis en la ciudad de RíoCuarto y entorno rural. Tesis doctoral. UNRC. Inédita.
Blarasin M, A. Cabrera, F. Hildmman, E. Matteoda, F. Becher Quinodoz, M. J. Giuliano Albo y L.Maldonado. 2011. Fluorides in the phreatic aquifer of the loess plain. Córdoba, Arg. Journal ofEnvironmental Hydrology, Vol.19, Paper 17.
Blarasin M., A. Cabrera y E. Matteoda. 2014. Aguas subterráneas de la provincia de Córdoba. 147 P.Ed. UniRío. E-book.
Giuliano Albo M. J y M. Blarasin. 2014. Hidrogeoquímica y estimación del fondo natural de nitratosdel agua subterránea en un agroecosistema del pedemonte de la Sierra de Comechingones. Córdoba
Journal of Environmental Hydrology 12 Volume 23 Paper 5 May 2015

Argentina. Revista de la Asociación Geológica Argentina (RAGA). Ed. AGA. Vol.71 (3) pp. 378 -392.
Ferreira, C. G. y L. B. Rodríguez. 2005. Usos de niveles freáticos para la caracterización de larecarga/descarga. XX Congreso Nacional del Agua, Mendoza, Argentina.
Healy, R. 2010. Estimating groundwater recharge. Cambridge. University Press.
Healy, R. W. y P. G. Cook. 2002. Using groundwater levels to estimate recharge. HydrogeologyJournal. Vol 10 (1). pp. 91-109
Morgan C. y M. Stolt. 2004. A comparison of several approaches to monitor water table fluctuations.Soil Science Society American Journal. Vol. 68, pp. 562-566.
Schilling K. and J. Kiniry. 2007. Estimation of evapotranspiration by reed canarygrass using fieldobservations and model simulations. Hydrogeology Journal. Vol 337. pp. 356-363.
Varni, M. R. 2002. Determinación de la recarga mediante el método de fluctuación del nivel freático.En: G H D. Bocanegra et al. (Eds.) pp. 1525-1531.
Vrba J. and B. Verhagen. 2011. Groundwater for emergency situations. A methodological guide.IHP-VII Series on groundwater Nº 3. Division of Water Sciences. Unesco.Paris.
White, W. 1932. A method of estimating groundwater supplies based on discharge by plants andevaporation from soil: results of investigations in Escalante Valley, Utah. USGS, Water-SupplyPaper 659-A.
Scanlon, B. R., Dutton, A. R. and M. Sophocleous.. 2003. Groundwater recharge in Texas: TheUniversity of Texas at Austin, Bureau of Economic Geology. Submitted to Texas WaterDevelopment Board.
ADDRESS FOR CORRESPONDENCE
M. BlarasinDepartment of Geology, FCEFQyNNational University of Río CuartoRio Cuarto, Argentina
Email:[email protected]
Journal of Environmental Hydrology 13 Volume 23 Paper 5 May 2015