full report // june 2014 2014 long-term … › documents › resources › russell-asx...periods to...
TRANSCRIPT

FULL REPORT // JUNE 2014
2014 Long-termInvesting Report
Taking a long-term view of the historical investment landscape.

ASX is one of the world’s leading exchange groups.
• We operate a fully integrated exchange across multiple asset classes – equities, fixed income, derivatives and managed funds.
• We service a wide range of retail, institutional and corporate customers, directly and through intermediaries.
• We offer a broad range of services that allow our customers to invest, trade and manage risk. This includes listings, trading, post-trade services, and technical and information services.
• We operate infrastructure that supports the systemic stability of Australia’s financial markets and is critical for the efficient functioning of the nation’s economy, economic growth and position in the Asia Pacific region.
More information about ASX can be found at www.asx.com.au
Russell Investments (Russell) is a global asset manager and one of only a few firms that offers actively managed multi-asset portfolios and services that include advice, investments and implementation. Russell stands with institutional investors, financial advisors and individuals working with their advisors—using the firm’s core capabilities that extend across capital market insights, manager research, portfolio construction, portfolio implementation and indexes to help each achieve their desired investment outcomes.
Russell has more than $280 billion in assets under management (as of 31/3/2014) and works with over 2,500 institutional clients, independent distribution partners and individual investors globally. As a consultant to some of the largest pools of capital in the world, Russell has $2.4 trillion in assets under advisement (as of 31/12/2013). It has four decades of experience researching and selecting investment managers and meets annually with more than 2,200 managers around the world. Russell traded more than $1.6 trillion in 2013 through its implementation services business. Russell also calculates approximately 700,000 benchmarks daily covering 98% of the investable market globally, including more than 80 countries and more than 10,000 securities. Approximately $5.2 trillion in assets are benchmarked to the Russell Indexes, which have provided investors with 30 years of smarter beta.
For more information about how Russell helps to improve financial security for people, visit www.russell.com.au

1
Executive summary
Executive summaryWas 2013 a turning point?
Two significant changes emerged during the 2013 calendar year, driving differences between the results of the 2014 Russell Investments/ASX Long-term Investing Report and the 2013 update:
» Traditional government bond yields started rising in 2013 in Australia and globally;
» Relativities in share, currency and interest rate markets in Australia vs global counterparts started to change in 2013.
In our 2013 report, we noted that falling bond yields and strong economic growth in Australia, driven by the resources sector, contributed to very solid investment results for Australian investors in the 10 and 20 year periods to 31 December 2012. As this 2014 report remains focused on the longer time horizons, the results for the 10 and 20 year periods to 31 December 2013 continued to benefit from these themes. However, the 2014 report findings were also affected by the economic and market changes that emerged in the most recent 12 months.
1. Change in bond yieldsBond yields followed a long downward trajectory over the last two decades, as interest rates and inflation fell from near double-digit peaks in 1994 to historical lows. As local and global bond markets rallied, bond investors benefited from consistently higher returns over the 10 and 20 years to 31 December 2012.
However, we saw rates begin to rise from these lows which significantly depressed bond returns in 2013. Australian bonds returned only 2% for 2013 while global bond returns added 2.3%. Russell expects yields to continue to rise over the coming years, further depressing bond returns and potentially economic growth.
2. Will the Australian ‘triple treat’1 continue?Investors exposed to a number of Australian assets have enjoyed a ‘triple treat’ from investment returns relative to offshore assets, especially over the 10 years to 31 December 2012. However, relativities between domestic and global assets began to change in 2013.
a) Treat 1: Australian share market Australia has experienced less extreme share market
fluctuations in the lead up to and recovery from the global financial crisis – compared to our counterparts in the Northern Hemisphere – as strong resource sector activity offset weaker domestic growth.
However, the resources boom is now in a transition phase, moving from capital investment to production, with growth more sensitive to commodity price shocks and changes in demand. While the retail and housing sectors appear to be picking up some of the slack from mining, concerns still exist as to whether economic growth will continue at recent rates. In contrast, growth opportunities in a number of offshore economies are becoming more attractive. In 2013, Australian equities underperformed global equities (hedged) by 9%.
b) Treat 2: Australian currency and interest rate markets The Australian dollar doubled in value over the
past decade to 31 December 2012, as the boom in commodity prices and global risk appetites took the domestic currency from being very undervalued to very overvalued, albeit with significant volatility along the way. The dramatic currency appreciation protected hedged returns from offshore assets, while unhedged investments suffered.
We saw this reverse, most notably with the AUD falling 13% against the USD from USD 1.04 to 0.90 cents over the 12 months to 31 December 2013.
1. Refer to Russell Investments/ASX Long-term Investing Report 2013 for further details.
“In contrast, growth opportunities in a number of offshore economies are becoming more attractive.”

2
Australia has also enjoyed a relatively stable interest rate environment compared to the U.S. and Europe in recent years. Australian cash rates averaged between 3–5% over the past few years, reflecting a healthy economy, in contrast to the decline of rates to near zero levels in other developed markets.
However, this pattern also began to reverse in 2013, as the Reserve Bank of Australia (RBA) dropped rates to an historic low of 2.5% in August last year. Meanwhile, markets were expecting the next move for interest rates in the U.S. to be one of tightening, although many participants do not expect this to occur until mid 2015.
c) Treat 3: Australian residential investment property2 Australians’ love affair with bricks and mortar has seen
housing prices increase persistently over most of the last two decades.
This third ‘treat’ continued to boom in 2013. However, this has been accompanied by increasing fears of an overheated market, with regulators like the RBA monitoring conditions closely to avoid a property bubble like that experienced in other countries.
2. For the purpose of this report, Australian residential investment property refers to residential dwellings (such as houses, units, town houses, villas) held to earn rentals or for capital appreciation or both.
These findings are summarised as follows:› Australian shares outperformed hedged and unhedged
overseas shares in seven of the past 10 years. Hedged overseas shares outperformed unhedged overseas shares in eight out of the past 10 years. In both cases, this reflects a step in the opposite direction compared to last year’s results, reflecting the start of a potential reversal in 2 of the 3 Australian ‘triple treats’.
› The stronger equity markets of 2013 have boosted 10-year returns for domestic and global equities, and domestic and global listed property. Despite lacklustre bond returns, the diversified managed funds modelled in this analysis posted higher returns overall, especially for the funds with higher growth-asset exposures.
› The impact of tax continues to be lower for Australian shares and Australian residential investment property relative to global assets and defensive assets, due to dividend imputation and the tax deductibility of expenses respectively.
In Russell’s accompanying opinion piece “Seeing beyond biases”, we explore how investors should respond if the changes that emerged in 2013 mark the start of a new long-term paradigm shift or just a short-term phenomena caused by overexcited markets.
Analysis of the 2014 UpdateResults: 10 years to 31 December 2013In the year 2013, most asset classes produced strong returns and finished up the year in positive territory. International assets in particular had an outstanding year relative to domestic assets in 2013 due to U.S. Fed tapering, the falling Australian dollar (AUD) and good news coming out of major international economies.
Over the longer ten year period, all asset classes analysed in this report have performed well and produced positive returns. Like last year, Australian shares were still the best performing asset class over the ten year period.
“In Russell’s accompanying opinion piece “Seeing beyond biases”, we explore how investors should respond if the changes that emerged in 2013 mark the start of a new long-term paradigm shift or just a short-term phenomena caused by overexcited markets.”
3
Analysis of the 2014 Update
* Only before-tax returns have been calculated
Note: All returns are net of costs. Past performance is not a reliable indicator of future performance.
Australianlisted
property
Australianfixed
interest
Global fixed
interest (hedged)
Cash
Australianshares 9.2
6.1
2.0
6.2
7.5
8.2
3.7
5.1
6.4
6.3
7.4
7.5
Residentialinvestment
property
Globallisted
property(unhedged)
Conservativemanaged
fund*
Balancedmanaged
fund*
Growthmanaged
fund*
0 1 2 3 4 5 6 7 8 9 10
Global shares
(unhedged)
Global shares
(hedged)
Gross return
–– CPI (2.8% p.a. inflation)
Returns (% p.a.)
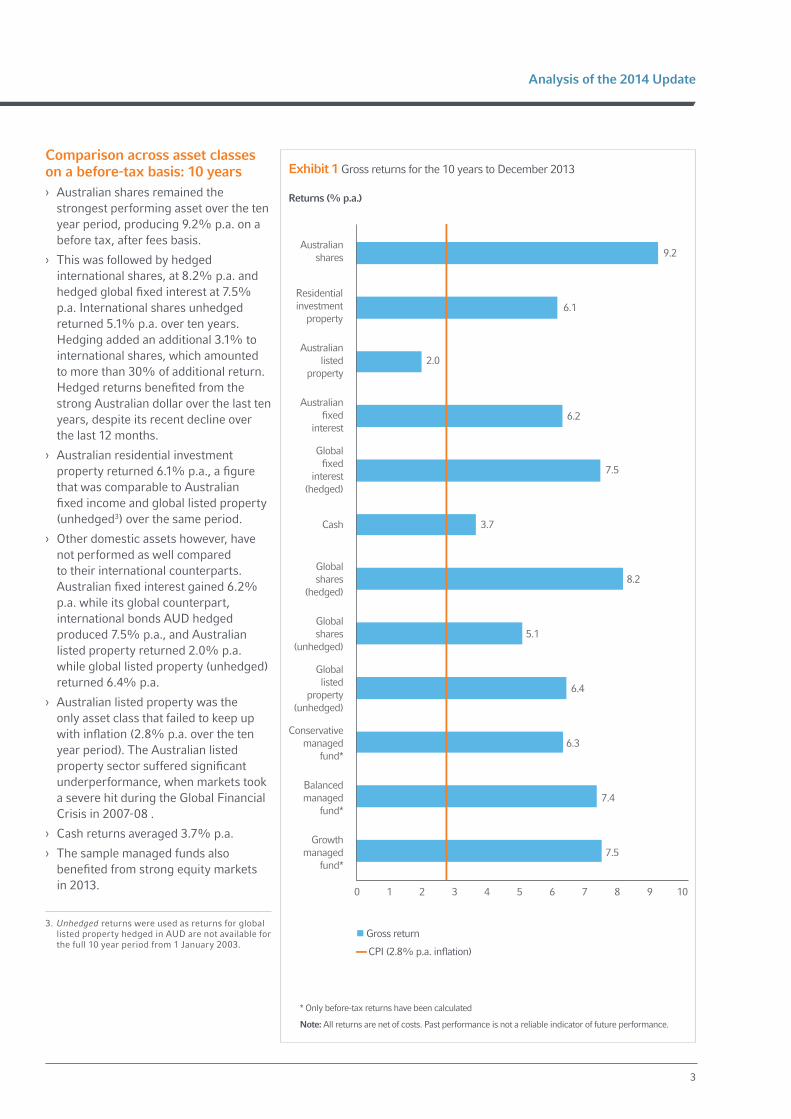
Exhibit 1 Gross returns for the 10 years to December 2013Comparison across asset classes on a before-tax basis: 10 years› Australian shares remained the
strongest performing asset over the ten year period, producing 9.2% p.a. on a before tax, after fees basis.
› This was followed by hedged international shares, at 8.2% p.a. and hedged global fixed interest at 7.5% p.a. International shares unhedged returned 5.1% p.a. over ten years. Hedging added an additional 3.1% to international shares, which amounted to more than 30% of additional return. Hedged returns benefited from the strong Australian dollar over the last ten years, despite its recent decline over the last 12 months.
› Australian residential investment property returned 6.1% p.a., a figure that was comparable to Australian fixed income and global listed property (unhedged3) over the same period.
› Other domestic assets however, have not performed as well compared to their international counterparts. Australian fixed interest gained 6.2% p.a. while its global counterpart, international bonds AUD hedged produced 7.5% p.a., and Australian listed property returned 2.0% p.a. while global listed property (unhedged) returned 6.4% p.a.
› Australian listed property was the only asset class that failed to keep up with inflation (2.8% p.a. over the ten year period). The Australian listed property sector suffered significant underperformance, when markets took a severe hit during the Global Financial Crisis in 2007-08 .
› Cash returns averaged 3.7% p.a.
› The sample managed funds also benefited from strong equity markets in 2013.
3. Unhedged returns were used as returns for global listed property hedged in AUD are not available for the full 10 year period from 1 January 2003.

4
Comparison across asset classes taking into account tax: 10 years› Absolute returns changed materially
when tax was incorporated into the analysis, because the impact of tax differed across different asset classes and geographies.
› Tax had less impact on Australian shares and Australian residential investment property compared to domestic defensive assets like bonds and cash for Australian investors. › Dividend imputation created an
additional source of return for those invested in Australian shares through franking credits, while tax deferral and capital gains also helped.
› Expenses that were tax deductable against income from residential investment property lowered overall taxes paid for this asset class.
› In contrast, returns from defensive assets were primarily taxed as income without concessions.
› This also meant that the impact of tax on Australian shares and residential investment property was lower than on global assets.
› In addition, the difference in after-tax returns between different types of investors in the same asset class illustrates the benefits of choosing the right investment structure. For example, the value of investing in Australian equities via a superannuation vehicle rather than investing directly was an additional 2.5% p.a. in returns compared to high marginal tax rate investors over ten years.
› The 1.5% Medicare levy increase from 1 July 2013 and the prospect of higher personal taxes in future years make the argument even more compelling to invest via super rather than directly.
Note: All returns are net of costs. Past performance is not a reliable indicator of future performance.
Australianlisted
property
Australianfixed
interest
Global fixed
interest (hedged)
Cash
Australianshares
6.45.5
5.64.1
5.14.4
4.43.2
8.27.2
7.35.8
3.73.0
3.11.9
7.56.2
6.33.9
6.25.1
5.33.3
2.01.7
1.71.1
6.15.4
5.44.2
9.29.4
9.67.1
Residentialinvestment
property
Globallisted
property(unhedged)
0 1 2 3 4 5 6 7 8 9 10
Global shares
(unhedged)
Global shares
(hedged)
Returns (% p.a.)
Exhibit 2 Before & After Tax Returns for 10 Years to December 2013
Superannuation
–– CPI (2.8% p.a. inflation)
Gross return
After Tax Lowest Marginal Tax Rate
After Tax Highest Marginal Tax Rate

5
Analysis of the 2014 Update
Comparison with last year’s gross returns: 10 years› Comparing the 10 year results to 31
December 2012 and 31 December 2013 on a gross basis, last year’s ‘winner’, Australian equities, kept their top spot, producing 9.2% p.a. over 10 years. Global equities (hedged) remained in second place this year at 8.2% p.a.
› Both Australian and global equities had a very strong 2013, driven by U.S. Fed’s decision to taper, as well as positive economic news around the world. The Fed’s decision to begin reducing its monthly asset purchases program was interpreted as a sign that the world’s largest economy was beginning to gather momentum.
› Global shares unhedged moved up two spots, finishing ten years at 5.1% p.a. to 2013. This was compared to last year’s ten-year return at 1.4% p.a. Unhedged shares had a phenomenal year in 2013, returning over 43% in the last twelve months alone, but relatively weaker returns over the earlier years in the 10 year period detracted from the overall ranking.
› Rankings for Australian fixed interest and cash changed little. Australian fixed interest returned 6.2% p.a. compared to 6.3% p.a. last year over the ten year period while cash returned 3.7% p.a. compared to 3.8% p.a. last year, over the ten-year period. Global fixed interest remained at third place in 2012 and 2013 returning 7.9% p.a. and 7.5% p.a. respectively over the ten year periods.
› Over in the listed property space, Australian listed property dropped one place after finishing ten years at 2.0% p.a., while Australian residential investment property dropped two places from last year. The asset class finished ten years at 6.5% p.a. versus 6.1% p.a. for ten years ended 2012 and 2013 respectively. Global listed property (unhedged) was up two places compared to last year, finishing ten years at 6.4% p.a, relative to 4.9% p.a. last year.
* Only the before-tax returns have been calculated
Note: All returns are net of costs. Past performance is not a reliable indicator of future performance.
Australianlisted
property
Australianfixed
interest
Global fixed
interest (hedged)
Cash
Australianshares
2.82.8
7.56.5
7.46.7
6.36.1
8.28.2
3.73.8
6.44.9
5.11.4
7.57.9
6.26.3
2.02.1
6.16.5
9.28.9
Residentialinvestment
property
Globallisted
property(unhedged)
CPI
Global shares
(unhedged)
Global shares
(hedged)
Returns (% p.a.)
Exhibit 3 10 years to December 2013 vs December 2012
10 years to December 2013
10 years to December 2012
Conservativemanaged
fund*
Balancedmanaged
fund*
Growthmanaged
fund*
0 1 2 3 4 5 6 7 8 9 10

6
Comparison with and without gearing: 10 years› When we incorporated borrowed funds
into the analysis, gearing enhanced returns for Australian shares for investors at the highest and lowest marginal tax rates.
› Both groups of investors benefited from receiving a higher amount of franking credits on the geared portfolio. Investors were significantly overcompensated for the additional costs of gearing the portfolio, by the extra franking credits received as a proportion of the capital outlay.
› For investors with residential investment property, the low interest rate environment has kept borrowing costs low, and gearing-related tax deductions were modest. However, these did not decrease as much proportionally as the decline in rental yields and capital gains for the 10 year period to 31 December 2013.
› Thus, total returns on residential property for lower marginal tax investors were lower after gearing compared to investors who owned the full initial outlay (no gearing), because the cost of the borrowing was not fully offset by rental income and tax deductions. The greater tax deductions available to higher marginal tax rate investors meant that gearing marginally boosted their returns.
› Australian shares continued to outperform residential property for the lowest and the top marginal tax rates after gearing was taken into account. This finding was consistent with last year’s findings.
Note: All returns are net of costs. Past performance is not a reliable indicator of future performance.
9.4
11.1
4.4
5.4
7.1
4.2
9.0
4.3
Exhibit 4 Investment Returns for 10 Years to December 2013
Returns (% p.a.)
No gearing 50% gearing on initial investment
0
1
2
3
4
5
6
7
8
9
12
11
10
After Tax Lowest Marginal
Tax Rate
After Tax Top Marginal
Tax Rate
After Tax Lowest Marginal
Tax Rate
After Tax Top Marginal
Tax Rate
Australian Shares
Residential Investment Property

7
Analysis of the 2014 Update
20 years to 31 December 2013For the longer 20-year period to 31 December 2013, the themes of falling bond yields and strong economic growth in Australia applied for most of the period, resulting in strong returns across major asset classes, except for cash. However, the changes that emerged in 2013 impacted results at the margin.
Comparison across asset classes on a before-tax basis: 20 years
› Domestic equities and residential investment property continued to perform very strongly over the 20-year period. Residential investment property led the gains, returning 9.9% p.a. over 20 years, while Australian shares returned 8.7% p.a. over the 20-year period.
› This was followed by global shares (hedged), which returned 8.0% p.a. over the period. Its unhedged counterpart returned 6.0% p.a. during the same period. Hedging added approximately an additional 2% p.a. to investment returns.
› Global fixed interest also performed well, returning 7.9% p.a. over the 20 year period, while its domestic counterpart returned 6.8% p.a. over the same period. Cash returned 3.8% p.a.
› Within the listed property space, global listed property (unhedged) returns were comparable to its Australian counterpart, returning 6.2% and 6.1% p.a. respectively over the 20 year period.
› All asset classes beat inflation, with CPI rising by 2.7% p.a. over the 20 year period.
Note: All returns are net of costs. Past performance is not a reliable indicator of future performance.
8.7
9.9
6.1
6.8
7.9
8.0
3.8
6.0
6.2
Returns (% p.a.)
Exhibit 5 Gross Returns for 20 Years to December 2013
1 2 3 4 5 6 7 8 9 11 1210
Australianlisted
property
Australianfixed
interest
Global fixed
interest (hedged)
Cash
Australianshares
Residentialinvestment
property
Globallisted
property(unhedged)
Global shares
(unhedged)
Global shares
(hedged)
Gross return
–– CPI (2.7% p.a. inflation)

8
Comparison across asset classes on an after-tax basis: 20 years› As with the 10-year results, absolute
returns changed materially after tax, particularly for investors in the high marginal tax rate category. The differential tax treatment across different assets becomes more significant over a longer timeframe, as the impact of tax had a cumulative and compounding effect.
› For investors in super and the low marginal tax category, tax reduced returns for all asset classes apart from the Australian equities asset class.
› Similar to the 10-year results, tax imputation in the form of franking credits created an additional source of returns for super and low marginal tax investors, adding approximately 40 basis points and 20 basis points p.a. over 20 years respectively. This result once again highlights the benefits of selecting the right investment vehicle. By electing to invest in the superannuation environment as opposed to investing directly, an additional 2.2% p.a. can be earned by investors in the high marginal tax category over a 20 year period.
› In addition, it did not pay to invest in cash over the 20 year period for investors in the high marginal tax category, as this asset class did not beat inflation of 2.7% p.a. on an after-tax basis. All other asset classes beat inflation expectations after accounting for taxes.
› For Australian fixed income, taxes at the top marginal tax rate had the biggest impact to after-tax returns and the impact of tax caused the asset class to drop three spots compared to its relative ranking on a pre-tax basis. This reflects the lack of concessions given to fixed income and cash assets as they are treated as income, as well as due to the cumulative and compounding effects of tax, especially over a longer period.
Note: All returns are net of costs. Past performance is not a reliable indicator of future performance. See Appendix for details of marginal tax rates.
Australianlisted
property
Australianfixed
interest
Global fixed
interest (hedged)
Cash
Australianshares
6.25.2
5.43.7
6.05.3
5.44.3
8.07.2
7.36.0
3.83.1
3.22.0
7.96.4
6.74.1
6.85.5
5.73.5
6.15.3
5.53.8
9.99.0
9.17.5
8.78.9
9.16.9
Residentialinvestment
property
Globallisted
property(unhedged)
Global shares
(unhedged)
Global shares
(hedged)
Returns (% p.a.)
Exhibit 6 Investment Returns for the 20 Years to December 2013
Gross return
After Tax Lowest Marginal Tax Rate
After Tax Highest Marginal Tax Rate
Superannuation
–– CPI (2.7% p.a. inflation)
0 1 2 3 4 5 6 7 8 9 121110

9
Analysis of the 2014 Update
Comparison with last year’s gross results: 20 years› Compared to the 20 years to
31 December 2012, last year’s winner – Australian shares – has swapped places with last year’s runner-up – Australian residential property. This was mainly driven by a strong first year for Australian Equity returns (1993, 45%) that was included in last year’s 20 year analysis, but dropped out this year.
› In contrast, Australian residential property experienced steady returns over the 20 year period relative to the volatile 20 period experienced by Australian equity. Apart from residential property, global shares were the only other asset class that performed better than last year’s 20-year return. This was both true on a hedged and unhedged basis. This was due to the very strong rally in 2013. In terms of relative ranking, most asset classes remained at the same rank or changed at the margin, compared to last year.
Note: All returns are net of costs. Past performance is not a reliable indicator of future performance.
Australianlisted
property
Australianfixed
interest
Global fixed
interest (hedged)
Cash
Australianshares
2.7
2.7
8.0
7.7
3.8
3.9
6.2
8.1
6.0
5.3
7.9
8.5
6.8
7.5
6.1
7.1
9.9
9.5
8.7
9.8
Residentialinvestment
property
Globallisted
property(unhedged)
CPI
Global shares
(unhedged)
Global shares
(hedged)
Returns (% p.a.)
Exhibit 7 20 Years to December 2013 vs December 2012
20 years December 2013
20 years December 2012
0 1 2 3 4 5 6 7 8 9 121110
10
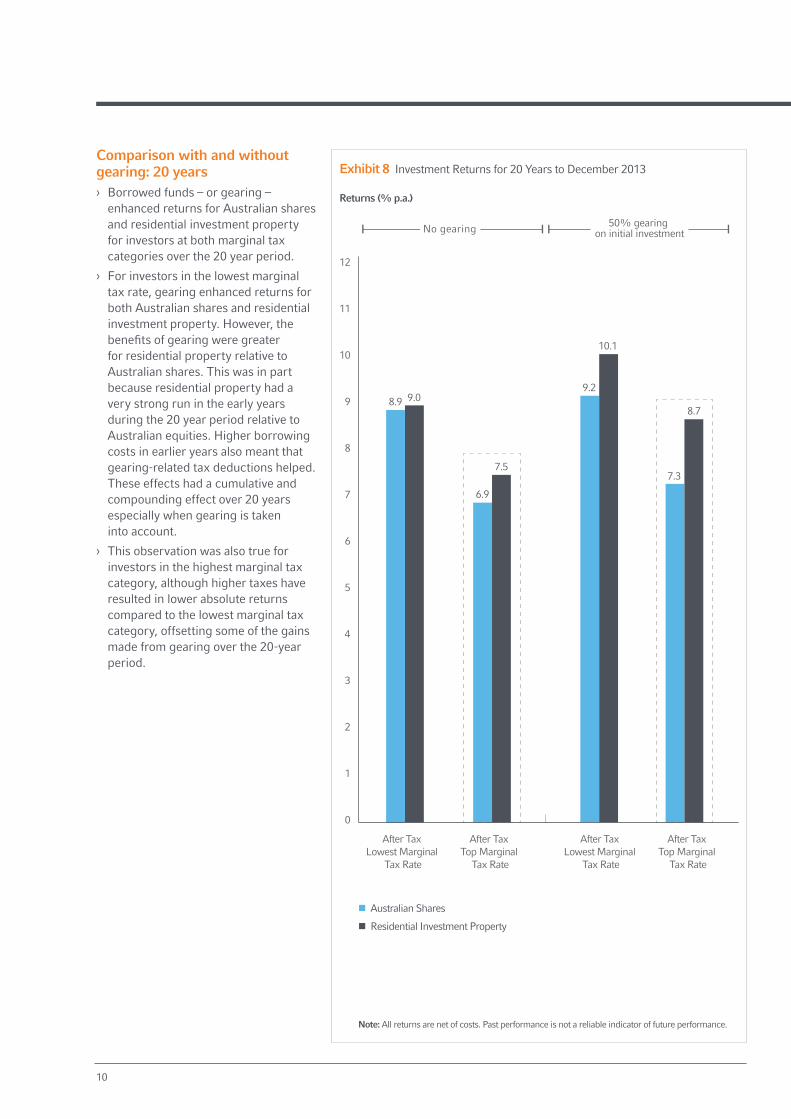
Comparison with and without gearing: 20 years› Borrowed funds – or gearing –
enhanced returns for Australian shares and residential investment property for investors at both marginal tax categories over the 20 year period.
› For investors in the lowest marginal tax rate, gearing enhanced returns for both Australian shares and residential investment property. However, the benefits of gearing were greater for residential property relative to Australian shares. This was in part because residential property had a very strong run in the early years during the 20 year period relative to Australian equities. Higher borrowing costs in earlier years also meant that gearing-related tax deductions helped. These effects had a cumulative and compounding effect over 20 years especially when gearing is taken into account.
› This observation was also true for investors in the highest marginal tax category, although higher taxes have resulted in lower absolute returns compared to the lowest marginal tax category, offsetting some of the gains made from gearing over the 20-year period.
Note: All returns are net of costs. Past performance is not a reliable indicator of future performance.
Returns (% p.a.)
Exhibit 8 Investment Returns for 20 Years to December 2013
0
1
2
3
4
5
6
7
8
9
12
11
10
No gearing 50% gearing on initial investment
Australian Shares
Residential Investment Property
8.9 9.0
6.9
7.5
9.2
10.1
7.3
8.7
After Tax Lowest Marginal
Tax Rate
After Tax Top Marginal
Tax Rate
After Tax Lowest Marginal
Tax Rate
After Tax Top Marginal
Tax Rate

11
Appendix
AppendixThis analysis has been conducted on the following basis:
Investment comparison› All investment returns are determined after
taking into account expenses relating to the acquisition, management and disposal of the asset. Gross returns are calculated before tax but after costs. Net returns allow for the taxation treatment of each investment over the period of the analysis. This aims to represent a realistic method of comparing the different asset classes for an investor.
› Compound returns are calculated over a 10-year period from 1 January 2004 to 31 December 2013, and over a 20-year period from 1 January 1994 to 31 December 2013. The returns are equivalent to the per annum compound returns that investors would have received for an investment in the particular asset class if they invested in an equivalent portfolio over the two periods.
Income tax› The lowest and highest marginal tax rates
are currently 20.5% and 46.5% respectively. These rates have varied slightly over the 10 and 20 years due to changes in taxation policy and the 1.5% Medicare levy. These variations have been taken into account in the calculation of after-tax returns. The bottom and top marginal rates both include the Medicare levy.
› These variations have been taken into account, including the impact on the calculation of franking credits, which affects after-tax returns for Australian shares.
Capital gains› Generally, assets acquired on or after 20
September 1985 are subject to the capital gains tax provisions. For the calculation of 10- and 20-year returns, capital gains tax, is calculated on the initial investment and any subsequent reinvestment of income. Cash is not subject to capital gains tax as all gains are taxed as income and so are subject to marginal rates. For ease of calculation and in the absence of Australian bonds coupon and capital data, the report assumes returns from Australian bonds are treated as income.
› Assets acquired prior to 21 September 1999 and held for longer than 12 months can be assessed for capital gains tax in one of two ways. Private investors can choose to pay capital gains tax (at their marginal tax rate) on 100% of the capital gain (with indexation of the tax cost) or 50% of their capital gain (with no indexation). In this report, we have presented sector returns based upon the calculation method that provides the higher after-tax returns. The discounted capital gain method (as opposed to indexation) has provided the higher after-tax returns in all cases.
Capital losses› Capital losses may be carried forward
indefinitely and offset against other capital gains in future periods. An assumption has been made that the investor has other investments – either today or in the future – that have produced or will produce capital gains against which capital losses may be offset.
Imputation credits› Since July 2000, low-tax rate investors with
imputation credits remaining after offsetting all tax have been able to claim back the excess as a refund from the Australian Taxation Office. Prior to this, the excess could only be offset against income tax from other sources. An assumption has been made that before July 2000, the investor had other sources of income against which to offset this excess.
12
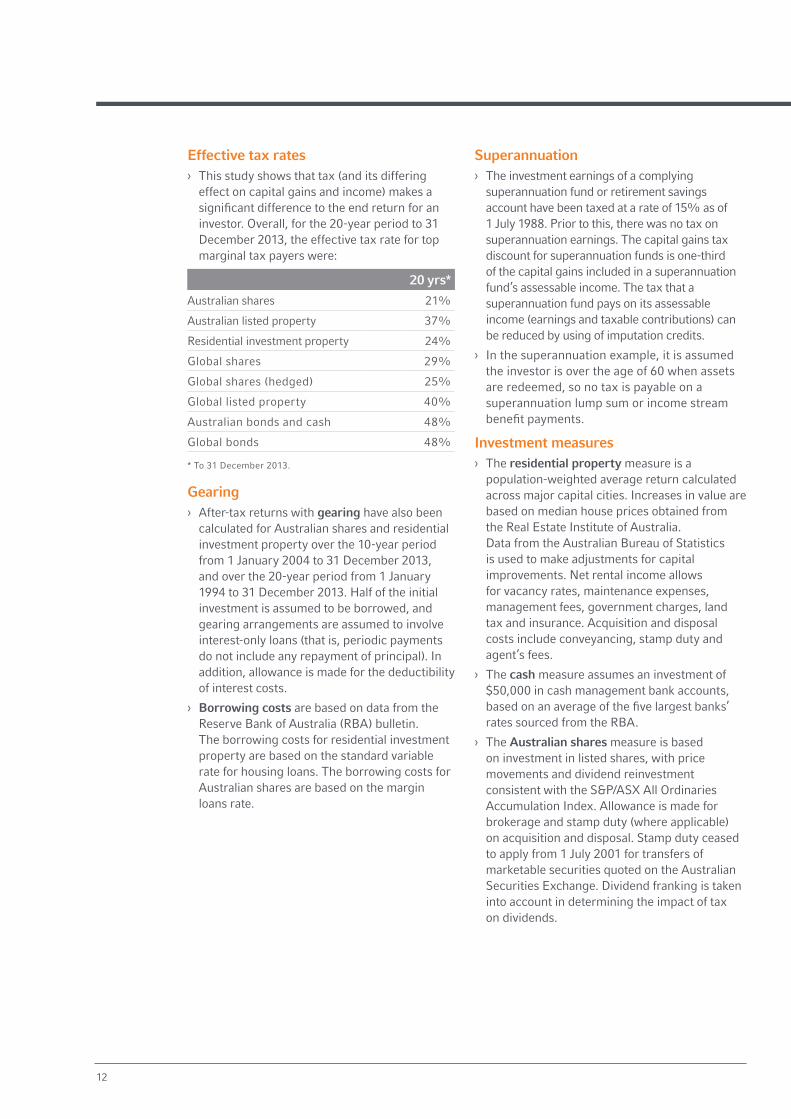
Effective tax rates› This study shows that tax (and its differing
effect on capital gains and income) makes a significant difference to the end return for an investor. Overall, for the 20-year period to 31 December 2013, the effective tax rate for top marginal tax payers were:
20 yrs*
Australian shares 21%
Australian listed property 37%
Residential investment property 24%
Global shares 29%
Global shares (hedged) 25%
Global listed property 40%
Australian bonds and cash 48%
Global bonds 48%
* To 31 December 2013.
Gearing› After-tax returns with gearing have also been
calculated for Australian shares and residential investment property over the 10-year period from 1 January 2004 to 31 December 2013, and over the 20-year period from 1 January 1994 to 31 December 2013. Half of the initial investment is assumed to be borrowed, and gearing arrangements are assumed to involve interest-only loans (that is, periodic payments do not include any repayment of principal). In addition, allowance is made for the deductibility of interest costs.
› Borrowing costs are based on data from the Reserve Bank of Australia (RBA) bulletin. The borrowing costs for residential investment property are based on the standard variable rate for housing loans. The borrowing costs for Australian shares are based on the margin loans rate.
Superannuation› The investment earnings of a complying
superannuation fund or retirement savings account have been taxed at a rate of 15% as of 1 July 1988. Prior to this, there was no tax on superannuation earnings. The capital gains tax discount for superannuation funds is one-third of the capital gains included in a superannuation fund’s assessable income. The tax that a superannuation fund pays on its assessable income (earnings and taxable contributions) can be reduced by using of imputation credits.
› In the superannuation example, it is assumed the investor is over the age of 60 when assets are redeemed, so no tax is payable on a superannuation lump sum or income stream benefit payments.
Investment measures› The residential property measure is a
population-weighted average return calculated across major capital cities. Increases in value are based on median house prices obtained from the Real Estate Institute of Australia. Data from the Australian Bureau of Statistics is used to make adjustments for capital improvements. Net rental income allows for vacancy rates, maintenance expenses, management fees, government charges, land tax and insurance. Acquisition and disposal costs include conveyancing, stamp duty and agent’s fees.
› The cash measure assumes an investment of $50,000 in cash management bank accounts, based on an average of the five largest banks’ rates sourced from the RBA.
› The Australian shares measure is based on investment in listed shares, with price movements and dividend reinvestment consistent with the S&P/ASX All Ordinaries Accumulation Index. Allowance is made for brokerage and stamp duty (where applicable) on acquisition and disposal. Stamp duty ceased to apply from 1 July 2001 for transfers of marketable securities quoted on the Australian Securities Exchange. Dividend franking is taken into account in determining the impact of tax on dividends.

13
Appendix
› The Australian bonds measure is based on investment in Australian Government and corporate bonds. Returns are derived from the UBS Australia Composite Bond Index. For ease of calculation and in the absence of available data, price movements and coupon payments are both deemed to be taxed as income.
› The Australian listed property measure is based on the returns implied by the S&P/ASX 200 Property Trust (Accumulation) Index. Acquisition and disposal costs, such as brokerage and stamp duty (where applicable), have been factored into the return calculations. Assumptions have been made with respect to the tax treatment of listed property income, including the component of tax-free income (abolished in July 2002) and tax-deferred income.
› The global shares (unhedged) measure is based on investment in listed shares with price movements and dividend reinvestment consistent with the Russell Developed Large Cap Index (unhedged) in Australian dollars from 1997, onwards and the MSCI World ex-Australia Gross Dividends Accumulation Index (unhedged) in Australian dollars prior to 1997. Allowance is made for brokerage on acquisition and disposal. Withholding taxes are used to offset Australian taxes in the year the dividends are received.
› The global shares (hedged) measure is based on investment in listed shares with price movements and dividend reinvestment consistent with the Russell Developed Large Cap Index (hedged) in Australian dollars from 2000 onwards, and the MSCI World ex-Australia Gross Dividends Accumulation Index (hedged) in Australian dollars prior to 2000. Allowance is made for brokerage on acquisition and disposal. Withholding taxes are used to offset Australian taxes in the year the dividends are received.
› The global listed property measure is based on dividend reinvestment consistent with the FTSE EPRA/NAREIT Developed Index in Australian dollars (unhedged). Allowance is made for brokerage on acquisition and disposal. Withholding taxes are used to offset Australian taxes in the year the dividends are received.
› The conservative managed fund measure is based on investment in an indexed managed fund with an asset allocation consistent with the industry average for funds that have between 25–35% growth assets. Growth assets include Australian shares, overseas shares (hedged and unhedged) and property. Allowance is made for buy/sell spreads on acquisition and disposal, and annual investment management fees equivalent to that of a retail indexed manager. After-tax returns are not calculated due to lack of data on distributions.
› The balanced managed fund measure is based on investment in an indexed managed fund with an asset allocation consistent with the industry average for funds that have between 65–75% growth assets. Growth assets include Australian shares, overseas shares (hedged and unhedged) and property. Allowance is made for buy/sell spreads on acquisition and disposal, and annual investment management fees equivalent to that of a retail indexed manager. After-tax returns are not calculated due to lack of data on distributions.
› The growth managed fund measure is based on investment in an indexed managed fund with an asset allocation consistent with the industry average for funds that have between 75–85% growth assets. Growth assets include Australian shares, overseas shares (hedged and unhedged) and property. Allowance is made for buy/sell spreads on acquisition and disposal, and annual investment management fees equivalent to that of a retail indexed manager. After-tax returns are not calculated due to lack of data on distributions.

Russell Investments
Russell website www.russell.com.au
MailGPO Box 3279 Sydney NSW 2001
PhoneSydney +61 2 9229 5111Melbourne +61 3 9270 8111
Russell Investments/ASX Long-term Investing Report Issued by Russell Investment Management Ltd ABN 53 068 338 974, AFS License 247185 (“RIM”). This document provides general information only and has not been prepared having regard to your objectives, financial situation or needs. Before making an investment decision, you need to consider whether this information is appropriate to your objectives, financial situation or needs. This information has been compiled from sources believed reliable, but is not guaranteed. Past performance is not a reliable indicator of future performance.
Copyright © 2014 Russell Investments. All rights reserved. This material is proprietary and may not be reproduced, transferred or distributed in any form without prior written permission from Russell Investments.
R_RPT_ASX_Report_V1F_1405
ASXASX website www.asx.com.au
AddressAustralian Securities Exchange Exchange Centre 20 Bridge Street Sydney NSW 2000
ASX Customer Service131 279 [email protected]