full scale cyclic lateral load tests on six single piles in sand
TRANSCRIPT

I FILE CO mISCELLANEOUS PAPER GL8
AFULL SCALE CYCLIC LATERAL LOAD TESTSON SIX SINGLE PILES IN SAND
Ifl byTRobert L. Little, Jean-Louis Briaud
Geotechnical DivisionCivil Engineering Department
Texas A&M UniversityCollege Station, Texas 77843
I
DTIC
_______ SEP 2 01988August 1988Final Report
Approved For Public Release; Distribution Unlimited
Prcpare, for US Army Engineer District, St. Louis210 Tucker Boulevard, N.
St. Louis, Missouri 63101-1986
Monitored by Geotechnical LaboratoryUS Army Engineer Waterways Experiment Station
BR PO Box 631, Vicksburg, Mississippi 39180-0631Under Contract No. DACW39-87-M-044688 9 20 0 60
-74.--.'
Unclassified
SECURITY CLASSIFICATION OF THIS PAGE A w oved
REPORT DOCUMENTATION PAGE OMBNo.070OrU .la. REPORT SECURITY CLASSIFICATION 1b RESTRICTIVE MARKINGS
Unclassified
2a. SECURITY CLASSIFICATION AUTHORITY 3 DISTRIBUTION/AVAILABILITY OF REPORT %
2b. DECLASSIFICATION / DOWNGRADING SCHEDULE Approved for public release;distribution unlimited
4. PERFORMING ORGANIZATION REPORT NUMBER(S) 5. MONITORING ORGANIZATION REPORT NUMBER(S)
Research Report 5640 Miscellaneous Paper GL-88-27
Ga. NAME OF PERFORMING ORGANIZATION 6b. OFFICE SYMBOL 7a, NAME OF MONITORING ORGANIZATION(if applicable) USAEWES
(See reverse) Geotechnical Laboratory
6c. ADDRESS (City, State, and ZIP Code) 7b, ADDRESS (City, State, and ZIP Code) 0
PO Box 631 %
(See reverse) Vicksburg, MS 39180-0631
8a. NAME OF FUNDING/ SPONSORING 8b. OFFICE SYMBOL 9. PROCUREMENT INSTRUMENT IDENTIFICATION NUMBER
ORGANIZATION (if applicable) %-
(See reverse) CELMS-ED-G Contract No. DACW39-87-M-04468C. ADDRESS (City, State, and ZIP Code) 10. SOURCE OF FUNDING NUMBERS
PROGRAM PROJECT TASK WORK UNIT SELEMENT NO. NO. NO. CCSSION NO.-
(See reverse)
11. TITLE (Include Security Classification)
Full Scale Cyclic Lateral Load Tests on Six Single Piles in Sand
12. PERSONAL AUTHOR(S)Little, Robert L.; Briaud, Jean-Louis
13a. TYPE OF REPORT 13b. TIME COVERED 1DATE OF REPORT (Year, Month, Day) 15. PAGE LOUNT --'
Final report FROM T_ 14 August 1988 90...
Avai ao e from National Technical Information Service, 5825 Fort Royal Road, i
Springfield, VA 22161 ; _
17. COSATI CODES 18. SUBJECT TERMS (Continue on reverse if necessary and identify by block number)
FIELD GROUP SUBGRO" Cohesionless soils , Pressuremeter
Cyclic lateral loading, Single piles_
19, ATRACT (Continue on reverse if necessary and identify by block number)
This study was performed to determine responses of single piles in sands subjected
to cyclic lateral loading and compaie the results with predicted responses based on in-
situ pressuremeter tests. The pressuremeter method used for predicting pile response to
monotonic lateral loading is applicable to piles which will experience little or no
degradation in flexural stiffness such as steel piles and prestressed concrete piles
loaded less than the prestress. I ,.,
,..-1...
20. DISTRIBUTIONIAVAILABILITY OF ABSTRACT 21 ABSTRACT SECURITY CLASSIFICATION
'DUNCLASSIFIED/UNLIMITED ] SAME AS RPT C DTIC USERS Unclassified
22a. NAME OF RESPONSIBLE INDIVIDUAL 22t TELEPHONE (Include Area Code) 22c OFFICE SYMBOL
DO Form 1473, JUN 86 Previous editions are obsolete. SECURITY CLASSIFICATION OF THIS PAGE
Unclassified
V PV % ' %,
I.
UnclassifiedSECURITv CLASSIF'CATION OF THIS1 PA( E
6a & 6c. NAME OF PERFORMING ORGANIZATION AND ADDRESS (Cnine%
Geotechnical Division ~ICivil Engineering DepartmentTexas A&M UniversityCollege Station, TK 77843
8a. & 8c. NAME AND ADDRESS OF FUNDING/SPONSORING ORGANIZATION (Continued).
US Army Engineer District, St. Louis210 Tucker Boulevard, N.St. Louis, MIO 63101-1986
%
%, ,
Unclassifie
W~~~j~~iTY~ CLSSP,*TO OF 04rS %P
N ,
L% J1
PREFACE
This study was performed by the Geotechnical Division, Civil Engineering
Department, Texas A&M University, College Station, TX, under contract to the ,°%"
US Army Engineer Waterways Experiment Station (WES), Vicksburg, MS, for the US
Army Engineer District, St. Louis. The study was performed under Contract No.
DACW39-87-M-0446.
This report was prepared by Mr. Robert L. Lrttle and Dr. Jean-Louis
Briaud, Texas A&M University, and reviewed by Mr. G. Britt Mitchell, Chief,
Engineering Group, Soil Mechanics Division (SMD), Geotechnical Laboratory
(CL). WES. General supervision was nrovided by Mr. Clifford L. M c'':ar,
Chief, SMD, and Dr. William F. Marcuson III, Chief, GL.
COL Dwayne G. Lee, EN, is Commander and Director of WES. Dr. Robert W.
Whalin is Technical Director.
%
'
%
%
:'pi
Accession For
NT, A"DT. T~i R
;~ 1V
D 1,3 i ,
D st ' .%p
*f- - -

-]~-
]A
..
V."
a...;
-.a,
.
i i "a,-
a,.-9:
ACKNOWLEDGEMENTS .
This project was sponsored by the US Army Engineer
Waterways Experiment Station. Mr. Britt Mitchell, who was .
the technical contact, is thanked for his help and advice
throughout the project.
At Texas A&M University, Mr. Larry Tucker's help in the
microcomputer programming and in the preparation of the
report is much appreciated..'.
A. %. P
. . . .~. .:2.:::: a
- -- - - -'. -"A)-A -.
" %
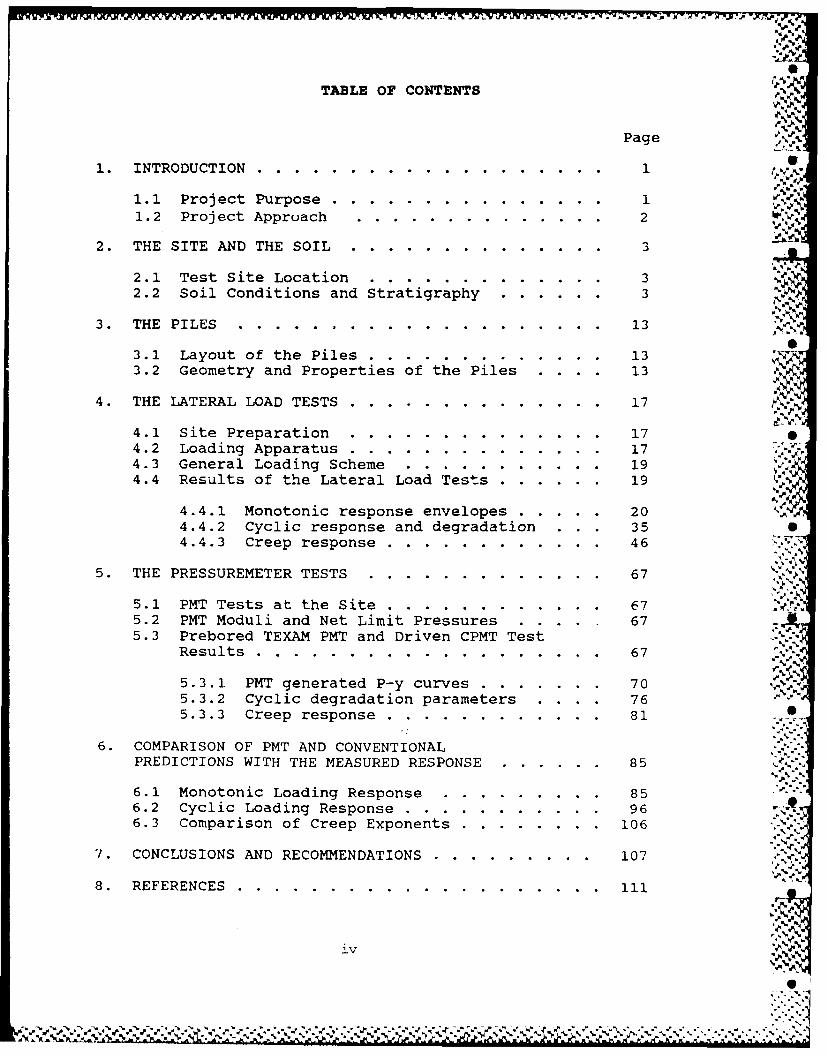
TABLE OF CONTENTS
Page
1. INTRODUCTION .......... ................... 1
1.1 Project Purpose.. ............ 11.2 Project Appruach .............. 2
2. THE SITE AND THE SOIL ....... .............. 3
2.1 Test Site Location. . . . . _... . . . . . . 32.2 Soil Conditions and Stratigraphy. . . . . . . 3....
3. THE PILES ........ .................... 13e
3.1 Layout of the Piles .... ............. 133.2 Geometry and Properties of the Piles . . .. 13
4. THE LATERAL LOAD TESTS .... .............. 17
4.1 Site Preparation .... .............. 174.2 Loading Apparatus .............. 174.3 General Loading Scheme .......... .... 19..'.....4.4 Results of the Lateral Load Tests ...... . 19
4.4.1 Monotonic response envelopes ..... . 204.4.2 Cyclic response and degradation . . 35 4.4.3 Creep response .. .......... 46
5. THE PRESSUREMETER TESTS .... ............. 67
5.1 PMT Tests at the Site ... ............ 675.2 PMT Moduli and Net Limit Pressures ..... 675.3 Prebored TEXAM PMT and Driven CPMT Test
Results ....... ................... 67
5.3.1 PMT generated P-y curves ........ . 705.3.2 Cyclic degradation parameters .... 765.3.3 Creep response ... ............ 81 •
6. COMPARISON OF PMT AND CONVENTIONALPREDICTIONS WITH THE MEASURED RESPONSE ....... . 85.....
6.1 Monotonic Loading Response . ......... 856.2 Cyclic Loading Response .. ........... . 966.3 Comparison of Creep Exponents ........ .. 106.-'-...
7. CONCLUSIONS AND RECOMMENDATIONS .. ........ 107
8. REFERENCES ........ .................... iii
iv
Page
APPENDIX A - Pile Load Test Data .. ......... . 113 1 .
APPENDIX B - Corrected PMT Curves .. ........ 135 S
APPENDIX C - Cyclic Degradation of the PMT SecantShear Modulus ........ ..... 149
APPENDIX D - Cyclic Degradation of the PMT CyclicShear Modulus ... ........... . 163
.'%;
".-Z
°- *% ..
- .5
v >. .
,S.

LIST OF FIGURES
Figure Page
1 Location of Test Site ..... .. ............ 4
2 Site Plan and Arrangement of Test Piles 5
3 Soil Profile at Test Site ..... .......... 6
4 Test Site Boring Log. . .......... 7
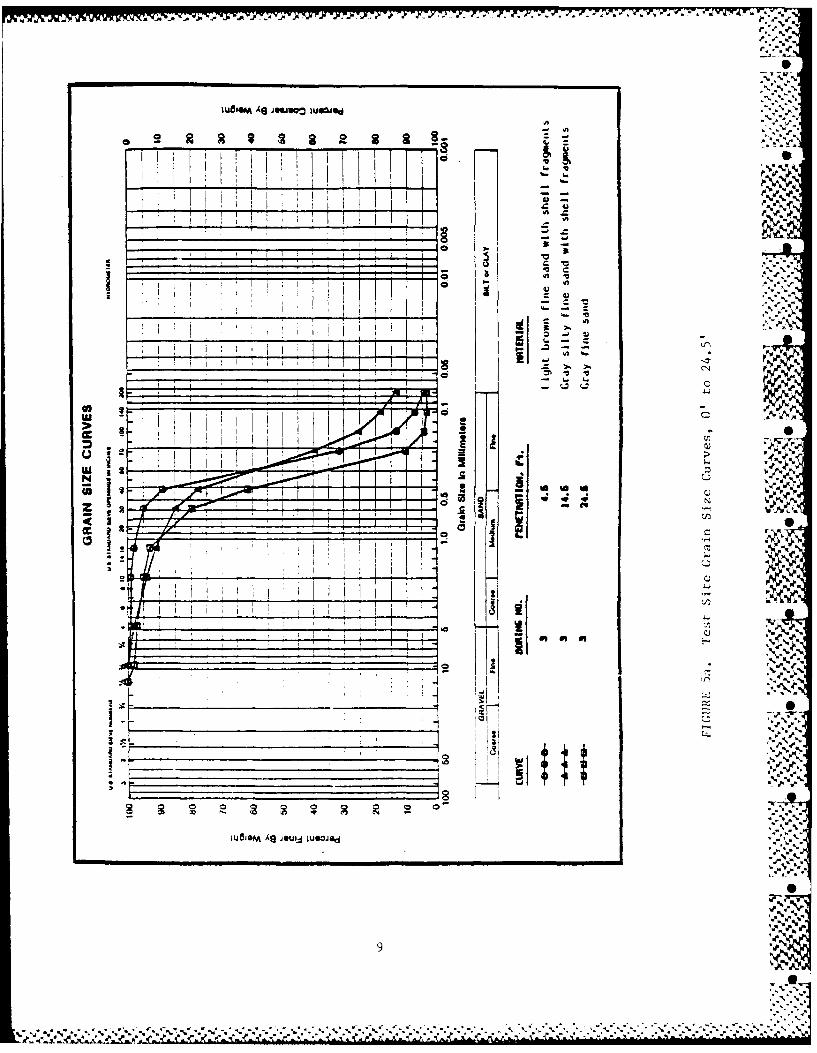
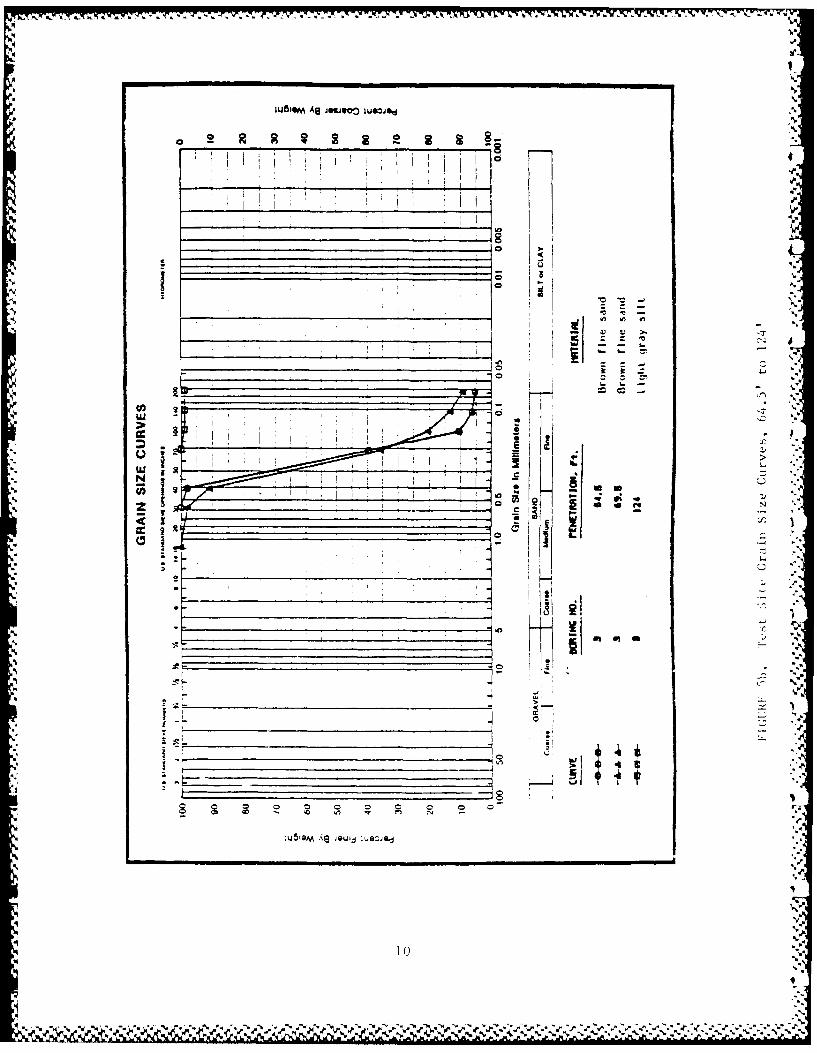
5 Test Site Grain Size Curves ..... ......... 9
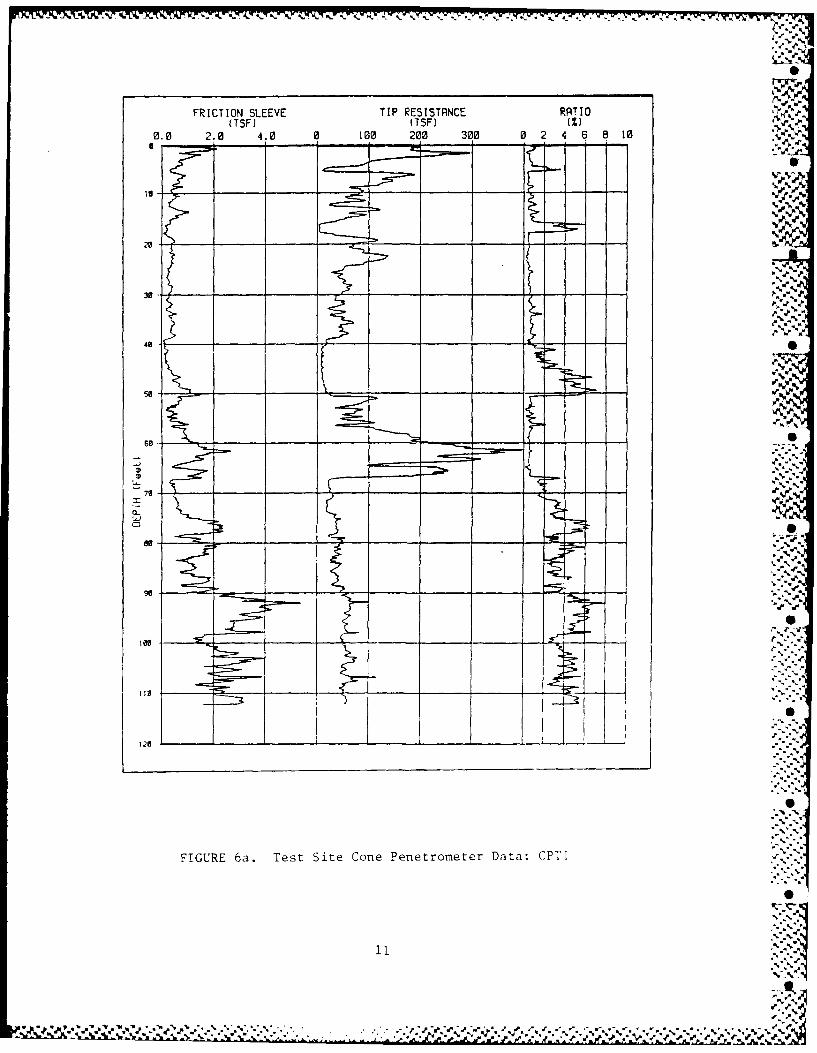
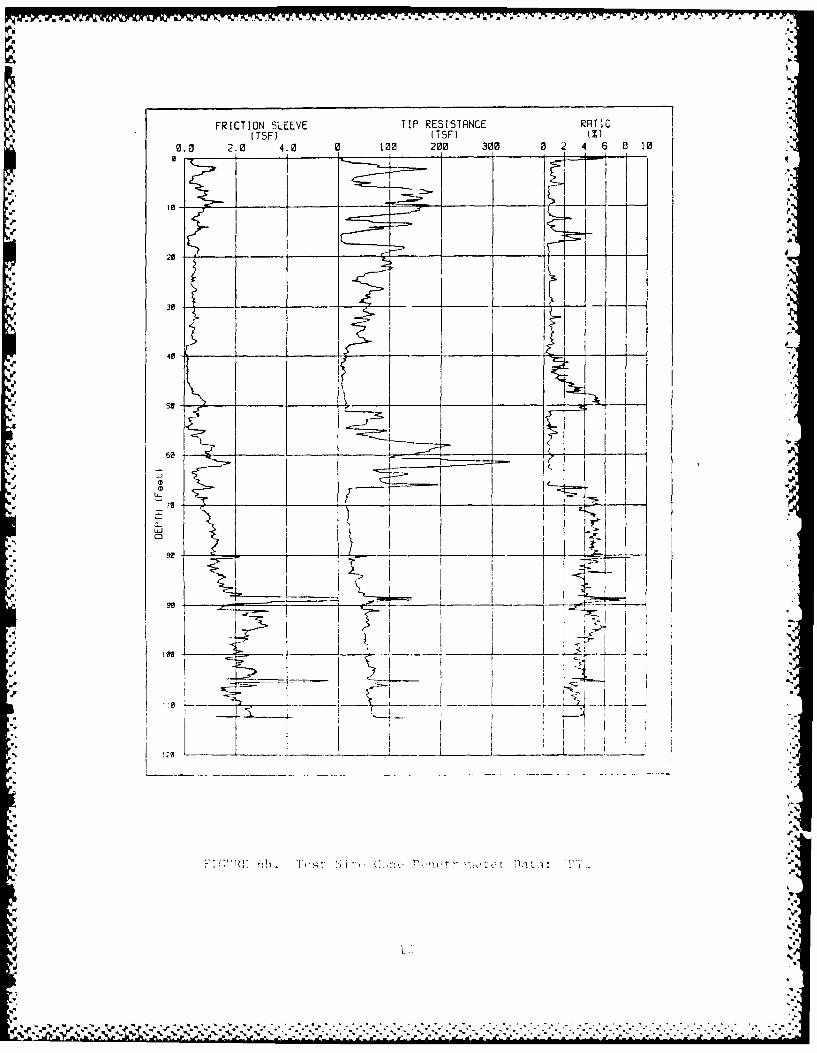
6 Test Site Cone Penetrometer Data . ...... 11
7 Arrangement and I.D. Numbers for theTest Piles ...... ................. 14
8 Horizontal Load Application and Displacement N
Measuring System .... .............. 18
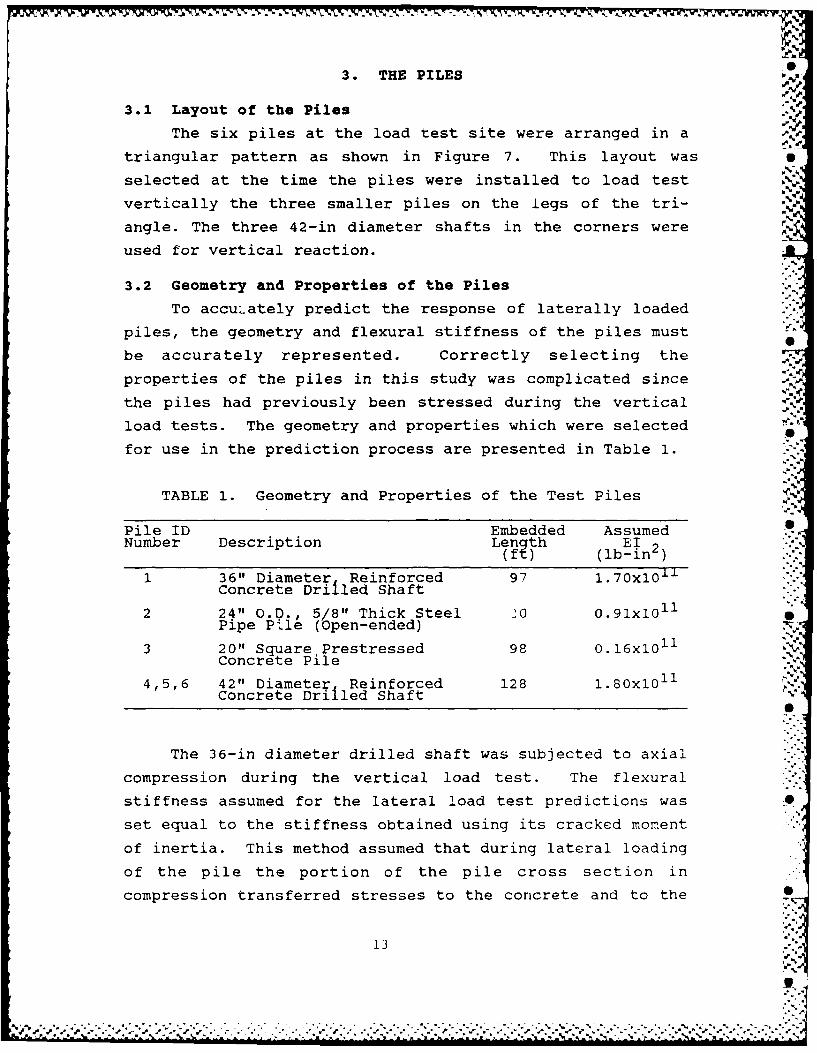
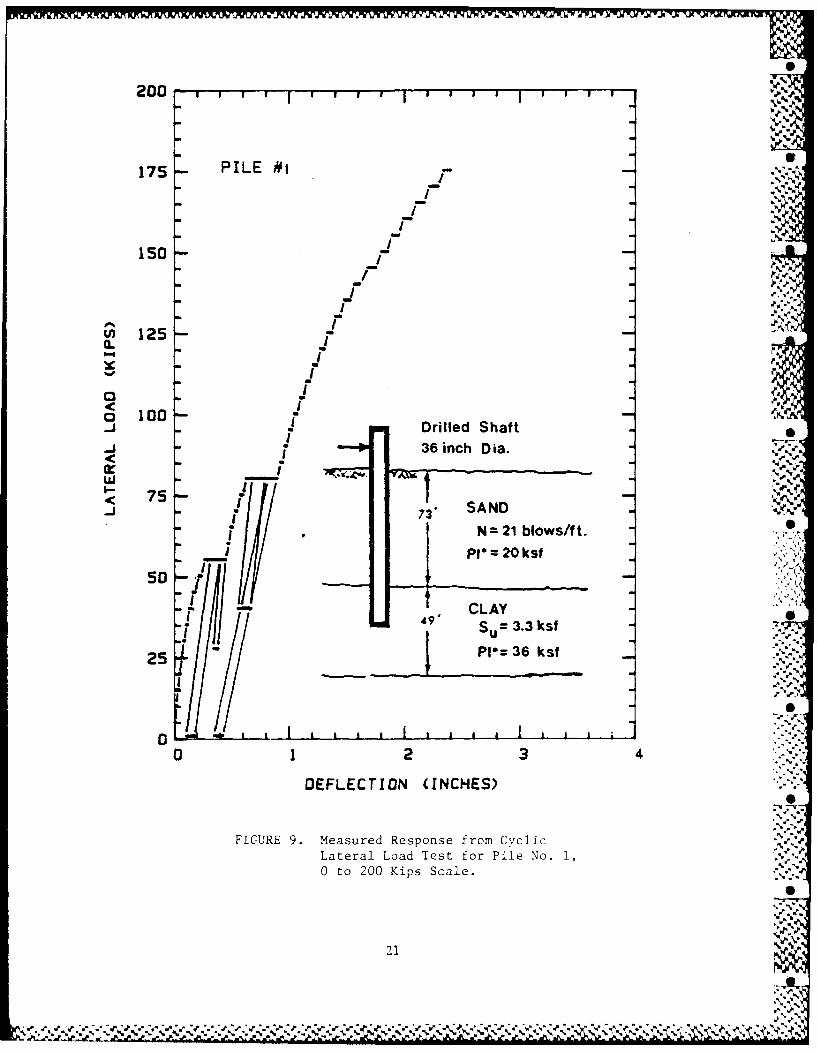
9 Measured Response from Cyclic Lateral LoadTest for Pile No. 1 ............. 21
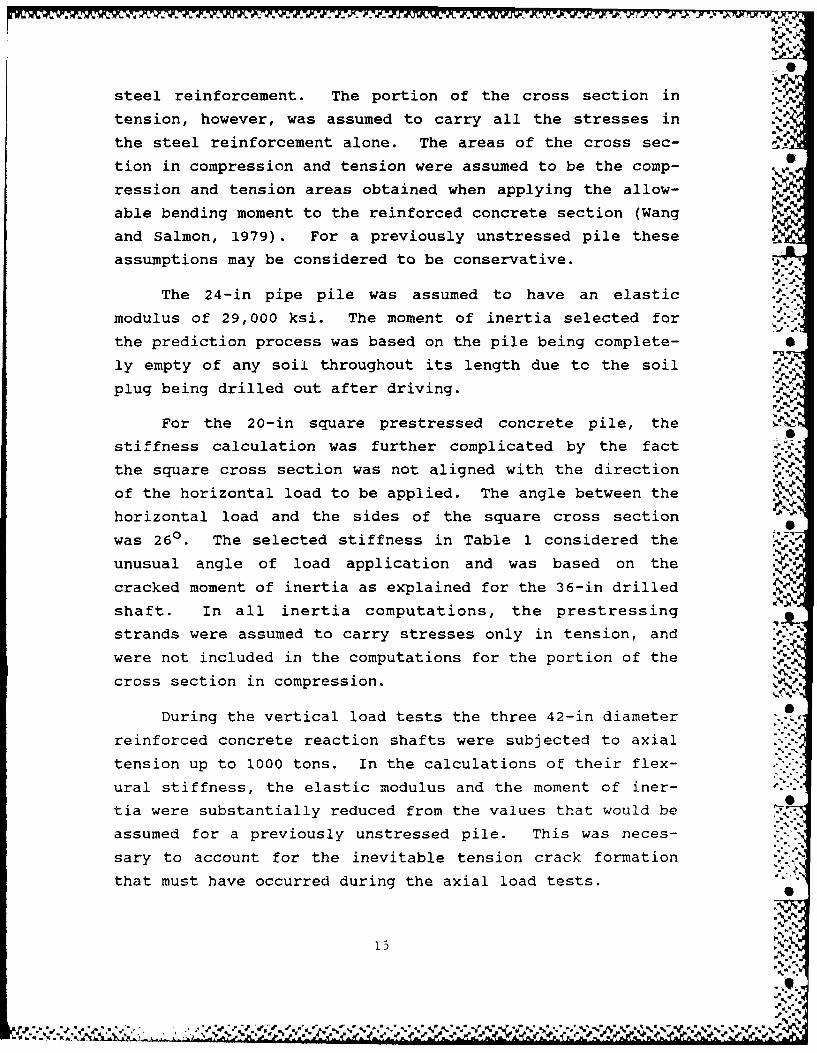
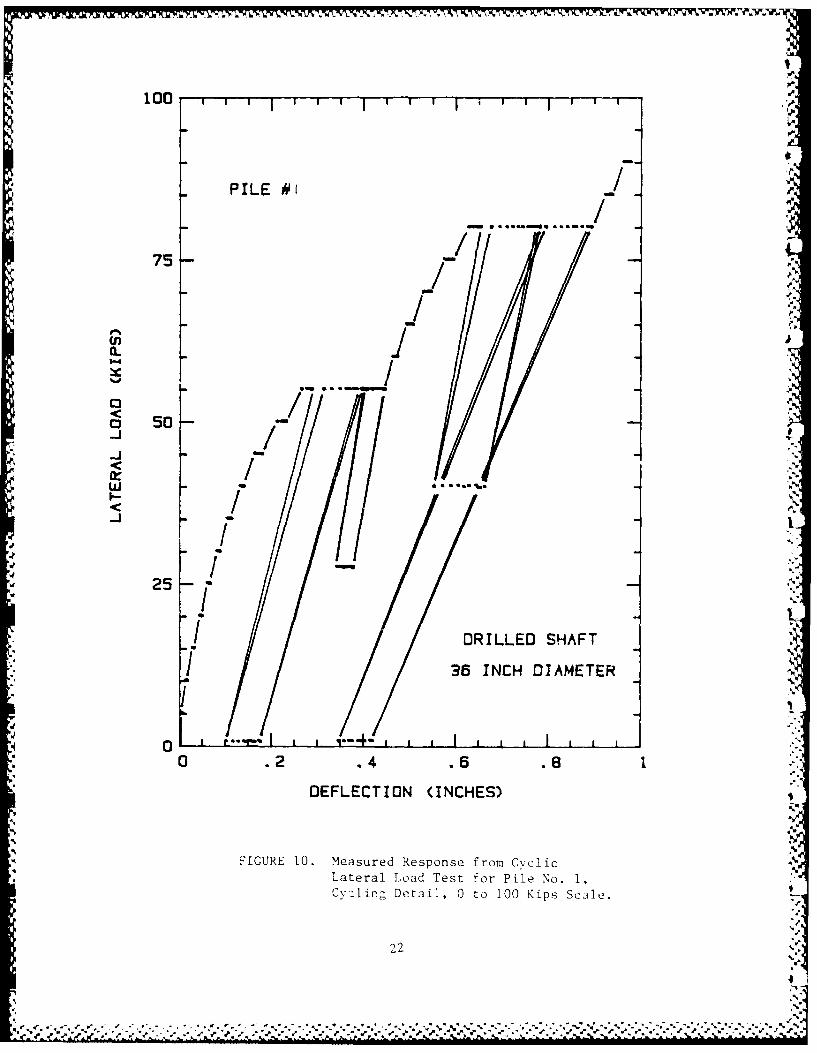
10 Measured Response from Cyclic Lateral LoadTest for Pile No. 1, Cycling Detail ..... . 22
11 Measured Response from Cyclic Lateral LoadTest for Pile No. 2 .... ............. 23
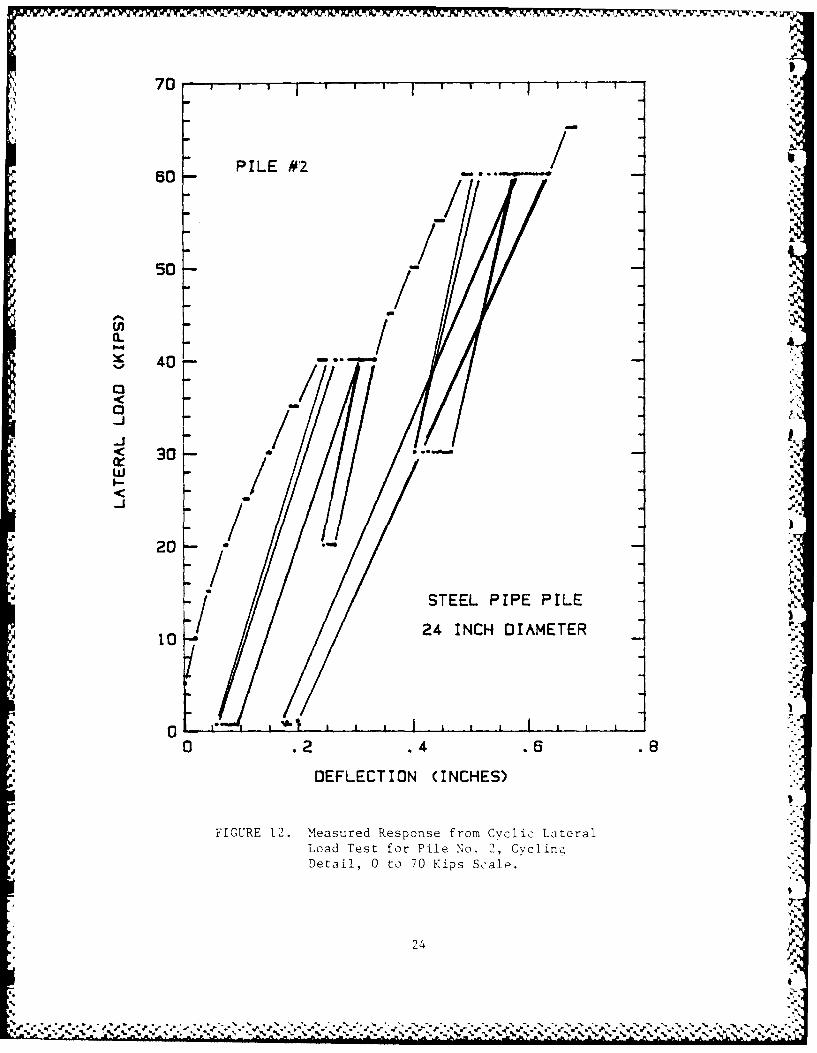
12 Measured Response from Cyclic Lateral LoadTest for Pile No. 2, Cycling Detail ..... . 24
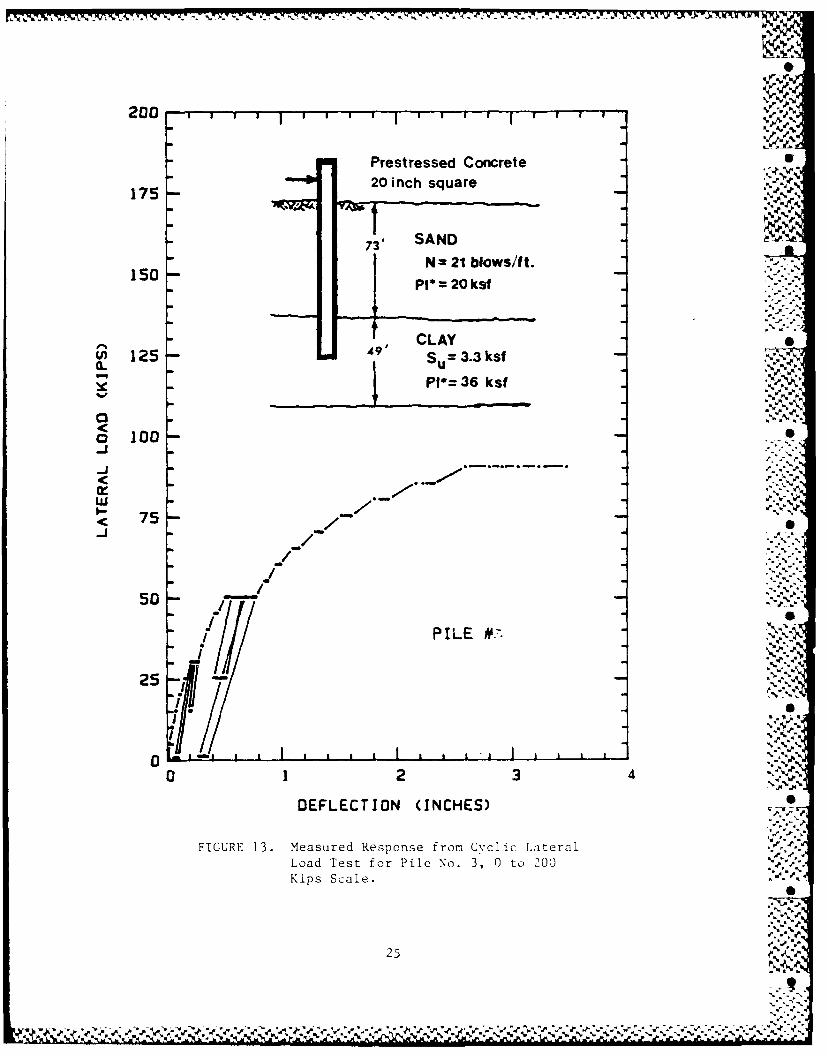
13 Measured Response from Cyclic Lateral LoadTest for Pile No. 3 .... ............. . 25
14 Measured Response from Cyclic Lateral LoadTest for Pile No. 3, Cycling Detail ..... . 26
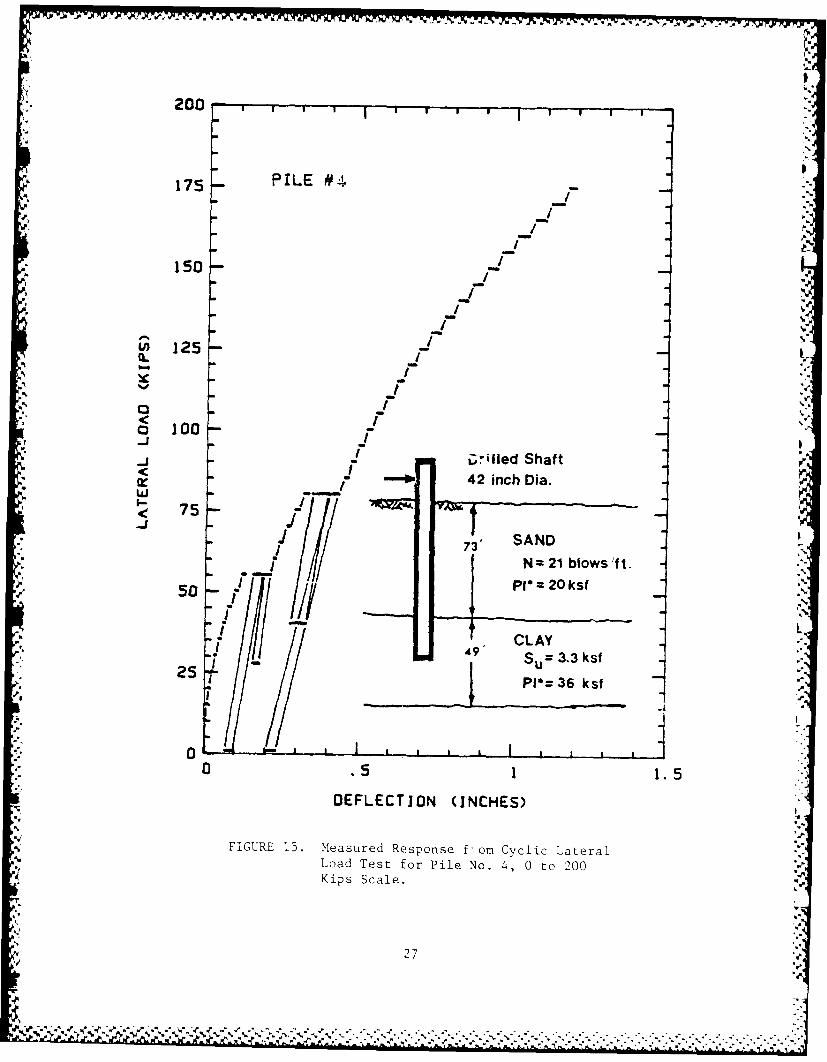
15 Measured Response from Cyclic Lateral LoadTest for Pile No. 4 ............. 27
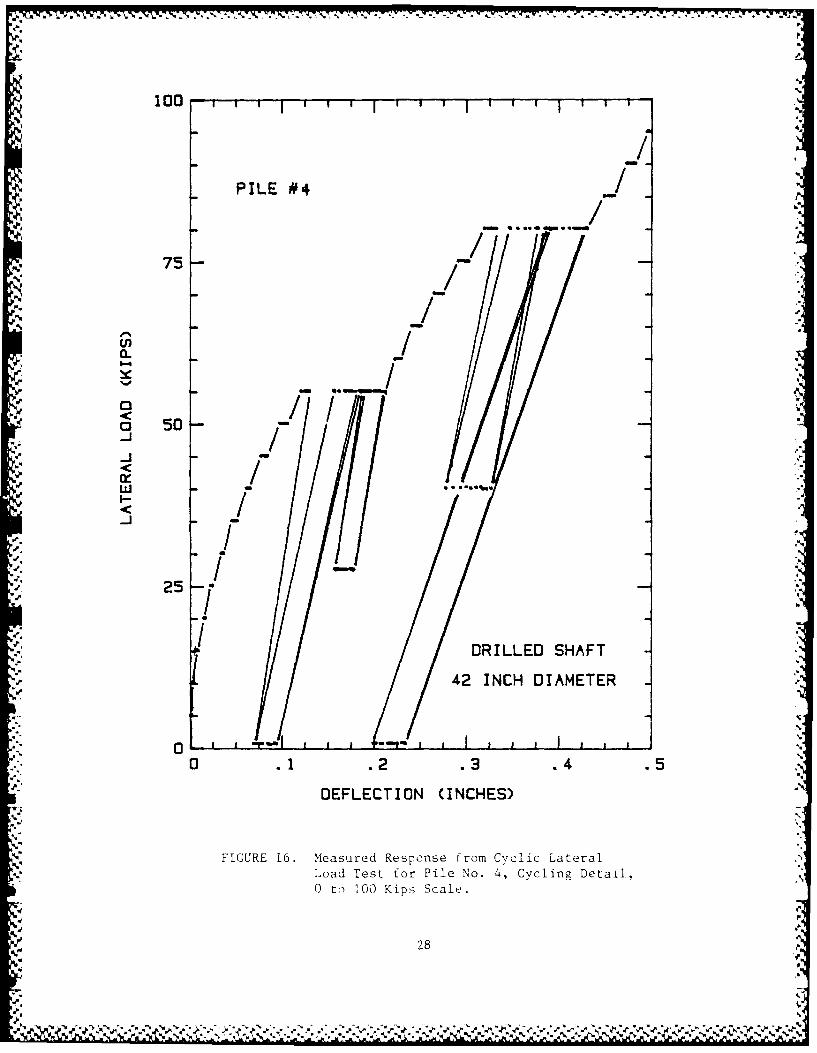
16 Measured Response from Cyclic Lateral LoadTest for Pile No. 4, Cycling Detail ..... . 28
17 Measured Response from Cyclic Lateral LoadTest for Pile No. 5 ............. 29
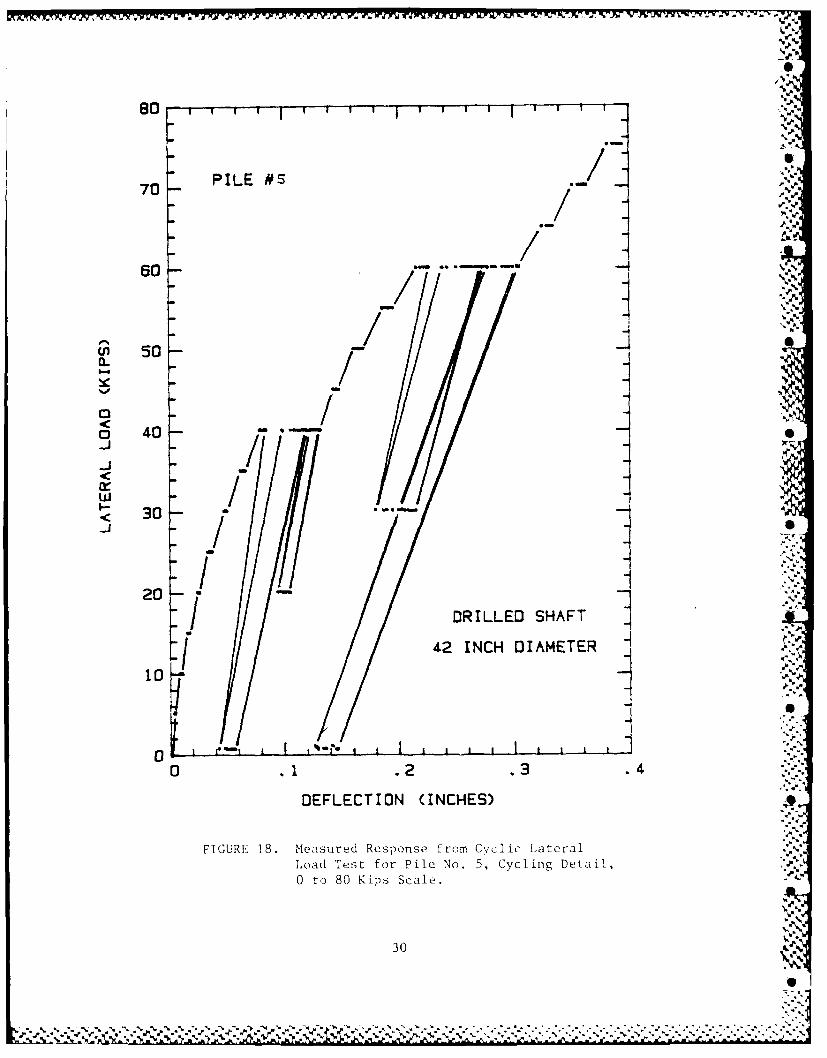
18 Measured Response from Cyclic Lateral LoadTest for Pile No. 5, Cycling Detail ..... . 30
N. Vi
Figure Page . -
19 Measured Response from Cyclic Lateral LoadTest for Pile No. 6 ... ............ . 31
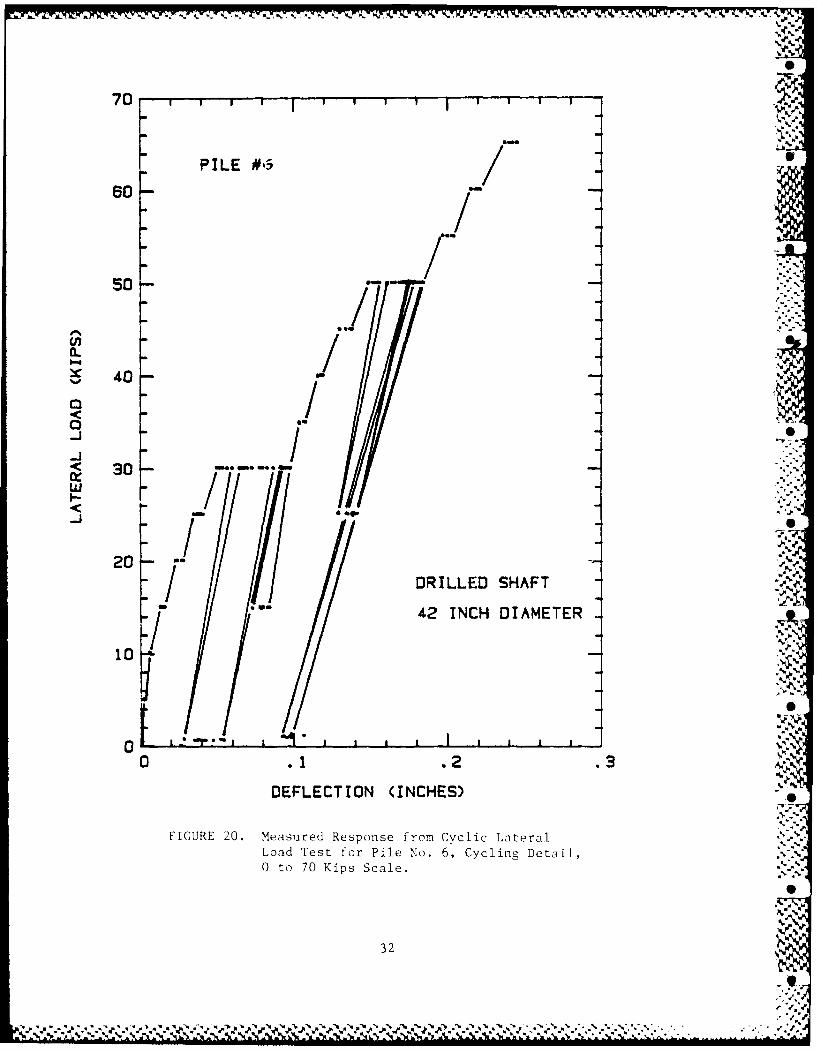
20 Measured Response from Cyclic Lateral LoadTest for Pile No. 6, Cycling Detail ..... . 32 .5
21 Monotonic Response Envelopes Measured During .-
Pile Load Tests, Full Range Scale ...... . 335JL
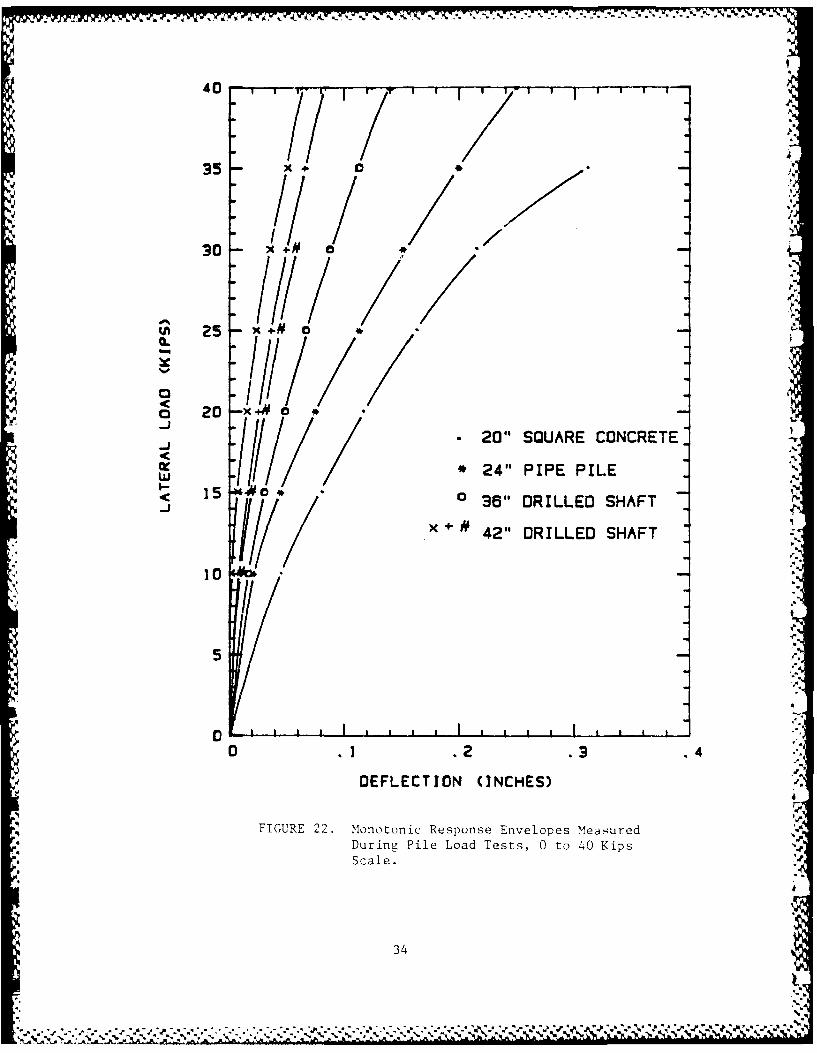
22 Monotonic Response Envelopes Measured DuringPile Load Tests, 0 to 40 kips scale . ."...34
23 Percentage Increase in DisplacementCalculation ...... ................. 36
24 Cyclic Parameters Definition . ........ 39
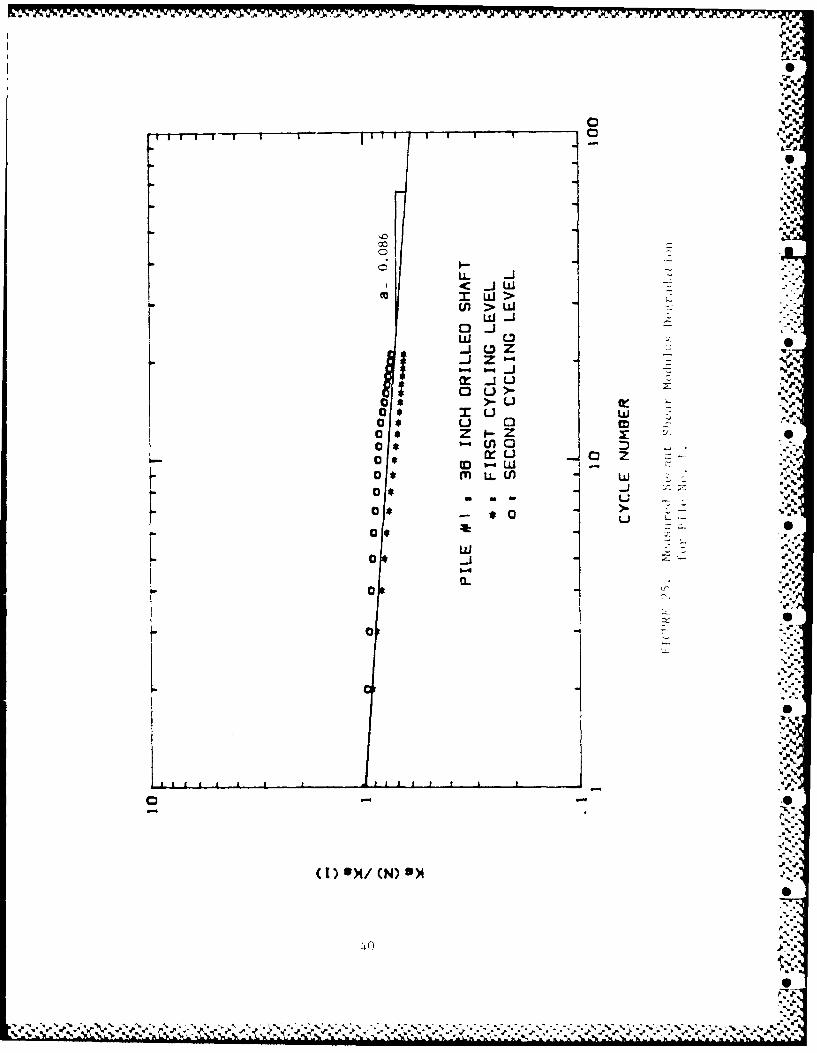
25 Measured Secant Shear Modulus Degradationfor Pile No. 1 ..... ............... 40
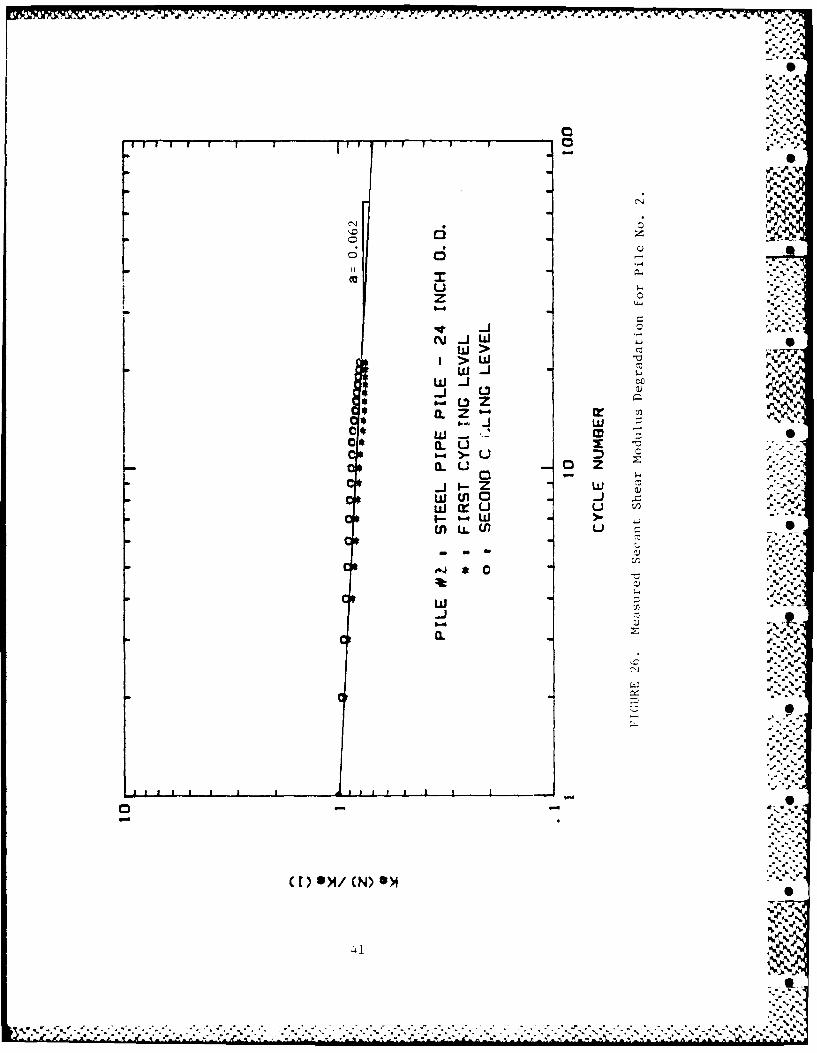
26 Measured Secant Shear Modulus Degradation 0for Pile No. 2 ............... 41
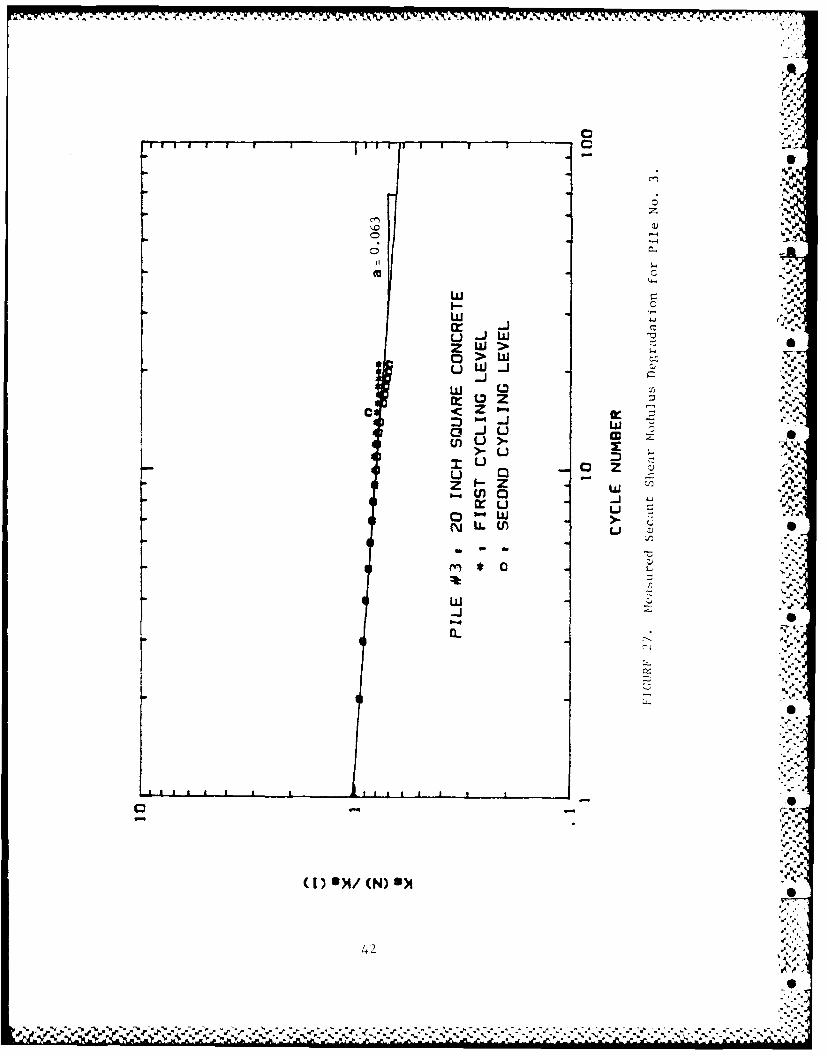
27 Measured Secant Shear Modulus Degradationfor Pile No. 3 ..... ............... 42
28 Measured Secant Shear Modulus Degradationfor Pile No. 4 ..... ............... 43
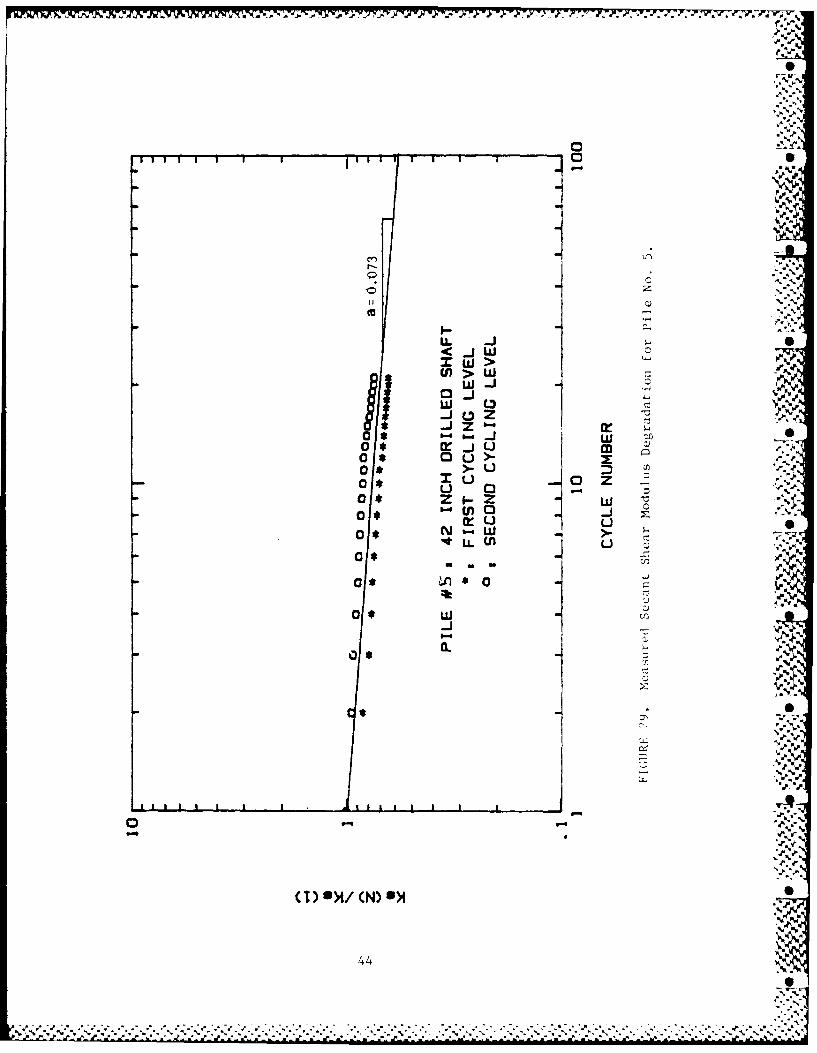
29 Measured Secant Shear Modulus Degradation ...
for Pile No. 5 ..... ............... 44
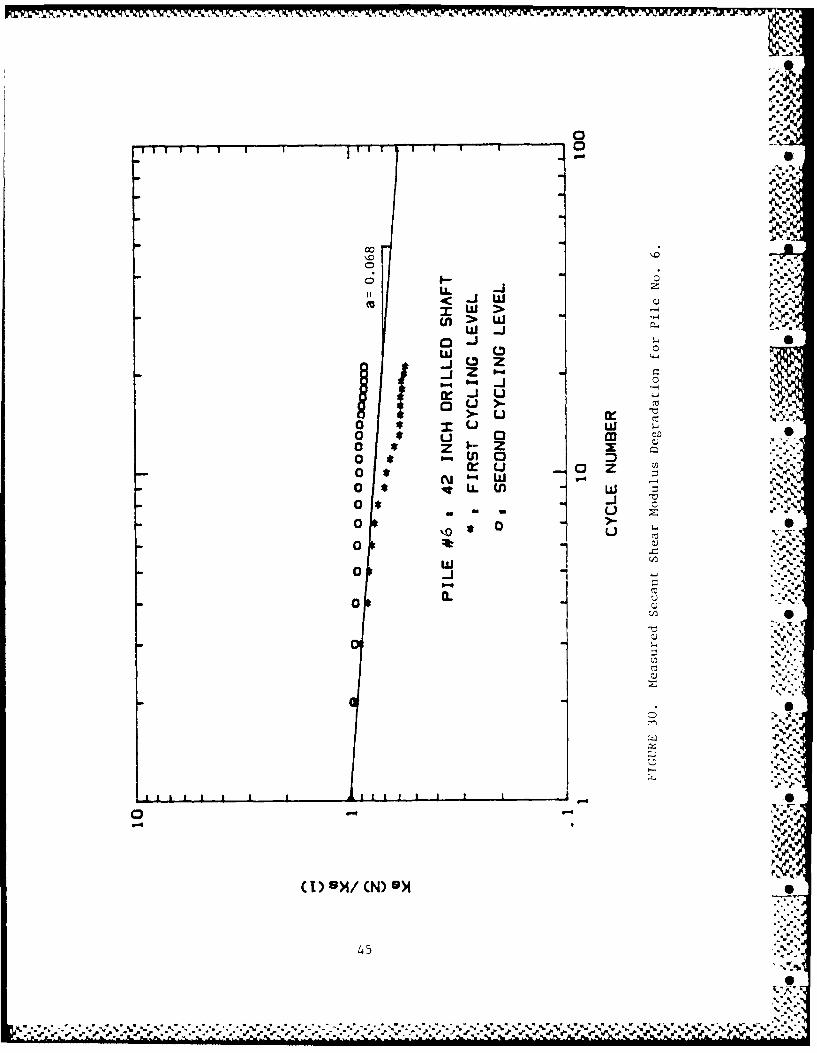
30 Measured Secant Shear Modulus Degradationfor Pile No. 6 ..... ............... 45
31 Cyclic Shear Modulus Parameters Definition 47 .
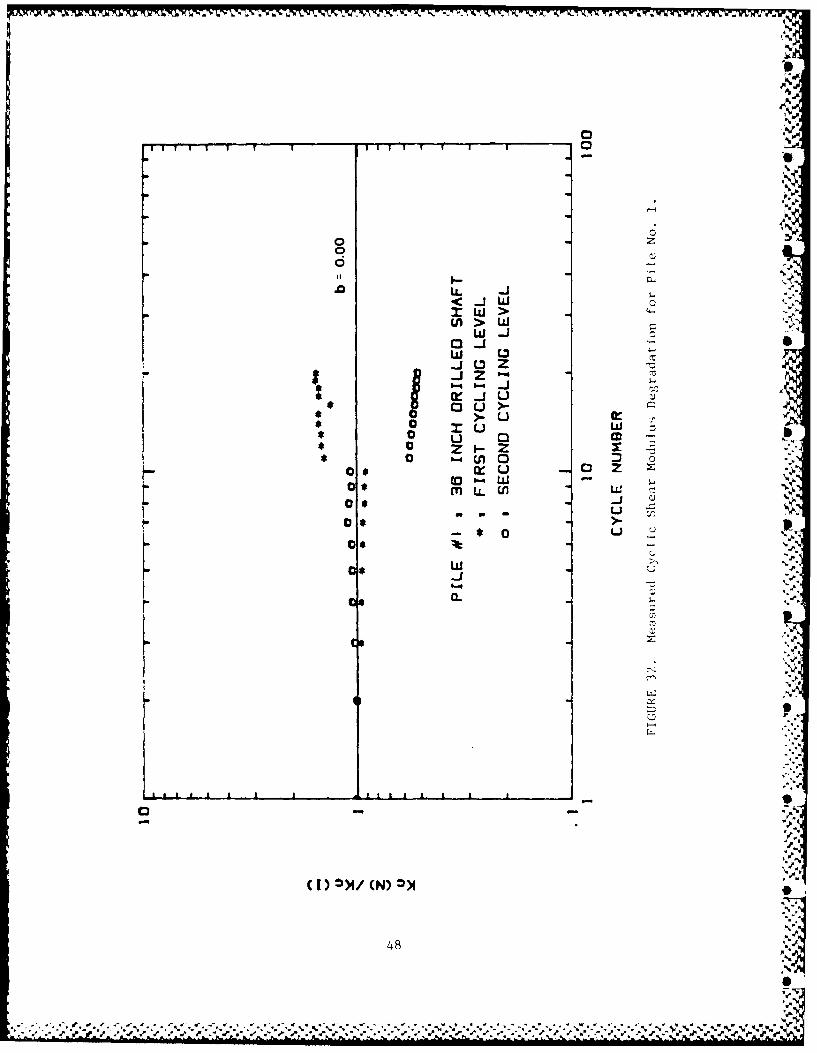
32 Measured Cyclic Shear Modulus Degradationfor Pile No. 1 .............. .. 48
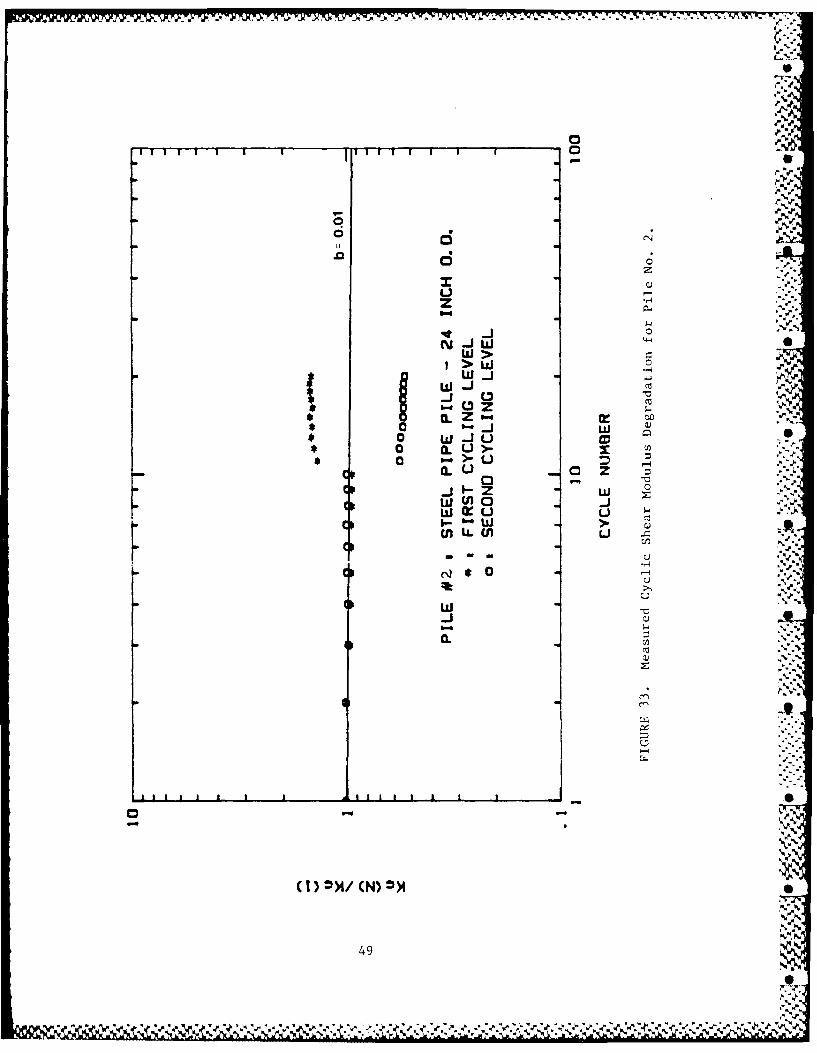
33 Measured Cyclic Shear Modulus Degradationfor Pile No. 2 ..... ............... 49
34 Measured Cyclic Shear Modulus Degradationfor Pile No. 3 ..... ............... 50
35 Measured Cyclic Shear Modulus Degradation .,..
for Pile No. 4 ..... ............... 51
36 Measured Cyclic Shear Modulus Degradation 0
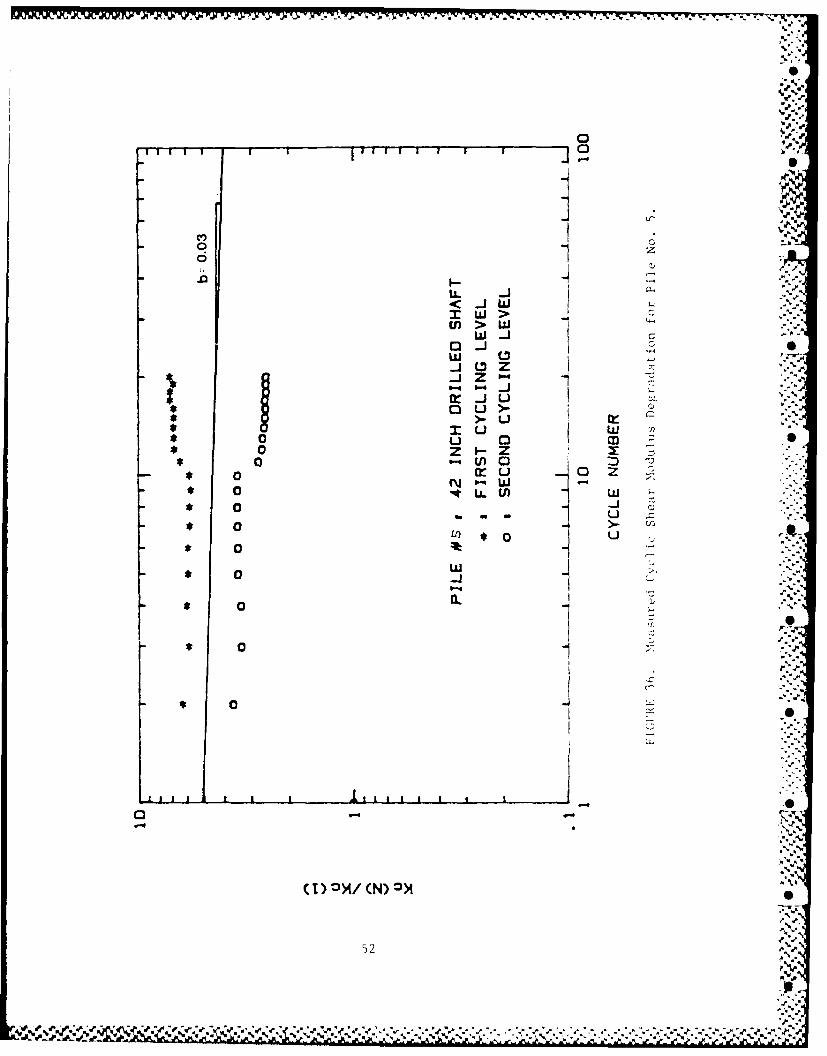
for Pile No. 5 ..... ............... 52
v' i.

Figure Page
37 Meas,:red Cyclic Shear Modulus Degradation Prfc. Pile No. 6 ..... ............... 53
38 Measured Creep Response, Pile No. 1 ..... . 55
39 Measured Creep Response, Pile No. 2 ..... . 56
40 Measured Creep Response, Pile No. 3 ..... . 57
41 Measured Creep Response, Pile No. 4 ....... 58
42 Measured Creep Response, Pile No. 5 ..... . 59
43 Measured Creep Response, Pile No. 6 ..... 60
44 Creep Exponent Response to Load Level,Pile No. 1 ...... ................. 61
45 Creep Exponent Response to Load Level,Pile No. 2 ...... ................. 62
46 Creep Exponent Response to Load Level, . *
Pile No. 3 ...... ................. 63
47 Creep Exponent Response to Load Level,Pile No. 4 ...... ................. 64
48 Creep Exponent Response to Load Level,Pile No. 5 ...... ................. 65
49 Creep Exponent Response to Load Level,Pile No. 6 ...... ................. 66
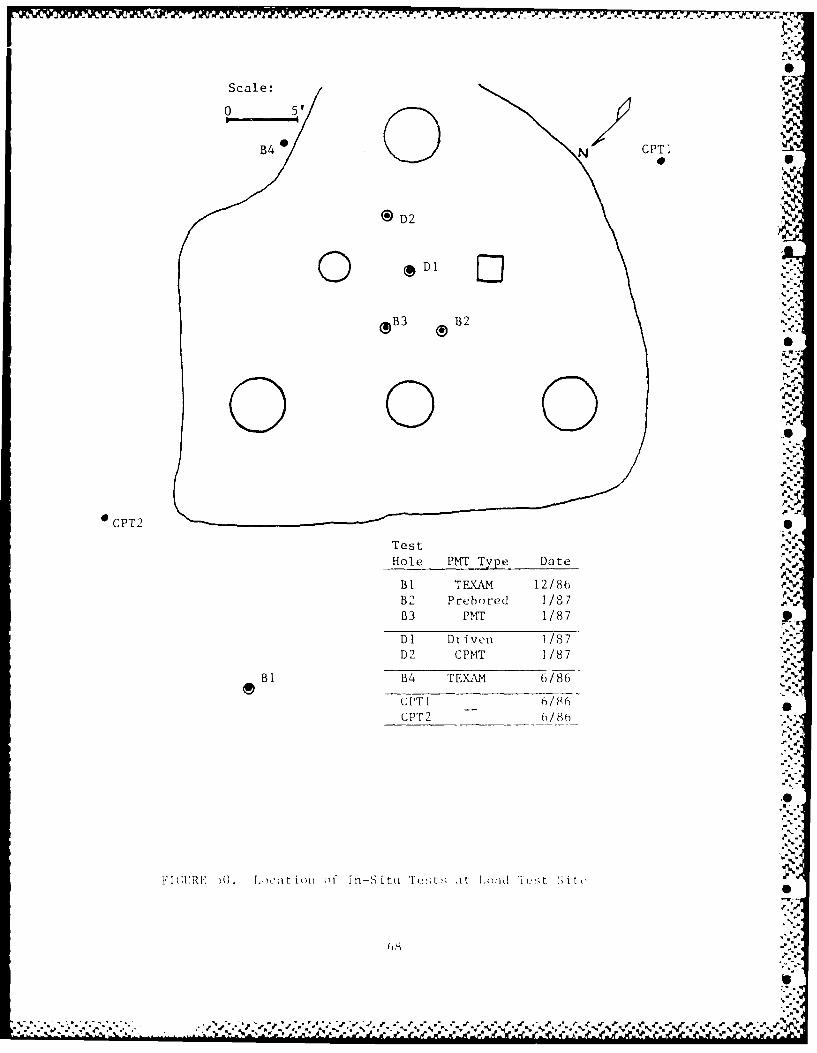
50 Location of In-Situ Tests at Load Test Site 68
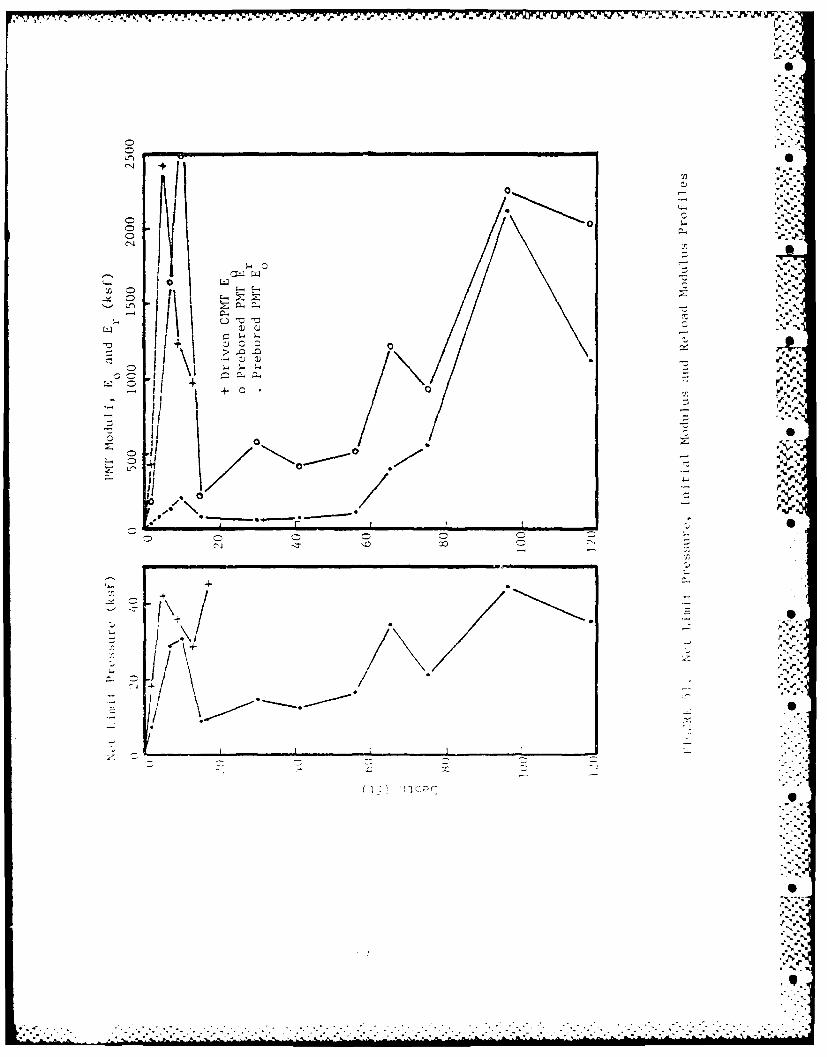
51 Net Limit Pressure, Initial Modulus andReload Modulus Profiles ... ........... .. 69
52 Prebored TEXAM PMT Generated P-y Curves for42" R.C. Drilled Shafts, Pile Nos. 4,5,6 71
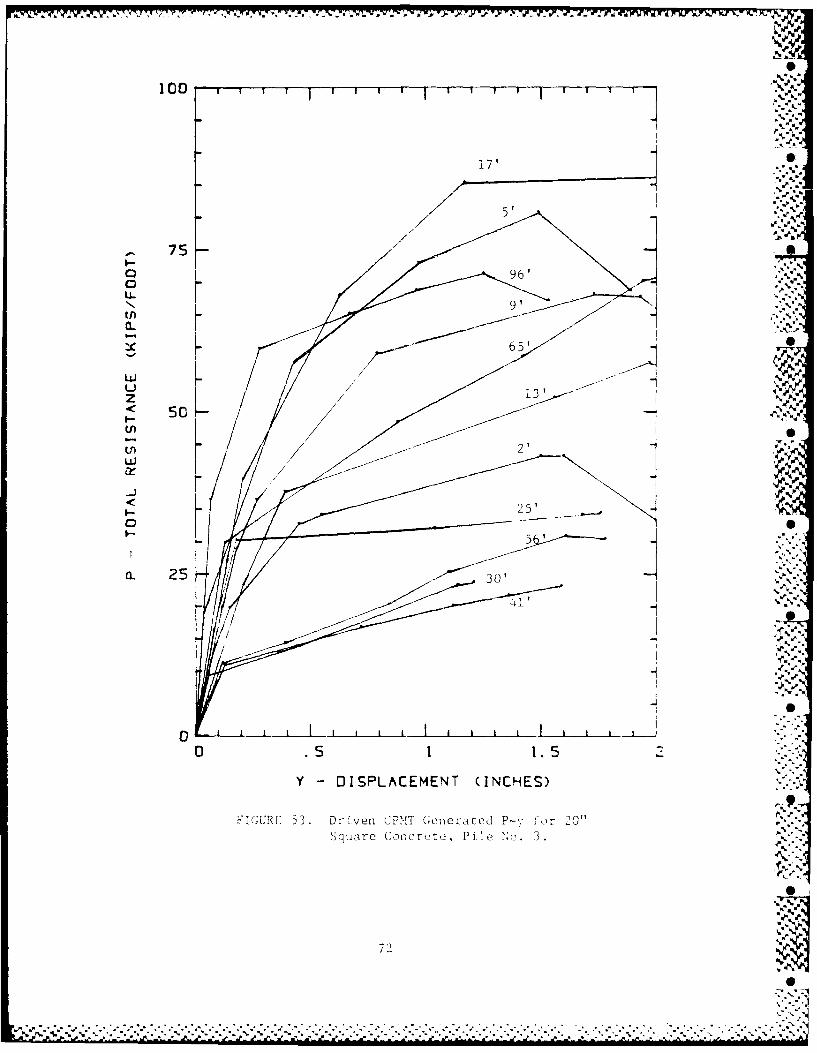
53 Driven CPMT Generated P-y Curves for 20""Square Concrete, Pile No. 3 .. ......... . 72
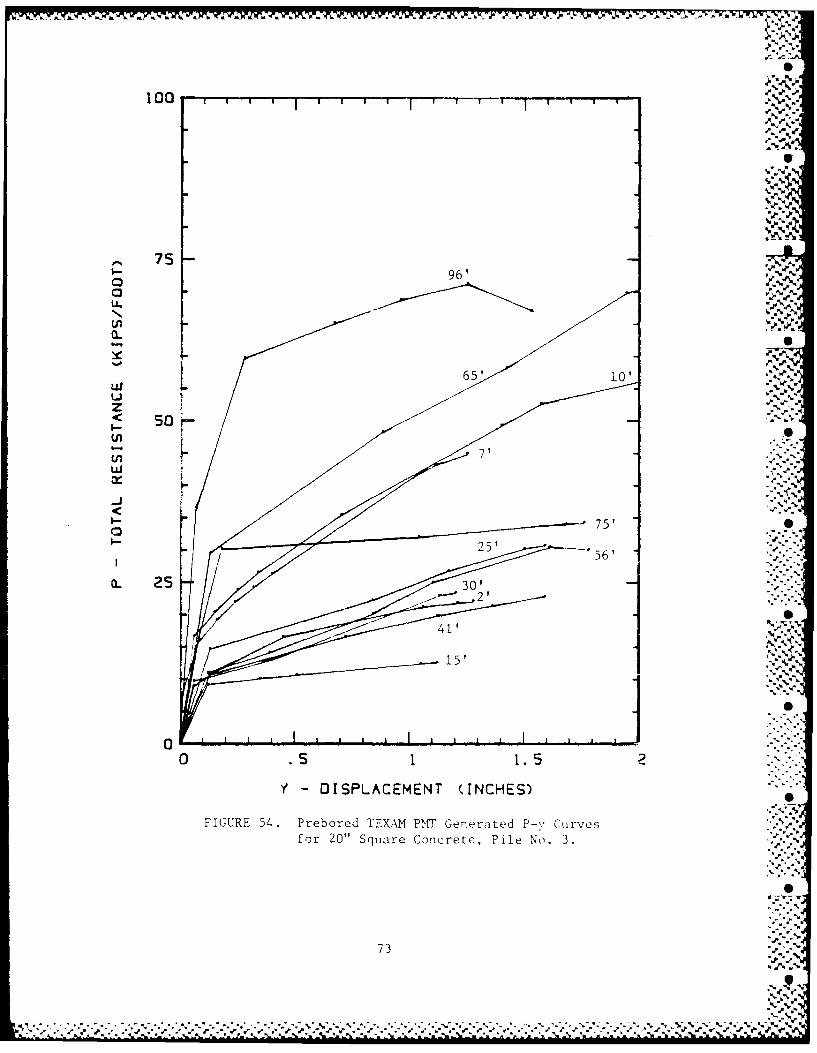
54 Prebored TEXAM PMT Generated P-y Curves for20" Square Concrete, Pile No. 3 ........ . 73
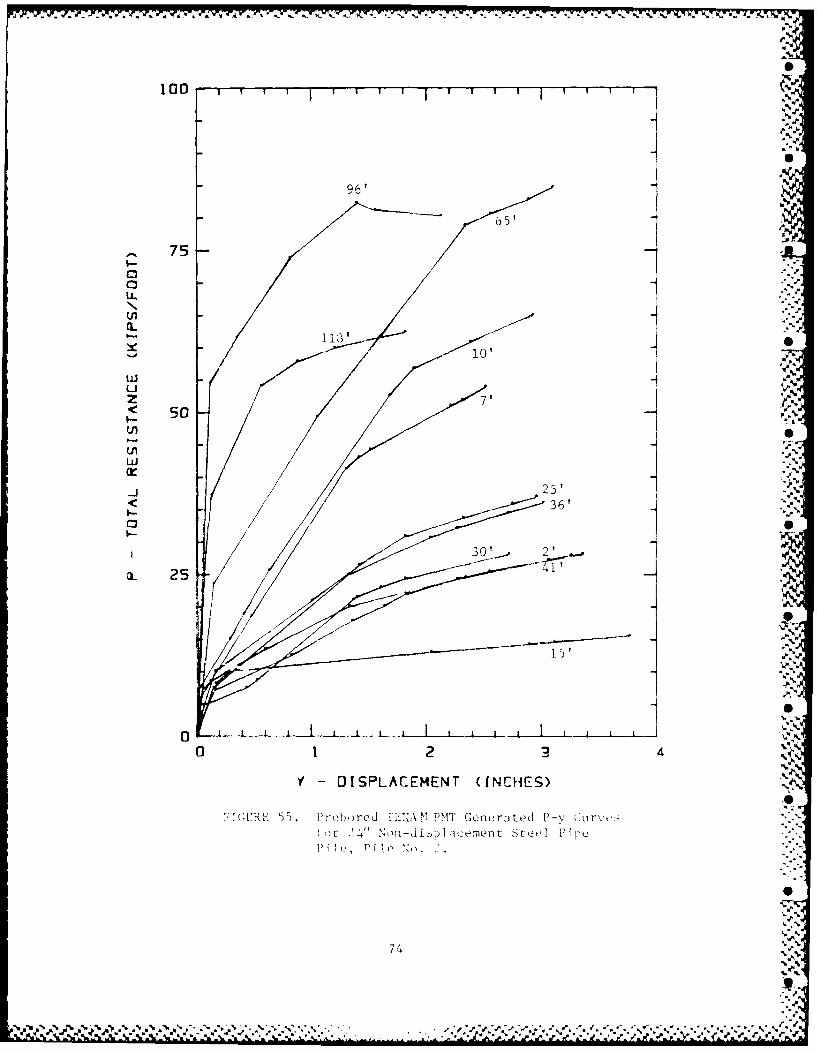
55 Prebored TEXAM PMT Generated P-y Curves for24" Non-displacement Steel Pipe, Pile No. 2 74
Viii -:
.' %
Figure Page ,SSS'.
56 Prebored TEXAM PMT Generated P-y Curves for36" R.C. Drilled Shaft, Pile No. 1 . . ... 75
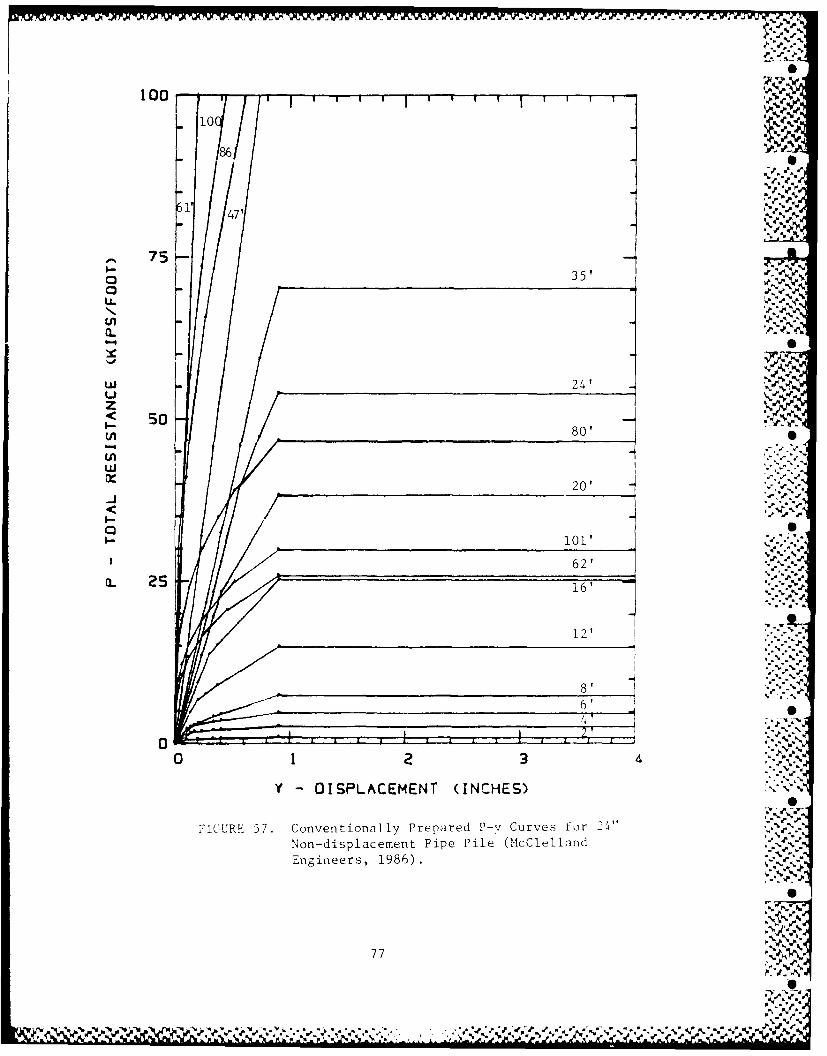
57 Conventionally Prepared P-y Curves for 24".Non-displacement Pipe, Pile No. 2 ........ 77...
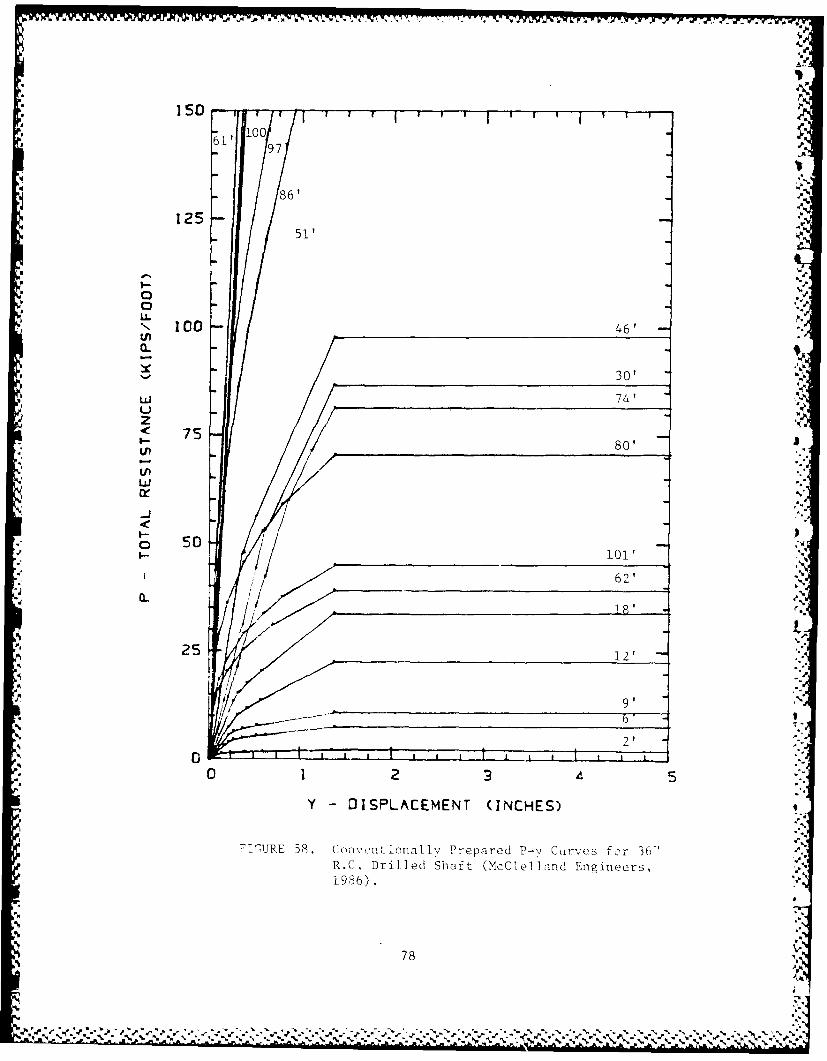
58 Conventionally Prepared P-y Curves for 36"-R.C. Drilled Shaft, Pile No. 1 . ....... 78
59 Definition of the Cyclic DegradationParameter for the Secant Shear Modulus . . . 79
60 Definition of the Cyclic Shear Modulus . . . 82
61 Definition of the Cyclic DegradationParameter for the Cyclic Shear Modulus . . . 82
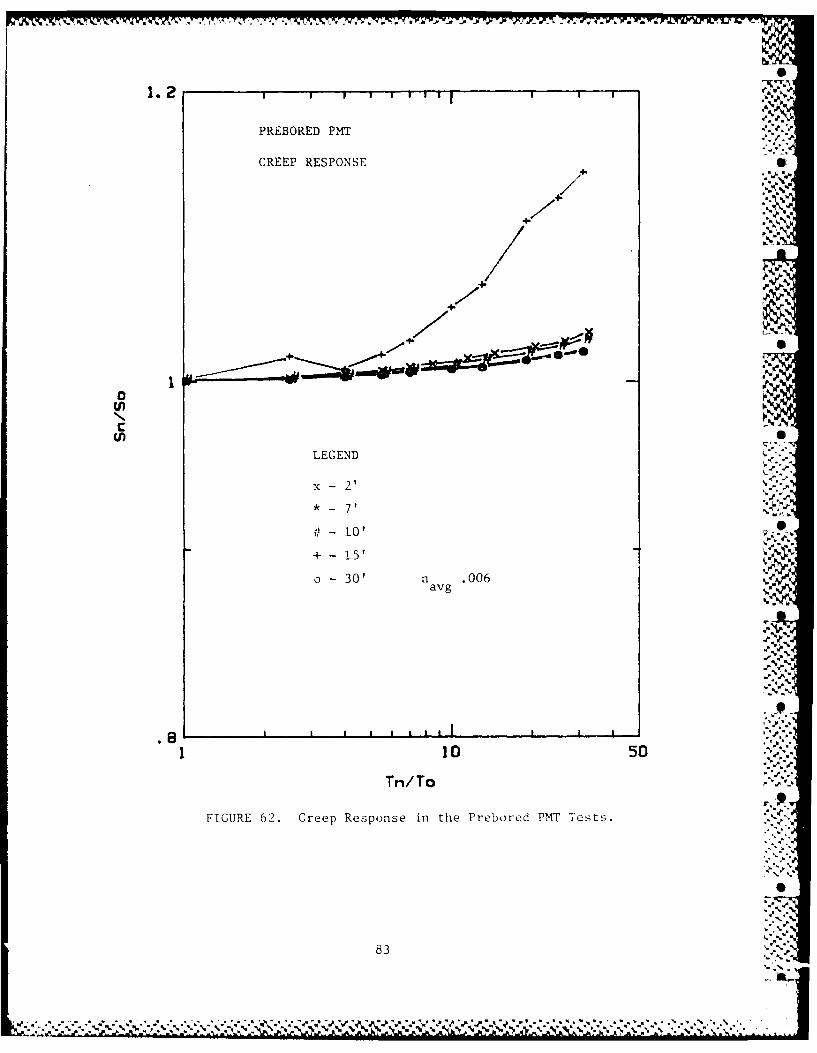
62 Creep Response in the Prebored PMT Tests 83
63 Creep Response in the Driven CPMT Tests . . . 84 ..-
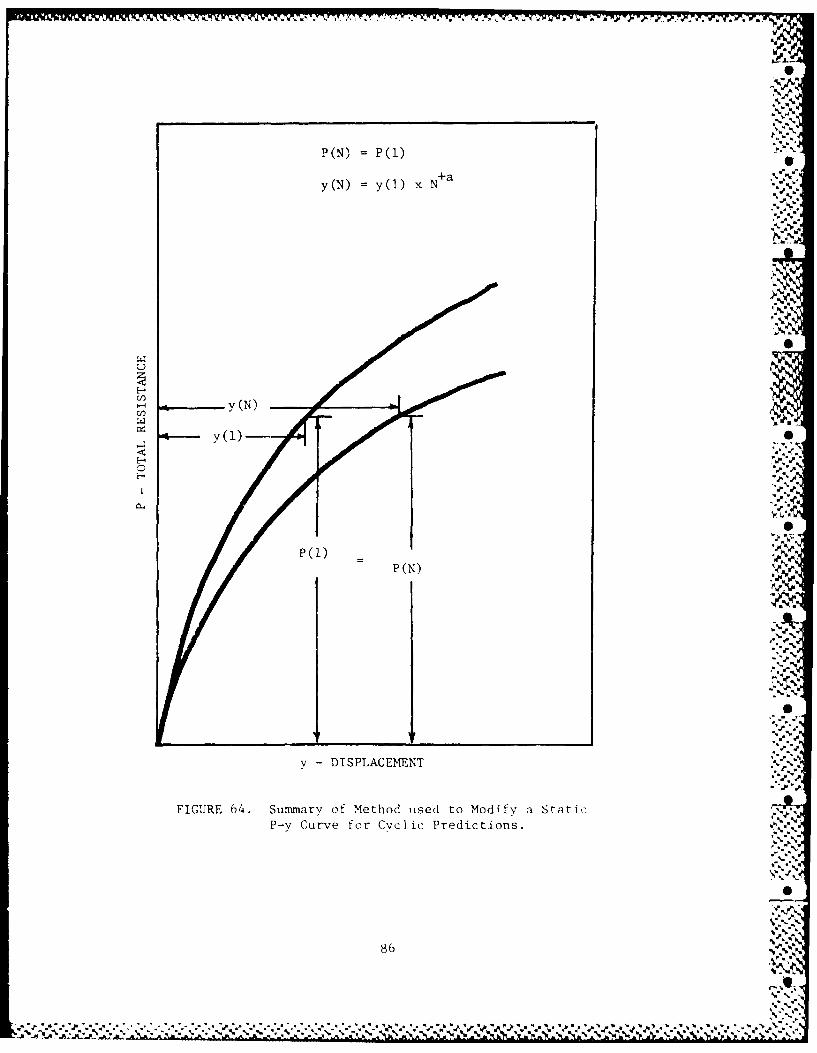
64 Summary of Method used to Modify a Static .
P-y Curve for Cyclic Predictions . ...... 86./ ,* - ",
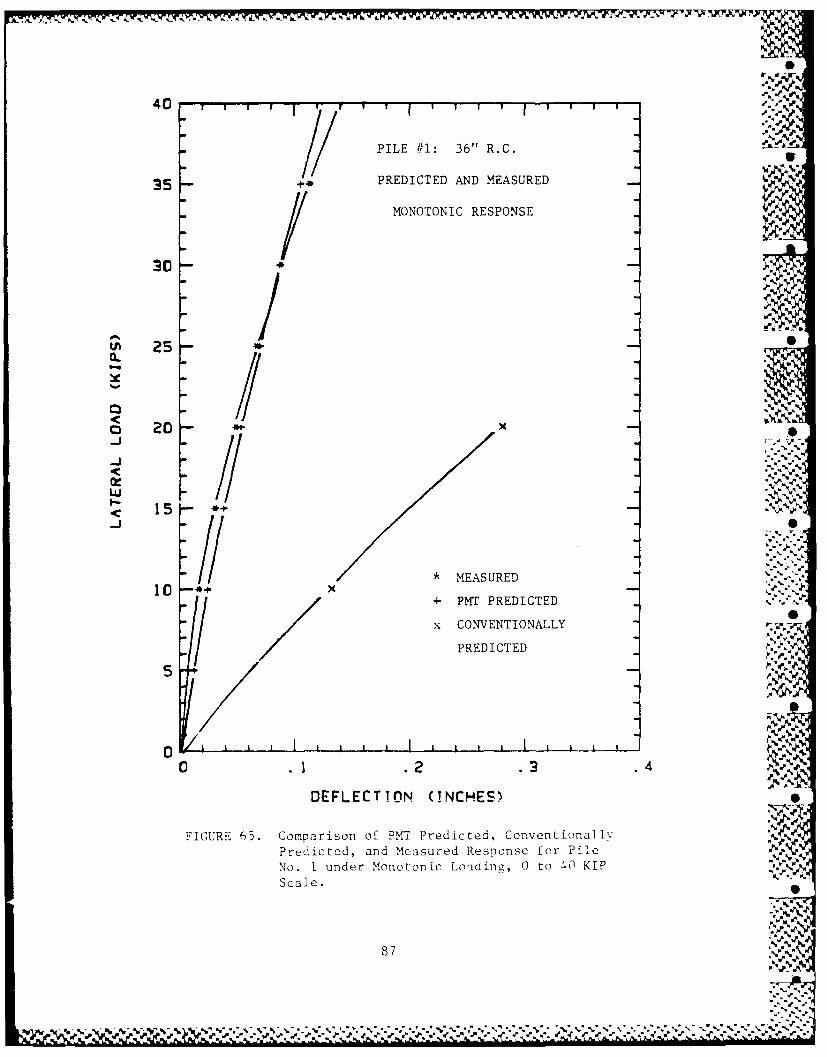
65 Comparison of PMT Predicted, ConventionallyPredicted and Measured Response for Pile -
No. 1 under Monotonic Loading, S0 to 40 kip scale .... ............. . 87
66 Comparison of PMT Predicted, ConventionallyPredicted and Measured Response for Pile ,.No. 1 under Monotonic Loading,0 to 200 kip scale ............. 88
67 Comparison of PMT Predicted, Conventionally %Predictcd and Measured Response for PileNo. 2 -.der Monotonic Loading,0 to 40 kip scale .... .............. 90
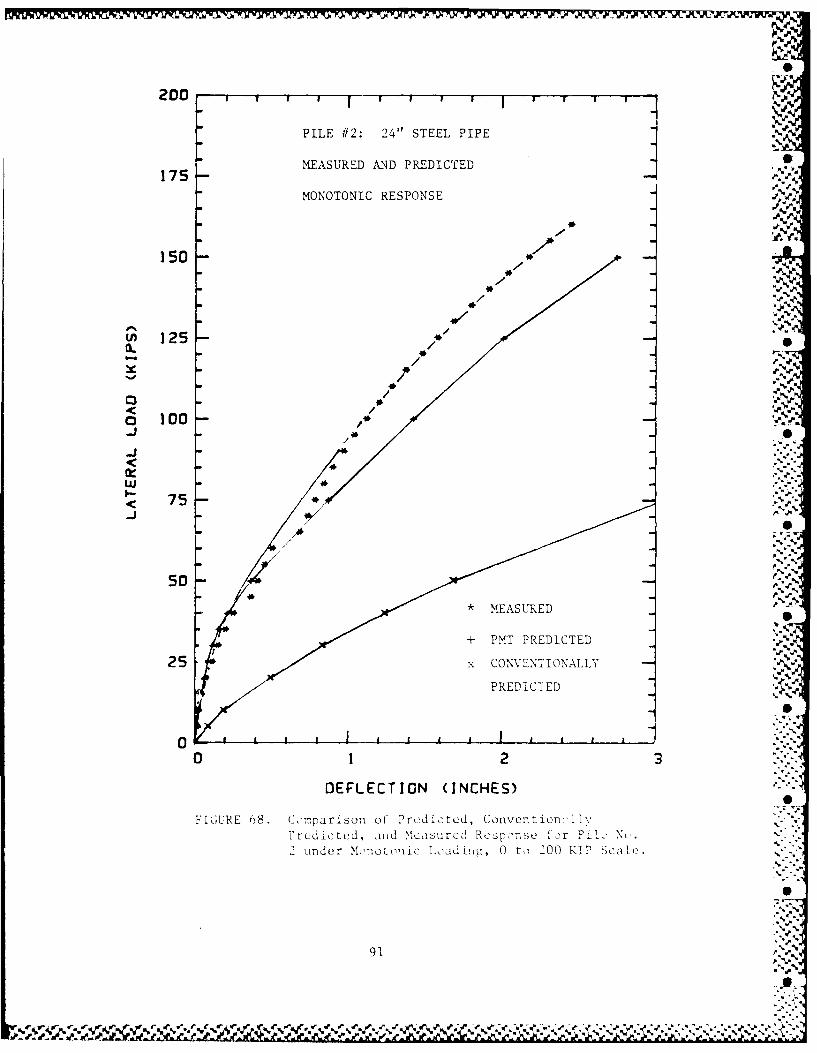
68 Comparison of PMT Predicted, ConventionallyPredicted and Measured Response for PileNo. 2 under Monotonic Loading,0 to 200 kip scale .... ............. 91
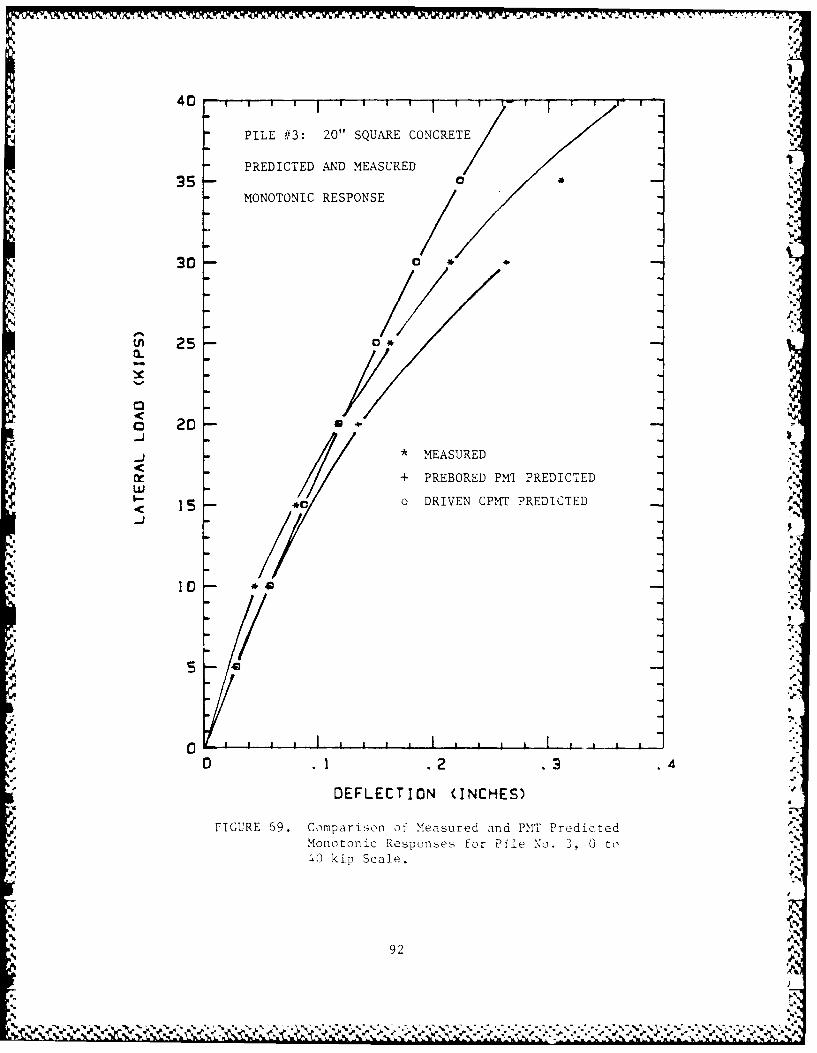
69 Comparison of Measured and PMT Predicted .Monotonic Responses for Pile No. 3,0 to 40 kip scale .............. 92
70 Comparison of Measured and PMT PredictedMonotonic Responses for Pile No. 3,0 to 100 kip scale ............. 93
. . . . . . . . . , : ,,,
ix. ~,"'-,k
_m -~~~*A .' :.. . . , : ,- . - ,
Figure Page
71 Comparison of Measured and PMT PredictedMonotonic Responses for Pile Nos. 4,5,60 to 40 kip scale ... ............ .. 94 3
72 Comparison of Measured and PMT PredictedMonotonic Responses for Pile No. 4,5,60 to 200 kip scale ... ............ . 95
73 Prebored PMT Predicted Cyclic Response, APile No. 1 ................. 97
74 Prebored PMT Predicted Cyclic Respoi.se,Pile No. 2 ...... ................. 98
75 Driven CPMT Predicted Cyclic Response,Pile No. 3 ...... ................ 99
76 Prebored PMT Predicted Cyclic Response,Pile No. 3 .i................ 100
77 Prebored PMT Predicted Cyclic Response,Pile Nos. 4,5,6 ..... ............... . 101
78 Difference in Confinement Between the PMTProbe Expansion (A) and the Lateral Movementof a Pile (B) ..... ................ 103
.-
.i
4 ,
LIST OF TABLES
-a
Table Page
1 Geometry and Properties of the Test Piles . . 13
2 Measured Cyclic Percentage Increase inDisplacement from the Pile Load Tests . . . . 35 :v
3 Measured Secant Shear Modulus DegradationParameters ...... ................. 38
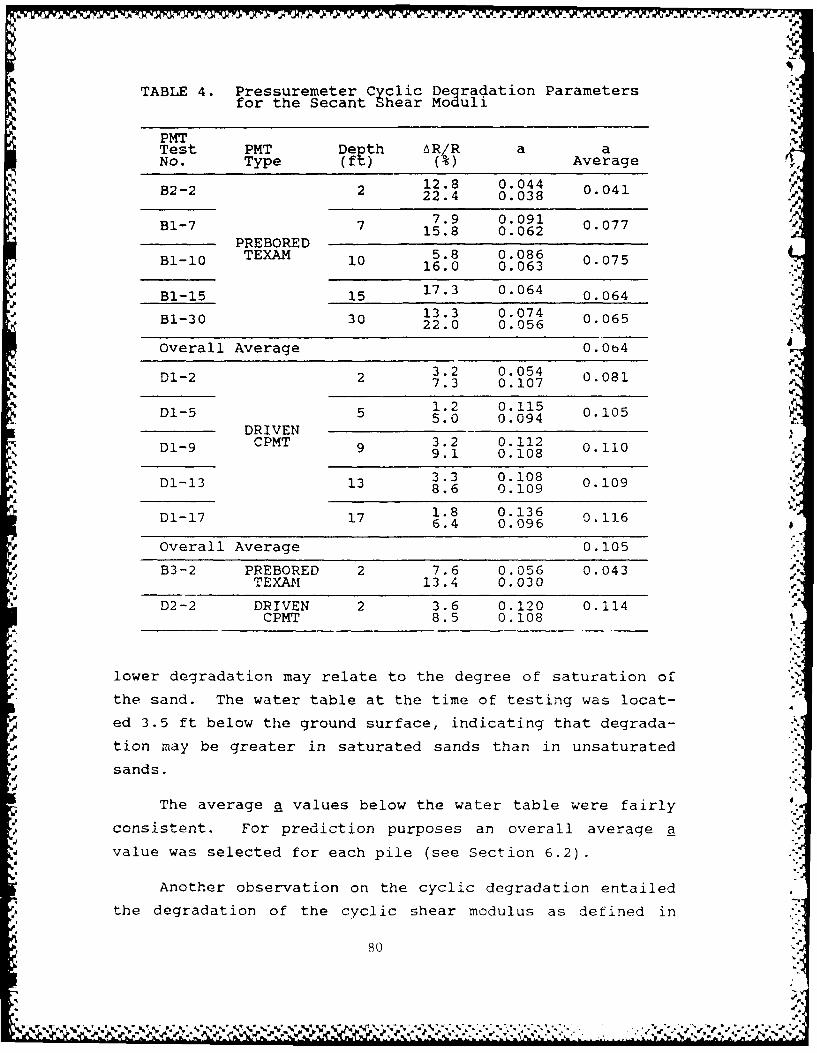
4 Pressuremeter Cyclic Degradation Parametersfor the Secant Shear Moduli ..... ......... 80
5 Comparison of Percent Increase in Deflectionwith Cycling: Predicted and Measured . . . . 102
6 Comparison of Measured and Predicted SecantShear Modulus Cyclic Degradation Parameters 106
xi"5 N
,4:.
-4',.
%p4
_nL_~
! Ti ~i-S
1. INTRODUCTION
1.1 Project Purpose
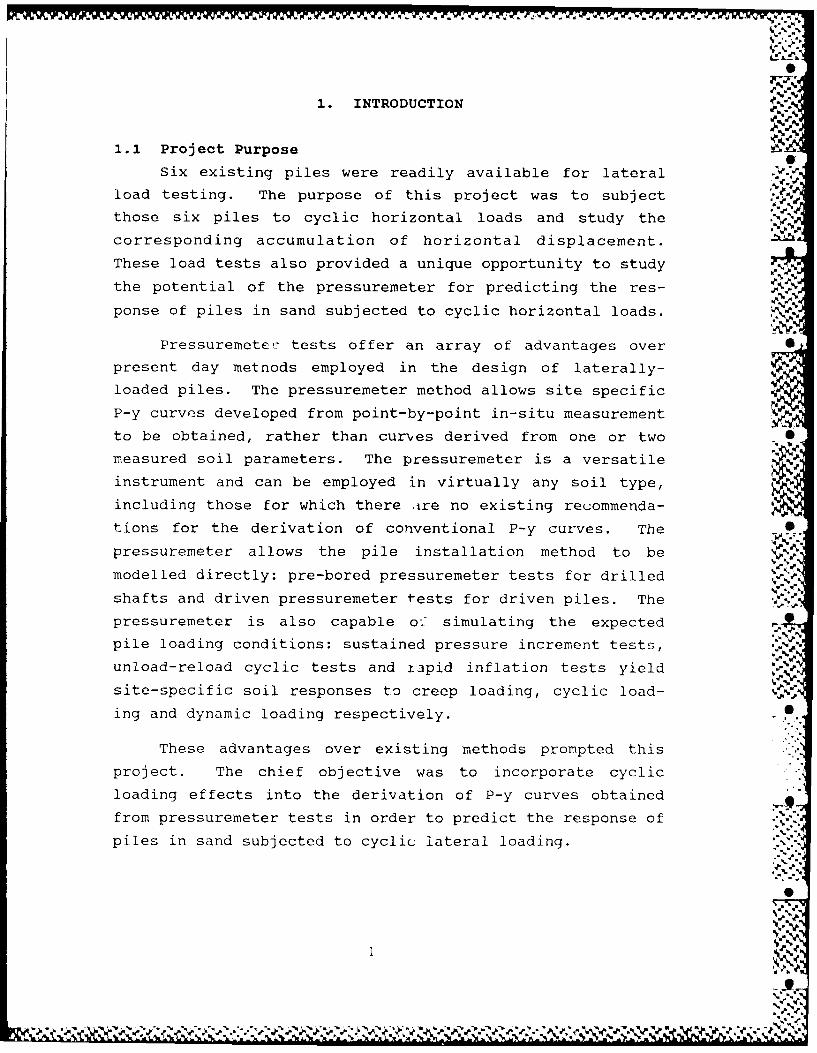
Six existing piles were readily available for lateral..V,
load testing. The purpose of this project was to subject
those six piles to cyclic horizontal loads and study the
corresponding accumulation of horizontal displacement.4
These load tests also provided a unique opportunity to study
the potential of the pressuremeter for predicting the res-
ponse of piles in sand subjected to cyclic horizontal loads. .-
Pressureete- tests offer an array of advantages over
present day metnods employed in the design of laterally-
loaded piles. The pressuremeter method allows site specific
P-y curves developed from point-by-point in-situ measurement
to be obtained, rather than curves derived from one or two •
measured soil parameters. The pressuremeter is a versatile
instrument and can be employed in virtually any soil type,
including those for which there ire no existing recommenda-
tions for the derivation of conventional P-y curves. The 0
pressuremeter allows the pile installation method to be
modelled directly: pre-bored pressuremeter tests for drilled
shafts and driven pressuremeter tests for driven piles. The
pressuremeter is also capable o- simulating the expected
pile loading conditions: sustained pressure increment tests,
unload-reload cyclic tests and iapid inflation tests yield
site-specific soil responses to creep loading, cyclic load-
ing and dynamic loading respectively.
These advantages over existing methods prompted this
project. The chief objective was to incorporate cyclic
loading effects into the derivation of P-y curves obtained
from pressuremeter tests in order to predict the response of
piles in sand subjected to cyclic lateral loading.
% %
1.2 Project Approach
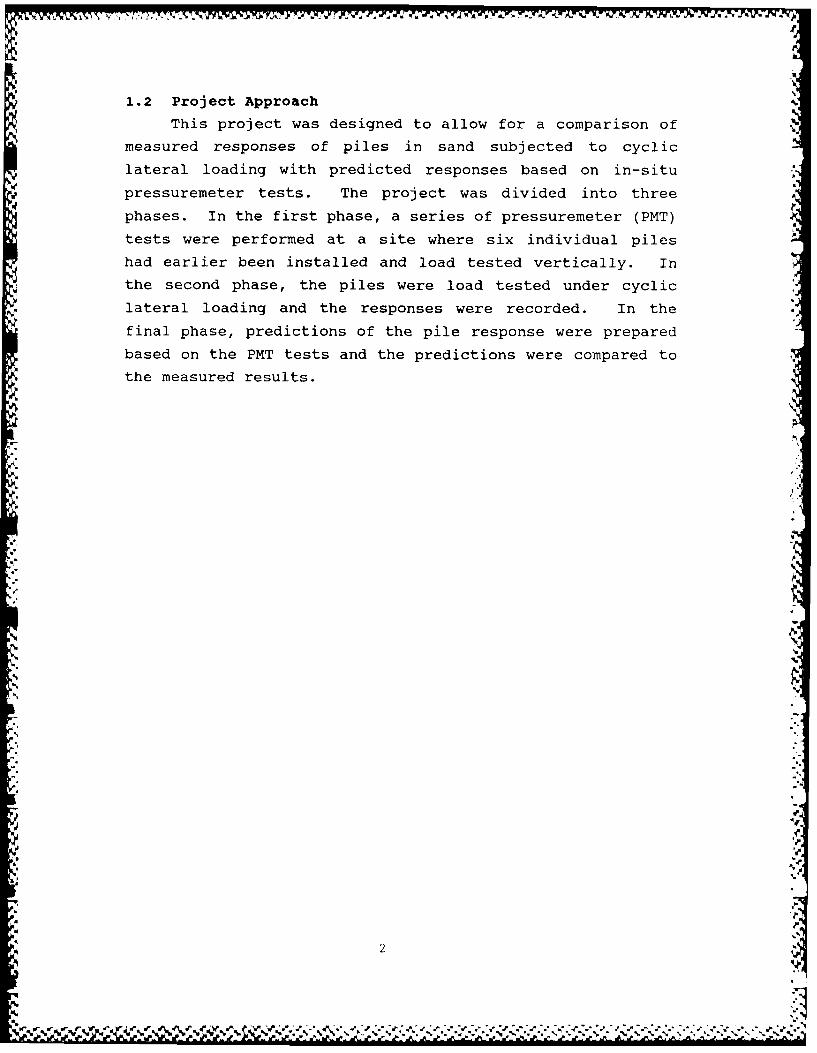
This project was designed to allow for a comparison of
measured responses of piles in sand subjected to cyclic
lateral loading with predicted responses based on in-situ
pressuremeter tests. The project was divided into three
phases. In the first phase, a series of pressuremeter (PMT)
tests were performed at a site where six individual piles
had earlier been installed and load tested vertically. In
the second phase, the piles were load tested under cyclic
lateral loading and the responses were recorded. In the
final phase, predictions of the pile response were prepared
based on the PMT tests and the predictions were compared to
the measured results.
.9.
'.9'
I.

2. THE SITE AND THE SOIL A.-
. .. , .i
2.1 Test Site Location '.
The pile load test site was located on property under
the authority of the Texas State Department of Highways and
Public Transportation at the northern end of the Baytown-La . ..
Porte tunnel on State Highway 146 near Houston, Texas (Fig-
ure 1). The six piles were arranged in a triangular pattern
approximately 300 ft south of the tunnel maintenance build-
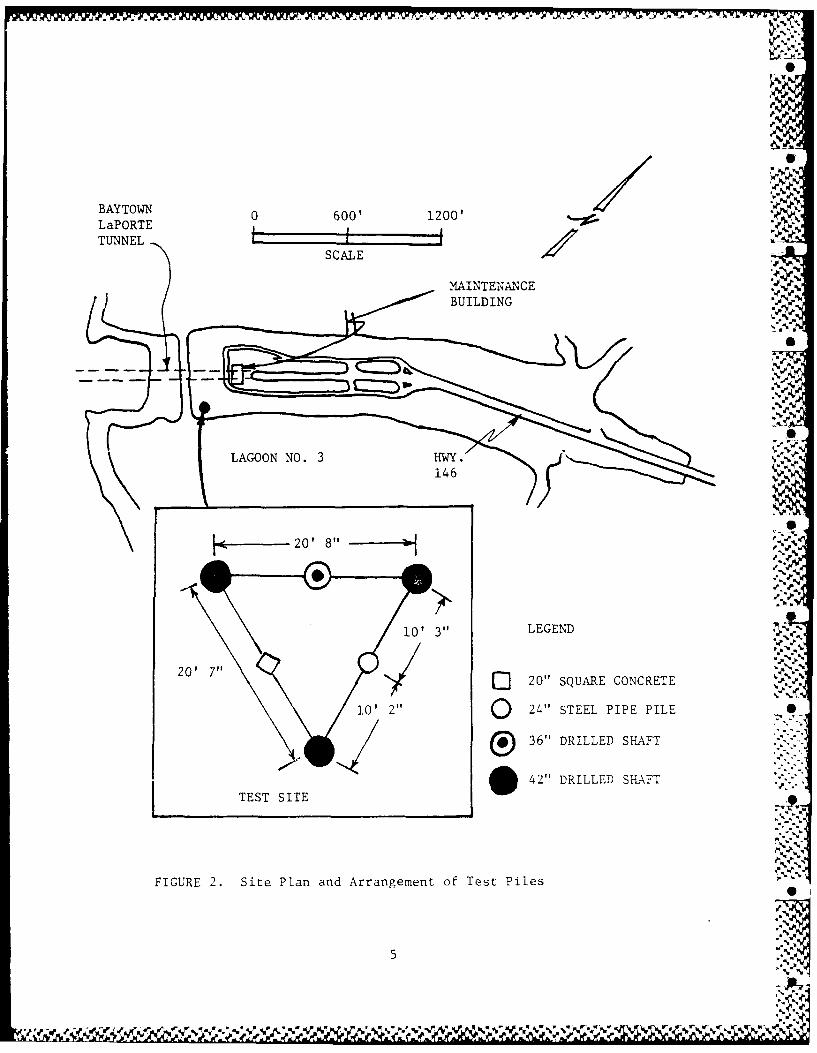
ing near Lagoon Number Three (Figure 2). The piles were
originally installed for vertical pile capacity load testing
in connection with the construction of a 100 million dollar S
cable-stayed bridge spanning the Houston ship channel at the
same location. ' A[
2.2 Soil Conditions and Stratigraphy
A variety of soil tests had been previously performed
at the site in conjunction with the vertical load testing of
the piles (Briaud Engineers, 1986). The soil was primarily ' '
composed of loose to medium dense fine sand in the upper 73 p
ft underlain by stiff to very stiff clay (Figure 3). A .-.
boring log with Standard Penetration Test (SPT) results,
grain size analysis curves and cone penetrometer test re-
sults are presented in Figures 4 through 6 to complete the
documentation of the soil.
-- %.- %=
, .-. A",.
3 A,,'. I
q. '4
l ' UlitllI
mlil ~ il ii iA •

HOUSTONINTERCONTINENTALAIRPORT
1-45
TEST SITE
1-610 ~
146
FIGURE 1. Location of Test Site
4
%0
- --- ~ . A -. .) - V
BAYTOWN 0 600' 1200' -.
LaP ORTE ___________SCALE
MAINTENANCE pm
'V".'.
o
'.4
N
20' 8"1
101 311LEGEND
C3 20" SQUARE CONCRETE
Yl
L E24" STEEL PIPE PILE
®36" DRILLED SHAFT
42" DRILLED SHAFT
TEST SITE-'
FIGURE 2. Site Plan and Arrangement of Test Piles
5*1
LAGON NO 3 HY. .,5146 7
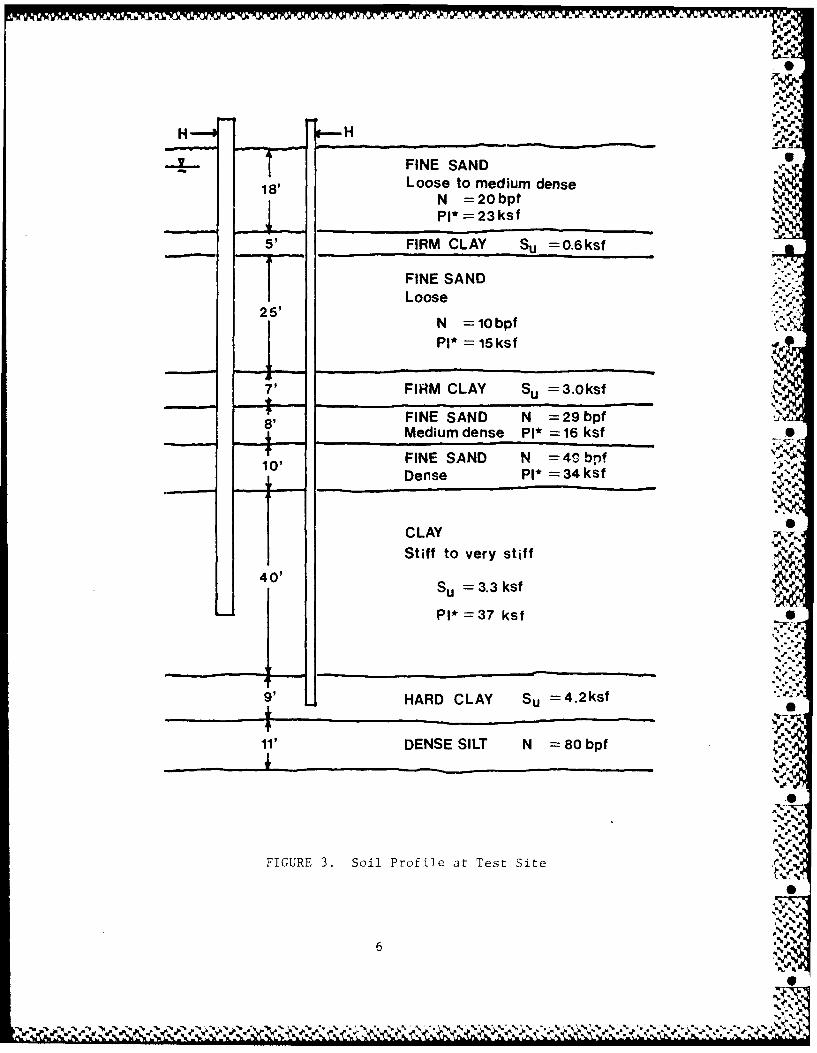
FINE SAND18, Loose to medium dense
N = 20bptPI* =23 ksf
51FIRM CLAY Su =0.6 ksf
FINE SANDLoose
N =l10bpfPI* 15 ksf
70FIRM CLAY S~ 3.0Oksf
FINE SAND N =29 bpf89 Medium dense PI* = 16 ksf
FINE SAND N =4S bnfDense P1* - 34 ksf
CLAYSti1ff to very stiff
40'Su = 3.3 ksf
P1* =37 ksf0
HARD CLAY Su =4.2ksf
11'DENSE SILT N =80 bpf
FIGURE 3. Soil Profile at Test Site e.
6
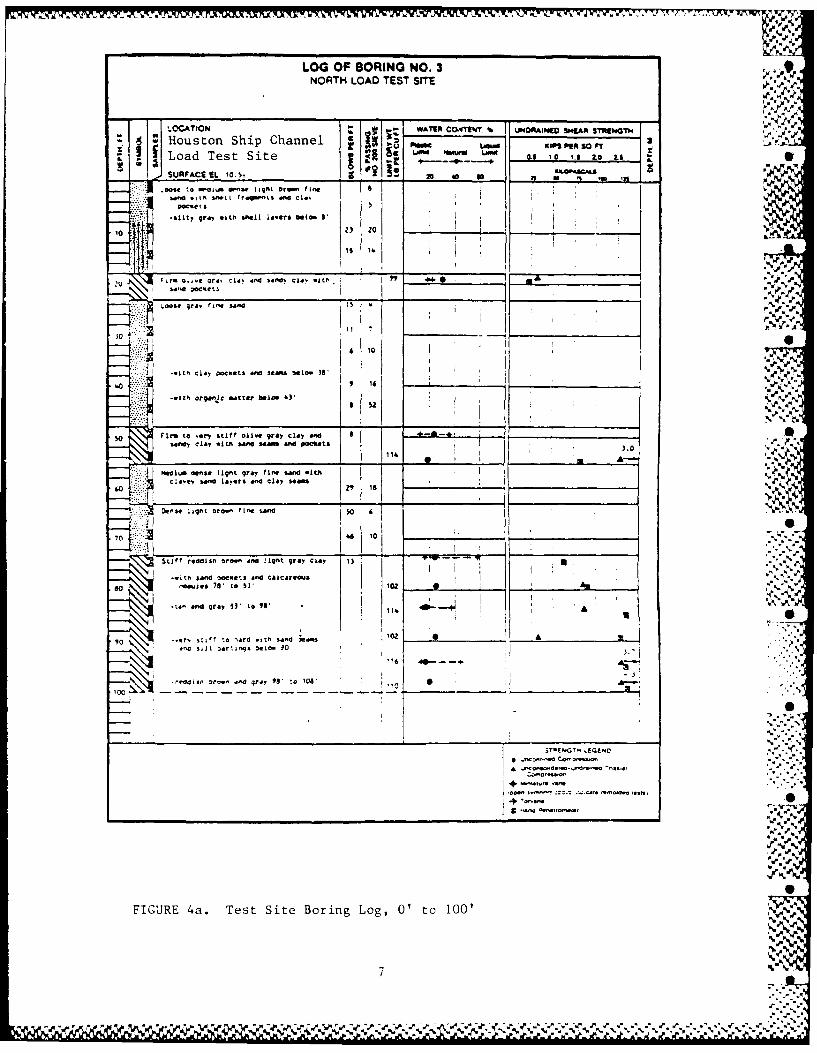
LOG OF BORING NO. 3NORTH LOAD TEST SITE • ',,
.CATION WAIR cov1w % UNDRAIP4. SKEAR TR2ING k
Houston Ship Channel ItLoad Test Site IL "I o %s o is SSURFACE EL I0~ _0 - 0a
-silty, gray ith shell lovers b o , I *
isI .
__ __ __ __ - .10 . P
Loose grb fine sno 15 %
6tr 10 wFsif0~e9~yC4 ~ **
ji *.t Clay 00CO@'.) and 34ais balm. M, % %
I , I
-w-.*Zi organjc .atter balm. 63' % %0
B Z .'=-'\
0 Frm to ery stiff oline gray"clay and
modan ci h l and s ad r eou ts 3.0
H . do-*@ Light gray fine sand .1,j°5-la.e. sand av. rs and clay s m I
10 %
DOens* ignt orown, fine sand
70~ 4- I 0
$ Stff relddisn aronn and light. gray Clay 13 %
eth sand aockets and Calcareous5I
so 4. Ts iBdios 70 to 30 0 %-
I , .. .I. .-.
-ta" and gray 93' to 18'15
90 &Ziff to ,ard *,'.n Sand = 100Anc I It & rt INS Doesm '0'6
-indis y~..,andqr. 98 o10
SS
0e~~~~~,~ %.n % ~.'~ . tn
7 00.
j L 'XMNA?".A N
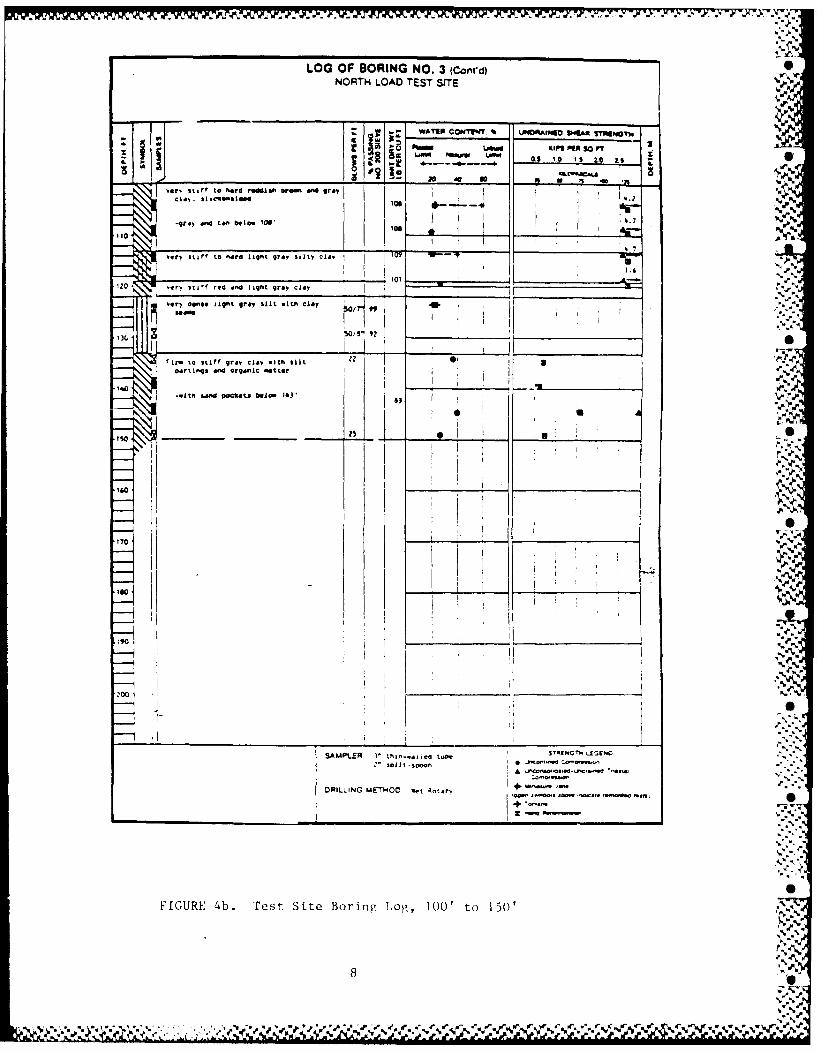
LOG OF BORING NO. 3 (Conrc) 1NORTH LOAD TEST SITE
- WAhIE COStiff l. hiIIDA10ra 94IWI SThVMGO s,
I~~I P .6 %P.V
, srt~f tno hardhi e It. ore a"g y
- -
U 0 '. .m
-dt .dL&- twlss 108' 106 % P110 A
veystiff to hard light gry t y 114 -
! . 2 ... " 5.
'VI
oarti dffd oranic ntteI -
-. 4th. I&Wr poftets 0010- 14) '
--1U .. !:I,1.
ISO
zoo I.
FIGURE 4b. Test Site Boring Log, 100' to 150' '-0 ' %
% " '
r , .,- s 2. " ".
tUaeM AS -w lwe
t
- A1
II~1 IA IAt .
4c 3a~ V.
(UU
ItiMOM~ ~~ ~ AS-ti uoa
_ _ _ _ _~d
%__ __ _
_ - -
S - - ..... C.. *.k *k t n - a,..........$
V7.
£
7'.
S 7.7
~U 8 'M Ag a~~woo ~uOOJ% 7
-- p
.7'.2 ~ 2 2 2 2
I' -~IC7~~
I .1~"S4.7
- C 7
UI -
0 H- p7
C .~ ..~ -, C
N -
C~ U~ V~
~.J >-
I -~ SII ~:~~::: S
~.7
0 -
0 0 ~ .7.7w -I I 7. DII[
-.7 N -.7
.7
77
17 --4
0 _________________________ l~ I-.
* F
-p ____________ .~
.77 mm. 7.~ '.7'77 ______________ 7.
7' -
7' ~- ~-
S -4 .7
'.1* .- .71 0 --- .7
C' -
7 (.F *77
V. _____________________
* _________________ -____________________________
0
*7
~J~'~M .\~ JOUI~ UBZJQd
.7 I .7,5'
.777~*
7...
10 .7
.7.7
47*
4
7.'.
.-,-
0
FRICTION SLEEVE TIP RESISTANCE RATIO(TSF ITSF) (IZ
0.0 2.0 4.0 0 100 200 300 0 2 4 6 8 10 %
I . _ _, - - _ ,
%.
4 _-_ 11- ,,-
U.--
7.-
969
F9GURE 6a. Test Site Cone Penetrometer Data: CPTI
S %
- -. %r
' " " " ",i, ,". " " '...., -. '.'.''. '. .. . -- ". _. ',...:,..- ....... '-%..J-.' ..... '.....#%-%- ,",",",S
FRICTION SLEEVE TIP RESISTANCE RRTIOTSF) (TSF) M ) "'
36 - - -I-
soo6 _" _ . "7:*1
, 5, I,
(D
U -- "-
70
: T l - R" tlb 'I t' t "
.4%
4.
4-.
. . . . .. . . . . . . . . . . . . . . . . :-. * -
3. THE PILES
3.1 Layout of the Piles
The six piles at the load test site were arranged in a 4'
triangular pattern as shown in Figure 7. This layout was
selected at the time the piles were installed to load test
vertically the three smaller piles on the legs of the tri-
angle. The three 42-in diameter shafts in the corners were
used for vertical reaction.
3.2 Geometry and Properties of the Piles
To accuately predict the response of laterally loaded .
piles, the geometry and flexural stiffness of the piles must S
be accurately represented. Correctly selecting the
properties of the piles in this study was complicated since
the piles had previously been stressed during the vertical
load tests. The geometry and properties which were selected
for use in the prediction process are presented in Table 1.
TABLE 1. Geometry and Properties of the Test Piles ,
Pile ID Embedded AssumedNumber Description Lenth EI
(f) (Ib-in2 )
1 36" Diameter Reinforced 97 1.70x101 1Concrete Drilled Shaft
24" O.D., 5/8" Thick Steel 20 0.91x10 I "Pipe P4le (Open-ended)
3 20" Square Prestressed 98 0.16x10 I1
Concrete Pile "
4,5,6 42" Diameter Reinforced 128 1.80x10 I .Concrete Drilled Shaft
The 36-in diameter drilled shaft was subjected to axial
compression during the vertical load test. The flexural
stiffness assumed for the lateral load test predictions was •
set equal to the stiffness obtained using its cracked moment
of inertia. This method assumed that during lateral loading
of the pile the portion of the pile cross section in
compression transferred stresses to the concrete and to the
13

EXTENT OF 3-FT EXCAVATION
N0 feet
scale
CORING ALIGNMENTS
6 5P
PILE NO. TYPE
1 36" DIA. R.C. DRILLED SHAFT2 24" O.D. 5/8" THICK STEEL PIPE PILE
3 20" SQUARE PRESIRESSED CONCRETE PILE/4,5,6 42" DIA. R.C. DRILLED SHAFTS
FIGURE 7. Arrangement and 1.D. Numbers for theTest Piles
14
'Y N
steel reinforcement. The portion of the cross section in
tension, however, was assumed to carry all the stresses in
the steel reinforcement alone. The areas of the cross sec-
tion in compression and tension were assumed to be the comp-
ression and tension areas obtained when applying the allow-
able bending moment to the reinforced concrete section (Wang
and Salmon, 1979). For a previously unstressed pile these
assumptions may be considered to be conservative.
The 24-in pipe pile was assumed to have an elastic ". -.
modulus of 29 000 ksi. The moment of inertia selected for
the prediction process was based on the pile being complete- S
ly empty of any soil throughout its length due to the soil,. *
plug being drilled out after driving.
For the 20-in square prestressed concrete pile, the
stiffness calculation was further complicated by the fact
the square cross section was not aligned with the direction
of the horizontal load to be applied. The angle between the
horizontal load and the sides of the square cross section
was 260. The selected stiffness in Table 1 considered the
unusual angle of load application and was based on the
cracked moment of inertia as explained for the 36-in drilled
shaft. In all inertia computations, the prestressing
strands were assumed to carry stresses only in tension, and *
were not included in the computations for the portion of the
cross section in compression.
During the vertical load tests the three 42-in diameter _
reinforced concrete reaction shafts were subjected to axial
tension up to 1000 tons. In the calculations of their flex-
ural stiffness, the elastic modulus and the moment of iner-
tia were substantially reduced from the values that would be
assumed for a previously unstressed pile. This was neces- ..
sary to account for the inevitable tension crack formation
that must have occurred during the axial load tests.
15
* ~ *,,.....,,.%.V%

1
.,,
$
I|

4. THE LATERAL LOAD TESTS F..
4.1 Site Preparation
The site had been backfilled following completion of S
the vertical load tests, necessitating excavation before
performance of the lateral load tests. The boundaries of
the excavation can be seen on the pile layout in Figure 7.
The depth of the excavation was approximately 3 ft, allowing
sufficient clearance for setting up the loading apparatus .
and the displacement gages support frame. A..
4.2 Loading Apparatus and Pile Preparation
The lateral loading of the piles was achieved using the .,-
system depicted in Figure 8. Each pile was cored horizon- .a..'
tally to allow a length of 1-3/8 in, 150 ksi Dywidag-
threadbar to be passed through the pile's central axis. The
cored holes through each pile in the corner of the triangu-
lar layout were aligned with the cored holes through the
pile on the opposite leg of the triangle (Figure 7). AS
length of threaded bar was passed through the cored hole of -
a corner pile and a 200-kip load cell was screwed onto the
end of the bar near the center of the triangular layout. .
Another bar, passing through the pile on the opposite leg of
the triangle, was screwed onto the other end of the load
cell. Steel reaction pads were placed over the threaded
bars behind the piles to distribute the lateral load over a
wider area and the threaded bar was locked with a nut behind .
one of the two piles. A 200-kip hollow-core hydraulic jack
was locked behind the opposite pile around the threaded bar.
As the jack was expanded, the tensile force in the threaded -.
bar pulled the two piles towards each other. The load cell ."
measured the horizontal load applied to each pile.
Dial gages were securely attached to an independently
supported displacement measuring frame. Deflections were
measured at two points on each pile: one point below the
17

200 KIP HYDRAULIC HOLLOW-CORE JACK DISPLACEMENT MEASURING FRAME
42" DIA. R.C. DRILLED SHAFT 9" TRAVEL DIAL CAGE3" TRA,, VEL DIAL GAGE.: T1 PL~DISPLACEMENT MEASURING FRAME
DYWIDAG NUT "._ CORED HOLE 1 DYWIDAG-TIIREAIJBAR
0 %'
A = Distance from line of loading to top dial gage
B = Distance from line of loading to bottom dial gage
C = Distance from line of loading to ground surface
S
Pile I.D. A B CNo. * (in.) (in.) (in.)
1 24.75 (4.25) 3.5
2 11.56 4.94 8.4 .'.!
3 21.06 8.06 10.0 .-
4 10.0 2.0 3.5
5 11.88 4.56 8.4
6 8.5 9.38 10.0
* See Figure 7.
•* Above line of loading
FIGURE 8. Horizontal loa0d Application nd .
D iop I acement Measur ing System
%
,-
% % - .%, % %.%

axis of loading close to the groundline and one above the
axis of loading. This allowed the deflection and the slope
at the groundline to be obtained. The position of the dis- --
placement measuring frame was checked with a transit before
and after each load test to guarantee that there was no
movement of the frame during testing. The locations of the
dial gages and the line of loading are shown on Figure 8.
4.3 General Loading Scheme
The loading scheme for each test followed the same
general pattern. Loads were applied in five kip increments.
After each increment, displacement readings were taken imme- A
diately and at one minute intervals for five minutes as the
load was maintained. Two load levels were selected during
each test to perform 20 unload-reload cycles. The cycles
were performed under load-control conditions. After reach-
ing the first chosen load level, the displacements were
recorded during the first five minutes as the load was main-
tained. The load was then decreased to near zero by com-
pletely relaxing the jack. Displacements and load readings
were recorded after two minutes and the original cyclic load
level was reapplied. A new set of readings were then re-
corded after an additional two minutes; the cyclic period
was thus four minutes. After ten cycles, the bottom, lower
load, of each cycle was increased to half of the top cyclic
load level. After twenty cummulative cycles, the five-kip, Vs
five-minute inccemental loading was resumed. When the sec-
ond chosen cyclic load level was reached, the load was
cycled between the chosen load level and one-half of the
chosen load level for the first ten cycles and then between
the chosen load level and near zero load for the last ten
cycles. After completion of the second series of cycles the
five-kip, five-minute incremental loading was resumed and
continued until the end of the test.
4.4 Results of the Lateral Load Tests
Tabulated results of the lateral load tests are pre-
19

I . . - * ' . U L i I . -. - - . _ :. - , t a .- -- . -- . 1
sented in Appendix A. Lateral loads versus horizontal de-
flections of the piles are presented graphically in Figures
9 through 20. The displacements are those measured by the
lowest dial gage for each pile, as described in Section
4.2. Two graphs are presented for each pile: one showing J
the entire response range during the load test and another
detailing the cyclic response.
4.4.1 Monotonic response envelopes
Curves enveloping the response of the piles to incre-
mental loading intervals are presented as monotonic response
envelopes in Figures 21 and 22. These curves yield a con-
servative estimate of each pile's behavior under strictly
monotonic incremental loading. In reality, the responses
for identical piles not subjected to the two series of
cycles would likely be stiffer. This can be substantiated
by observing the pronounced permanent displacements experi-
enced by each pile during cyclic loading in the case where
the load was decreased to almost zero load (Figures 9
through 20). Furthermore, the concrete piles were subjected
to increased crack propagation during the cyclic series (see
Section 6) effectively reducing their stiffness as the tests
progressed.
The monotonic response envelopes allow comparisons
between the piles to be made. The three 42-in diameter
drilled shafts reponded within a narrow range of values,
showing consistency within the testing method, shaft con-
struction and soil properties. They proved to have the
stiffest response, followed by the 36-in diameter drilled
shaft, the 24-in diameter steel pipe pile and finally the
* 20-in square prestressed concrete pile. )
One of the 42-in diameter drilled shafts failed during
the load tests (Pile No. 6). This premature failure re-
fle;ts the damage incurred by the reaction shafts during the
vertical load tests discussed in Section 3.
20
I_'
2001 1 I I I I I I I I I I
175 PILE #i
150
U'125
100
100 Drilled ShaftFlo 36 inch Dia. /~
wI< 75 77'SN
N = 21 blows/f t.
P= 3.3 ksf25 Pi=3 s
0 12 3 4
DEFLECTION (INCHES)
FIGURE 9. Measured Response from CyclicLateral Load Test for Pile No. 1,0 to 200 Kips Scale.
21
zJ
PILE #1
. . .... - ....
75
</a 50--
I-
25 -- ,"
SERILLED SHAFT
:" . 36 INCH DIAMETER .,
0 .2 .4 .6 .8 -/
DEFLECT ION (INCHES)
''%,
FIGURE 10. Measured Response from Cyclic" ',.Lateral Load Test for Pile No. 1,Cly _ling Detail, 0 to 100 Kips Scale.
22
I%',S
1 -.
6*c'-.-.". °4 -. 4- . , . .,".-- ' . .'% . . . % ' '. . % ,' ,' ' .' ".'-' . *' ,' "-. . . . ". -","",'.. . . % % '4. w %. 4.. . . ./ . ,. # . ,- . ,. ._. # ,. . .. W. . ,W,,,. * . . .-. ., ., W . . . . . .
_ -I ,-, - I ,o, w * . , ,444., 4"44I~l k'lilk~li . . ...

.- .r.-,,. ,.-
- ..- V
175 PILE #2
Ap
"d -50-..
U 125CL
.'.".
a 10 Steel Pipe Pile_1 . /,.. 24 inch Dia.••.
I- -? -. "hu0625inc wall.~ ,
< 7-
N = 21 blows/ft. .Pr' = 20 ks-
".% .**.CLAY! ,9' Su= 3.3 ksf <.
r ~~P*= 36 ksft. .,
a * I I a I * a "° - -0 1 2 3 4 ,',. ,. ..
DEFLECTION (INCHES)
,-. 4 '."
FIGURE 11. Measured Response from Cyclic LateralLead Test for Pile No. 2, 0 to 200Kips Scale.
23
.........
."4"/
-' 4 p.**'.~*,1'~ ... 'E'.d. . .1 4g.> . * 4~ %~,%~~ .4 p. ~.p.p. 'p.. 'p.54p p.~p.' .,..* * .. -' - 4 ' " ... :-.-'p.
-a -A. 4/ - - .vJ~,70
" 60 PILE #2* "
50,
'-' S7U)I
.~ 40 ..
< 30 "
W I
20
STEEL PIPE PILE
1 024 INCH DIAMETER
101
-,0 1* "-
0 .2 .4 .6 .8
DEFLECTION (INCHES)
FIGURE 12. Measured Response from Cyclic Lateral
Load Test for Pile No. 2, Cvclin-Detail, 0 to 70 Kips Scalp.
24 /%V
200
Prestressed Concrete
175 20 inch square%
ISO
V) 125 9 =3. s%
Pt*=36 kst
0
4C 750
so1
PILE #7 "
0 1J, 2 34
FIGURE 13. Measured Response from Cyclic Lateral
Load Test for Pile No. 3, 0 to 200
Kips Scale.
25

-~~~~~~~ ..---------------------------------------------...- - - - - - - --.
700
70p
60 PILE #3
50-
(n/a.
40 1.
0/<~ 30
wI
/ .2 .4.S. 1
20LCTO (INCHES)UR --
FS -IR 4 esrdRspnefo V1CTaea
LoadTestfor ileNo. , C-clciigS
Deal o7 isSae
O~~~ %2 .4 8 .
200
17S PILE #4.
ISO
15S
-- e
0 1200.
o2 inch Di
N ='e Shaft s ft
44
2S U21;Pl* /1 36 kst
DEFLECTION (INCHES)
FIGURE 13. Measured Response fernm Cyclic LateralLoad Test for Pile No. 4, 0 to 200Kips Scale.
27
/ II liC
100
PILE #4
75
a-p
0 50
2 IC D
~ 0
,, -l
--.
-2INH IAETR p
,
0 .2 3 4 5
DEFLECTION (INCHES)-C
FIGURE 16. measured Response from cyclic Lateral
Load Test for Pile No. 4, Cycling Detail,
0 to '00 Kips Scale.
28
NJ'. w

I .... . _ _ .t
175 PILE #5
ISO
• , '* .,r
125
a. *lI "
!/
C
a 100
<~ Drilled Shaft
w 0 --- 'I ' I ' ' 'l I | I I I I ."":"'
< 75
/S
150 /-,""".
25 -
Pl*=36 ksf
o O0 %_1__Drilled____Shaft____.____.__-...__,
0-- " I a I I
0 .5 1 1.5
I ' \•
DEFLECTION (INCHES)
FIGURE 17. Maasured Response from Cyclic LateralLoad Test for Pile No. 5, 0 to 200Kips Scale.
--29 9".-%
O .5 . 5 . F
F%%*FGURE* 17~..* M*sue Respons fro Cy li Laea "...'-..
70 0
60* %.
80<V
7 0 PIES
42 INC DIMEE
0 .2 .3. 4
/ELCTO (ICHS
0 40 80 KisSae
< 30

200 , ' * "
Drilled Shaft
175 42 inch Dia.
73 SAND
150 N- 21 blows/ft.
PI" = 20 ksf
L) 125 * CLAY 0I. F Su= 3.3 ksf ." "
Pl*= 36 ksf
.J
p
~PILE #6
o 100 -.. '. ,
I l
m..
,
- .:- .2SS
0
DEFLECTION INCHES)
.
FIGURE 19. Measured Response from Cyclic
Lateral
-..
A .,
Load Test for Pile
No. 6, 0 to 200
Kips Scale.
31
%.% %
.0
70
PILE #5/
so Od-ai
a./
//-4
x 40
D // -". .30
-J Iw
I- / -.'
20 8 / DRILLED SHAFT
/m 42 INCH DIAMETER
10
5 €.g". I,. .
U. *.. • . . .
0 .1.2 .3
DEFLECTION (INCHES)
FIGURE 20. Measured Response from Cyclic Lateral .
Load Test tor Pile No. 6, Cycling Detail,0 to 70 Kips Scale.
32

mS
200
175 PILE NO. 4 1%In
S./ 0 0 3
150~~ + V/ / //1jo 4. o" .- . :
,c + //
L" 125 + *
- ,x + , _
/2
o 20" SQUARE CONCRETE.
"/ * 24" PIPE PILE
://
0 36" DRILLED SHAFT".,--20 x, .4" DRILLED SHAFT.00
0 1 2 :3 -:"
DEFLECTION (INCHES)•
FIGURE 21. Monotonic Response Envelopes Measured :.
During Pile Load Tests, Full Range Scale. ,'£
% %
33 2"-E NE
50 / ~ 4" PIPPILE
, , .(
$, X,,O,,. ,-,;-w..,:,,..-,),:,..,-,,-,,..;...,.0:. 36"v .....-.;... DRILLED;.--.....:...-.;:. . -..vSHAFT....-..... .:... .---. .. . , t l m l l l~ " " •" '"-I 'l/eli" n ' ;''' '
40 /.~~- . . ,I,,
40
MI 25 x
C L J
0 20-
/11/- 20" SOUARE CONCRETE-
15 * 24" PIPE PILE
"36"1 DRILLED SHAFT
x #542" DRILLED SHAFT
10 1 1 [t
.,
0 .1 .2 .3 .4
DEFLECTION (INCHES)
FIGURE 22. Monotonic Response Envelopes Mea.sured '1
During Pile Load Tests, 0 to 40 Kips
Scale.
34
['.- , . ...... ., . • • . ."," " •- ."• " ". ". ". ". "..": .- ." " " ","".""."",""."", ." "" "" "" 7 >.' -' '.''. :.' .' ."",,' ,,' ,,' .,'.'.'.'1'£.,.''.',",7. '." '
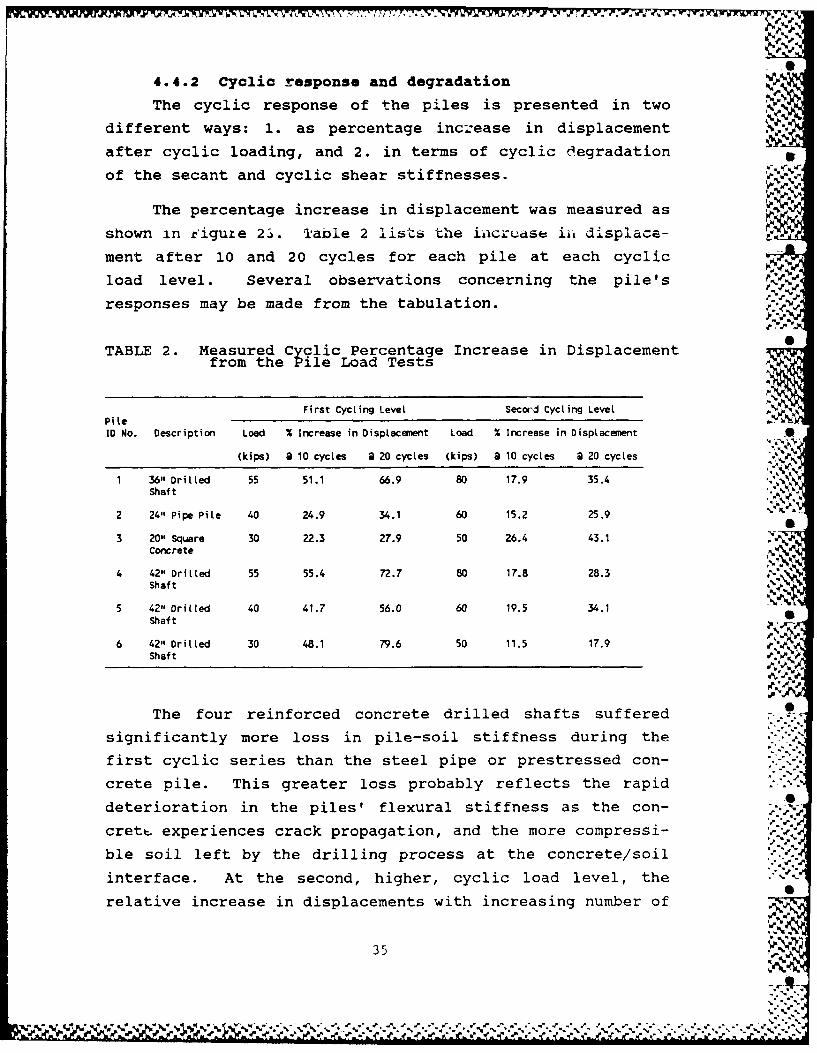
4.4.2 Cyclic response and degradation
The cyclic response of the piles is presented in two
different ways: 1. as percentage inc:ease in displacement
after cyclic loading, and 2. in terms of cyclic degradation
of the secant and cyclic shear stiffnesses.
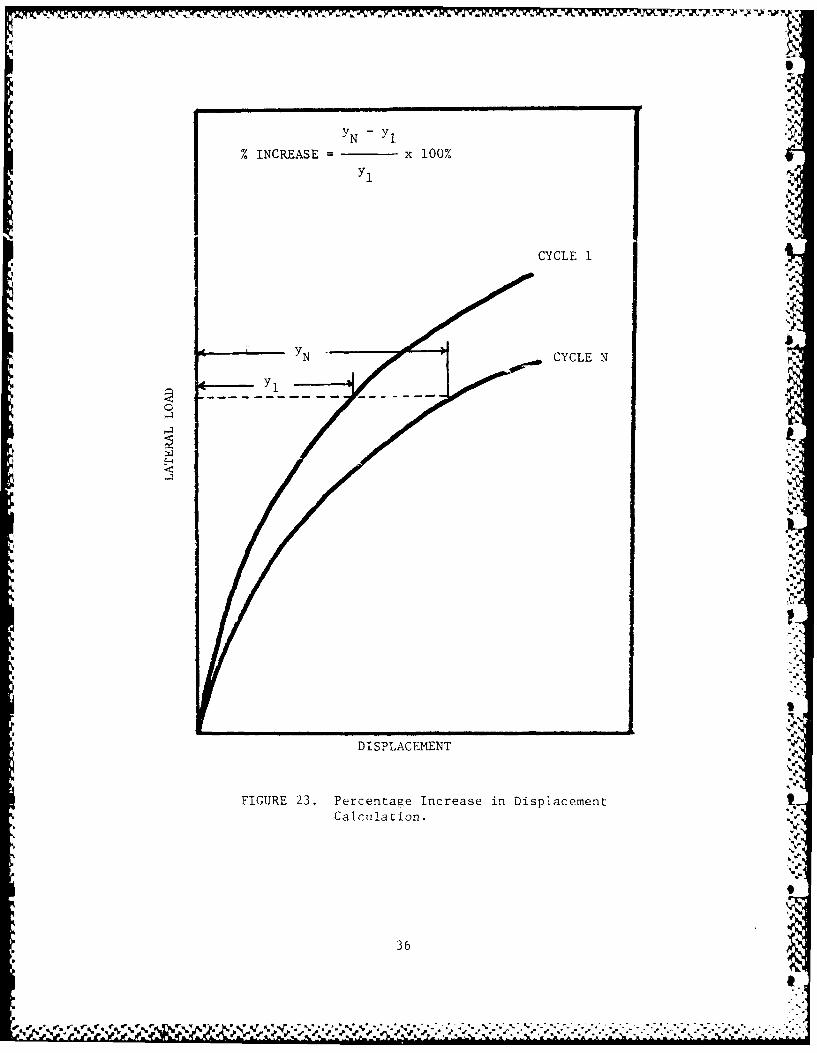
The percentage increase in displacement was measured as
shown in riguie 2-. Table 2 lists the iacrL-ase ii, displace-
ment after 10 and 20 cycles for each pile at each cyclic
load level. Several observations concerning the pile's
responses may be made from the tabulation.
TABLE 2. Measured Cyclic Percentage Increase in Displacementfrom the Pile Load Tests
First Cycling Level Secord Cycling LevelPileID No. Description Load % Increase in Displacement Load % Increase in Displacement
(kips) a 10 cycles 2 20 cycles (kips) @ 10 cycles @ 20 cycles '
1 36" Drilled 55 51.1 66.9 80 17.9 35.4Shaft
2 24" Pipe Pile 40 24.9 34.1 60 15.2 25.9
3 20" Square 30 22.3 27.9 50 26.4 43.1Concrete
4 42" Drilled 55 55.4 72.7 80 17.8 28.3Shaft %
5 42" Drilled 40 41.7 56.0 60 19.5 34.1Shaft
6 42" Drilled 30 48.1 79.6 50 11.5 17.9Shaft *-
The four reinforced concrete drilled shafts suffered -
significantly more loss in pile-soil stiffness during the
first cyclic series than the steel pipe or prestressed con-
crete pile. This greater loss probably reflects the rapid
deterioration in the piles' flexural stiffness as the con- ,.
cret, experiences crack propagation, and the more compressi-
ble soil left by the drilling process at the concrete/soil
interface. At the second, higher, cyclic load level, the
relative increase in displacements with increasing number of
35
A-. .,-.%. I
.wr
% INCREASE . x 100%
Y°i.
CYCLE 1
N CYCLE N
DISPLACEMENT
!
~~FIGURE 23. Percentage Increase in Displacement
Calculation.
" 36
-4.
55
cycles was much lower. This difference may be explained as
follows. During the first series of cycles the piles' flex-
ural stiffness deterioration contributed significantly to
the total pile-soil stiffness response. In the second
cyclic series, as the piles' flexural stiffness was reaching
a limiting value and since the sand had been stiffened by
the first series of cycles, the cyclic deterioration of the
pile-soil stiffness was much less. As an example, notice
that pile 4 was cycled at 55 kips and experienced an in-
crease in displacement of 72.7% after 20 cycles, whereas .oM
pile 6 cycled at 50 kips experienced only a 17.9% increase
in displacement. The significant difference was that the 55
kips cycling level was the first cyclic series for pile 4
and the 50 kips cycling level was the second cyclic series
experienced by pile 6, occurring after a cyclic series at a
load level of 30 kips.
The prestressed 20-in square concrete pile and the
steei pip( pile did not exhibit the same behavior. Pre- %
stressing of the 6quare concrete pile enabled it to resist
the effects of crack propagation by keeping a larger portion
of the pile cross-section in compression during the lateral
loading. As a result, the percentage increase in d iplace-
ments of the prestressed concrete pile duplicate more close-
ly the behavior of the steel pipe pile during the first
series of cycles. At the second cyclic load level, the
prestressed concrete pile showed a significant increase in
relative displacement during the last ten cycles. At this
load level, the internal bending moment within the pile was
probably of sufficient magnitude to put a large portion of
the concrete cross-section into tension, causing crack prop-
agation and the associated loss in pile stiffness.
Very little loss in pile stiffness alone was expectedin the 24-in diameter steel pipe pile load test, especially
at low load levels. It is reasonable to assume then, that
37
the majority of the relative increase in displacement due tocyclic loading is the result of the soil stiffness degrada-
tion. This assumption seems to be reinforced when comparing
the response of the 24-in diameter pipe at the 60-kip load
level with the response of the drilled shafts during the
second series of cycles. Indeed, all the values are rela-
tively close to one another.
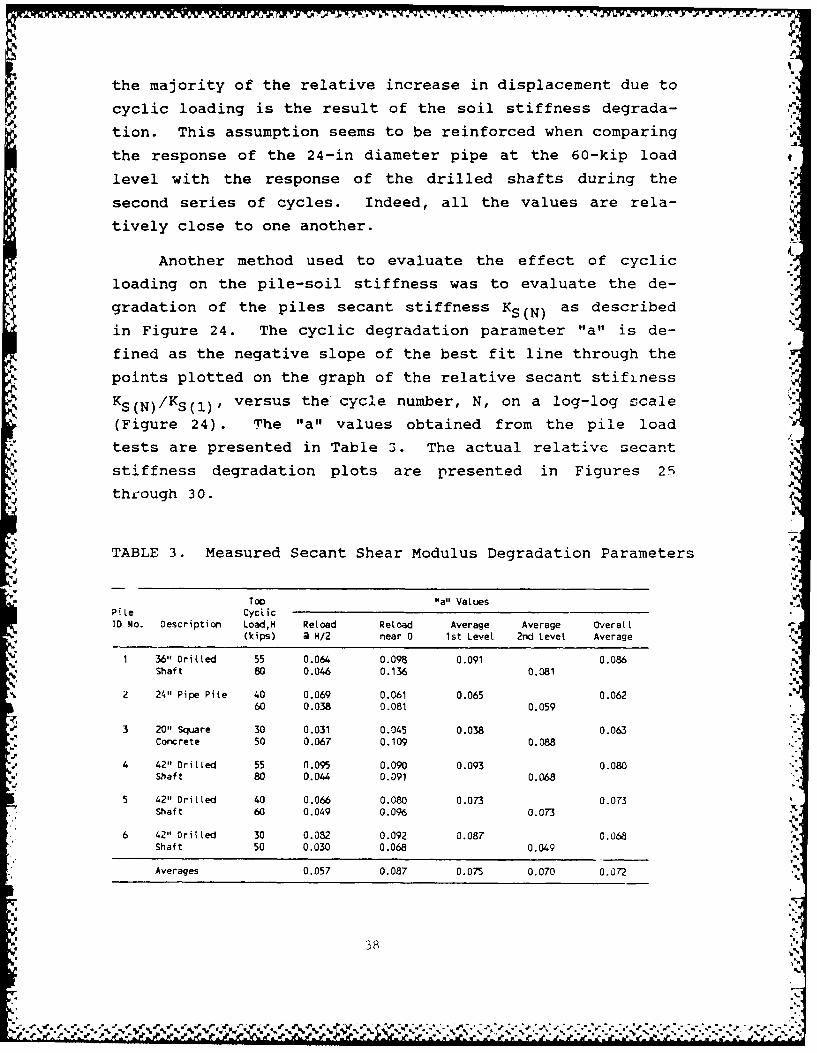
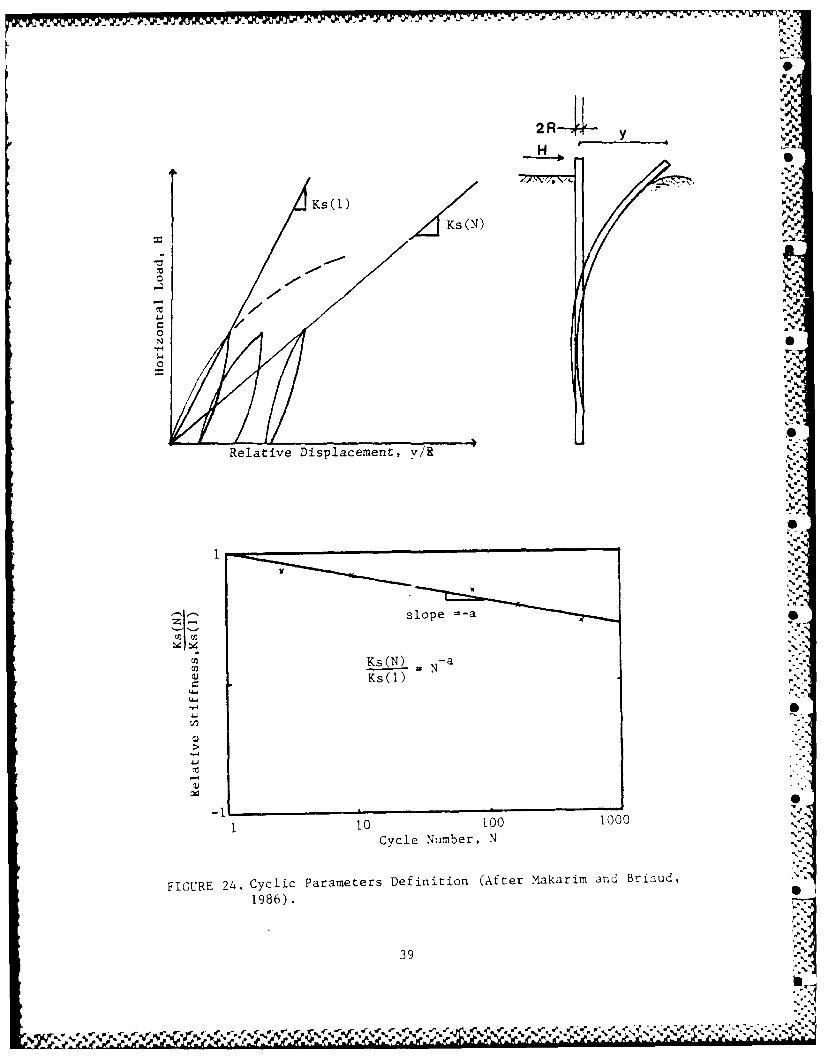
Another method used to evaluate the effect of cyclic
loading on the pile-soil stiffness was to evaluate the de-
gradation of the piles secant stiffness K as describedS(N)in Figure 24. The cyclic degradation parameter "a" is de-
fined as the negative slope of the best fit line through the
points plotted on the graph of the relative secant stifiness
S(N)/Ks() , versus the cycle number, N, on a log-log scale
(Figure 24). The "a" values obtained from the pile load
tests are presented in Table 3. The actual relativc secant
stiffness degradation plots are presented in Figures 25 '5
through 30.
TABLE 3. Measured Secant Shear Modulus Degradation Parameters
Too "a" ValuesPile Cyci icID No. Description Load,H Reload Reload Average Average Overall .
(kips) 9 H/2 near 0 1st Level 2nd Level Average
1 36" Drilled 55 0.064 0.098 0.091 0.086 ,
Shaft 80 0.046 0.136 0.081.1%
2 24" Pipe Pile 40 0.069 0.061 0.065 0.06260 0.038 0.081 0.059
. 3 20" Square 30 0.031 0.045 0.038 0.063Concrete 50 0.067 0.109 0.088
4 42" Drilled 55 N.095 0.090 0.093 0.080Shaft 80 0.044 0.091 0.068
5 42" Drilled 40 0.066 0.080 0.073 0.073Shaft 60 0.049 0.096 0.073
6 42" Drilled 30 0.082 0.092 0.087 0.068Shaft 50 0.030 0.068 0.049
Averages 0.057 0.087 0.075 0.070 0.072
38
j&%
0--- M'a
I.H
4N.1
0
Relative Displacement, v/R
Z slope -a
Ks(N) = -aN,...
l
10 100 1000-%%Cycle Number, N
FIGURE 24. Cyclic Parameters Definition (After Makarim and Briaud,1986).
39
oI
- e. 't. 'Ple~~
op
LLpitp
0 -0
b-w
0r-i u%
0* u
L0
V
(1) )4/ N) *
-40
iq
(.I.% %.
ofo >ulu
0 cI,-
L2z z, I. J 5 ~..,,-,
I - ..IJ '.vV
.. -"! 11. .2 l- ". ..
- ,J " U '
(nt LLU)f,,,0,.* .. -,,"
C ~~~ILl ""'-:
1) •
~.-. ,J.
,I , , ,... ,, , -,. ._,. , . . .. :- ,- .. : . . . +. . .. . . .- .. . . . .. .. . . . ; . . .,, . . . , .. . . . .. ..,,,, r,-" " )-
C rL.
cww
Cu '.- .*.
>
w Ucr u '
U 0 z 0C 0
aa.
cru EOW >.
LLU Li u
w
b-4p
OLS
I P0e
oD -M (N-)
- 42

.1 J
OD0
0 -0
w L L5 .10
C3 U -1W> 0
0j zzS
0* a
0* '-cnO .
0*
0
w cU)
0*
0*00
CN
o i l 1 - 1 1
(1) IDA/ (N)) ON
43 a
<r wx 5% >~
(n > w
-i z %
II wCuu
U -
in o -i
0I tL> I I
0* >-P
0*) OX N)O
0*4-
0-4S
w >
>w >w -iwJ
wS
_j ZSU
C3 U..1 -J
0 C.)
o0 LL U)W
0 '
0 0 )uJu
ta I.-
ILN
(1) M/ () 9S
45.

When comparing the "a" values, it becomes clear that
cycling with total unloading causes greater degradation than
cycling with only partial unloading (one-half of the top
load). This may be the result of greater inward yielding of
the soil as the pile is passed through a greater range of
displacements.
Also evident from the "a" values is that the first
series of cycles were generally more damaging than the fol-
lowing series. This behavior was true for all except the
20-in square prestressed concrete pile. As discussed ear-
lier, a probable reason for the greater degradation in the
first cyclic series of the concrete drilled shafts is the %decrease in the piles' flexural stiffness. The prestressing
in the square concrete pile postponed the crack propagation
until the second series of cycles. However, the steel pipe
pile also had less degradation during the second series of
cycles with "a" values of 0.065 and 0.059 respectively.
Assuming that the flexural stiffness of the steel pipe pile
itself suffered little or no degradation, it would appear
that the soil stiffness also suffers less degradation at the
higher load level. The first series of cycles may have
caused a slight densification of the soil in front of the .
pile.
The cyclic stiffness for the pile KC(N), as defined in
Figure 31, showed little or no degradation within each por-
tion of the cyclic loading where the difference between the
upper and lower loads was constant (Figures 32 through 37). .
The cyclic stiffnesses were stiffer for cycling where the
magnitude of the difference was one-half of the upper load
level. This is to be expected from a non-elastic medium.
4.4.3 Creep response
Taking readings every minute for five minutes after
reaching a specified load allowed observation of the creep
response of the piles. These responses are presented in
140*

H .----. --
".q.,,2R-f
H -. .-',.-.YI
KC( 1 ) .' .,
,, K (N)
-j-
oO1 /"
0N
Y/R
10
KC(N) N-bKc(1) N
slope -b 0z
1 10 100
CYCLE NUMBER, N -"-"
FIGURE 31. Cyclic Shear Modulus Parameters Definition. .
47
N. , i .. 'Z.
'
0 z 0
...... ,....
pill ..I , 0
< J
T zo>
o- -j
I R I. - .- 4.0 X...
u C2
w,. . .2 az Lz
0* b4 in 5
x R
(D-* o .ILL 0 ,
0: 1 -0 u0*
- -- "I
0*L
•0.- .- ,
Q*Q
( 1) OM/ (N) ON
48
J.
". ". '. * " " " " % ". " ' " " . . . . ". ". ". • %, ". ". " ' " . ..'. " " " " '- "- "- " " " % " 5 " -" ' j .,"
." . * " dm,,_ " ,' " ' ,* d" ." ." .r.,, , . ,, * ° -,'.-" " ' " - ." " /',, 'q." ,,., r ." .= . w J' " '" ".' , '4 " " -".."', ,," ,,- A' 4 .r .
w 0-4
w -5-.-w J a
a. u
45
_j z w-
w >U
00j1-z0
1)U 0)4 (N)M
49 ~ >

1 1
oJ W
> W
w 0
U3 J c
3: U 0r -z
u ..
ZW'-4
fJ L u 0
liii I I iii
500

% .*N,
LL~<'
X: w
cn >w 4o
rum. *i r-l; ,
40
C.) Al
00 C..)'
*0 -u 0 z'
00
4-4N
IA %~
eSo
C5 .. . .. . .
L.L
T -w
U) >
* 0 >-L
*0 LI z*P 0
c* o 0 Z0 rj-wL
CLi
*Al I I
(1 OX (N 0>
52)
47knK .-w IJ V--,
p-fl
c;~
LL0wI-
s~U > Wui * w~
c u0o uL
0 -t L -
0 -.
0
~-. 1 - !
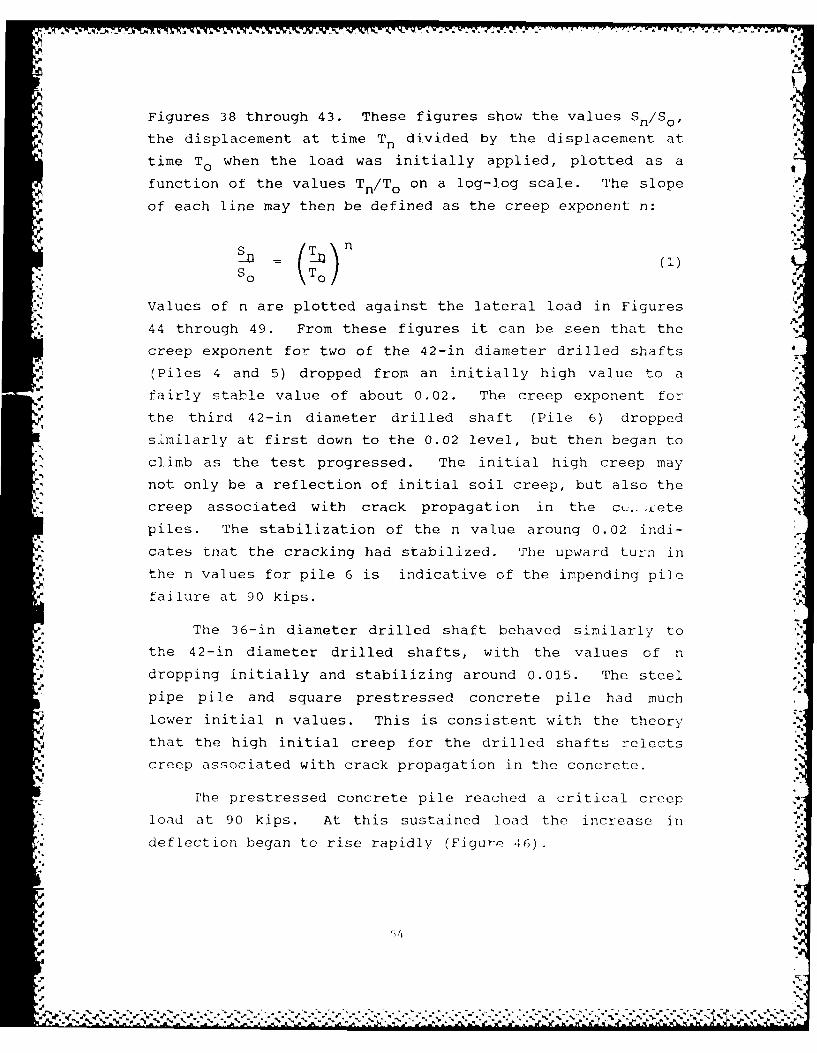
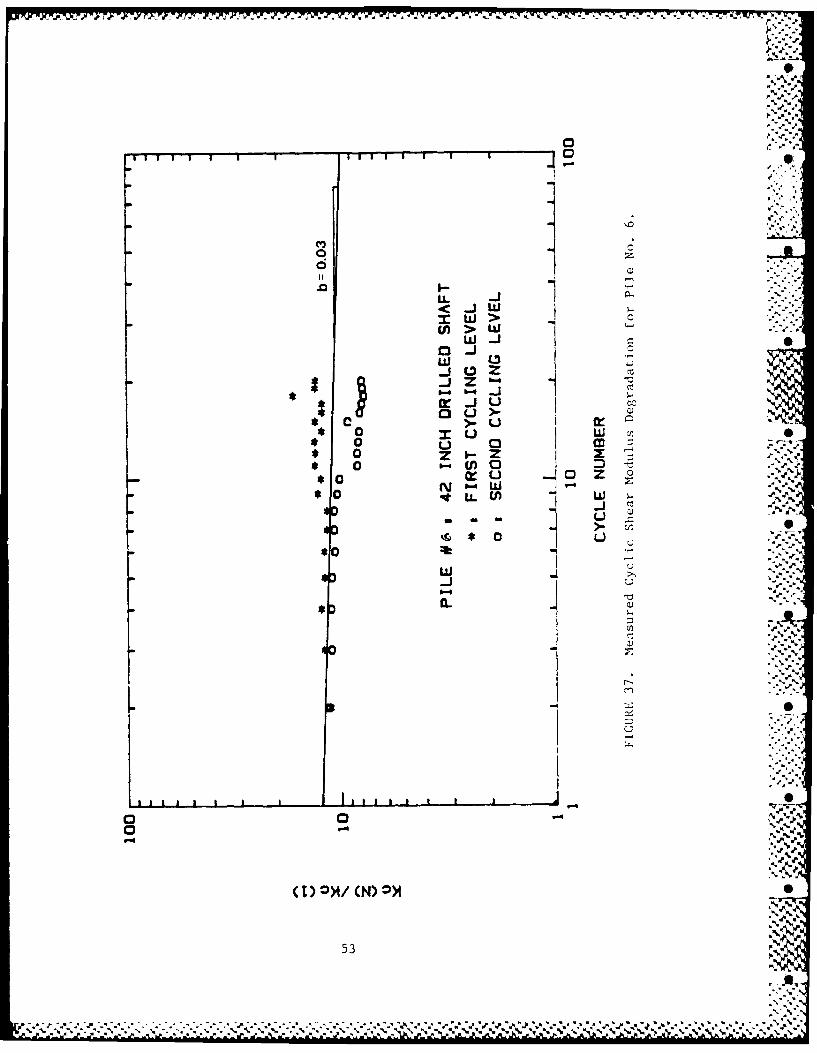
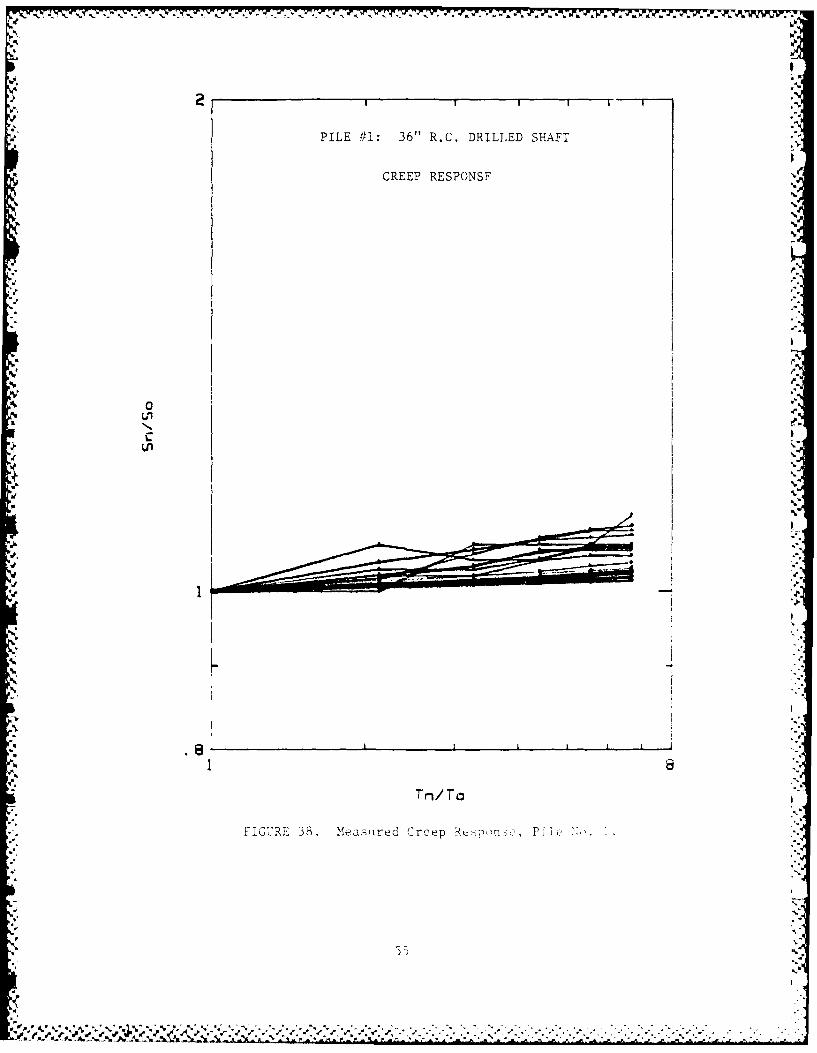
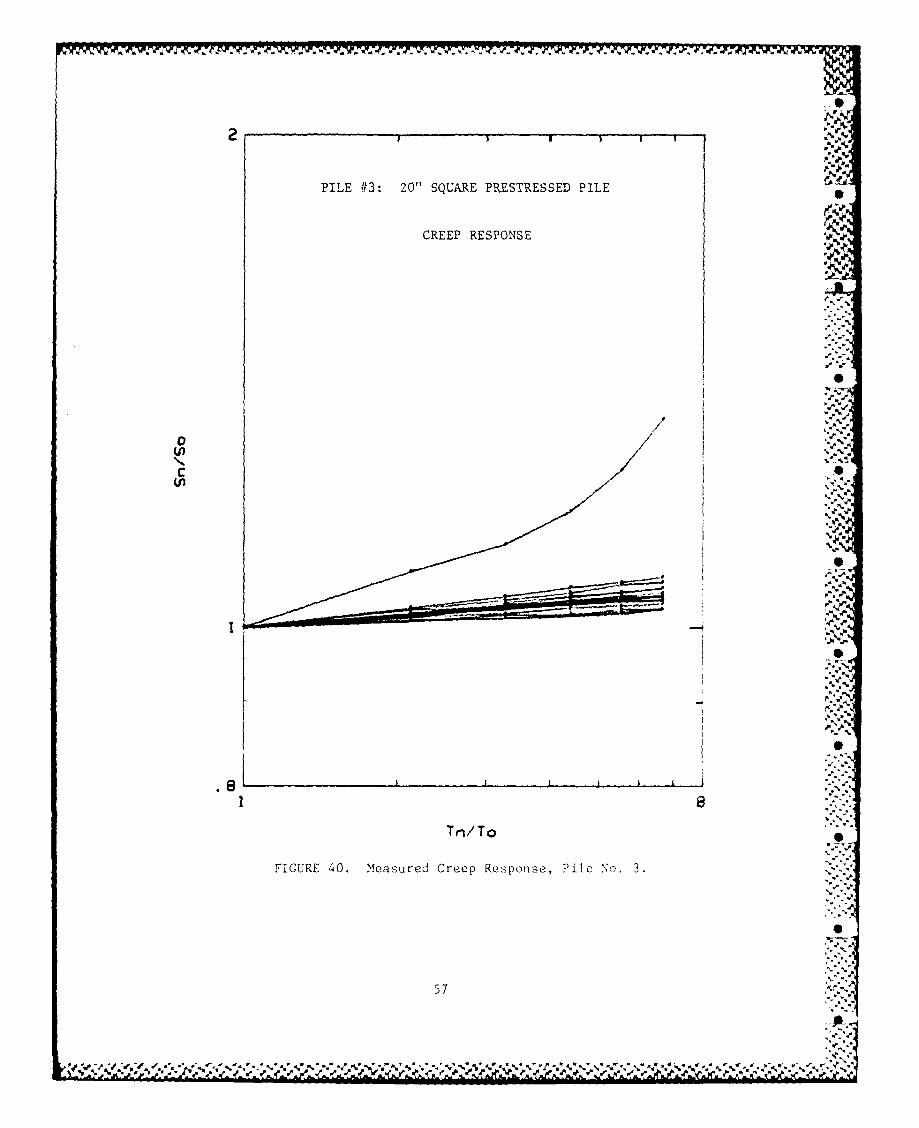
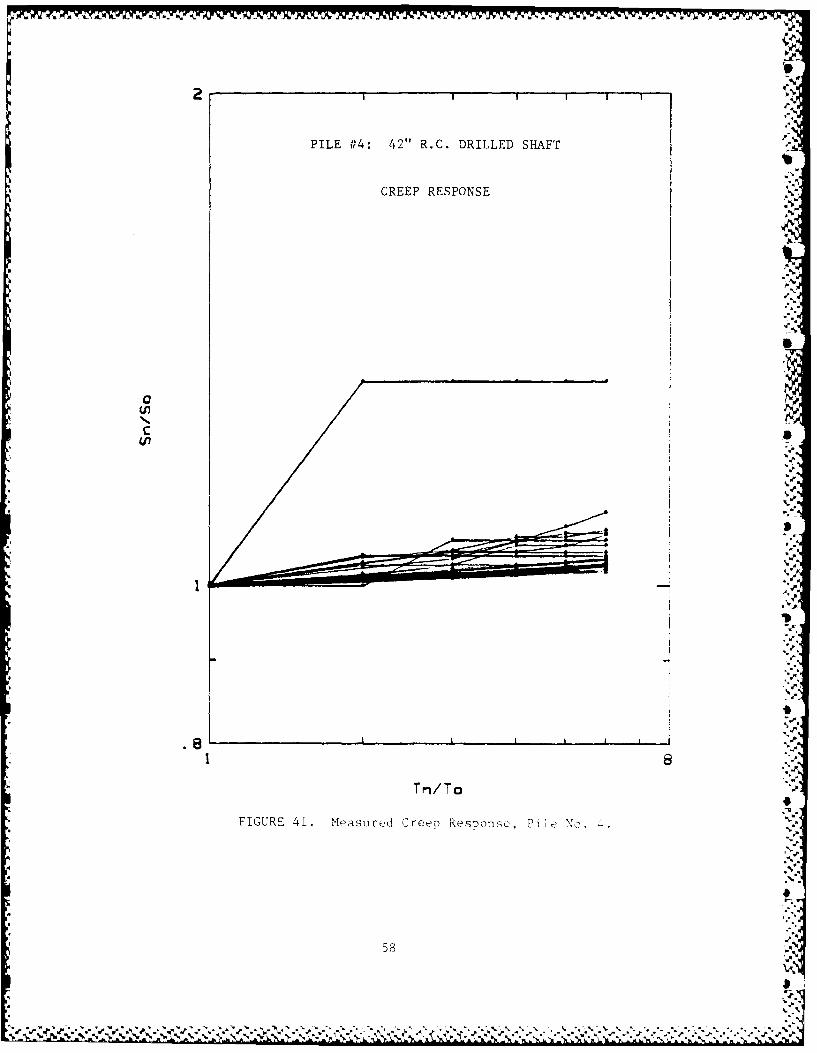
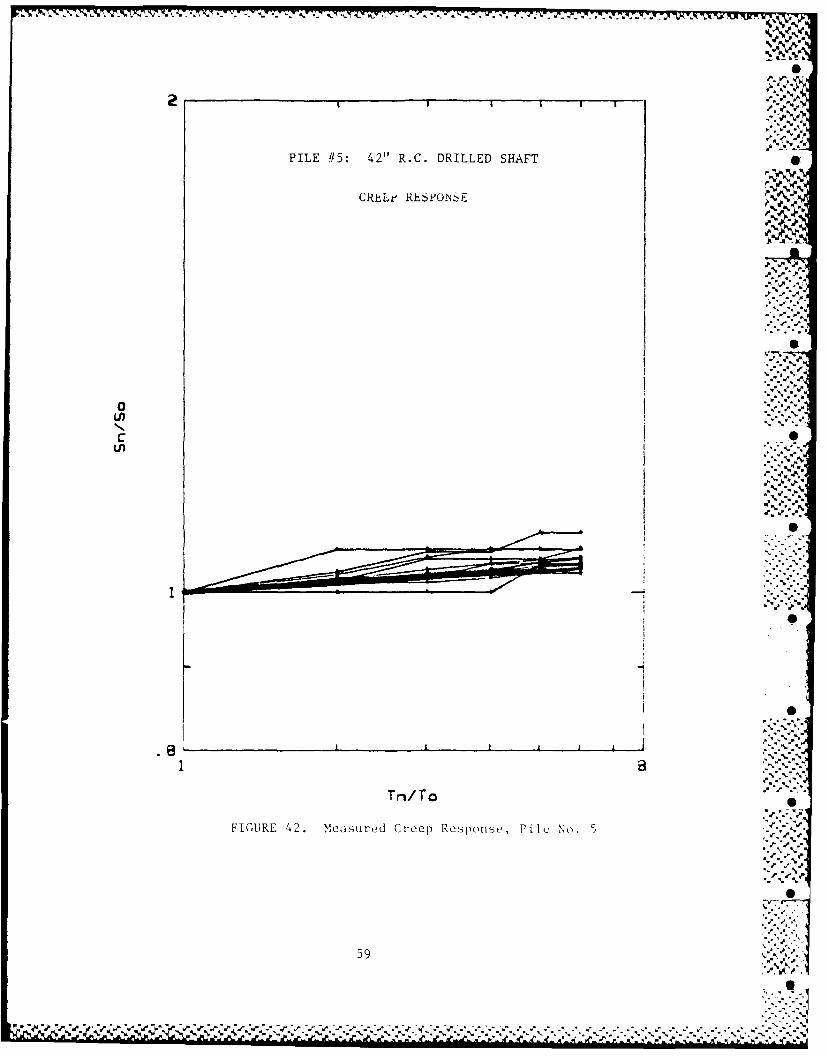
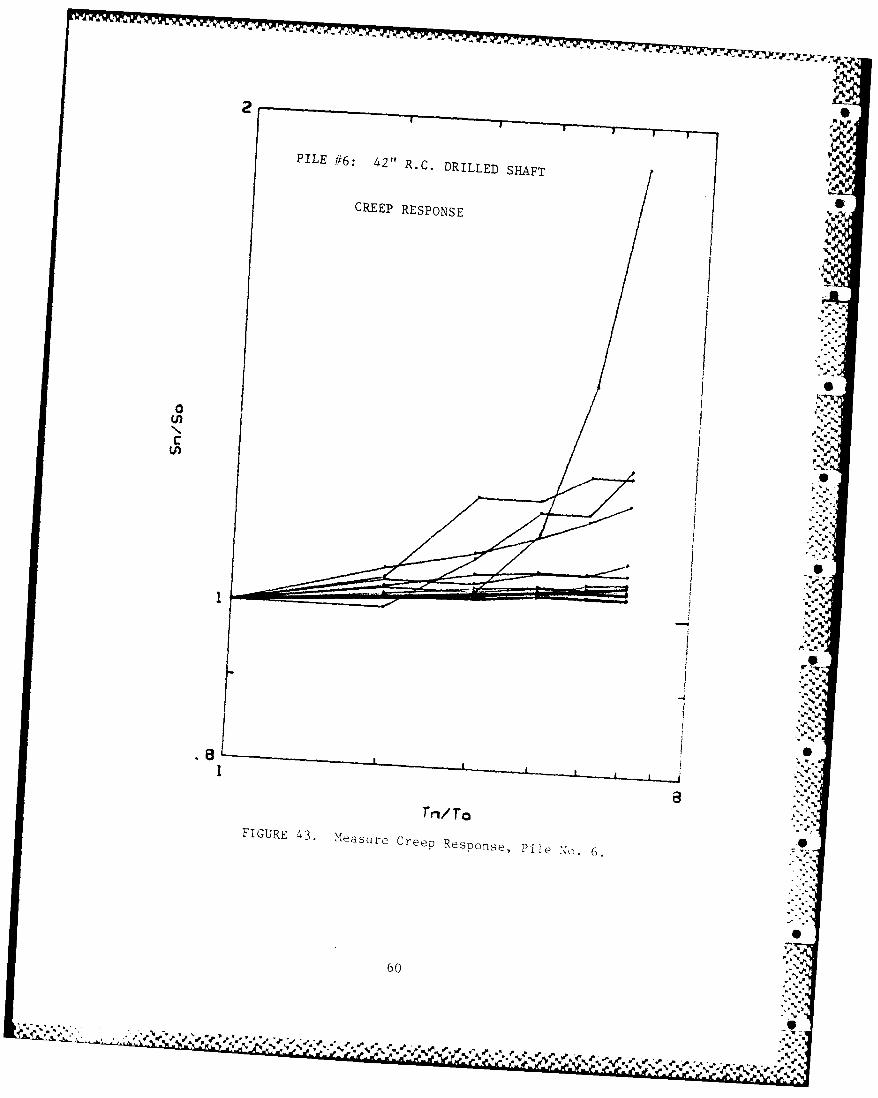
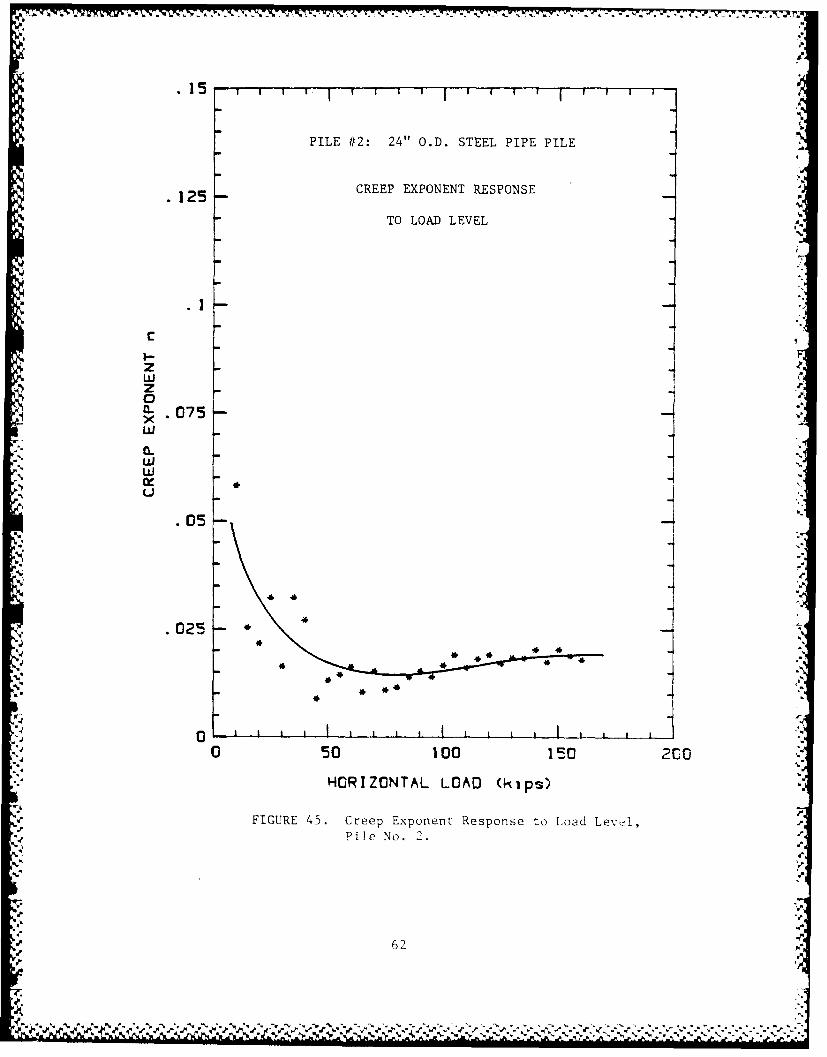
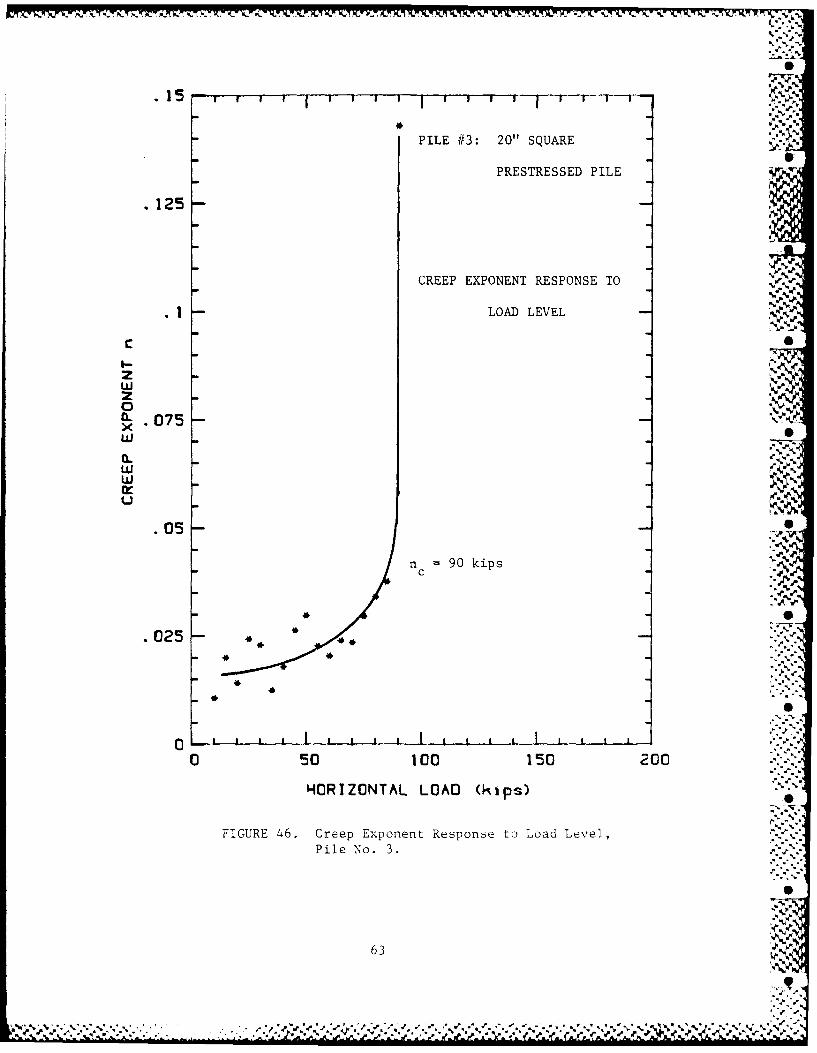
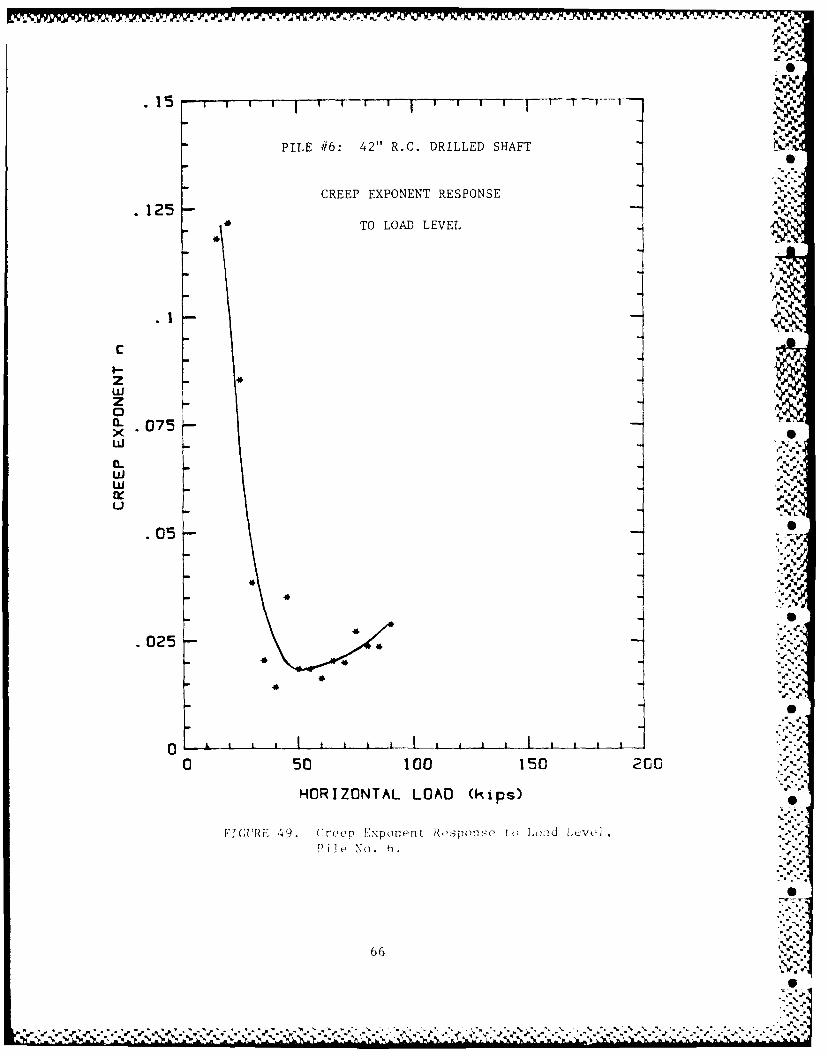
Figures 38 through 43. These figures show the values Sn/So,
the displacement at time Tn divided by the displacement at
time T o when the load was initially applied, plotted as a00
function of the values Tn/To on a log-log scale. The slope
of each line may then be defined as the creep exponent n:
(Tn= (1)
[' s o T o -
Values of n are plotted against the lateral load in Figures
44 through 49. From these figures it can be seen that the
creep exponent for two of the 42-in diameter drilled shafts
(Piles 4 and 5) dropped from an initially high value to a
fairly stable value of about 0.02. The creep exponent for
the third 42-in diameter drilled shaft (Pile 6) dropped
similarly at first down to the 0.02 level, but then began to
climb as the test progressed. The initial high creep may
not only be a reflection of initial soil creep, but also the
creep associated with crack propagation in the cc,. :Lete
piles. The stabilization of the n value aroung 0.02 indi-
cates that the cracking had stabilized. The upward turn in
the n values for pile 6 is indicative of the impending pile
failure at 90 kips.
The 36-in diameter drilled shaft behaved similarly to
the 42-in diameter drilled shafts, with the values of n
dropping initially and stabilizing around 0.015. The steel
pipe pile and square prestressed concrete pile had much
lower initial n values. This is consistent with the theory
that the high initial creep for the drilled shafts relects
creep associated with crack propagation in the concrete.
I'he prestressed concrete pile reached a critical creep
load at 90 kips. At this sustained load the increase in
deflection began to rise rapidly (Figure 46).
V.
S.I
PIE#1: 36" R.C. DRILLED SHAFT
CREEP RESPONSF
0a
0a
ca
Lo,
...............
Tn/ 7o
,:IG:RE 8. easued reepPil
C5 5
I ar .
PILE #2: 24" O.D. STEEL PIPE PILE
CREEP RESPONSE
0.
c.
7n/To
FIGURI" 49
PILE #13: 20" SQUARE PRESTRESSED PILE
CREEP RESPONSE
0/
I
FIGURE 40. Measured Creep Response, Pile No. 3.
57
z~/.;.4;;'v.;;~~% 8 .S % %, %v~~
PILE #f4: 42" R.C. DRILLED SHAFT
~CREEP RESPONSE _.
°'
0Uj
N.;
! ,.
.,
! .
_. .. = , , ' .' .'_ '_. _. -. .' .. _ _.' .. .'_ ' . . - . # . . . .. . . , . . " . " , - . ,, -. -. , . .. ,,",- ,.' .- # . . ,. , ,, . . . -,, • ",,, ._" = . I II d • d ... ... ii
PILE #15: 42" R.C. DRILLED SHAFT
CR1ELr RheS±ONSE
0. %
W .~
- -V
Tri/ To.
FIUR 42 Mesre repRspne Pl: o
(41 ata-V59
PILE #~6: 42tr R.C. DRILLED SHAFT
CREEP RESPONSE
06

- . --.t - - - . - - r- -T T -.
PILE #1: 36" R.C. DRILLED SHAFT
.125 CREEP EXPONENT RESPONSE
TO LOAD LEVEL .
.075
w
w0
W '" .4
.05
*%
05
FIUR 44. Cre0xoetRsos oLa
Level, Pile No. 1.
61
4J .. .4 * .'.
I '.
PILE #2: 24" O.D. STEEL PIPE PILE
CREEP EXPONENT RESPONSE125--
TO LOAD LEVEL -
r"--
z
zCL.075
X
CL
05101
0... *
U ..
0 50 100 150 2C0
HORIZONTAL LOAD (kips)
FIGURE 45. Creep Exponent Response to Load Leveil,
V Pile No. 2.
.o .62
-**" 4".
O *' ,, I. , , I4, ,-'"
" 62
.2, -,.
.% 21I.
PILE #}3: 20" SQUARE
PRESTRESSED PILE
. 125
CREEP EXPONENT RESPONSE TO
LOAD LEVEL..
-0.15 1 I* " ,
L .075
125•
..1
.025. .-. '
0 50 100 V150 200 .. .
HORIZONTAL LOAO (ips)E
FIGURE 46. Creep Exponent Response to Load Level, .,,-
Pile No. 3.- -
% le
z.:$
mw

.-- , ,- -. ' " ' -' -- --
PILE #4: 42" R.C. DRILLED SHAFT
125 .CREEP EXPONENT RESPONSE
TO LOAD LEVEL '
." .i
%
t- .075
8. ', ( -
.. IX
• ,-
. 025 - - '
z "
0 50 100 15 0 2CC "
HORIZONTAL LOAD (kips) .
FIGURE 47. Creep Ex-ponent Response to Load Level, "-Pile No. 4.
h'
w O

I ,. , , ',
a' ,
t"
-* '
'"". . s e-."-. -.. ..- - - - - ---- , " - - - ,..- . - - - - -- . .
.. .
PILE #5: 42" R.C. DRILLED SHAFTS
CREEP EXPONENT RESPONSE•125TO LOAD LEVEL
.1 0 75
0_. 079 ;%
wu j
.02504 ---._ -
.025 44 4* *-.,_. .,
4% %
0 , I I , , L ~I -L, , -.V
0 90 100 150 200
HORIZONTAL LOAD (kips)
FIGURE 48. Creep Exponent Response to Load Level,
Pile No. 5.
65
15 i,, , , , - , , ' , , , ,..
PILE #6: 42" R.C. DRILLED SHAFT
CREEP EXPONENT RESPONSE '. .*
125TO LOAD LEVEL
c4
wZ ,z0CL .074w %..
w
.05
.025 ,
0 I , I I , , I , , ,
0 50 100 150 2C,
HORIZONTAL LOAD (kips)
FCIURfE 49. Cree? Ep xponen t Respnse to K.<hid L v ,, . e
pile No. ...
74'
66
?J•!
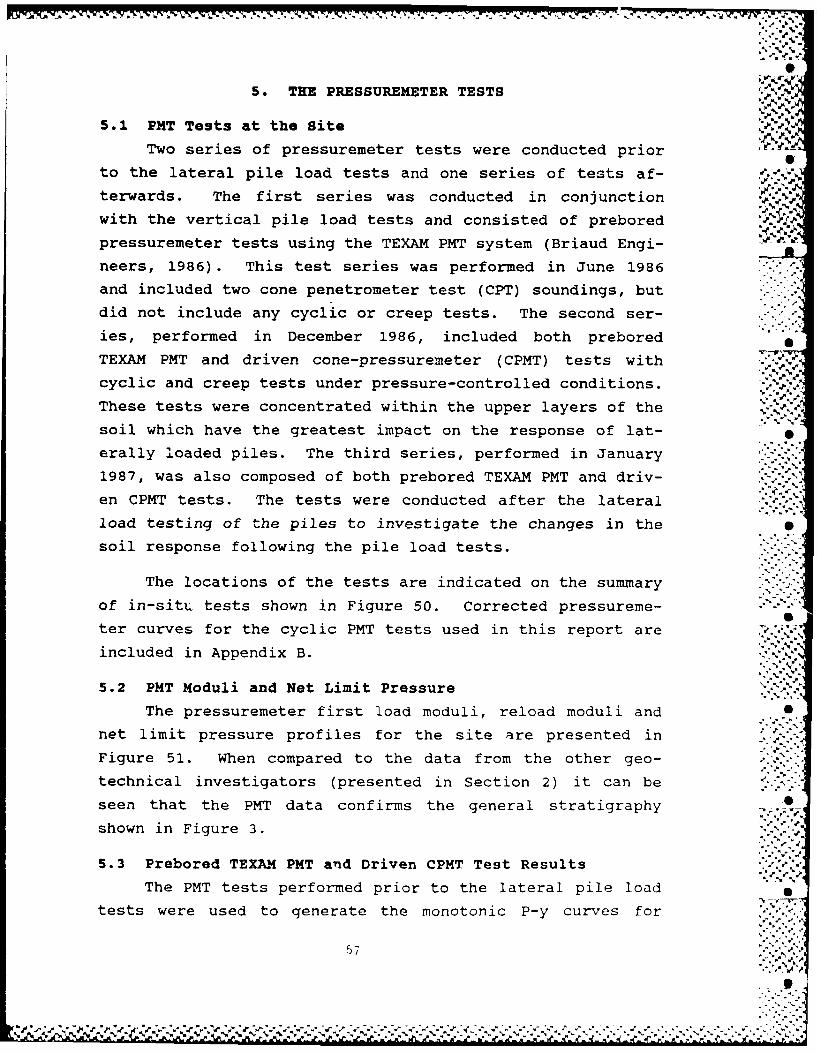
5. THE PRESSUREMETER TESTS ,.,, .'?.-
5.1 PMT Tests at the Site
Two series of pressuremeter tests were conducted prior Oto the lateral pile load tests and one series of tests af-
terwards. The first series was conducted in conjunction
with the vertical pile load tests and consisted of prebored
pressuremeter tests using the TEXAM PMT system (Briaud Engi-
neers, 1986). This test series was performed in June 1986
and included two cone penetrometer test (CPT) soundings, but
did not include any cyclic or creep tests. The second ser-
ies, performed in December 1986, included both prebored
TEXAM PMT and driven cone-pressuremeter (CPMT) tests with .-
cyclic and creep tests under pressure-controlled conditions.
These tests were concentrated within the upper layers of the
soil which have the greatest impact on the response of lat-
erally loaded piles. The third series, performed in January
1987, was also composed of both prebored TEXAM PMT and driv-
en CPMT tests. The tests were conducted after the lateral
load testing of the piles to investigate the changes in the
soil response following the pile load tests.
The locations of the tests are indicated on the summary
of in-sitL tests shown in Figure 50. Corrected pressureme- - Ster curves for the cyclic PMT tests used in this report are
included in Appendix B.
5.2 PMT Moduli and Net Limit Pressure
The pressuremeter first load moduli, reload moduli and
net limit pressure profiles for the site are presented in
Figure 51. When compared to the data from the other geo- -
technical investigators (presented in Section 2) it can be
seen that the PMT data confirms the general stratigraphy •
shown in Figure 3.
5.3 Prebored TEXAM PMT and Driven CPMT Test Results
The PMT tests performed prior to the lateral pile loadtests were used to generate the monotonic P-y curves for
w-e .. . . ..,- -
- I
Scale:
( B3 )B2 *'
o" -5'
B4T N P0
Test ..,'Hole PMT Type Date '"
Btl T EXAM 12 /86 .B2 Prebored 1187 ,.
B3 PMT1 1/87 ,
74
DI Drivyen 1/87 " .D2 CPMT 1/87
BI B4 TE2AM 6/86
CP'T 1 _ 6/8{6
.44, .
CPT26/8
A . T .citioi) of In-,Itu et ;Ls it Ioid '1pt'
68_ _*4.4
Dl Diven 1/87.r
' . % . , .. . % % % "*4 % %4
0
oor0%
00

each of the pile types and the cyclic degradation and creep
response exponents.
5.3.1 PMT generated P-y curves
The procedure for generating P-y curves from pressure- -
meter data is described in detail by Little and briaua
(1987). Generally, the process uses the analogy between the
pressuremeter probe's expansion into the in-situ soil and
the horizontal displacement of a laterally loaded pile. It
provides a series of curves defining the total resistance to
lateral displacement that may be expected during lateral
loading of a pile within each layer of the soil stratigra-
phy. These curves are plots of the total soil resistance .-
per unit length of pile, P, against the lateral pile dis-
placement within each stratum, y.
The P-y curves generated from the pressuremeter tests
at the load test site are presented in Figures 52 through
56. The first family of curves (Figure 52) were generated
for the three 42-in diameter drilled shafts from the pre-1
bored TEXAM PMT test results. The P-y curves correspond
relatively well to the site stratigraphy as shown in Figure
3. Recalling that the site had b'en excavated three ft
before performance of the lateral load tests, the P-y curvesincrease in stiffness until a depth cf 15 ft. This depth
coincides with the first layer of firm clay. The P-y curves
in the fine sand layers from 18 to 58 ft are clustered toge-
ther. The soil resistance shows a marked increase in the
dense sand layer 65 ft below the surface, and drops off in
the clay layer below 75 ft.
Two different families of P-y curves were produced for
the square prestressed concrete pile (Pile 3). Both sets
assumed that the pile was a full displacement driven pile.
The first set (Figure 53) was generated by using the driven
CPMT test results down to 17 ft and using the prebored TEXAM
PMT reload curves below 17 ft (Little and Briaud, 1987)
a.. C

%
ISO %
96' 5
125 1
Q
IN 100 .-. *-
a.
w
< 7575
-30
o 5041.
25 -15
0
0 2 46
Y -DISPLACEMENT (INCHES)
1,'RF E2. Preboreci TXAM PMT Gencr Itud P-v (Aurves fo~r
"Id 0.
7 7
7% %-
% -
17'
-' 757
IN9
< 5~
I-i
<25' __-
a_ 25 30----
4~ 1'
I I j5V
y - DISPLACEMENT (INCHES)
FU;URE 53. DriLven C.PMT Gener ated P-'- to 20r
Square Cocre te, Pi 1 e No. 3.
el
7 2
1 0 0 % i I I * "
I%
96'A
'O
*J. -JLLA
I-* 75 . '-A-.
U96
CL
-5 107 '
Lfl 7 1 '
0. 530 "., .."75''
a. 25,
"-" ' "" '" '-..
15 ' ,.
A'--",."
I- 0
Y - ISPLACEMENT (INCHES)"'""
FIGURE 54. Prebored. TEXAM PMT Generated P-v Curves '.,-.-
for 20" Square Concrete, Pile No. 3. #j
.A-'
= . . ''' . '.'"%"""w , ' - ' ' ' , ' ' 2 , o ' ". . " z . . .' .. - . ' ,_ ' ' "..,...=-U-,,, -. ,., , , %
100
96'
75
0LL.N
11,
Li
z 71s
U,
25' 1'
CL 25S4
0 i
2'
Y DISPLACEMENT (INCHES)
F UR F 537. Preored IiEQ\ M PMT Generaited P-vCor 24'' Noii-iij,)I acemont Steel Pipe
74
,NAN N N' %' %'*

- 7y,- . -
a.,
96'125
IL'.100
U,0
z 71< 75 AI-
C3 SO
I-P
00 34
for '16 R - D i l d h f , Pi e N . 1
255

The second set (Figure 54) was generated using only the
prebored TEXAM PMT reload curves. As can be seen in Figures -p
53 and 54 the driven CPMT tests generally lead to stiffer P-
y curves.
The P-y curves for the pipe piit (Figure 55) were gen-
erated using the prebored TEXAM PMT test results and assum-
ing that the pile was a non-displacement pile. This assump-
tion is consistent with the fact that the pile did not plug
until a significant depth. Therefore, at least in the more
important shallow depth region, the pile acted as a non-
displacement pile.
The P-y curves for the 36-in diameter drilled shaft
(Figure 56) were also generated from the prebored TEXAM PMT
test results.
The P-y curves for the 24-in diameter pipe pile and the
36-in diameter drilled shaft prepared using the conventional
method (Reese et al., 1974) are shown in Figures 57 and 58. .
These curves were prepared by McClelland Engineers (1986).Compared to the PMT P-y curves, the conventional P-y curves
show a much softer initial response and a lower ultimatesoil resistance within the critical upper layers of the
soil,
5.3.2 Cyclic degradation parameters
The cyclic degradation parameter, a, for the pressure-
meter tests represents the degradation of the secant PMT
shear modulus with increasing cycles as defined in Figure
59. The GS(N)/Gs(l) versus N curves for each test are pre-
sented in Appendix C. A summary of the resulting A values
for the secant shear modulus degradation is presented in
Table 4.
The cyclic degradation parameters for the driven CPMT
and the prebored PMT tests at 2 ft depth are less than the a
values of larger depths. A possible explanation for the
76
* -' - ,,- - -
10010
86/
17
75
LL
tU 24' .
U
< •LU ., .% ,
~~~~20 '"-.- -.<5U, S
-101"
I--
CL 2516
12'"
0 1 2 3 4
Y - OISPLACEMENT (INCHES) % %
71GURE 57. Conventionally Prepared P-v Curves for 24" '.._
Non-displacement Pipe Pile (McClelland
Engineers, 1986).
77
7.... ....* ~ ~-~& C- * * .' < .- *> v
ISO- -
a 1' 10 9
86'
12551
a LL".100 U461
30'a
ui 75 1
'C
121
62
251
1986).
07

-'~ ~ - - - --- -- -
r p
pr
2R- AR
RELATiVEZ DISPLACEMENT, AR/Ro
100
vGs(N) Na
G300
---
1 10 100
CYCLE NUMBER, N
Figure 59. Definition of the Cyclic DegradationFarameter for the Secant Shear Modulus.
79%. ' 4
.JsJ
TABLE 4. Pressuremeter Cyclic Deqradation Parametersfor the Secant Shear Moduli
PMTTest PMT Depth t R/R a aNo. Type (ft) (%) Average
S12.8 0.044 0.041B2-2 2 22.4 0.038 0
7.9 0.091 0.077BI-7 7 15.8 0.062 0
PREBOREDBl-10 TEXAM 10 5.8 0.086 0.07516.0 0.063
BI-15 15 17.3 0.064 0.06413.3 0.074 06Bl-30 30 22.0 0.056 0.065
Overall Average 0.0b4
D1-2 2 3.2 0.054 0.0817.3 0.107 0
D1-5 5 1.2 0.115 0.105DRIEN5.0 0.094DRIVEN
D1-9 CPMT 3.2 0.112 0.1109.1 0.108
3.3 0.108Dl-13 13 8.6 0.109 0.109
Dl-17 17 1.8 0.136 0.1166.4 0.096 0
Overall Average 0.105
B3-2 PREBORED 2 7.6 0.056 0.043TEXAN 13.4 0.030
D2-2 DRIVEN 2 3.6 0.120 0.114CPMT 8.5 0.108
lower degradation may relate to the degree of saturation of
the sand. The water table at the time of testing was locat- ..4
ed 3.5 ft below the ground surface, indicating that degrada-
tion may be greater in saturated sands than in unsaturated
sands.
The average a values below the water table were fairly'p'
consistent. For prediction purposes an overall average a
value was selected for each pile (see Section 6.2).
Another observation on the cyclic degradation entailed
the degradation of the cyclic shear modulus as defined in
80

Figures 60 and 61. The GC(N)/GC(l) versus N curves for the
individual PMT tests may be found in Appendix D. The curves
for the driven CPMT tests show an apparent degradation of
the cyclic shear modulus during the first series of cycles.
5.3.3 Creep response
Near the end of each PMT test the pressure was held
constant while recording the increase in volume of the
probe. The results are presented graphically in Figure 62
and 63 using the same variables as employed to define creep
in the piles (Section 4.4.3). For the prebored TEXAM PMT
the creep exponent, n, averaged 0.006. The average n value
for the driven CPMT tests was 0.011. Both values fell below
the creep exponents found for the load test piles. The
difference between the pile creep and the PMT creep expo- ..
nents may be the result of the creep occuring in the pile S
material inself (Section 4.4.3). • '.
81 " 5'
. -.. .q

Gc(1) Gc(N)
LB a II j/ r 4--
a P - -.~r
? R n R, 0
A R (.N)R5
RELATIVE RADIAL INCREASE (AR/R 10
Figure 60. Definition of the Cyclic Shear Modulus.
- 0A
Gc(N) -bGc (1)
%1
- slooe =-b
-i-i
= t
2 .1 = 4
1.... :, NUMBER, .
Figure 61. Definition of the Cyclic Degradation Parawmeter
for the Cyclic Shear Modulus.
82
$ :'S:
MLSCALE CYCLIC LATERAL LOWP TSS ON SIX SINGLEPILES IN SF.. (U) TEXAS A AND UNIV COLLEGE STATIONDEPT OF CIVIL ENGINEERING. R L LITTLE ET AL. AUG N7 Wa SIFIED TAIIU-M-56NS/N/L-02 O133 Mm1hhii-hhihii
hmhmhhhhmhhhfEhllllllllllllllllllllllllhlIIIIIIIIIIIIIIIIIIIIIIIIIIII"""IIIIIIII
A 0%
* I *I -- 1111=11111al *o
11111-111-4 I
w w w w v 0 v vI l v-
1.2 ?a 1 112 "K* - .
PREBORED PMT*-P**
CREEP RESPONSE
4/ %
LEGEND '.-
7+7
# - i0' ,0.
+ - 15' H.
o - 30' n avg .006 .
S
10 ~50v..-
onT
FIGURE 62. Creep Response in the Prebored PMT Tests. ,,,
83 - ;
:.'.'--''. 'u - '--'''.',',-,U ) a-].], o . T -,'. ... , ' ' ' '., . .b <.. -"'-'-", ".' ...a-I

A 40-
122%1-
DRVE CM
CRE RESONS
0 - 13'
x 17,~
n 1':% 0.01.
844

6. COMPARISON OF PMT AND CONVENTIONAL PREDICTIONS
WITH THE MEASURED RESPONSE
The approach employed in this report to predict the
monotonic response of the test piles has been presented in
detail in an earlier report (Little and Briaud, 1987). For
the prediction of the cyclic response, the desired number of
cycles is first selected, then each value of y from the
monotonic P-y curve is multiplied by Na to obtain y(N). The
deflection y(N) is the deflection after N cycles at the
chosen level of soil resistance. The a values were selected
as detailed in Section 5.3.2. This process is summarized in
Figure 64 and in the following equations:
P(N) = P(1) (2)y(N) = y(l) x Na (3)
where N = cycle number for which the P-y curve is de-
sired,
P(l) = total soil resistance arrived at in static
analysis, 0
P(N) = total soil resistance arrived at after N
cycles,
y(l) = the static displacement at P(l),
y(N) = the displacement at P(N) after N cycles, and 6
a = the cyclic degradation parameter otained from
the pressuremeter tests.
The cyclic P-y curves were then input as resistances
into a beam-column program to obtain the predicted deflec- .
tions of a pile subjected to a given set of cyclic lateral
loads.
6.1 Monotonic Loading Response O
The preboring PMT prediction yielded excellent results
for the 36-in diameter drilled shaft at loads up to 40 kips
(Figure 65). The conventional method predicted a much soft-
er response. At higher loads (Figure 66), after the pile 0
had been subjected to the series of cycles, the PMT predic-
.5.. ...
P(N) : P(1)
y(N) y(1) x N
y ()
H'. ..* .,.
P (N)
y- DISPLACEMENT ..
FIGURE 64. Summary of Method used to Modify a StaticP-y Curve for Cvcl Lc Predictions. -
86,."
40 ' , ,1 ' 5 ' I I' ' ' I .,.I.-
PILE #1: 36" R.C.I S
35 +..* PREDICTED AND MEASURED
MONOTONIC RESPONSE
/o - ""..
-
II" -i" -
< 15 -..J II /I
* MEASURED
10 --*--
+ PMT PREDICTEDS
x CONVENTIONALLY
PREDICTED ,?,
0.DEFLECTION (INCHES) '
FIGURE 65. Comparison of PMT Predicted, Conventionally .%
Predicted, and Measured Response for Pile .'
No. I under Monotonic Loading, 0 to 40 KIP ,
Scale.
87
L&-

36" R.C. PILE" ','175 .t" .
PREDICTED AND MEASURED
MONOTONIC RESPONSE
150
-% .-'
u1 125 -Y*
5- *O ,
.o * ..,4 x
w*< 75 - x
* MEASURED
5 + x + PMT PREDICTED
x x CONVENTIONALLY
PREDICTED "
1, X %
!5-
00 1 2 3
DEFLECTION (INCHES)
FTGURE 66. Comparison of PMT Predicted, Conventionally
Predicted, and Measured Response for Pile No.I under Monotonic Loading, 0 to 200 KIP Scale.
i. .d.
.'_ .,- .,,%%;N_,,, t','L.r,,__' . .,-.., , , .,-. ,.,.-. .-. . .. , . , .. ,. . ,...- - .-.-.. , . .. / . ....-.. ..-. .. .

tion was stiffer than the measured results. This is probab-
ly due to the fact that the cycles induce accentuated curva-
ture in the monotonic envelope and that the flexural stiff-
ness of the pile decreases with increasing load and with
increasing number of cycles due to crack propagation. This
deterioration was not modeled in the prediction process.
The predicted response for the pipe pile using the
preboring PMT and assuming the pile was a non-displacement
pile gave excellent results throughout the range of lateral
loads applied (Figures 67 and 68). The steel pipe was not
subject to the same magnitude of stiffness deterioration as
the concrete drilled shafts. At high load levels, after the
series of cycles, the PMT method slightly underpredicted the
pile displacement. The conventional method, on the other
hand, significantly overpredicts the displacements through-
out the range of loads applied to the pile.
The square concrete pile was modeled with both the
driven CPMT and prebored PMT test results. Both methods
produced excellent predictions for loads up to 40 kips (Fig- OT
ure 69). At higher loads the prebored PMT predictions
closely followed the measured results until after the second 9.
cycling series (Figure 70). It is likely that the deterior- 0
ation of the pile stiffness (EI-value) associated with cycl- ..
ing was not a factor in the pile-soil response until the .'
effects of the prestressing in the pile were overcome.
Therefore, the envelope on measured results up to the second S
series of cycles probably is an accurate reflection of theA-" 4
soil response alone. The driven CPMT predictions overestim-
ated the pile-soil stiffness response at high loads.
For the three 42-in diameter drilled shafts the pres-
suremeter method predicted a softer initial response at
loads below 30 kips and a stiffer response at load levels
over 50 kips (Figures 71 and 72). A partial reason for the
predictions of the 42-in diameter drilled shafts not being
89

40
PILE #2: 24" STEEL PIPE
35 *PREDICTED AND MEASURED
MONOTONIC RESPONSE
30
Ul 25e 4CL
YV
• MEASURED
Q 20 0 + PMT PREDICTED
1/ x CONVENTIONALLY PREDICTED-J
w / '
S 10
10 x
a 1a 1 p I p p p I ! p * I I I I, , 7,,
O' .I .2 .3 .4 ;..,
DEFLECTION (INCHES)
FIGURE 67. Comparison of PMT Predicted, Conventionally p
Predicted, and Measured Response for Pile No.2 under Monotonic Loadino, 0 to 40 KIP Scale.
90
.'a,..
200 , F%PILE #/2: 24" STEEL PIPE
175 4EASURED AND PREDICTED2
MONOTONIC RESPONSE
150
125 N
% %'50 %
75 COVNIOAL
+PPREDICTED
252
DEFLECTION (INCHES)
FIGURE 68. Covtt arison of Drted Lctud, Conivention b ll C
l rLulA' tud, XkcasMurc, 2 Rosp -Lse '"r Pile Nv2 uinder MenloCte't jC I oa~d uJ, 0 to 200) KIP Sclile.
91
JA
40 -
PILE #3: 20" SQUARE CONCRETE ".'
PREDICTED AND MEASURED '35 a
MONOTONIC RESPONSE
/
'AA'.
30-
- .:
Um 25 -.
o 20 4
E, I. * MEASURED
"+ PREBORED PMT PREDICTEDw A
<a DRIVEN CPMT PREDICTED15 40
" '
0%
A-
",1
2 3 4 -
DEFLECTION (INCHES)
FIGURE 69. Comparison of Measured and PMT Predicted
Monotonic Responses for Pile No. 3, 0 to A
10 kip Scale.
%
%. 92 .~% ~ ~AA7 ***A**'A* . '**.
%- AN N~ V %. A%*~, - , . -A

/ +1. . .%.*.4"%.
V%*
PL #3: 2o0, SQ. CONCRETE-.4
.i PREDICTED AND MEASURED i '
ul0. .I Q ~ ~~~~MONOTONIC RESPO NSE ,y., ." ,.".
_J "-'
C3 So . :.--
< * MEASURED
+ PREBORED PMT PREDICTED,.'..,~~~o DRIVEN CPMTr PREDICTED"'':
25 ""
Monotonic~~~ to lltl No 0to10
0 1 2 •... - -,
.
KIP sc.al1e.°"- -
93- .4,,
* PILE~k3: 2" SQ. ONCRET

40-,- 1/.4
30 +PREDICTED AND MEASURED
MONOTONIC RESPONSE
J 25 0
2 0 0 / +S5.
o MEASURED PILE #4
W # MEASURED PILE #5
< is * MEASURED PILE #6
+ PMT PREDICTED
' .
10 #.-,
0 . 05 .I.15 .2-J'
OEFLECT ION (INCHES) .
FTGURE -71 Co~mparison of Measiired to PMT Predicted Monotonic '.,Re- ponse 'or PtIe N(,-,. , ,and 6, 0 to.' 40 KIP ,-
a* I e.
'
J, -ep~~
0 '-SI
: , ,_ - m , • f : , " ,- 'd - ' 0d .05 .1-.1 . . . ./ - - l - - -

200
PILES #4, 5, 6 . - -
42" R.C. SHAFT1 75-...
PREDICTED AND MEASURED/%
0 # MONOTONIC RESPONSE .4
150 /
125 / 0CLI I
o 100 -- o MEASURED PILE #4 "
< # MEASURED PILE #5
• # MEASURED PILE 06
< 75 + + PMT PREDICTED
-4 #
25
0 1 2 3
DEFLECTION (INCHES)
FIGURE 72. Comparison of Measured to PM, Predicted
Monotonic Response for Pile Nos. 4, 5, and 6,
0 to 200 KIP Scale.
5..
95 'i,
-.... ,'-'.. .''',.":,>. --.,:.''."- .-'....:,.i-'-. '':.:. -2.5 ." .7.-..: .,':. ,-., 2"'--:?"..:-'.-- -'''-,,-.< . ' -".''-.., 'V
as good as the predictions for the other piles is the diffi-
culty encnuntcred in determining the correct pile stiffness
to incorporate into the pile-soil stiffness model. As ex-
plained in Section 3, these shafts were used as reaction
shafts during the previously performed vertical load tests.
As such, they were subjected to extreme axial tension stres-
ses. Although in the prediction method a reduced pile
stiffness (EI-value) was assumed, it may not have been an ,*
accurate model of the actual piles. Judging from the excel-
lent results in predicting the response of the other piles
in this study, the less satisfactory results for the 42-in
diameter drilled shafts must be due to inaccuracies in mod-
elling the pile itself, and not in modeling the soil
response.
6.2 Cyclic Loading Response
The predictions of the cyclic response of the test
piles using the results of the cyclic PMT tests are shown in
Figures 73 through 77. The predictions are presented as
cyclic envelopes. For any given load level the Nth cyclic
envelope represents the deflection expected after N cycles
at that load level.
The cyclic prediction for the square prestressed con-
crete pile was obtained from both the preboring and the
driven CPMT results. The cyclic predictions for the steel
pipe pile and the drilled shafts were obtained from the
preboring PMT only.
Table 5 summarizes the cyclic predictions and compares
them to the measured responses. In each case, the predictedincrease in deflection is less than the measured increase.
Four possible reasons for the PMT method underpredicting the
cyclic degradation are: (1) the difference in confinement
between the pile and the PMT probe, (2) load-control cyclic
pile load tests may not cause exclusively load-control
cyclic loading of eich soil strata, (3) influence of previ-
I' 96
! AAI
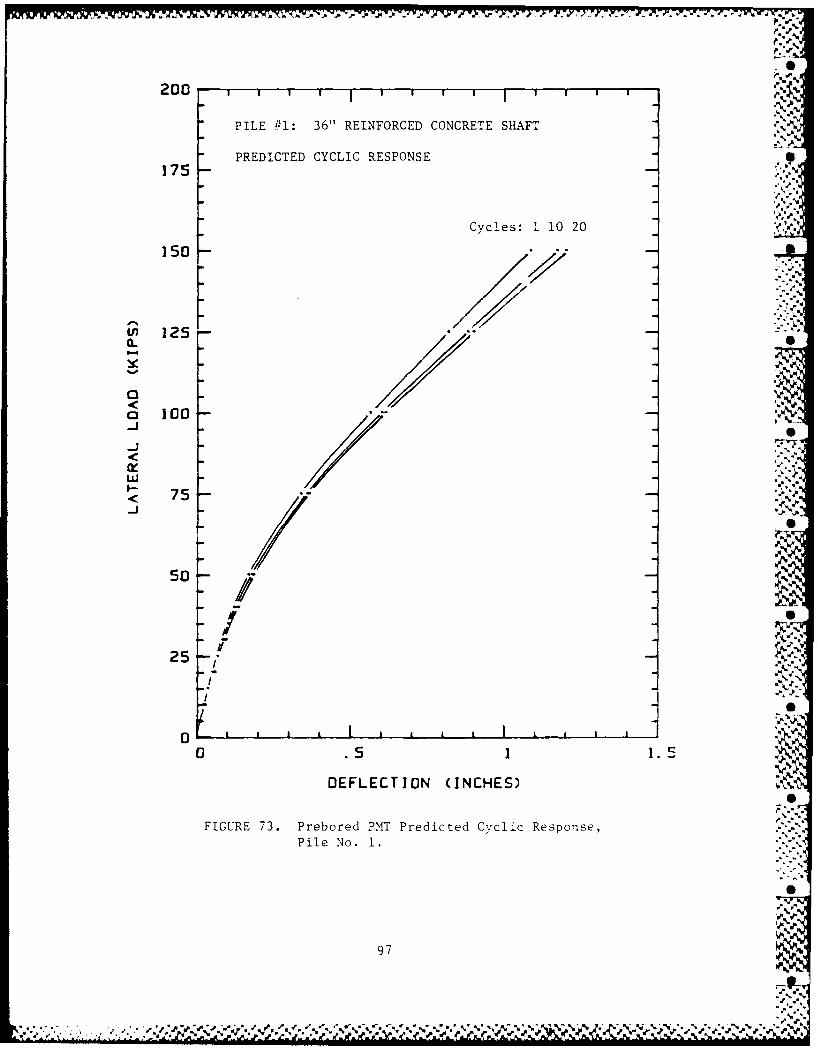
200 .
PILE #/1: 36" REINFORCED CONCRETE SHAFT
175 PREDICTED CYCLIC RESPONSE2
Cycles: 1 10 20
150
Lw 125
wS
<' 75
00DELCTO INHS
FIUE7.weoe M reitdCci epnePie o.1
<-97
%Se~a

I200 %'
175 PILE #2: 24" STEEL PIPE
PREDICTED CYCLIC RESPONSE
150
CYCLES 1 10 20 p
Un 125 -C-
(3
o 100 ~po -x
w< 75 L..V.-
75
50
/
25 V..
0 I0 1 2 3 :
OEFLECTION (INCHES)
FIGURE 74. PMT Predicted Cyclic Response, Pile 2.
98a * ~ ' .' ~ ' ~ '. . . .

200
PILk. # i: 20T' tiQ. GONCRETE PILE
PREDICTED CYCLIC RESPONSE175
(CPMT)
1500
010
100 10
w
50 0 412DELCTO INHS
25 UR 75frvnCM rcce ylcRsosPl 3
I9
%I 6 6P- .I
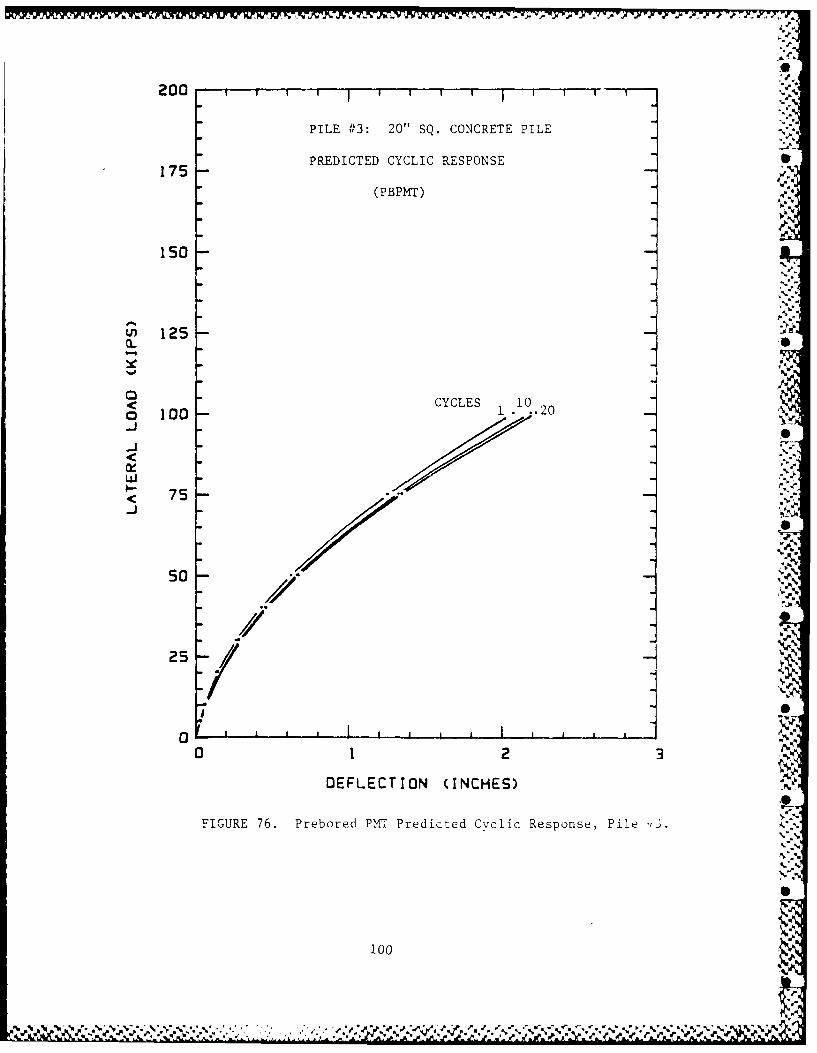
.41
200 r;,,' i T --- - :
PILE #3: 20" SQ. CONCRETE PILE ,,
17 PREDICTED CYCLIC RESPONSE " ...
(PBPMT)
150
< CYCLES 1i0200 100 1 -. 20"-J*
25--
0
<j' 75 .... :-,
so - 'I:'
/-25/9
II I0 -' I $ 4,_ ,
0 1 2 3
DEFLECTION (INCHES) "
FIGURE 76. Prebored PMT Predicted Cyclic Response, Pile 43.
10'.%
1.00 :
/~* ~ , s~'.d" ., %4~%~.~.%% %% *. .. ~ 5.. -~5.. * .
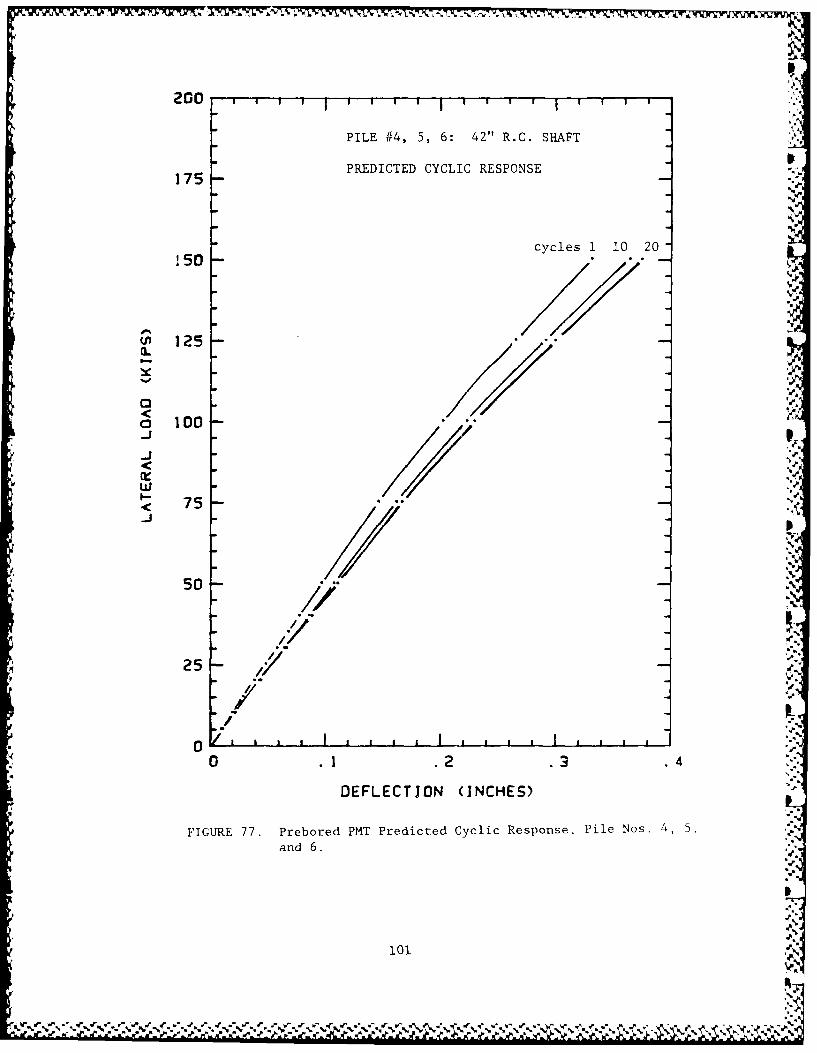
200 . " " . " . ' * , u '"
PILE #4, 5, 6: 42" R.C. SHAFT
175 n2PREDICTED CYCLIC RESPONSEITS.
cycles 1 10 20
15 00
S125
a3100
< 75-,,'so
'.
25 00
0 .2 .3
DEFLECTJON (INCHES) "
FIGURE 77. Prebored PMT Predicted Cyclic Response, Pile Nos. 4, 5,
and 6. "-
25 4.
10a1
% %,
i;n
we i"". " .r ," .- ,r r '..e -. ,r " ,.." .- w " , "W " - w - " ,- , w , . - '.€ a. a- .I. .. . - - -w j"
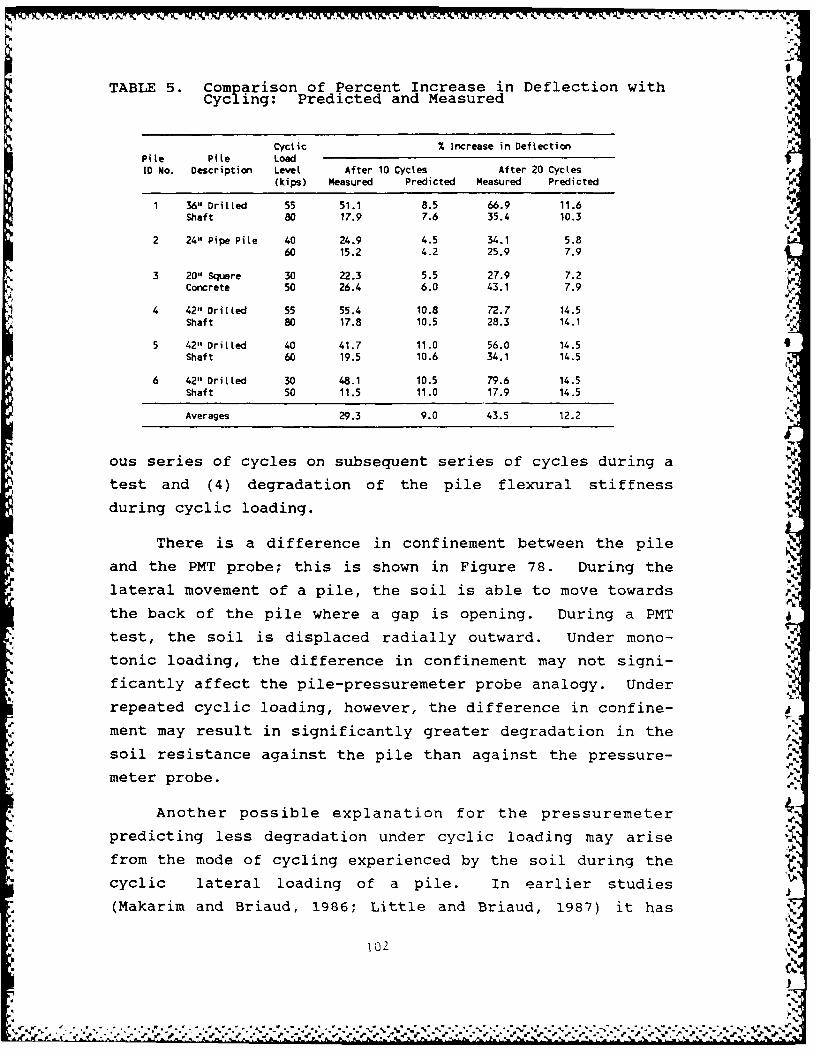
TABLE 5. Comparison of Percent Increase in Deflection withCycling: Predicted and Measured
Cyctic % Increase in DeflectionPile Pile LoadID No. Description Level After 10 Cycles After 20 Cycles-lop
(kips) Measured Predicted Measured Predicted
1 36" Drilled 55 51.1 8.5 66.9 11.6Shaft 80 17.9 7.6 35.4 10.3 '
2 24" Pipe Pile 40 24.9 4.5 34.1 5.8
60 15.2 4.2 25.9 7.9
3 20" Square 30 22.3 5.5 27.9 7.2Concrete 50 26.4 6.0 43.1 7.9
4 42" Drilled 55 55.4 10.8 72.7 14.5Shaft 80 17.8 10.5 28.3 14.1
5 42" Drilled 40 41.7 11.0 56.0 14.5Shaft 60 19.5 10.6 34.1 14.5
6 42" Drilled 30 48.1 10.5 79.6 14.5
Shaft 50 11.5 11.0 17.9 14.5
Averages 29.3 9.0 43.5 12.2
0
ous series of cycles on subsequent series of cycles during a
test and (4) degradation of the pile flexural stiffness
during cyclic loading.
N There is a difference in confinement between the pile
and the PMT probe; this is shown in Figure 78. During the
lateral movement of a pile, the soil is able to move towards
the back of the pile where a gap is opening. During a PMT
test, the soil is displaced radially outward. Under mono-
tonic loading, the difference in confinement may not signi-
ficantly affect the pile-pressuremeter probe analogy. Under
repeated cyclic loading, however, the difference in confine-
ment may result in significantly greater degradation in the
soil resistance against the pile than against the pressure-
meter probe.
Another possible explanation for the pressuremeter
predicting less degradation under cyclic loading may arise
from the mode of cycling experienced by the soil during the
cyclic lateral loading of a pile. In earlier studies
(Makarim and Briaud, 1986; Little and Briaud, 1987) it has
102
" " y . " . • . -" .. . .. ' . " " ." . ' - " -- -" " . ' " - " . " v v " " -." " ." -" ." .' . " " " " ; -" ." ." " " " " -' - " " .; ' ' .' " " " , " " " " .' )
.1,.' ' ".' '' ' ' ','", ' ' .. . . . . . . .' . - .. , '.. .". " r , ' _ , -. r . w 'J . w ',

4>
- *
N,
%
103
%
• . . -. .*-
FUE7. Difrec in Cofnmn bewe, te
Novmet f Pil ( ,. J*
i \ .,',,'--
,-J* *1::
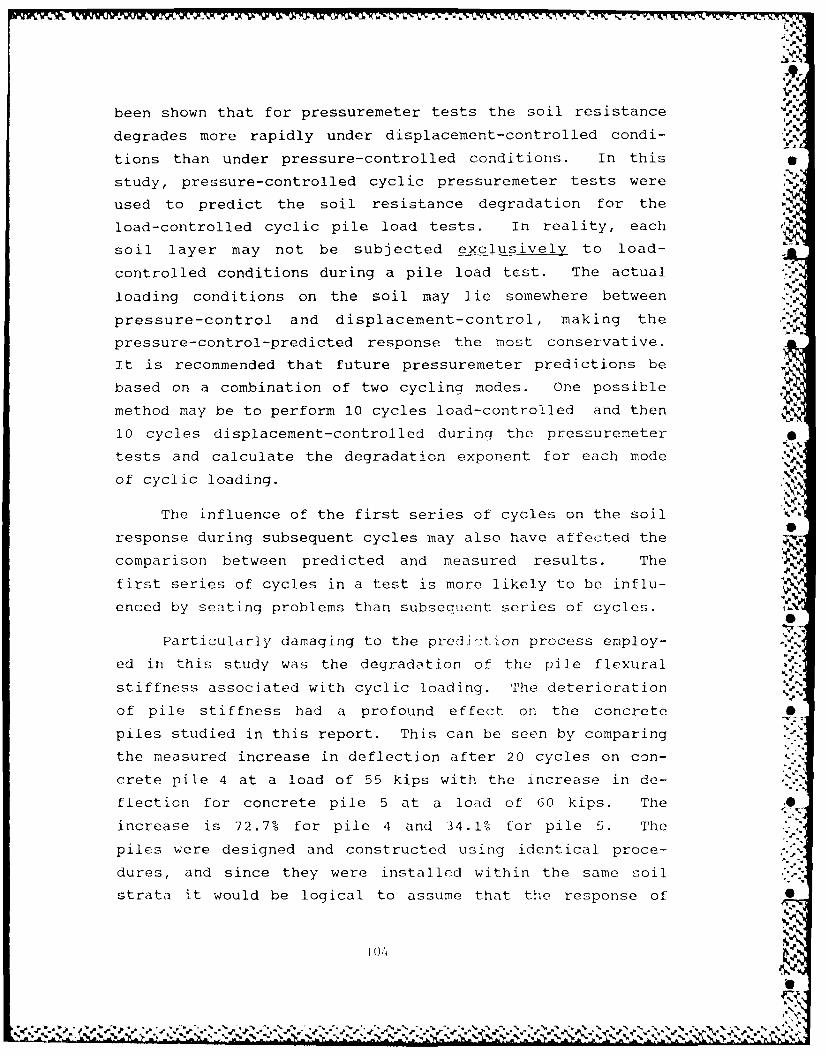
R m
been shown that for pressuremeter tests the soil resistance
degrades more rapidly under displacement-controlled condi-
tions than under pressure-controlled conditions. In this
study, pressure-controlled cyclic pressuremeter tests were
used to predict the soil resistance degradation for the
load-controlled cyclic pile load tests. In reality, each
soil layer may not be subjected exclusively to load-
controlled conditions during a pile load test. The actual
loading conditions on the soil may lie somewhere between
pressure-control and displacement-control, making the
pressure-control-predicted response the most conservative.
It is recommended that future pressuremeter predictions be
based on a combination of two cycling modes. One possible
method may be to perform 10 cycles load-controlled and then
10 cycles displacement-controlled during the pressuremeter
tests and calculate the degradation exponent for each mode '
of cyclic loading. N'
The influence of the first series of cycles on the soil
response during subsequent cycles may also have affected the
comparison between predicted and measured results. The
first series of cycles in a test is more likely to be influ-
enced by seating problems than subsequent series of cycles.
Particularly damaging to the prediction process employ- -<
ed in this study was the degradation of the pile flexural
stiffness associated with cyclic loading. The deterioration
of pile stiffness had a profound effect on the concrete a
piles studied in this report. This can be seen by comparing
the measured increase in deflection after 20 cycles on con-
crete pile 4 at a load of 55 kips with the increase in de-
flection for concrete pile 5 at a load of 60 kips. The .O
increase is 72.7% for pile 4 and 34.1% for pile 5. The
piles were designed and constructed using identical proce-
dures, and since they were installed within the same soil
strata it would be logical to assume that the response of
'NV

70.- - -
the soil during the series of cycles would be nearly the
same. The explanation for the large variation in response
between the two identical piles lies in the relative degrad-
ation of their flexural stiffnesses.
The primary mechanism for reduction of the pile flexur-
al stiffness was the propagation of cracks through the con-
crete cross-section during cycling. Increased cracking
reduced the strength of the concrete. Crack propagation was
most pronounced during the first cycling series for each of
the reinforced concrete drilled shafts. After the concrete
had suffered significant cracking during the first cycling
series, the pile stiffness would tend toward a limit value
since the stiffness would primarily be related to the
strength of the steel reinforcement. Therefore, the differ-
ence mentioned above exists because pile 4 was being cycled
for the first time while pile 5 was being cycled for the
second time.
An alternative method for using the pressuremter re-
sults to predict the pile responses would be to treat the
pressuremeter tests as a model pile load test and apply the
PMT degradation parameter a directly to the monotonic pre- -..
diction:
y(N) = y(l) x Na (4)
H(N) = H(l) (5)
where y(N) = pile deflection at the groundline after N .--.-
cycles at load H, -
y(l) pile deflection at the groundline after mono-
tonic load H, -.
a = average PMT degradation parameter,
H(N) = horizontal load applied at the top of the Nth
cycle,H(l) = horizontal load applied at the top of the 1 st
cycle,
N = number of cycles.
105
.4% J-. *. z

I.
The accuracy of this prediction method for the relatively
homogeneous strata and piles in this study may be judged by
comparing the measured average a values with the PMT pre-
dicted average of 0.064 (Table 6). This alternative method
yielded excellent agreement between predicted average and
measured average a values for the piles expected to have the
least deterioration in pile stiffness, namely the steel pipe
pile (a = 0.062) and the prestressed concrete pile (a =
0.063). The reinforced concrete drilled shafts, on the
other hand, showed greater cyclic degradation than predicted
(a values of 0.086, 0.080, 0.073 and 0.068 for piles 1,4,5
and 6, respectively).
TABLE 6. Comparison of Measured and Predicted Secant ShearModulus Cyclic Degradation Parameters
Pile Measured PredictedNo. aaverage aaverage
1 0.0862 0.0623 0.0634 0.080 0.0645 0.0736 0.068
Overall 0 76Average 0.072 0.064
6.3 Comparison of Creep Exponents
In Section 5.3.3 it was shown that the PMT creep expon-
ents were 0.006 for the TEXAM preboring PMT tests and 0.011 .4
for the driven CPMT tests. These exponents were lower than
the exponents backcalculated from the pile load tests since 1
these exponents stabilized around 0.015 to 0.02. The disre-
pancy may be the result of two of the same mechanisms cited
for the underprediction of cyclic degradation, namely the
difference in confinement between the pile and the pressure-
meter probe and the creep of the pile flexural stiffness
under a sustained load.
106
" J ,-.
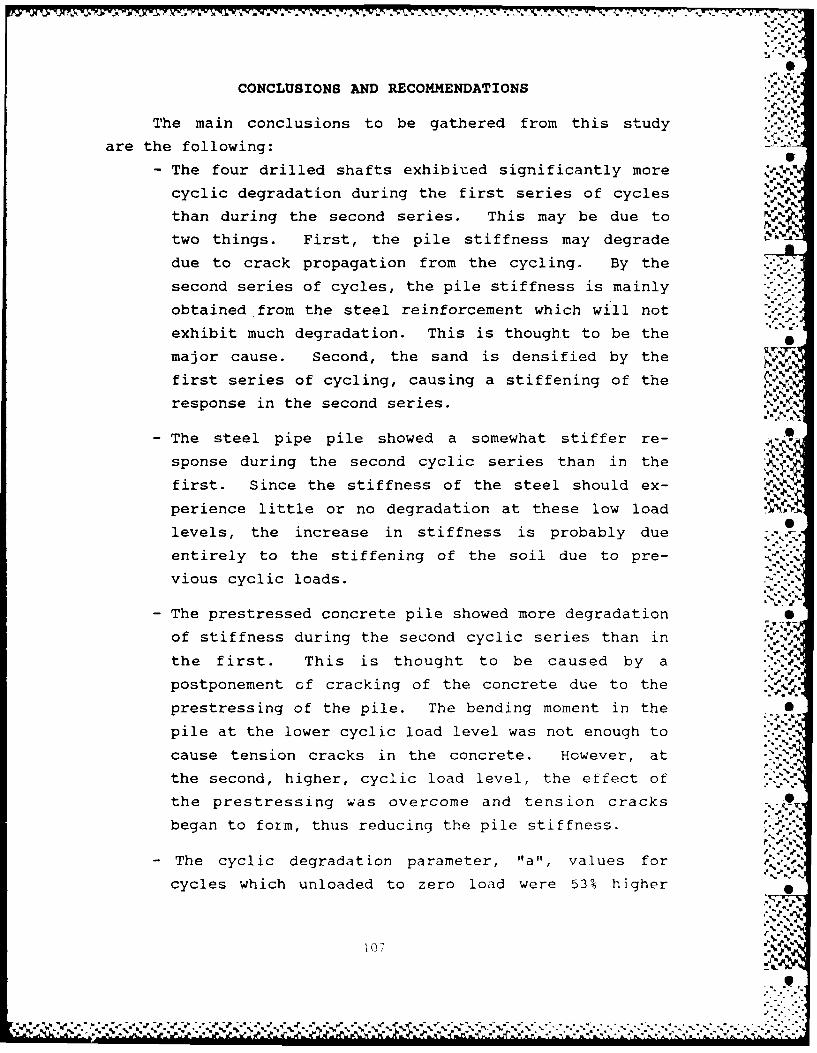
CONCLUSIONS AND RECOMMENDATIONS
The main conclusions to be gathered from this study
are the following:
- The four drilled shafts exhibited significantly more
cyclic degradation during the first series of cycles % -
than during the second series. This may be due to %
two things. First, the pile stiffness may degrade
due to crack propagation from the cycling. By the
second series of cycles, the pile stiffness is mainly
obtained from the steel reinforcement which will not
exhibit much degradation. This is thought to be the
major cause. Second, the sand is densified by the
first series of cycling, causing a stiffening of the
response in the second series.
- The steel pipe pile showed a somewhat stiffer re-
sponse during the second cyclic series than in the
first. Since the stiffness of the steel should ex-
perience little or no degradation at these low load
levels, the increase in stiffness is probably due
entirely to the stiffening of the soil due to pre-
vious cyclic loads.
- The prestressed concrete pile showed more degradation O
of stiffness during the second cyclic series than in % %
the first. This is thought to be caused by a
postponement of cracking of the concrete due to the
prestressing of the pile. The bending moment in the -
pile at the lower cyclic load level was not enough to-
cause tension cracks in the concrete. However, at - -'
the second, higher, cyclic load level, the effect of
the prestressing was overcome and tension cracks
began to form, thus reducing the pile stiffness.
- The cyclic degradation parameter, "a", values for
cycles which unloaded to zero load were 53% higher 0
4.-."I (" o .)
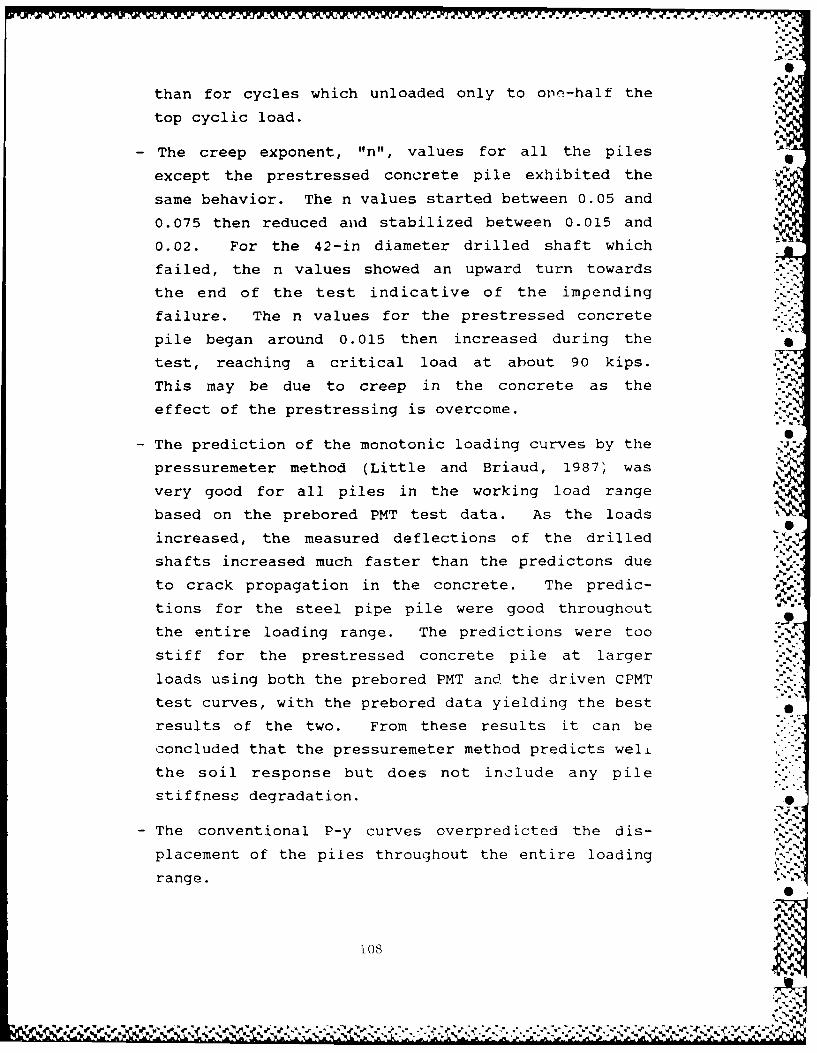
than for cycles which unloaded only to oivn-half the
top cyclic load.
- The creep exponent, "n", values for all the piles
except the prestressed concrete pile exhibited the
same behavior. The n values started between 0.05 and
0.075 then reduced and stabilized between 0.015 and or
0.02. For the 42-in diameter drilled shaft which
failed, the n values showed an upward turn towards
the end of the test indicative of the impending
failure. The n values for the prestressed concrete
pile began around 0.015 then increased during the
test, reaching a critical load at about 90 kips.
This may be due to creep in the concrete as the
effect of the prestressing is overcome.
- The prediction of the monotonic loading curves by the
pressuremeter method (Little and Briaud, 1987, was
very good for all piles in the working load range
based on the prebored PMT test data. As the loads
increased, the measured deflections of the drilled
shafts increased much faster than the predictons due
to crack propagation in the concrete. The predic- , -i
tions for the steel pipe pile were good throughout
the entire loading range. The predictions were too
stiff for the prestressed concrete pile at larger
loads using both the prebored PMT and. the driven CPMT
test curves, with the prebored data yielding the best
results of the two. From these results it can be
concluded that the pressuremeter method predicts weli
the soil response but does not include any pile
stiffness degradation.
- The conventional P-y curves overpredicted the dis-
placement of the piles throughout the entire loading
range. "N
108
.,de '
J i~2

0
-For all piles the predicted increase in deflection
due to cyclic loading was much less than the measured
increase. Four possible reasons for this difference
are: (1) the difference in confinement between the •
pile and the pressuremeter, (2) load-control cyclic
pile load tests may not cause exclusively load-
control cyclic loading of each soil strata, (3)
influence of previous series of cycles on subsequent
series of cycles during a test and (4) degradation of
the pile flexural stiffness during cyclic loading.
- The average cyclic degradation parameter from the e
pressuremeter tests (a = 0.064) matches very well the
average cyclic degradation parameter from the pile Vload tests which should experience little or no deg-
radation of the pile flexural stiffness, namely the
steel pipe pile (a = 0.062) and the prestressed con- ..
crete pile (a = 0.063). The reinforced concrete %'%
drilled shafts showed much higher cyclic degradation.
- The creep exponents from the PMT tests were 0.006 for
the prebored TEXAM tests and 0.011 for the driven
CPMT tests. These exponents were lower than the
creep exponents backcalculated from the pile load .I.
tests which stabilized around 0.015 to 0.02. The "
difference may be caused by two of th 'iechanisms
cited for the underprediction of cyclic degradation,
namely the difference in confinement. between the pile
and the pressuremeter probe and the creep of the pile
flexural stiffness under a sustained load. -
The following recommendations are made based cn the
results of this study:
- The pressuremeter method used in this study fo pre-
dicting pile response to monotonic lateral loading
(Little and Briaud, 1987) is applicable to piles
which will experience little or no degradation in -.
A. . A *. .. . . . . .- • A . . ,.-
-A.-- N A. -.

A-..
flexural stiffness (such as steel piles, prestressed
concrete piles loaded less than the prestress, etc.)
due to the applied loading. 0•
- Further study needs to be done in four main areas in
order to apply the pressuremeter method to cyclic and
creep loading. These areas are (1) the effects of
the difference in confinement between the pile and
the pressuremeter probe, (2) determining what type of
loading each soil strata actually undergoes due to
various loading at the top of the pile, (3) the - -
influence of previous series of cycles on subsequent
series of cycles and (4) the degradation of the pile
flexural stiffness during loading (monotonic, cyclic
and creep).
The fourth item relating to degradation of the pile
flexural stiffness during loading is felt to be the
most critical factor for prediction of the behavior
of reinforced concrete drilled shafts.
%,
110
7,I• - .f
VA?.:-
' ''-"- -' ' - ; . - -- -' , ' , ' . ' , ' '' ' . ,, - ,: . ' - -' -. ' ' . """,'+" . ",' '.: "',4.+"- '-,,,"[-- *,[, ''4' '-, +, ' . ", . " ".'." - '. +

.0REFERENCES
BRIAUD ENGINEERS, 1986, "Pressuremeter and Cone PenetrometerTesting for SH 146 Bridge Over the Houston Ship Chan-nel," Report for the Texas State Department of %nel,_Highways and Public Transportation, College Station,Texas.
LITTLE, R.L. AND BRIAUD, J.-L., 1987, "A Pressuremeter Met-hod for Single Piles Subjected to Cyclic Lateral Loadsin Sand," Research Report No. 5357, Civil EngineeringDepartment, Texas A&M University, College Station,Texas.
MAKARIM, C.A. AND BRIAUD, J.-L., 1986, "Pressuremeter Methodfor Single Piles Subjected to Cyclic Lateral Loads inOverconsolidated Clay," Research Report No. 5112, CivilEngineering Department, Texas A&M University, CollegeStation, Texas.
McCLELLAND ENGINEERS, 1986, Private communication. _
REESE, L.C., COX, W.R. AND KOOP, F.D.,t974, "Analysis ofLaterally Loaded Piles in Sand," 6 Offshore Techno-logy Conference, Houston, Texas.
WANG, C.K. ANR SALMON, C.G., 1979, Reinforced Concrete De- 0sign, 3r edition, Thomas Y. Crowell, Harper and RowPublishers, New York, New York.-Nu
-% %.
10"2.,o'.,
TII )/
.--e . - ..-.. .. "- . -. " . .. "- .'. . ."". '..'_ .'k '..¢-'." ''w " . "" '-. "''. s""- - ' - " ". "'° -' ' """. ""'."• -"" -4

N
h-
..5
i!
'--
A
,"4:5
A'N'a
J2
€'a
!Sa LI a-'. .a ¢~*h~a' s.id
APPENDIX A !
PILE LOAD TEST DATA
... ':
, ., -p.
• ,,' .,..,
Y S-,-
'- " "- ' 7 " ; ; " ;'" " " " " -" " "" .- r .. ., ., . , , , . ,. ." " , ., .,.,',, . . . , .. . ,, ,.. "-,..,. , ,. ,., ' .- , ,,,,, X "V '.

TUNNEL SITE _
PILE LOAD TEST DATA %
Test Pile: 20 r0UA P_ C 2cR r r Date: - ?7a
Reaction Pile: 4Z -t, hLLEI -siAF -
Displacement gage locations: '3
#1: 3/8 1 TO kkItT OV LpA A( k-I aJ'~ A~v C KS Ir, 4#2: J/ C III f I AXI (tj R% BEcoLA.)#3: 1-7/4' roP ~I ( ifT (w, LOAN AxeS A 0'/," AZ3O'J tA) IJ~trNz
04: ' t tL C1,1 OL
I Time Load Cell [Pressure Test Pile isp.L Reaction kile Disp. _r
", Reacing in Jack #1 (#2 # 3 u14
S_ _ (lbs.) __________.O_ )_
15t C)IQ GS.. l. 4Z 0-1,1 0. A________,
,1 S ,so A cw A..-." 1 g )o
,,;...*
'7-l- ~ -1, 4 ~ 1~ o .1 )n96
1Z A4 In o
kyLt . 2-o S!~ .Q2 L-i /Of I o 8 ci IC,1 n 2"l,
-715 _ _ _ A. -2: 1; 54i. 9i... Ci' ___I______ -
'A A i)4L 9. S4A ir ci2 o.r
.11.5, 14 8 2LLZ 0 (£ i L i p 7a
;n -7.__ 12 2. n -7-. ~
30 n. I 19.~~ 0S. 1 C r
-T. 4 ~ L z( .~-- 4
3-4 -5 0 12'
114
N N
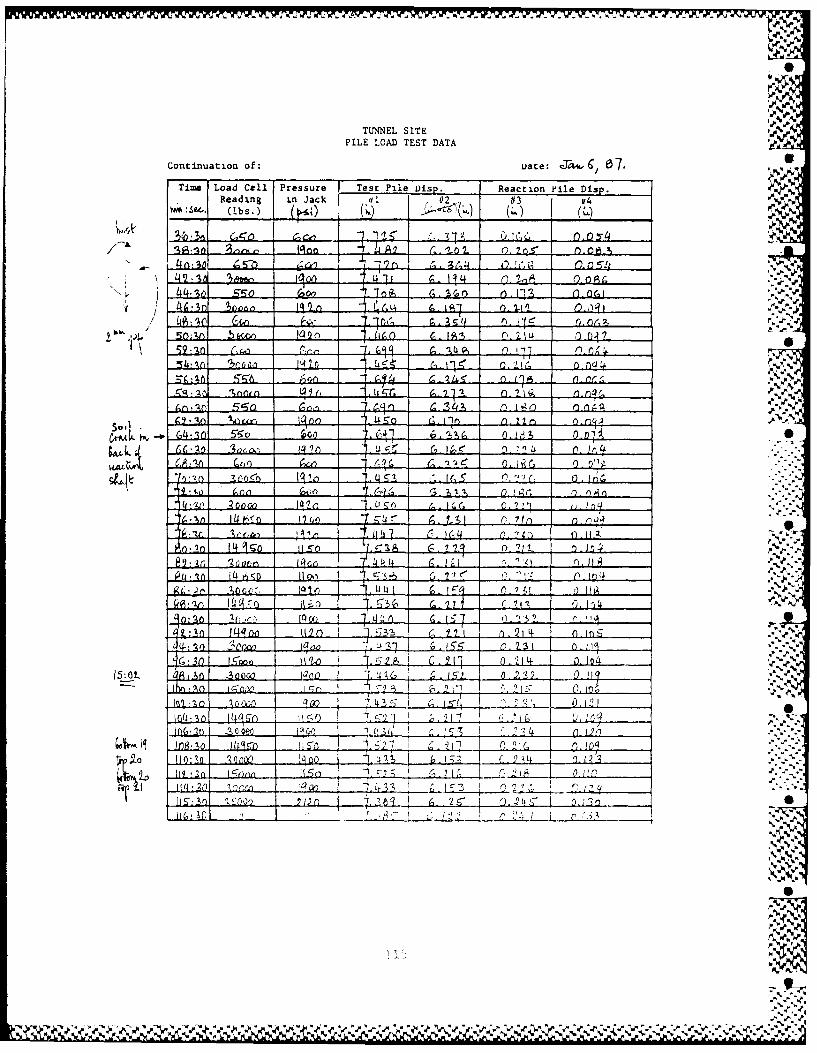
TUNNEL SITE
PILE LOAD TEST DATA
Continuation of: uate: 0 S7.
Time Load Cell Pressure 1 Test Pile Lisp. Reaction Pile Disp.Reading in Jack I I #2 #3 v
" AS 4, ~ (lbs.) _ _ .. 7 I) (;...
3 c 6 -7 5 ..ZL .. U 5 4 Y.
49aa~ - u1 r4 .A
_44 So Hoo lGoo. _l .o n ,. 1 , G" I'!!; . .i]. . ,
50; ~ ~ ~ ~ o In Kon 1 91,
s4. In o o ". !2.r o. 0 c. n t %
o.A, C. r
l9 Ao tA tA Jn IL ,. . 0. 1 n" , , ,
S oI (10 o l5,50f I0O n..?_ I 4: 04 1 i ,
-I,).. 4 L C LCl n ,! .7' So.],
01 1 ,
(I-2z oo .147n u1 J o 6 ... 1z' f
on 7, t n
89 i' 2 alt 14n 4 4 ~
i~ ..... q 'AL 0,1. fl)LU 0 4
15:0L0_222 0i21
- ~ 1 _ _ _,., .
W1 o I r)r!oC I -sl' r
I o i I 1I4J 1- ____,
1____ If)1 li -S 0 pqC-
' o ~ ~~~~ 1180 ,.n f'
119 . 01 1:,Clr 11r
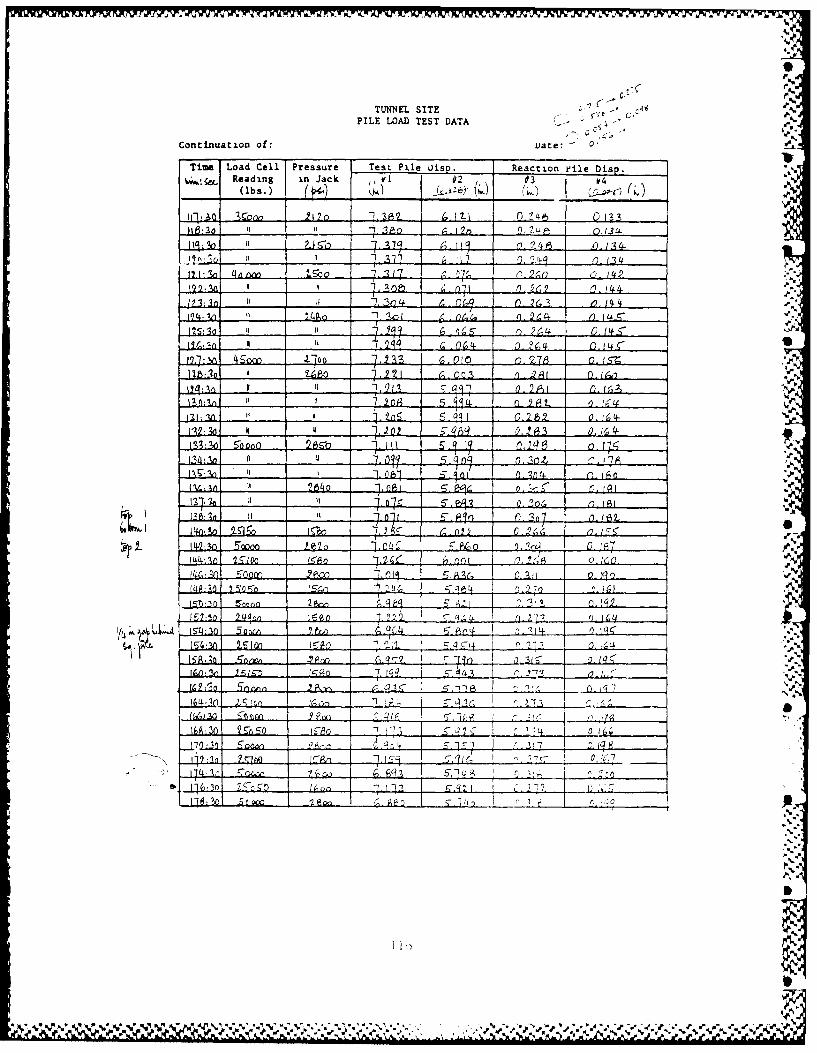
TUNNEL SITE P,
PILE LOADl TEST DATA C.
Continuation of: vare.
Tim Load Cell Pressure TeSL Pie isp Reaction kile Disp.SReading in Jack V1 2# Y4
IQ -m pC() 21 111*3 -- it~ A-12 .
1 I n 41 nm9 2(,n~J..... 0- 14
/ -3420 11 -7 .3r .1 4 .r)0-2 0 if04-1 -2.. 10 1 1) 24 o 4 .4, :
___4_Sow_____ra 010e. io27 0 1-S
it% 04- o. L M i . f s4
U2i. -I. 1 -- ________Z___
II it 6
264 L k.... E2Z.L _r,_______
13:1 it.. '1.. -7 A 7,6r 0 1 . p go
_ __- In T 10 15,9 nn 0. A .f
o~ 9 I _ __ _ __ _
16~.c 2 _T n n I q__ _ _
eqS ~ ~ IF._7_U
i77 ~~~42.T 1 (7___ ___
d lioci; LA
wr'
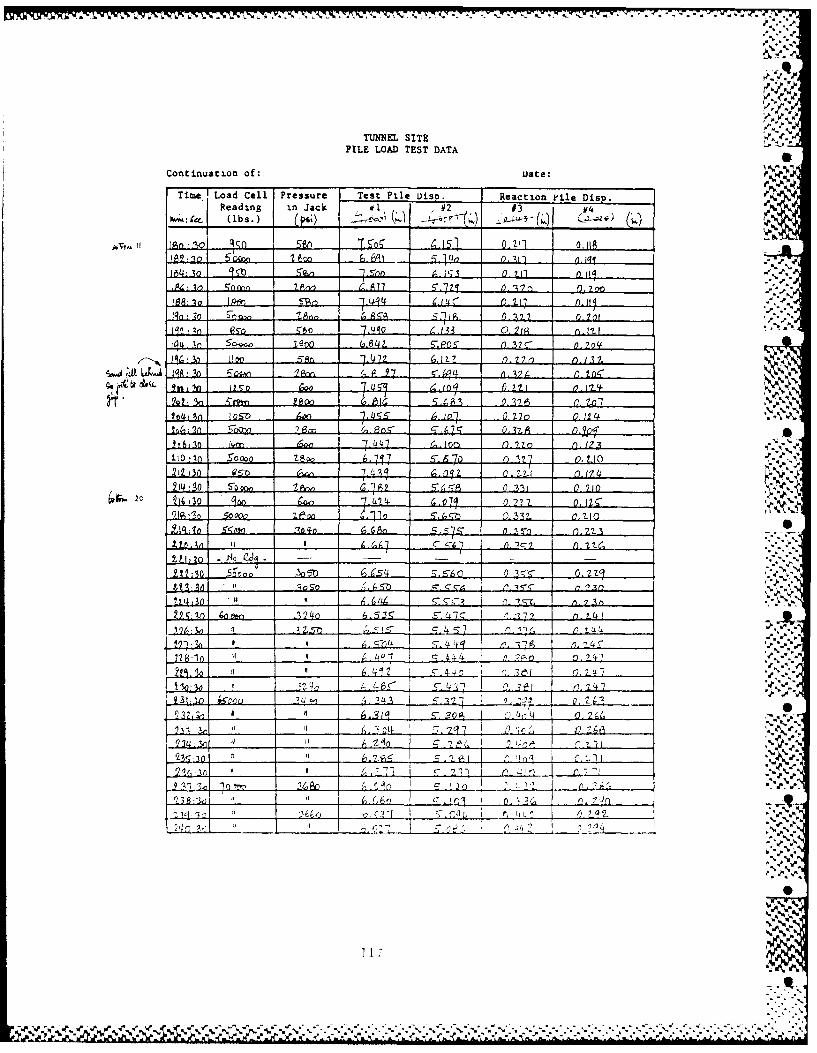
TUNNEL SITE e
PILE LOAD TEST DATAs
continuation of: liate:
TieLoad Cell Pressure TeIst Pile [lisp. Reaction ile Disp.Reading in Jack i 1,U2 #3 *4
Ian - -"n1 qcJ. 0. hR
£1....1Q . 0-. S~i .ILL. Az... II).ma .2 ? ..1
I3.fl-2A 0,? 561 .&q . 33&. 0.1 M I !
9_______ 1. - 5n 1m 80 G.66.(A ?6z
9I'n o 64 ' U4 n. 7 r n 2'tC3
21 3n 95- 4 1 2
320 Q1 so 0 o . ,1
9 0) -o 17. C. L qb .11 Q, 7-0
Y.4 in T~f 7 qm a6p 0 (sL* o. 2z
S'o ____________
Yt. r?.2 -
110 31 141 ?faI I D bs oci _ n314 51.3 2
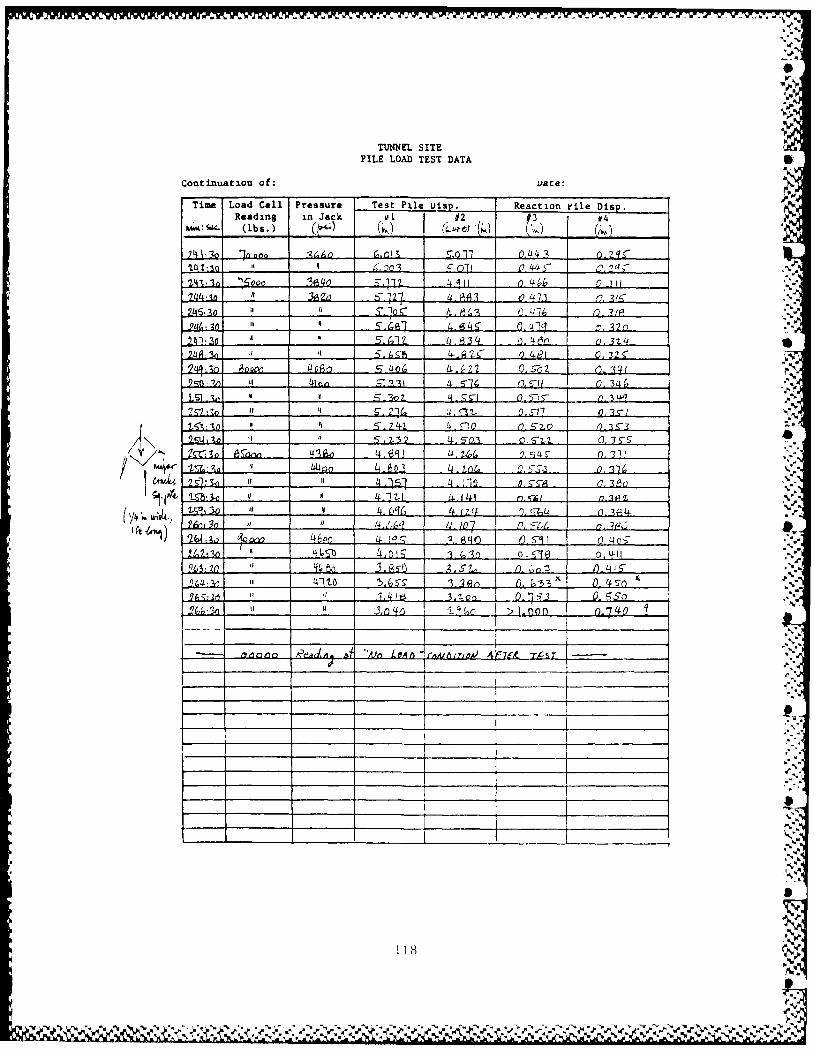
0
TUNNEL SITEPILE LOAD TEST DATA S
Continuation of: a3e:
Time Load Call Pressure Test Pile Uisp. Reaction File Disp.Reading in Jack oil #2 f3 ,4
L%%! Q. (lbs.) 0JtL.0 4' r , ty ___
7 44l 30 0 4 3€Z 0-77a #B. 21 if,'
_____ a' . Z 8 9 o. , , 3'4 -
g .~ ~~ 301 m7 ni,0 4tot __________ a .Qo 4.Q - O -9-(,J -
2- _" ____-_ i94J ( / . .3 0. 31 <,
20:~~~~ 3 ( .1 4 69r) o. 3'-zq "
90'6. In A n, 0.- 40lW, ..6z 0I. ,50 z _34 ? %,
: m , -, 3 G . 2 q(, 4. (%, 0, V7 0-Q._2 lZ-
., s ,, U ,: 16 1 . 1 5 2 , 9 0 -1 o , " 0 , 3, 5-19
$gq4400 4.p 0tJ #l 5 o . -73 . ,316,
.L...
Ono q____ _______go_0,_0
1 I w8 0.576 0. ,L-
f'i I 33 -n gn q- no 0-40
AI _ _ _ _ T 4A
__ __ _ _ __ _ __ _ _ __ __ _ __ __ _ __ __ __118_ __A
________ _____________ _____________ _______________ ________W______ ______________ _______N____________

TUN~NEL SITE
PILE LOAD TEST DATA
Test Pile: Z4 b'4. OPk tur P~ PILE Date: I ~~
Reaction Pile: 4z r),A )P) -Et SHAFT8
Displacement gage locations: +#1: - 1 9/11 4116VC LA A,'11 1141. To 7HN& RikHT /ASFCAr^OfSt# 2: 4 '-/ F&~L~ L6A!j " A,, ' .9., F O * r TH7 QjJ I*F 4 0 E-#3: A6011C 4O , -At r, L '71" To 74 L -T A% tc
#4: ' t.,W sL* A'1S '/ O ~ -F 0.7 ,
Time Load Cell Pressure Test Pile Disp. Reacti.on jpjl- DipReading in Jack 1,1 1)2 1)3 i'4
:kc (lbs.)
60 00 "" 1--t P-Ei-11A4 OVW 7rtir .JE- L __ _ __ _ _
I7 8: 50 a9 C) - 0.~L niL . r) -( ) 4
-1 11 17 CSS..& 2 2n (,n 4 nIN Lt
______1 _____ C7S. Lz M D . 0 n0 p0
5____ 414 6S, 5,0L 0 60 Q 044 G
M41 lo~ L1. el f- 1f 0 046t
ISI3 0.2- ni 62 0 ? -q*V
'7 C Q~n(, . 0 7 S
1__ ___ ___ __7__ 4_ _ _ _ 6-'(S.0 1 05
n, 0[6 (2 Qc -I I
___ 141s 7, 4* 4 --_7-42_ t__ _ C __ .____4 __ __ _ C)2. 6
I ~ ~ ~ 5. f__ _ __ __ _ ____ ._ __ _ n._____ _I
In_ __ ,. jt ?%7 4 -:'n
11 ___2A n. )A -. %6_ _
M~n 5 . Z 0 1 - 06 . 0. ? 6 - ( (7,
tI 1 1 -0. - (, SY
1111 1!' %A. 4 PC, 44 2
11.3o 3 cxy,, 19", , r, .n
'~j', .20: Vn I V &'Vy. .3 a 74 f

Y%"
TUNNEL SITE%PILE LOAD TEST DATA
Continuation of: Uate: 1.-7i-67. : ~ - - -
Tim Load Cell Pressure Test Pile Disp. Reaction Pile Disp.Reading i.n Jack of #2 #3 #4 .'
'AZ
780 "" qZ7 6,. 3 7 0.07-1 0. Ogg60 Inr
o;,_:, - 26 6. AL 7-t o. () '.A
w'Rsol :24x' 2-q o 5". 1% 6. 'r- 2 ). 01(,2 Ns,"""
41-16 RS -. ". . 4 0. oqc 1. 1 _ ,,.,
45 s :o .5- 2nn I. ro ..2 4z . ..0 C1, 0. 1,7n
Time~17 Loa Cell0 Pr0sr Test %ie ~ Rato 'l
- Readitccng itn ackl_' #2tf #3 r4 q.L lbs1 .q) (_ 0 5 J .,77 .6b r (-.4
a,2 anein 24 .L, 97 lec2 C. pg, I Mt-r
5 ____ __ __ arnn61-3 0 a
-St ;3a 4 n .72, "T-& 0.4! A 6. 44.l 0, r.29 0 ,. DR' ..
I' In -r 6. 9.1-
L10 206w..w- . . - -
II. it I 154~o /
:0 034j AL vO Z. 1j 4 ~ J zl
11 ,1 1 coo ; o. [l n
a~Q. - 0 r, r,14 IL 8 [^,B 14
71 0 0 H)___ . rfZ.2
i~5%

%I
TUNNEL SITEPILE LOAD TEST DATA
Continuation of: T ae: -a 1 7
Time Load Cell Pressure Test Pile Uisp. Reaction File Disp.r Ir" Reading in Jack vi #2 13 v4
4 In 3p ocoo 14 & n_ , 0 11
Ul.2: Ao J 0 I. , n -. ? in _. 91._ .r -
110-2 CO 4 .... Lib C7 .i n
2111 I n I;, I Ao. U,2 n a, C. I2(
za4,1 4g~ 7 U5 1- .0qq (
1 ______410011- c- n , IPA (.12L 0. !A
12fl. ;0~ a "zrqn- U 15 2od 1,) !7 7 o-0314 1).z
II-1 ayQ Y. SL4 m1~ ()q 0 III
IZ 03 a onc ? (o 5", 01."5,Z 9 oq ,I. '
9".1 II ... -I .o .2 0-9 l l.4
19 _ __I 11 - m (-1 C., I f, 2 -
9 . - 2A 40 n0. 1- , t f , II10I. 'M] Z4 m-SD 0S 0,. S 1, I£2 o . 163L. ,
a _ ___ __n . 3
M3. in Eo ow 0l 7"1 C. 11.4--. , [q3O.I
______ ,, ___ _qQ __'.01 _ _,.110)_._ _ r. 1- 1400
__ _"..n _"__ I " L I_ _ _ 1 l M
I AC, .. i I,-
, . r +.!I"0 r)
S._ pi It 4 F . 7 _ _ _ _ _ _
-;0~ ___ __ - aA 7__4___C,_____0 1q1 1,Z7-
r,- u, __ _ 4 ./, I .', 1 / -1
I t. o " + q 5 A o . ,2 o 0 3o L... r
L A! So " m& .2 . " 1,o -
57,1~ 2l 4 4._ __ F____T _It_
:1
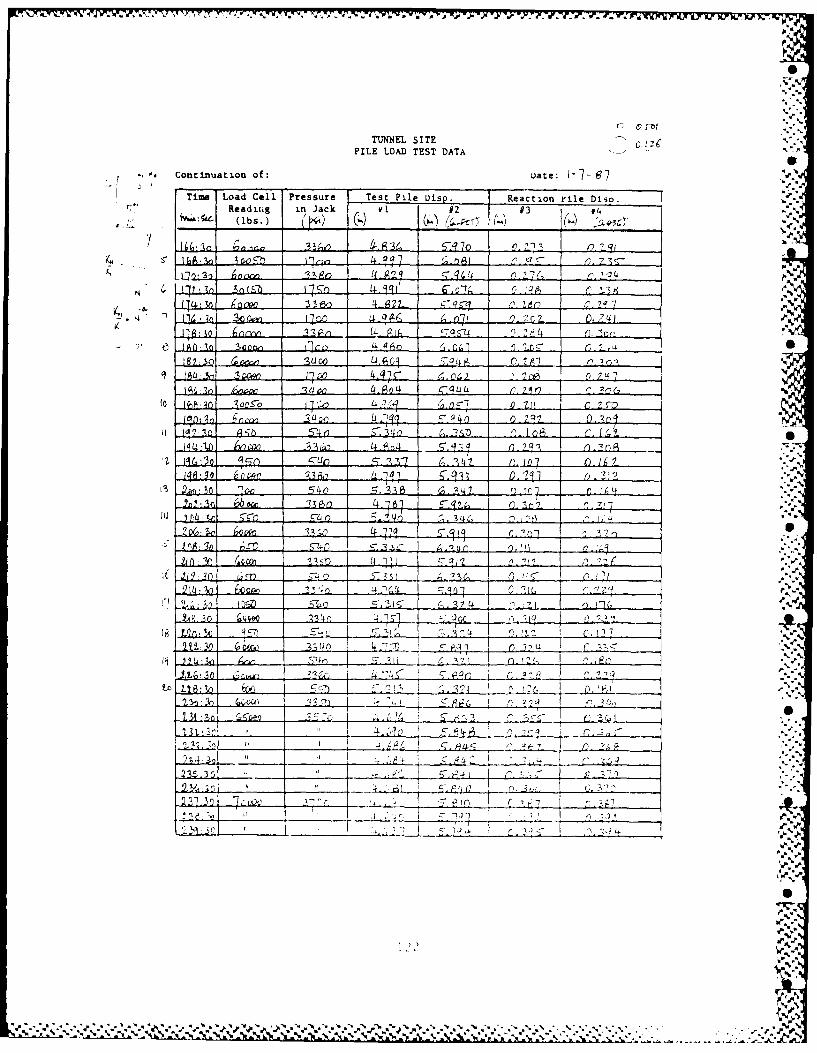
Uw'v% P P3
P
.
C C
TUNEL SITEPILE LOAD TEST DATA
* , Continuation of: uate: -7- 7
Time Load Cell Pressure Test Pile isp. Reaction ile Diso. rReading in Jack V1 02 #3 #4 %
aI 0_'_,-_ ?q I r-. 7C-
(J. 27 " _ 7
4 , ,.t4.99, ,- r ' !-. 2.
1 :32 ,. 4. 27- . 2 q.
II ' 2
4(,,-in '"'w -1 a- 4 .4 .7 t. 2 ,n "t;:~ Of o _ _ f
0l~ U ~ 4O~ -L)4 S-, q
c. .-. q -y 4 _n
5a 4oE.~ C- 4~ 7-4 r2 / 4
2 Jf L '33 p2 iL________EZ4 0 0 1 t;
-2L 3 ] .. : Z . - ,_ 2_, .. 1n. 3.YAP., '0 7q IA(, a . [
9."_J,3o G~,, 2'u- , _ __ .. P J 7 -, -, " 5
iI : !: . !, 1 12 7 ,h-%. ..._ 3 11 o EL , %
i L nn o , - _,___'. 1 -,..
~~J.. ___
_______ ___'_- - " '.... c_-, -- 22a f.. 2.P00
'5* '5I.-'..k
.,.' .',.*, .', .'. ,..,. , <. " ,".,-.,, .% -,-.y - -,,,-,2 -,- ,- ,,,'.,," -,,,,, .,-.., ,. ,,, ,,..,.-, .,-. , ._-.-' .'. -. -:, q" "£ " 7-. ... ... " _% :].- :-t .. ,

.,;NEL SITEPILE LOAD TEST DATA
Continuation of: uate: -- 7Time Load Cell Pressure Test Pile Disp. Reaction Pile Disp.
Reading in Jack v 1 #2 #3 W4G (bs.) jj ~ k. ~s) G ~ ()j~/.)-
E"T nu 4,63? .2. r4 . 0,2- r1 tL: 3 ____ L .(P 31 -9- 8 O 41
__ 4..-__ .C7. "I C7 '._
"
1A : ? , ,7 5,. " ST. 4_1 U 14sz+ 0. 4.Z-I.9 ;3 111 -M 1 q71 _ !5. 4 2_ 4- It-2" 0. 4fOf ,4, .
6n, 'ro 4 211 4.,..' !a.l I. '+ S 0I ,.< :._ ____o 0, 411-_ e)________S, -%
__-_: 4 Ti,.-
L+ (,q L 0. ""
571__0 5. e, 4- 1Q-4
... , .- __ , + .4, 2, .0, .- __ q Q-_ _q
.,:7o 5 51Q 4 e, 14 0~ , 46 0
B"' gbo _4ZQ 4-. L! T 1" * A 0, 64 q
_41 -0 0. 57 fbU1:30- Q-___ _ 0
-9,-r ,2. C,4rA 1. 4._ _ 4 1 S, .
2 12-S U W 5,L49 Ell E 0 5' 1
. LZ." s.++ I -. I -+ 3 . 77 0p 7 _ ..
4. t4 ;9___ 5' 54 9-jj < 0 4. -52
123 ,FV;
Wo 4-1 .:5V):0
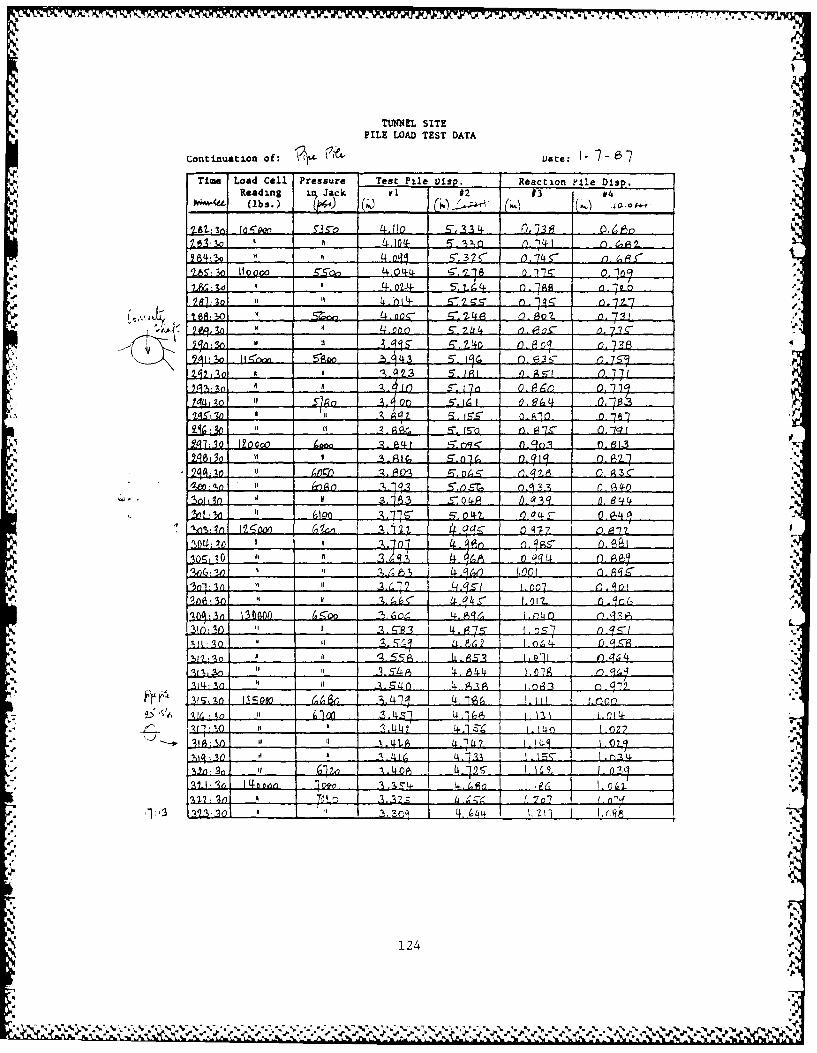
TUNNEL SITE*PILE LOAD TEST DATA
Continuation of: L i ate: 7e7Time Load Cell Pressure Test Pile vis Reaction ?~Ile Disp.
Reading iq Jack W1 #2 93 v
24L~~4 M4.~ t~ ( t+ n, A3 g 4-
.....La U4.. 00. f-7 ~ 14 77Z
942o 11 < IQ,.,... 43 - O.6 , 1-
zl -2"flj:3 .5 0 f l --
UI1 1200 4000 -1 a 5 g< 0q -,1
*4L 0 6n A____ n____ q2 5' o± Q .sr 0. 3 G4
Int' S _ _1 _ PL . . 0 4 2. .q 0. 9,
9-<w o) .7 . JL.f..qq 0.2 V; 97 4l 7
Ma 11) ___ -__ __ n&. 5;- o.2L taG
rr ~ i i10. .3~.(9.e. .. r. go,
-q -4PI 4.63 .n
% -7-
12 V 1 l2 4 1"
P44
16 qV '.7. 4..-4 .2V~ ~ *''..\%.4 =~' N* ~ ~ ~ ~ 4 644+*.,* ~Y
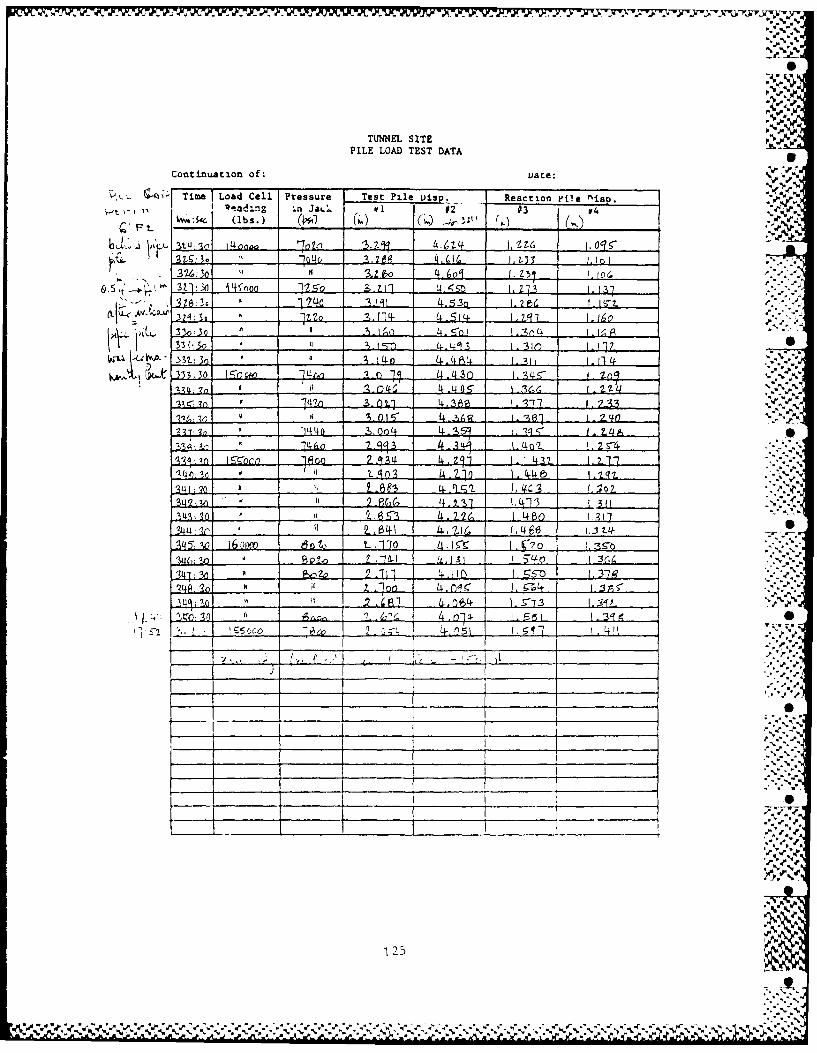
. . %
TUNN4EL SITEPILE LOAD TEST DATA
Continuation of: uate: N -
Time~7~ Load Cell Pressure Test Pile 2sp Reaction 'il e r"isp.
I Rad2.ng i.n JaL-:. #1 02 - 3 #46.. . tk (lbs.) ( -.P' _ __ __ _ )
StLI 3. ~. 7!2 4. Z i4 1,~L U6 [.0 5-U0 1,261? L4.0L. . L3U 1,101
iN 3 Q :~ 3 0 4Io ' .L . s. 2 5 7 I
x,. ~~~~~~~I 1 *b0f t S 4 - ,6
I4~ (, o 4 I Z33
_____4_q651_-e_ I- Z 7 '1
S.015 4- . Q.q I wj . Z40
Z^ 4.3 1."oI . 2 S4%
A. JL2.Z. 4,l 1.'4331,2
14 -1 -6 6 to _____0 It. I, -p.-. -, . 3
U61 ___ So____ -7416. 1 4 ) 3L(34 w 3,1 ___ E0 zo 94 ..1 IS Q1 7
________Z_ _____00________ 11 WI_____________ ____________
_ _ _ _~~F1 t__I_ _
_ _ _ _5 coo _ _ _ _ _
125

TUNNEL SITEPILE LOAD TEST DATA
Test Pile: A26'& Ly~Ie 4' 'I, , Date: 19
Reaction Pile: 4, A."? "Pdc IIIjeI,1,3 U 7f,
Displacement gage locations:
Time Load Call Pressure Test Pile.24. Reaction Pilie Disc).* Reading in Jack V1 2 #3 r
ovo2 0 a & ~o ___V_____0_ 9 12s
2n ______ _____ .4-1 . nJ L. .l 0 .btqs ( v1
LZ. ItI. k~i.5 f)... 8e3 04Cr 0
it__ _ 1, 4 0. p ~ -*. -*- '.
I I~ - ~ it) 1 _ _ _ __01.4l . 4 0 -
I,;!__ I A~ 1~ 1.4 .el i 7
143) it _____ 06.72t
1].~(i /0 20 ewx
if -
17f -7r q±~ -1 r, (17
3nomo Iqq 1. U017 zo 3
M.3f 7__ _ b i # ~1g4 0p ______ I L fiiL
126
% .fir it, A.it,
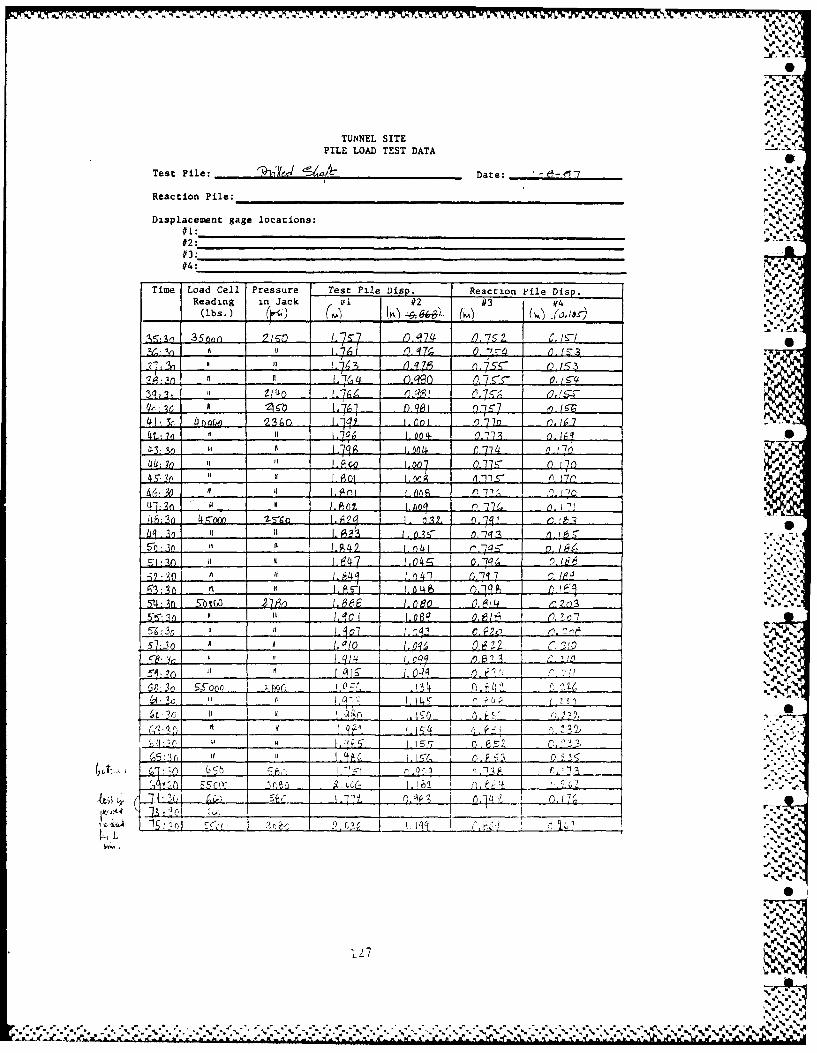
.,.". -.,
TUNNEL SITEPILE LOAD TEST DATA
Test Pile: 11,k11 'Uo/l- Date: '--- 7
Reaction Pile: _ ___ __ _
Displacement gage locations:411:#2:#3:#4:
Time Load Cell Pressure Test Pile oisp. Reaction eile Disp. %Reading in Jack #2 #3 W4 ./. I,(lbs.) 1____ _ _ _ __ I L.85- ( ~ ~ ( hli
i. n A if I.)&A,) q 7; O. -7 - .1' ,.'rr
._ I. , a. L ,, Z 0,1 9
LI 70 z
__. 1. A I. 4 )4- 0. - . I 7
.S':~ 6t "I 0 1, pe) 1.'!/3" t 1704__ (7. It)~
46, k it 'j, 1, fkof 1.tO£ 7 " . 170 "% ?2, 0 .- W .ho.. '7( 1r
46:3 c.-w S I59 0 1 91Ik
5 0o : 2 3 A 1 .g 4 A, 4 4. 2 1 .n ,4 1., .
r% It T R '1
5"57 3o 1"1n1 1, 0 6 Io q 0, .' 6O IA7
A~~ %.*., _ ,% '
An 5,Y00
t 0653g :a ,r 9.fC ,'. S C,
-1: "0 S F 1. 7,O ' l' 'I4 <
F C - ren
; z7:%%
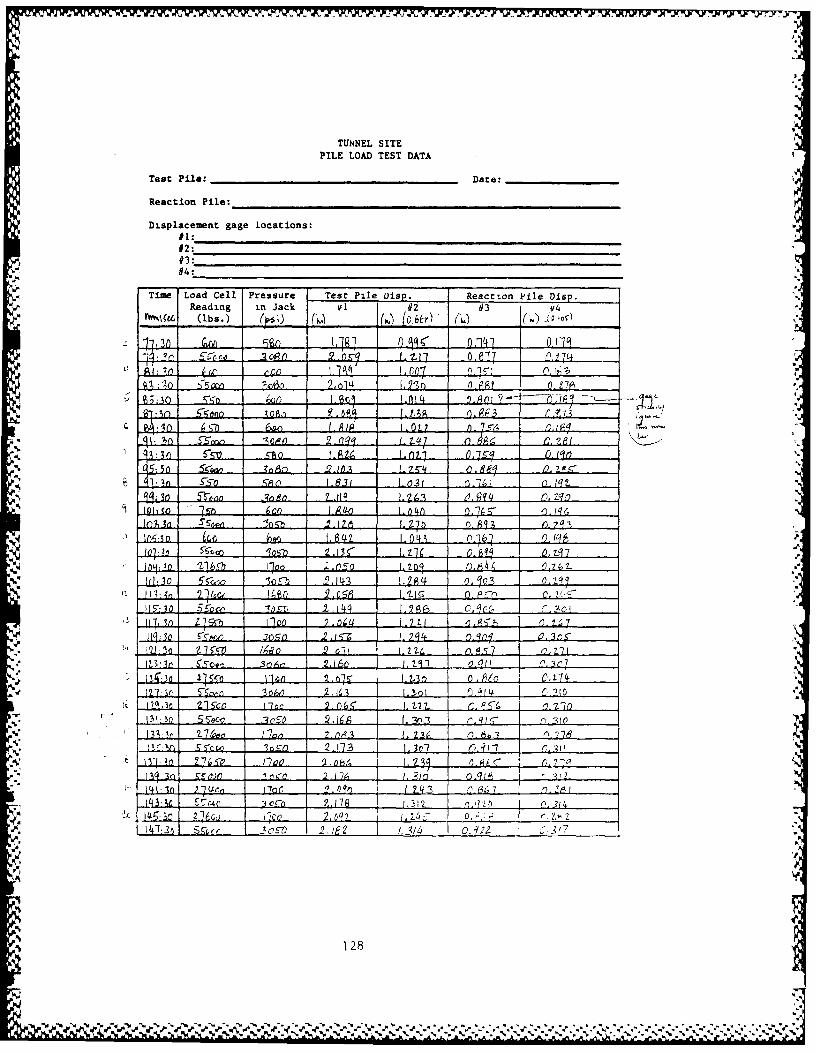
TUNN4EL SITEPILE LOADl TEST DATA
Test Pile: ________________ _____ Dat e:__________
Reaction Pile: ________________________________
Displacement gage locations:
#2:#3:#4:
Time Load Cell Pressure Test Pile Visp. Reaction P~ile Disp.-Reading in Jack wl#2 #3 #
(lbs.) W ( 6e~r2J (6) f05. - )
1-7 3A ~... 6" LI.. Q14j
1.Q 21f I2P9 1~& 0. j C
L qn~o 574n3 1. nL~ 14 Q0. 17
' ~ 6 w.&0 I JA.L 0ai... . 1 F
JA-1i 9n 1 .I .A2(, 1w ._ q4 0 /it
%L. L.. s-5 .-Q.31 1-03 2 6. .iL. '2
o.50 1 2 ~ .z1 0,e~ 4 4 )G2
51'5
153 1 ., 2 A( A C, q C, r, ':r
IVL 0 z3 5f g 4. 0 2. 01 1. z 21( n.qs7 .
Lti, 30 .1ct1 5 - Qin 0 2. 014
11. 1r SO 1.6 1.2 O..- I__6_Af___"to
143 21 2csD n- FS. .F V7J1 0 .; _____
I r.n55' .306 1-
1111 2- % 0
128
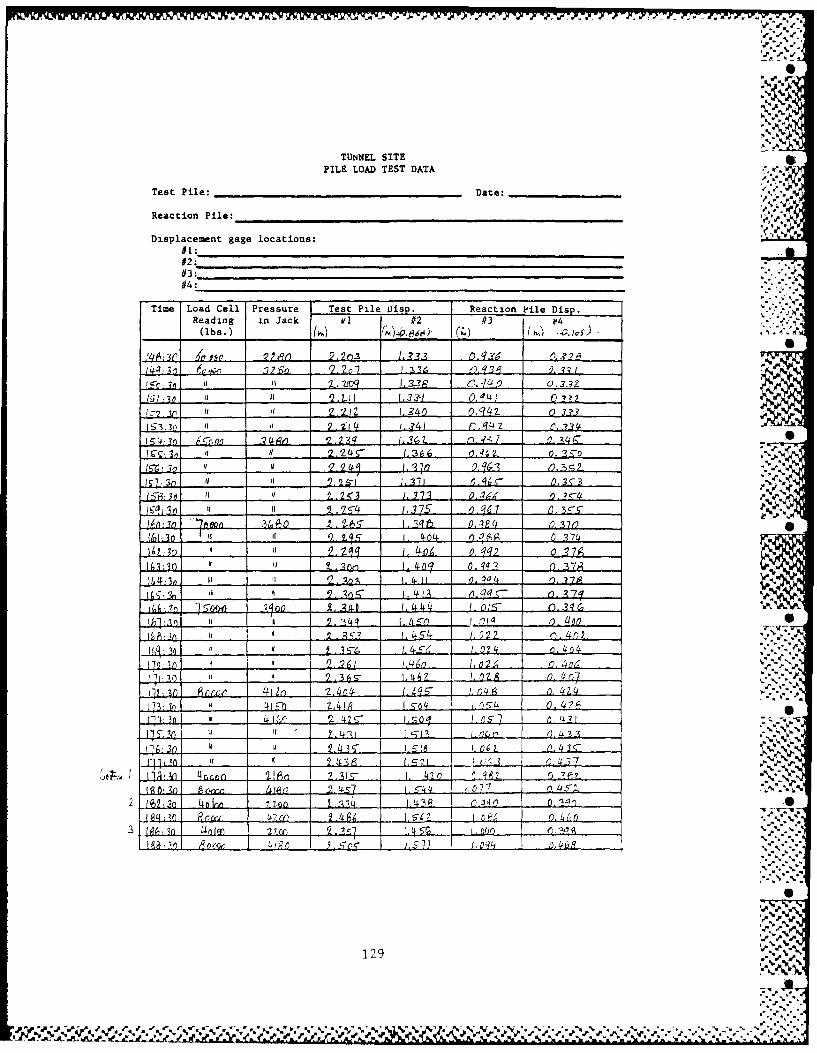
'_" *' .L ' ,
TUNNEL SITE 'PILE LOAD TEST DATA
Test Pile: Date: _,.-,_ _
Reaction Pile: .,__ _ _ _ _ _
Displacement gage locations:
#2:#3:#4:
Reading in Jack 1/ #2 #3
(lbs.) ____ () I ' (_)_*.
,'4A ,i 4, 2 .. . 2r- 1.., .? 73,
t. In --7 27 r-S 0 '2, 2n Lia1136 1? 3 401 1
1 _3 2 r .Jq 4f ( 0 0 , 33 2
/ ;l, 3 0 .3 29 0_ .f /., f 4 Ib C. .33 " 2
I-' 1z. I l 9#7 1,341) 0. q4 2- 0 3232ke9..3 2: 1, 34£q 1 ~ r. q44 z .5 4,
1L7.3a '" __ __ _ . .%1 L,21 . .... 0.3 -3Zrcl e)o I if it.,249- t.37._ 0, 6 ,0, 3S-0/,-,_
0 :" "Q, j 4 , 37 2
lg7 9# i. s, IQ q1. 6 s- ID., - 5l 7
15't.n I e 9. 2<3 / .-779 l- 0. 41A, 0. 7,
10 i 75 _____ _ 7 4
1h) in,,.T mn. 3 AO t ., 1 e, 0. o " 4o(_13____Ej_' 12 4,0 t0 4 A f; 0 4
141,30b 2.'2gi 1 4 419 0s .,t 2 0 711
14 310 9 L. s / t . . 0, 3. .
07']3 " . - In ,l /,oV o '-",
.~~~~~~ f4:0 u" ,( 197 f,0_#J 0. ¢n7RZ.,.,g
444.' L, -n 0 0. 3q
* 9. 4 Ls,() ,2 I fq o. ---
Iu 3 1l [. 13 . 0 3 3 . ,'M .l V,( rp V7 -. b -f 1. L; I;' o. 437 41..,'o1-3f) 41 i]c.b 7,,4,1A 1.e n. I. 42 0.. 2 F.,,, ,,
2 0 11 l, .. '2 a< o _. I. 2- 8.go 05- OO .
9 I:;I I I Inilll
1U1 1. 04J 2 ~~ Q. 43 r'wN
IiL ~ ~ ~ 2 a 1.~ CT Q. 4o7 -______Il-t qrZpn IILl 1~l. An aL A2oL 0.962
-3 .n, 19. crln 9 ;54 77 107-7 0.#6 . ,-.-1 f ;Q -r.. & . _
q2 0 5c,- 5_%
129 *%\
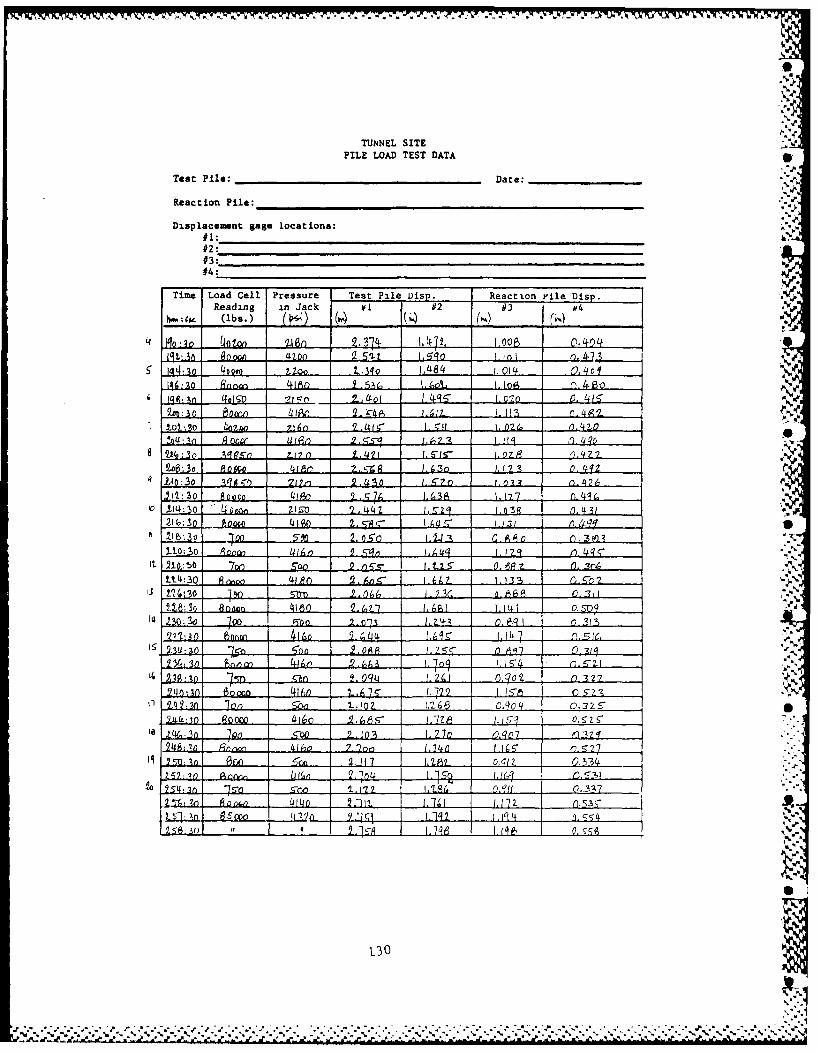
TUNNEL SITE
PILE LOAD TEST DATA
Test Pile: ________________ _____ Date:__________
Reaction Pile:____________________________ ______
Displacemnt gage locations:
#2:7#3:#4:
Time Load Cell Pressure Test Pile Visp. Reaction v'ile Disp.Reading in Jack if1#2 #3 #4
13t:3A eno I o . a si I4 I s. 1. 0 41g -1 i4.:a 7 zo 1,484 1,014 . If~0
1441-1 RnLom.. 211 9f -5(, L L .O 1.IC n 4!~ 6,
94:Lo AD" 4IIAO 2. .7& ~ 1.1-112 L. 4 $9
8 oj 40-n 7-6 911419" 1 . 4..Z1 .07 61o42,0'
10 14;3 so U om zlr - 4 R3
51b30 - 4Q*** 570 2.-, ... 2.. 11.0a.... 30)192.10; 30 Ano 14 1 (, o~ ~ 9 47q 1g4 1,7 o,4?
ttL:30 A ____1_R____1_A7__._32__
U8130i Ando 4180 2.Q& (,, 7- 11,4 0. sz)
1' Injl -U 00CT 0- - 2 .7 .1 .v+I(, r. -3211
15 9,03 :10Q 0 A2 & 13 0, 7 0 A, .1'Y, 2~3to nc _ _~ ~.0 zLU .;n ,54 .
'4 11 5 Cn 2.0q4 . J1. 2 C o. Oz '32?
1 ,3 eQ 416cl L.2. As-2L.Zt . J __5q___._5 _
'8 2 tV -.32n 1) o -- 0 2 . iL0L 3L 1.2o oNo .z246su Rnao 4ho 2 o 1,411 16s 52
130
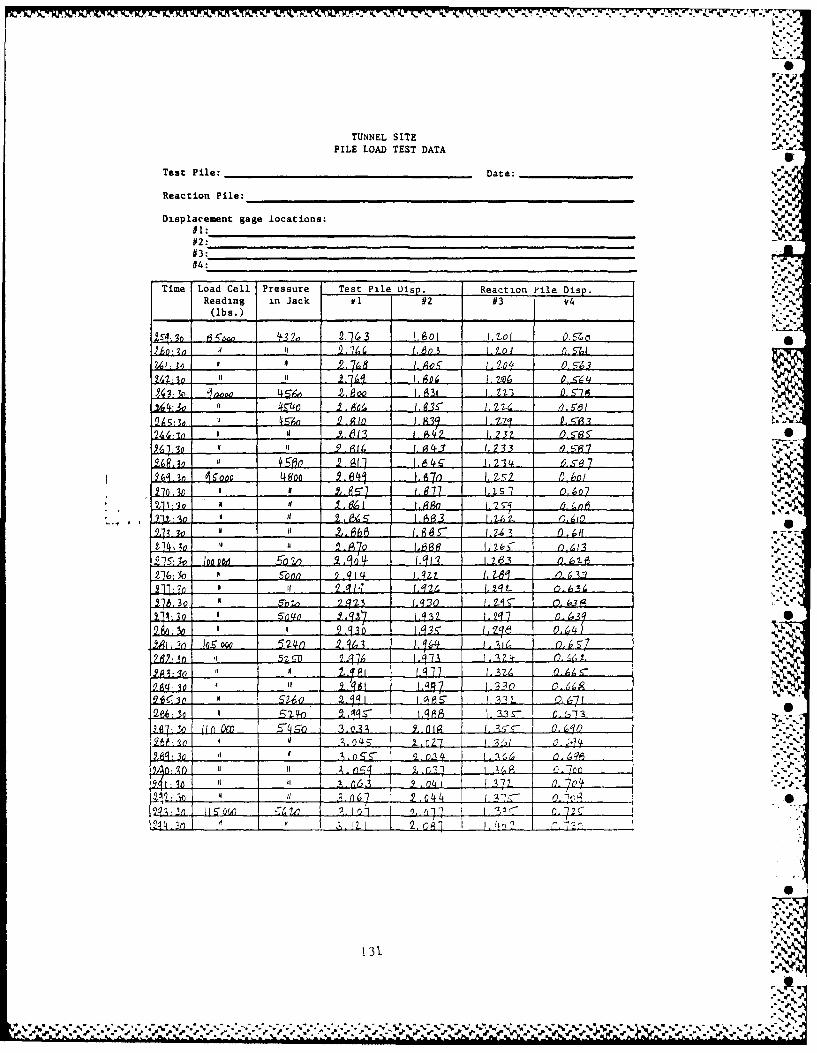
TUNNEL SITE
PILE LOAD TEST DATA
Test Pile: Date: _ _,"__ _
Reaction Pile: ____
Displacement gage locations:
#1:#2:#3:#4:
Time Load Cell Pressure Test Pile Disp. Reaction File Disp.Reading in Jack if1#2 #3 v(lbs.)
15i.~ F 214 . 901~ 11010 Z(O. g, ;f .. leo 6 .6.3 0.1. E I2 o:XI- A19 q 9.. 9&,1..0o4 6. 5z-
_ _ so , ______. OW I , 10 (. 10, S. S
__________ ,I .. L.. I . h z z 3 .- J- i2ASg U. 4 -,i. 9w a~ . -Aq177 .--
2/66 -in Y,. 61"7 1,677 1.J.7 J D. o.g 7
* 24LiL N i-oo .L. I.4 A.. IZ ' .3 ,.
24i, __ __0_ .9 .f34. A 4- t. 7 33e. 5-,q
169h .0 1 . . 1.A (, .112,3 r) ,01_l I AO 1 1.
216: 50 70 CAL 1~. aZ 0,2
27:3o w l 10 o 5-n6 o . . 3 .1, q3 . 2-5 - O.,o -6--"A54"o 144L .q 2 1. 2 6
A ,-?l86 O 24) q 3 1. 1& 1 L , oL7
A : D "II ',4}€ h - .! r. e . .0.64 r
] . ~ ~~ 1s , n 7 2. o-1t 4 1(, q--6.7o
•4, t .. , 7
131
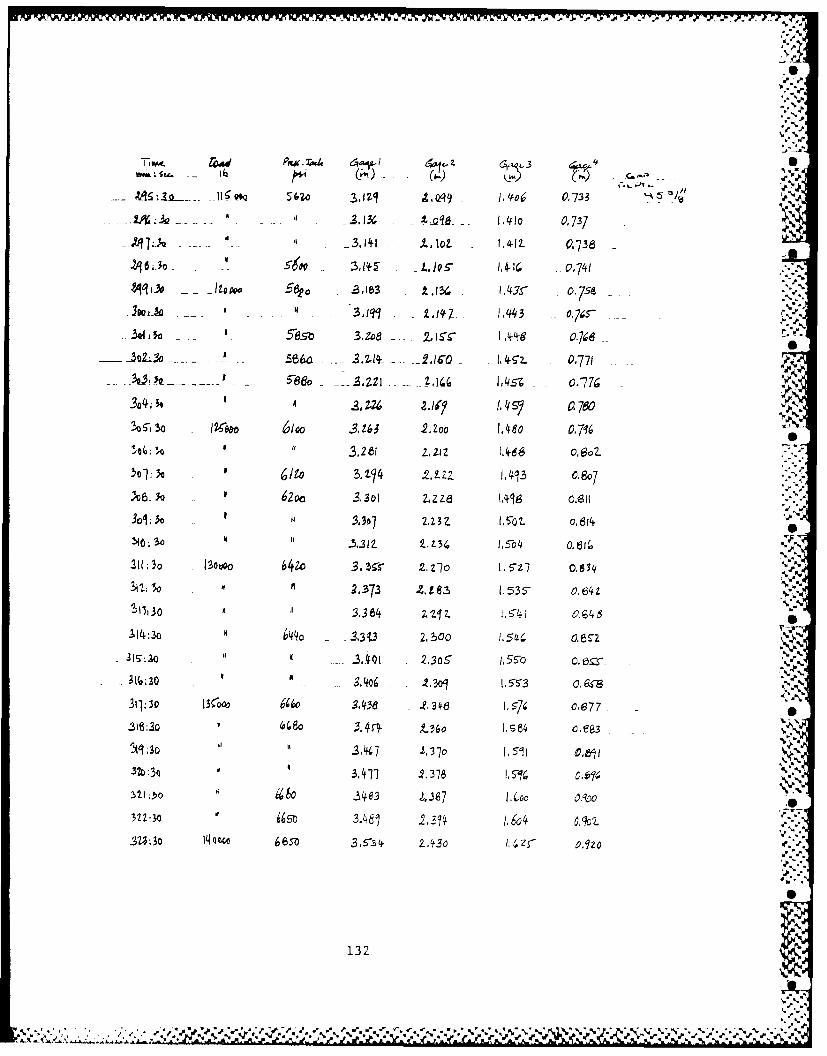
I roa P" .- -- - - n. -AA -4j .1 10
1.~~ ~ a.' 1. o6 0,
1,I410 0,737%- A u3.141 ±. lL 1,417- (9,736 -
4vo 6 e .,e 0,741
3,-l I ' 1.03 0,45
586 .*S,21~~2.~O 145'2. 0,771
5M..Z1 2.1(7 I4SZ o-776-.5
So3. o 10 J 2,200 1, Wd 0,716
6eJ o 3,114 z 1,413 O.8o7~8. 200 .301o zlzza 19
2-373 Z. 183 1.535- ez 5
I 13o 3 3 22. 541Co4
31:o.3-401 2,30, 1,S3%;:30 A a,0 0, g 15
3q1:30 13rco 666 - 2348I5 0,877 -
!32D: 3o 34y ,38
32Z:3 ~5O3.411~ .2,378 15%O.o
Su ~30 Z. 48D35q .30 o z 0.9zo
132
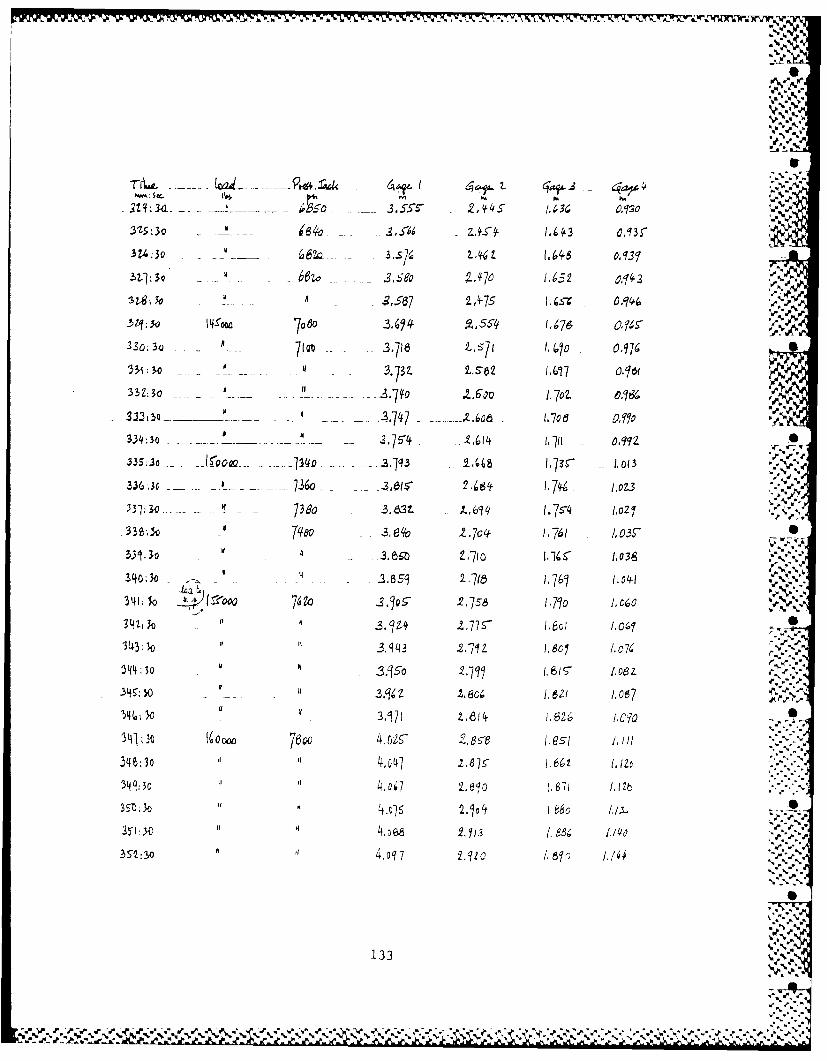
23a Z; -5 6.5S 76 045
70000 A7C /5
33; 0 1 6378 2Ji71 o q34 oo 7,0o 3. 562 1617
331 !30 1 .3. , .672 0-16ry(
- _____ --. 747 - Oo708 f
S34:3 -4 -7/1O~-l
- 3-631- 1, 61I 1.7 - 1,02Z
_____~~S 6~a~ i~O ~ .q3 t.0 1,761 I.0
sqO; -0 - - .- w 2.715 1.76 1.041
-- - 736 3.6q3 2.. l.7s04 /.o7.
-4 6:30 A' 04] 2. 2.8 1,6 2 , ,2
34 : 5 tb 4,2 00~Q 2,76 1.71 /.016
sD R) 2.77 t.o q.C I g
3t31O3mt 2. 713 1.964 1.4051:~~~-. so4 q. .l
Y{4i0 - .~~33~o .. w~[6
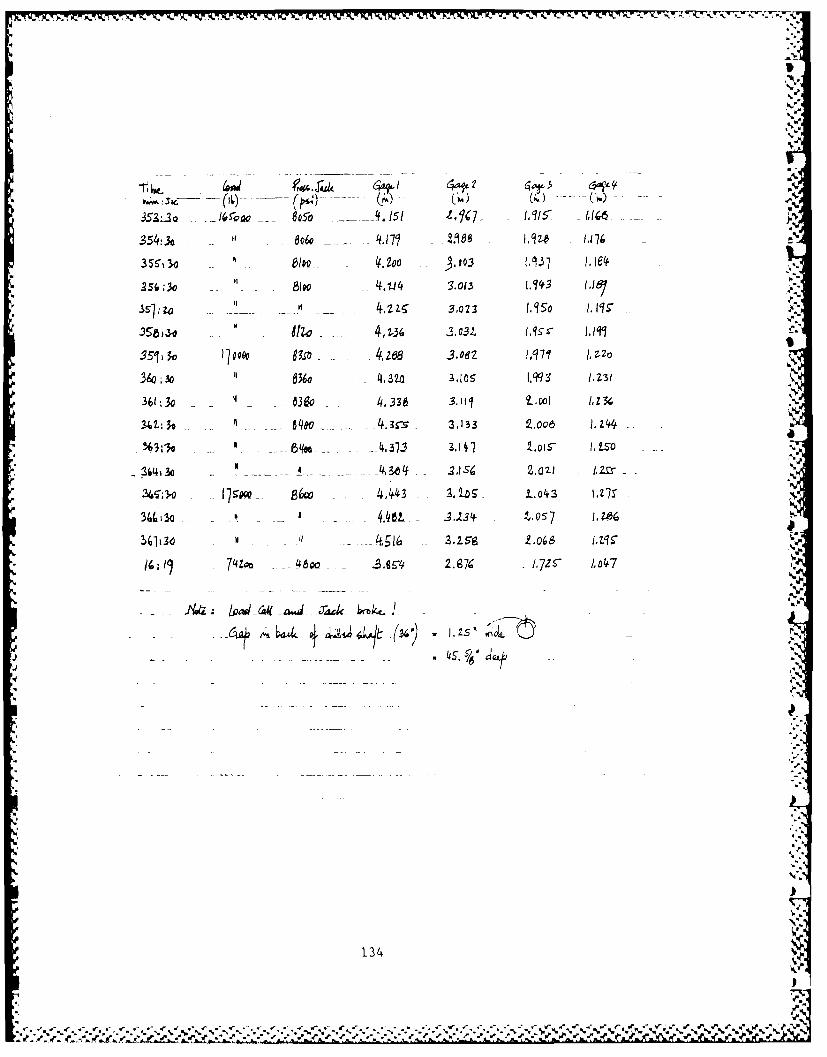
3 S3~2 I4Si~a 8$~ 'ff~I ,Y671 - - 1,9( d
354!k A -. 6 1.9Z6 1,1~>~ i76
- 8 eo - 414 3.013 1.1't3 (.187
-57 4,z- - - 5. 31023 050~ 1. 19S5
351 1; 1 o . 4,2tea 3.O8Z 071 1,7,20
360 i30 36 4,320 3.0 .99q3 12Z31
36L13O .3o4.338 3.II 111 0ol 123/.
No 2.: 5 3,133 9-006 1.244
3a ilk 4. 373 &,,oIZS.5 1. E-50 -4
2413 44 - .1 5 2.021 L~ 21r
345,m I7~ 4,143 2. 1bg . 3 l.z77y
3443o - - 4.46L J ),.3~ .. S
~1i3 17 74 Zp 46 2.974 1,729a4
74Zlo ( 4 o lru J".75 /.
134.
- - - - .. ,-*- - - - - - - - - - )4 V .
d, %
% . e %
e
.0
APPENDIX B %e
CORRECTED PMT CURVES .
-.-
% %
i~~liT.. -.
,..- ,,,44 ."135 '" '
.- . " .,"t4~4 , ~4 E4. *-p~'.4 ' ~..'. S. ~* * ** 4~ .~ **:.4..--.-*. d ,4.? * -4 .+ - .4' ? * 4 5%4. :4 V * . . N " * *. ,9% .4 * *.-. p5. -. 45-, ".'-- *

30 ' ' ' ' ! ' ' ' ' * , '
BOREHOLE DEPTH a
Dl 2'25
DRIVEN CPMT
X 20
LU
Lnw 15
Chi
LU
S 15
0,
10 5 10-- .....
/ S
0 5 10 15 20 25..'.::
INCREASE IN RAOIUS / INITIAL RADIUS k%)
,.-6
136

30 1 , I 5, I , , , J , , I J I , I' J , , , I,,'
m, ,Aft,%
.so'
BOREHOLE DEPTH
Dl 5125
DRIVEN PMT -'
w 20--"
2i). / -
Lii
LI)w, 15 /
n-/
u
n ..- F.
a:100u
5 4512
INCREASE IN RADIUS /INITIAL RADIUS M7.
13!'7 ..
•~ -F,1O - --
F,
mm "%F.,
137 -.F',% ' ,'

'p
. :.
BOREHOLE DEPTH
Dl 9' ""-
25 - -DRIVEN PMT
cLS
,,--
., 20
(n
w 15 .
"-0w
w -
w 10 _
//"5 /
00 5 10 15 20 25
INCREASE IN RADIUS / INITIAL RADIUS (M)
138
f • *' X - * "U- *j l'U i~U~ U % | ........ ''
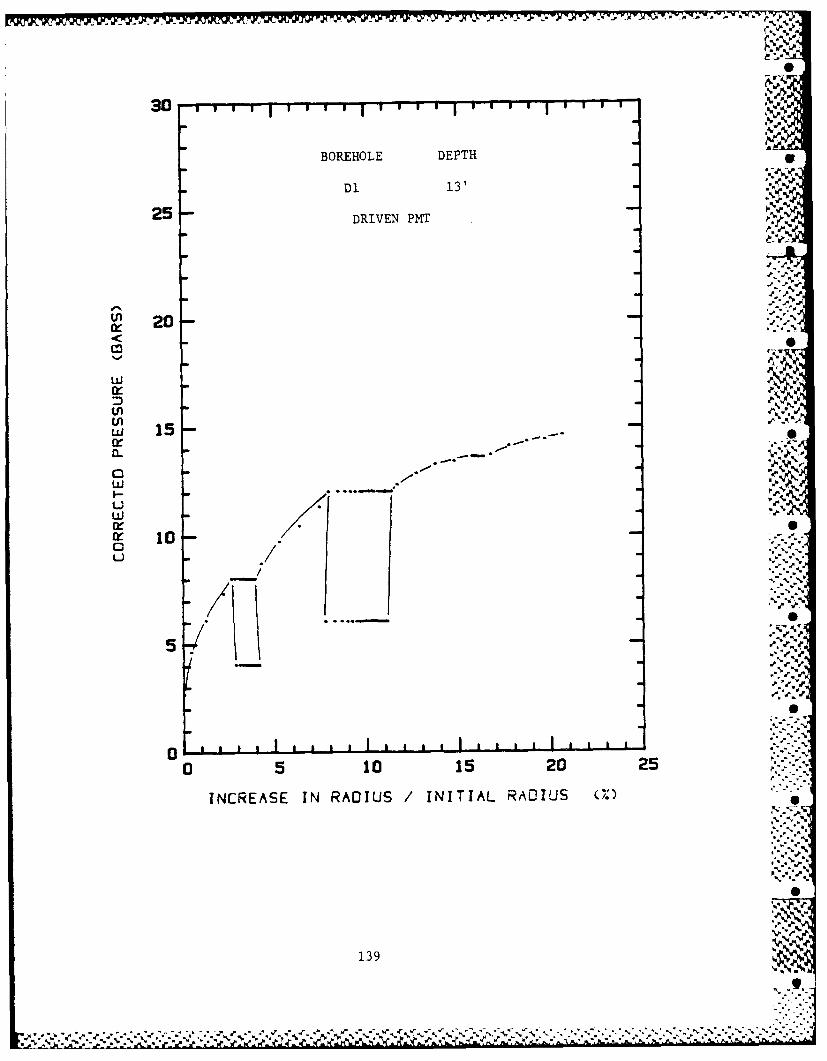
30030 "" ' 'to'I ' i , , , I ' ,
BOREHOLE DEPTH
-Dl 13'
25 DRIVEN PMT
Ln0
-20A
w 15
cc 15 .--
0 5 10 15 20 25,-
INCREASE IN RAOIUS /INITIAL RADIUS ),----"
9'.
139 p
w, .
-., .".,"v ", .""""'""",.- , .."i -+', -" '..',.',..-.- ",..:¢ .Z.,.,,-.',10,,-..,",-.-'''-'''' .- ' '' S' '- ' '..-.--.

BOREHOLE DEPTH
Dl 17' " S* Z
25- "DRIVEN PMT
.-. V
Lfl 20 -
<0
,U-
w 15
w
re 10C / Sc
5)2
0 5 10 15 20 25
INCREASE IN RADIUS / INITIAL RADIUS (%)
-400
0
I
140 -S. "S. - -
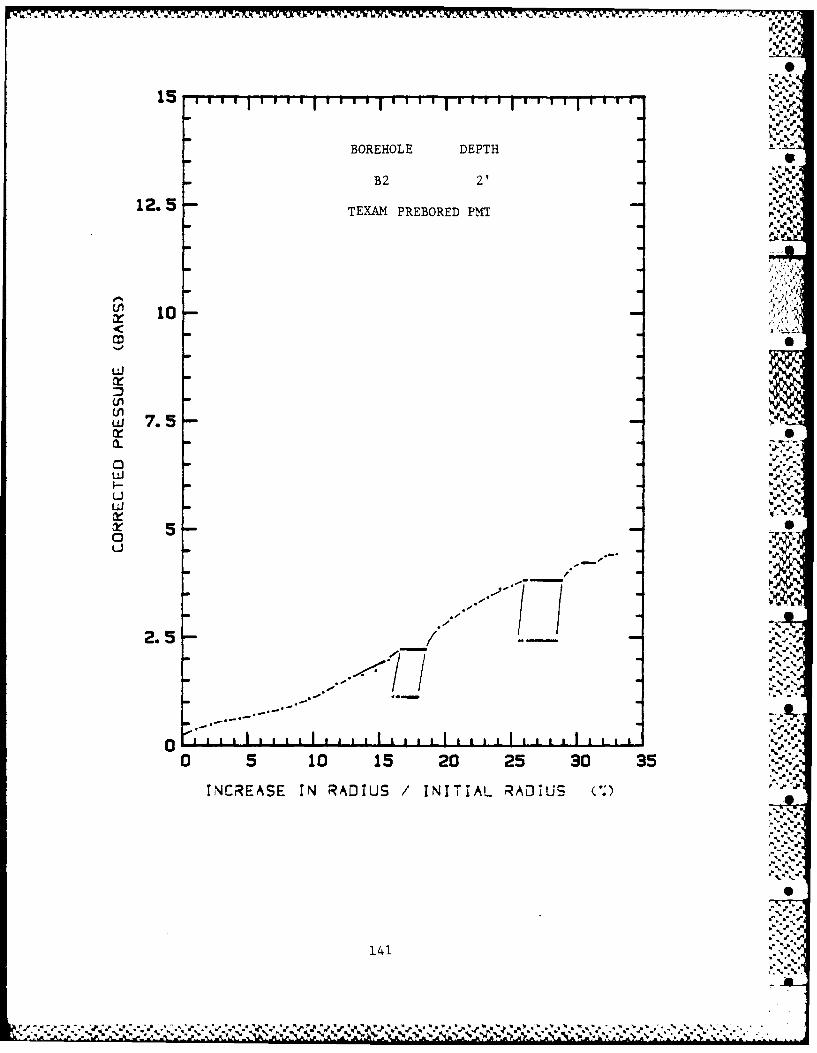
15
BOREHOLE DEPTH
B2 2' . .
125 "TEXAM PREBORED PMT
S10-
SJ,
w 7.5-xS
CL-
I .,- ,,.
2.5
2 I I ' LI II
0 5 10 15 20 25 30 35
INCREASE IN RADIUS /INITIAL RADIUS ~
14.
w~v,%,,-.--., ". ",,,-,, ,,.-.-';.,. .,,z.. .. , ".2 .. " "r "," , '"?'r "r%.,, ",. ". '% ",' "" "' " %,' -, "' " '. "
-" '
"" " '" " .- %" " J -".'w ' -. -. '
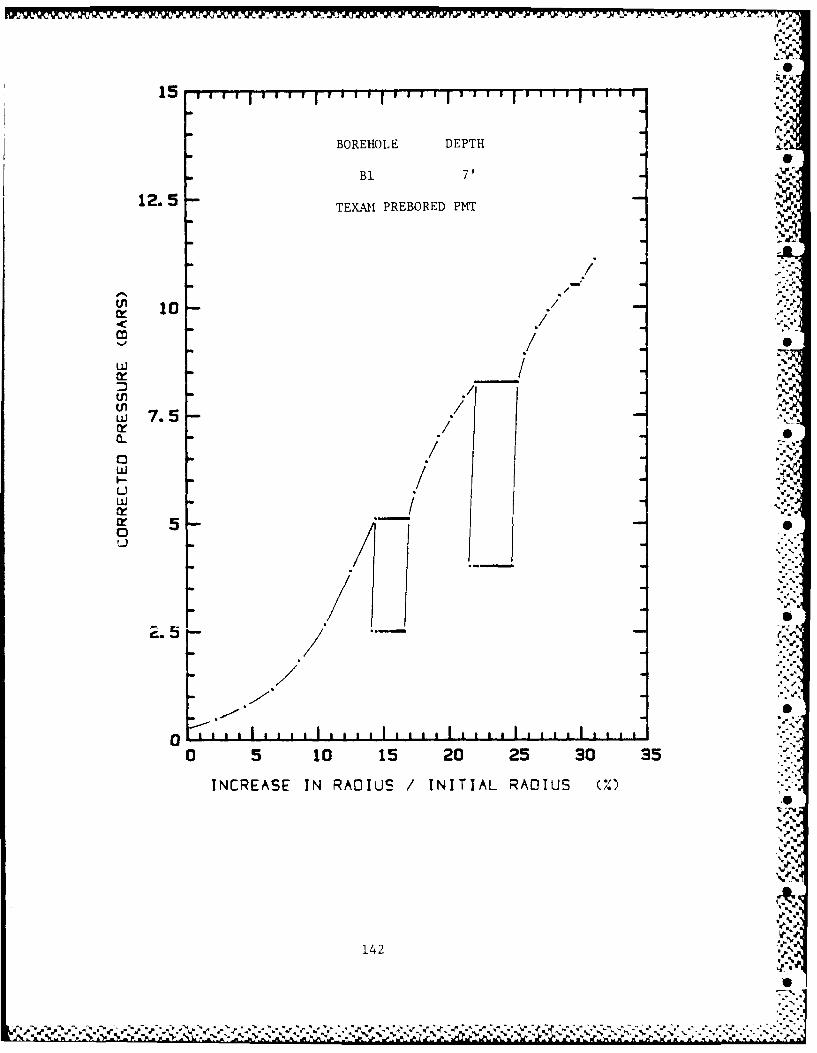
.0
BOREHOLE DEPTH
BI 7'
12. 5 TEXAM PREBORED PMT
--,= /
//
Ln,, 7.5 ,j.
CL / S e.0I
Lu
LLI
(il /
00
5
5 I0 5 1
5 // ;.;
0 SO 1 2 5 3 3 .-
INCREASE IN RADIUS_ INITIAL RADIUS 0/0"-.,
-7w
1
,.5
(. '. . . .. . . . . . . . . . . . . . . ... ... : .:-
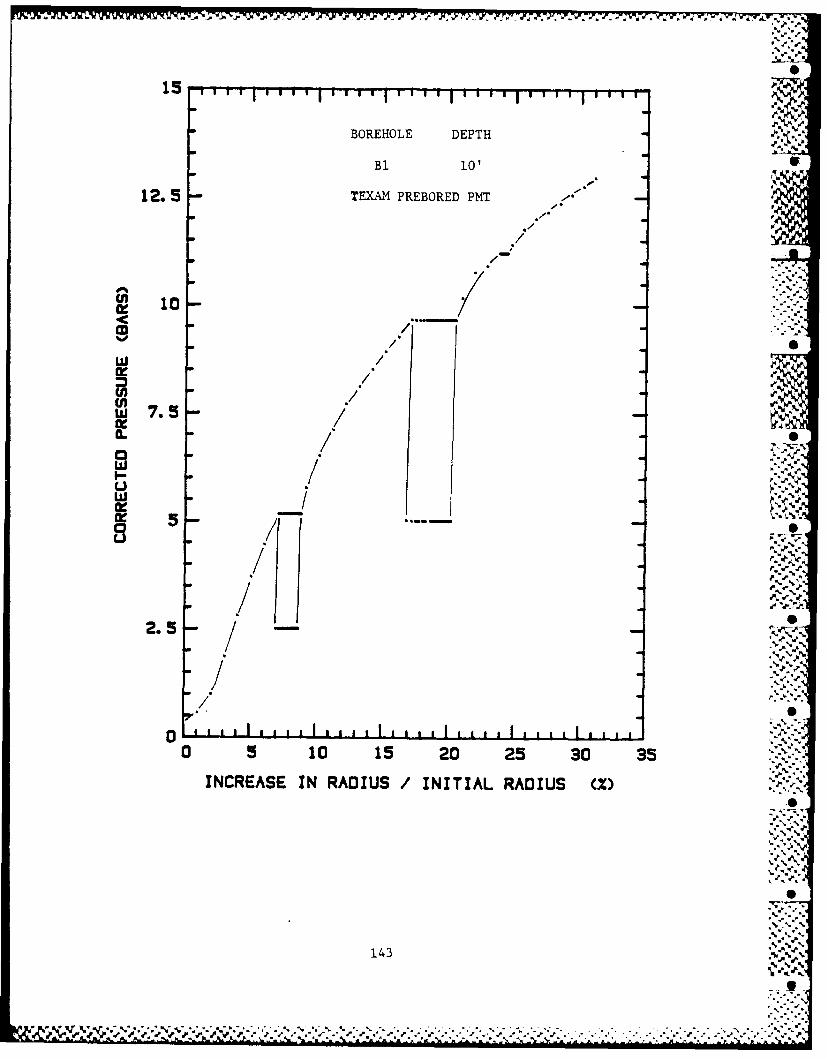
BOREHOLE DEPTH
Bi 10' a
12. 5 TEXAN PREBORED PMT .'
100 5 1 15 0 25 30 /
INRES IN RAIS IIILRDU
/143
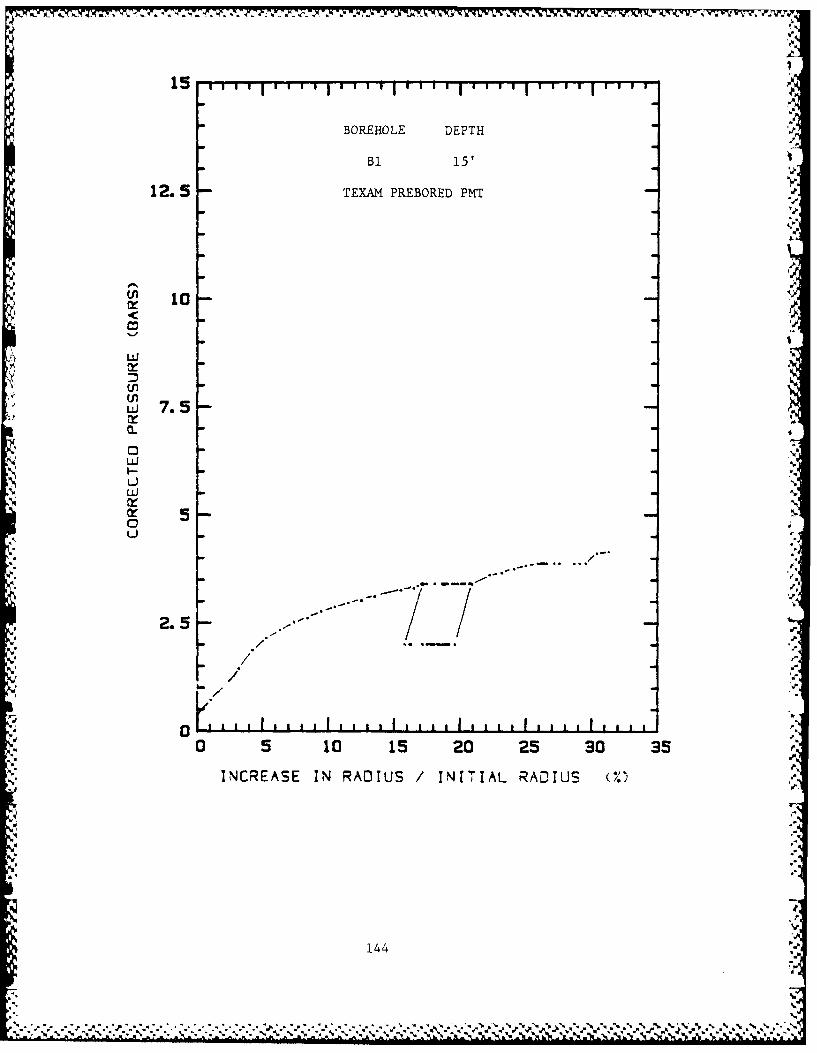
BOREHOLE DEPTH
BI 15'
12. 5 TEXAM PREBORED PMT
i0-
Lu
LU
Li 7.5a.
Lii ..
I-
ujj
5
2..
//
I I l 1 L..1 1 1 1 1
0 5 10 15 20 25 so 35 '
INCREASE IN RADIUS IINITIAL RADIUS 7,"
144*"4
N .

'
BOREHOLE DEPTH
Ri 30' l
12. 5 TEXAM PREBORED PMT
'U
LU
,, 7.5
I- .I- :.- .'q
2.5 ..//.. I,-/ . . .. ii. ,
0 5 10 15 20 25 so 35""
INCREA SE IN RADIUS /INITIAL RADIUS 0", ".";.
I%.v
145'-n '
,., II JA...
.' ~ , , J -, ' " '. .w .W'% ' ,' ' W % ,Z '. " N ' " ,"%0 5. , .. ." , ' % 1 0.5"2 2 5%" . ,3".." ,0." . ' 3 5 - % . •% - % " ,," .. . " . , " " . - % " ,
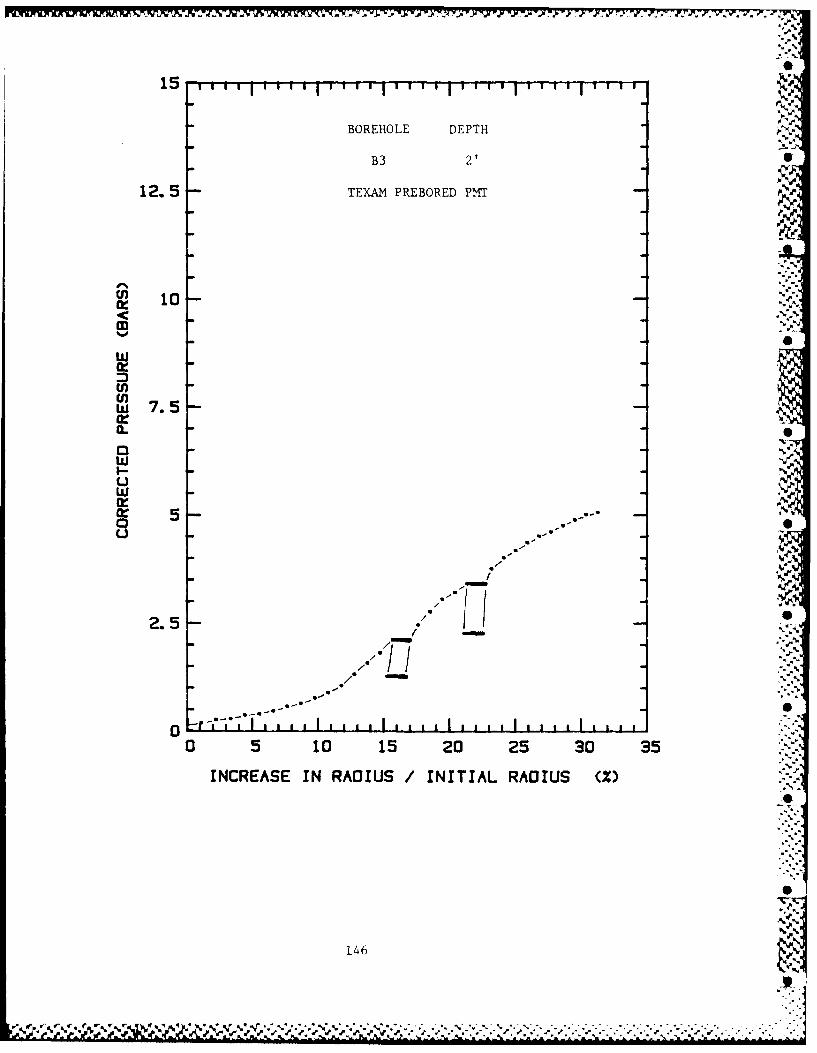
.IWA
BOREHOLE DEPTH
B3 2'
12. 5 TEXAM PREBORED PMT N
inS 10
7.5
mS
wck:.
w 7.5a-
w
w
/
. " i, 'S ,
a: 5
I % IC2.5.
0 -r I , I I I I I I I I I I I t , I I I
0 5 10 15 20 25 30 35
INCREASE IN RADIUS / INITIAL RADIUS (X)
10
* ..A..
F, •"
146:
.i i i l i l l i i ll I mlliii iil ll ... ... ... .1
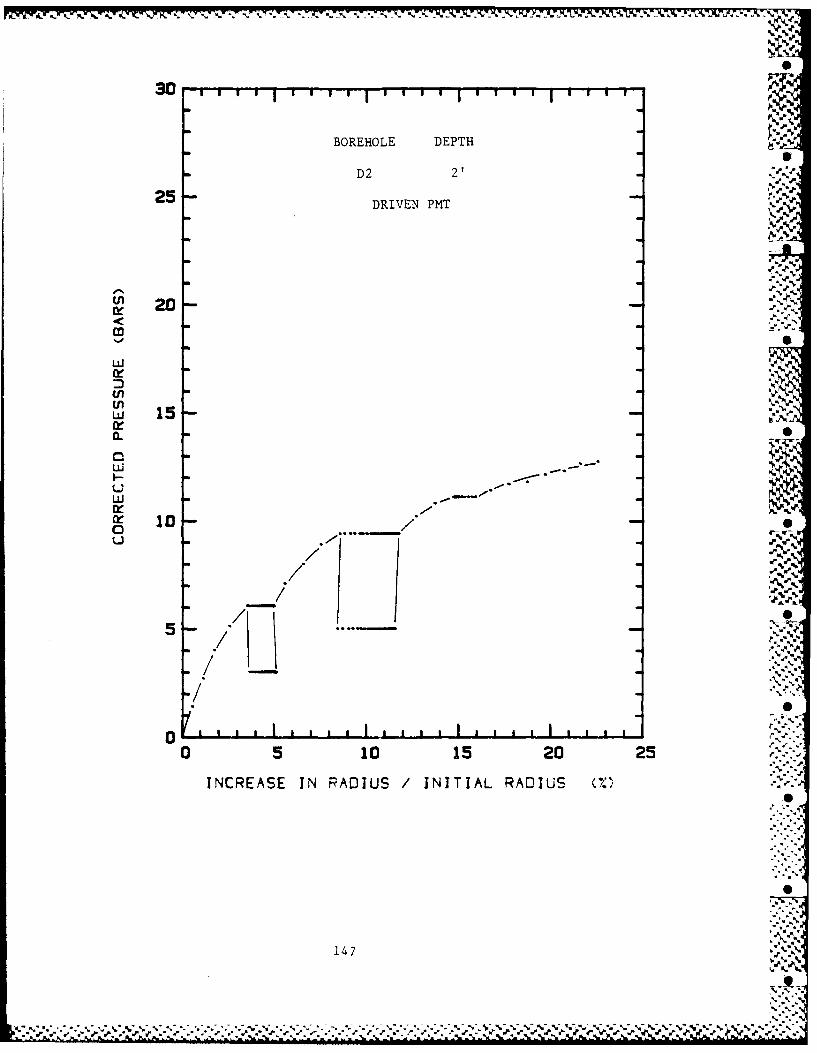
BOREHOLE DEPTH
D2 2' ,'
25-DRIVEN PMT
Of 20-
0- -re
0
105 / .
/ Sq'%
o , S , , .. a , , I , ,a I , , a , I a a , a " '-0 5 10 15 20 25 ,.--.
INCREASE IN RADIUS / INITIAL RADIUS (%
147
-- - .- ,**Pj..~: ~ - -%% %' - -

N--
NA.%
N1 4 8
S -
-' .'%''."%"". % -. •" " , '- - ,o,",,,"W " '." .. ,,'.", '.._ " , " .-,..-. "',"".' '4"" " ."",, "" .""-""- " '- - % ""-- '' ..'" ' " -4'- " , . .,. 5%
. '
-,, ., . , , , , , .- ., . . . . . ", ., . .
:j-AA
op
IX"
+°i+ 'I.
APPENDIX C
CYCLIC DEGRADATION OF THE
PMT SECANT SHEAR MODULUS
140
,.'. -
'-'.'."4
5'."
_. - +, , -,,,,.= =rita+,l~rl,,r i, i l~l-= h dkrdbllb'I='l =llkll l l ,l~ll ++".. . . . ... .. . , . . . . . . ..
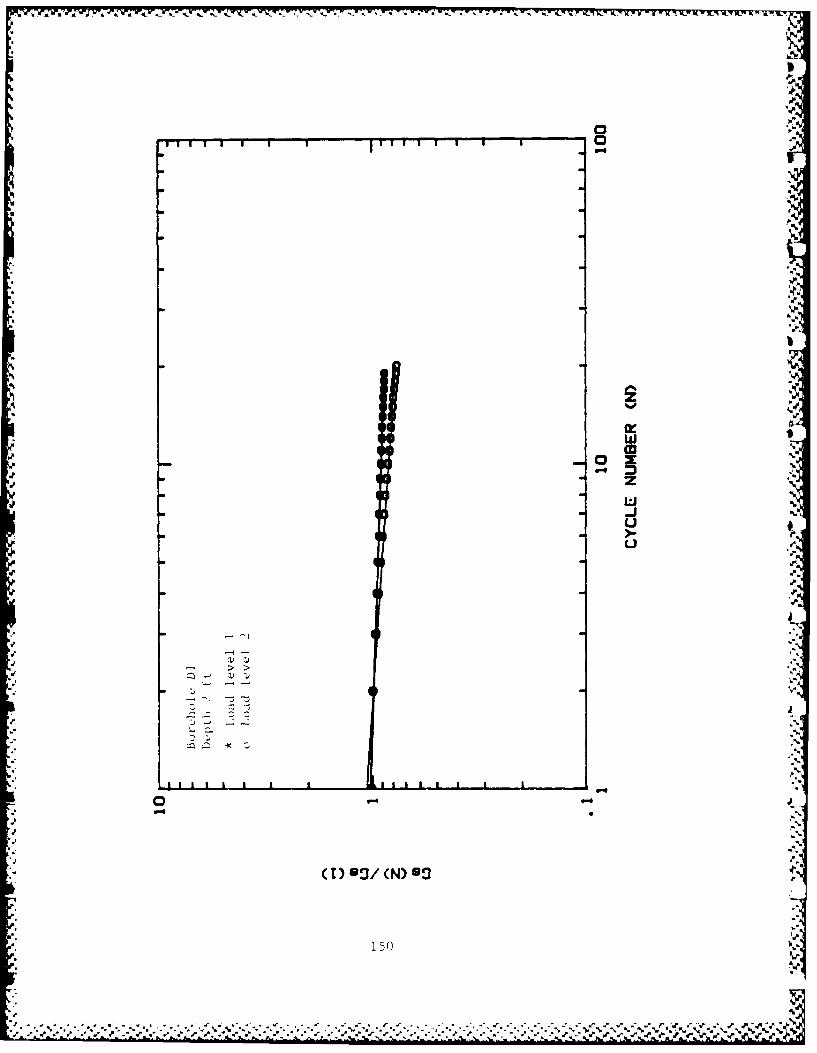
oli 1 4 lollu I I I 1 0
1
*a.
" i
w0
1501
% e
(-) -
,
'.
'-, -[ -/N)s ,.
d}
,,-',
-', 150-'a"
a'
• ." "-. ""." . "-'- --".---.'-'--- '-'- ." "-. -'-,- .- '-',,'-.,-.,- "." '-,'-,--.., .- ".'-"- "o', " .,'-'-> -" -. -'-.'-'--,-">.-,"'a.
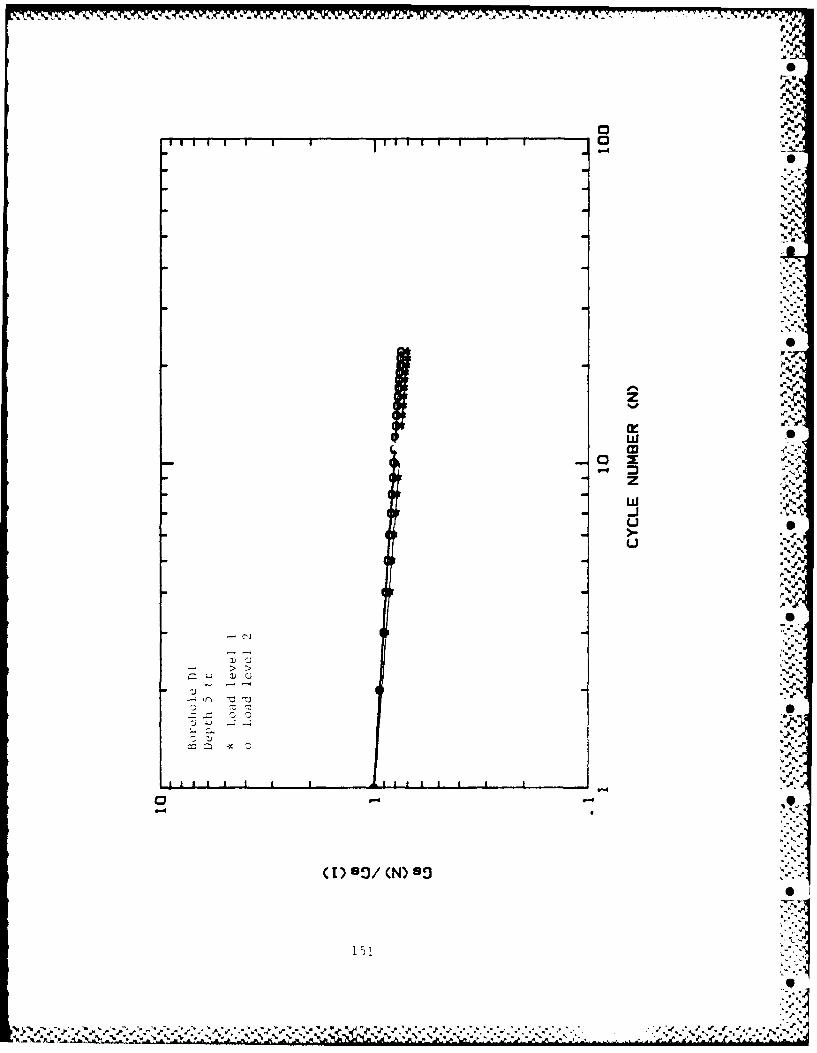
I'" -llI
- - :.:
%./*-B
,-, B•
..,.*:
-. r
([) ~l/() s '- 'S
• " . ', -,w"",/ .,..," .,.;.,-" -*'- ."'"+ " '€".""..' ,." ." "," . ,€ .. " ,,''-''.""-''." -" ." -" -" ,-'"-'".''."".""." + . " """ " ", " " '"'"B-
I
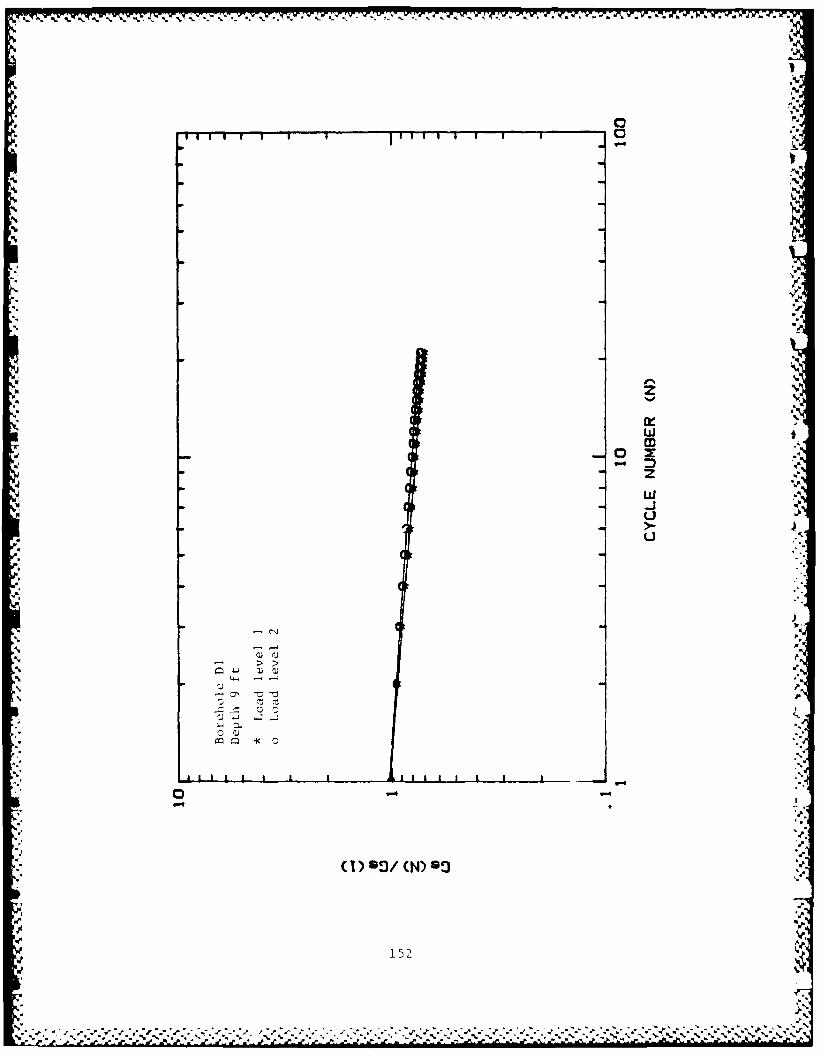
%)
I A
iP
A
C,_______________________________________________________________ A
,gI I I I Ijill I I I
' 1 A'
4 "C-A- LJ,
A- > "-
,AM
(T) 3/() og',
w $
,.
%, . , . • . . % % . % % "C I.. , . , 4 , . %. .i
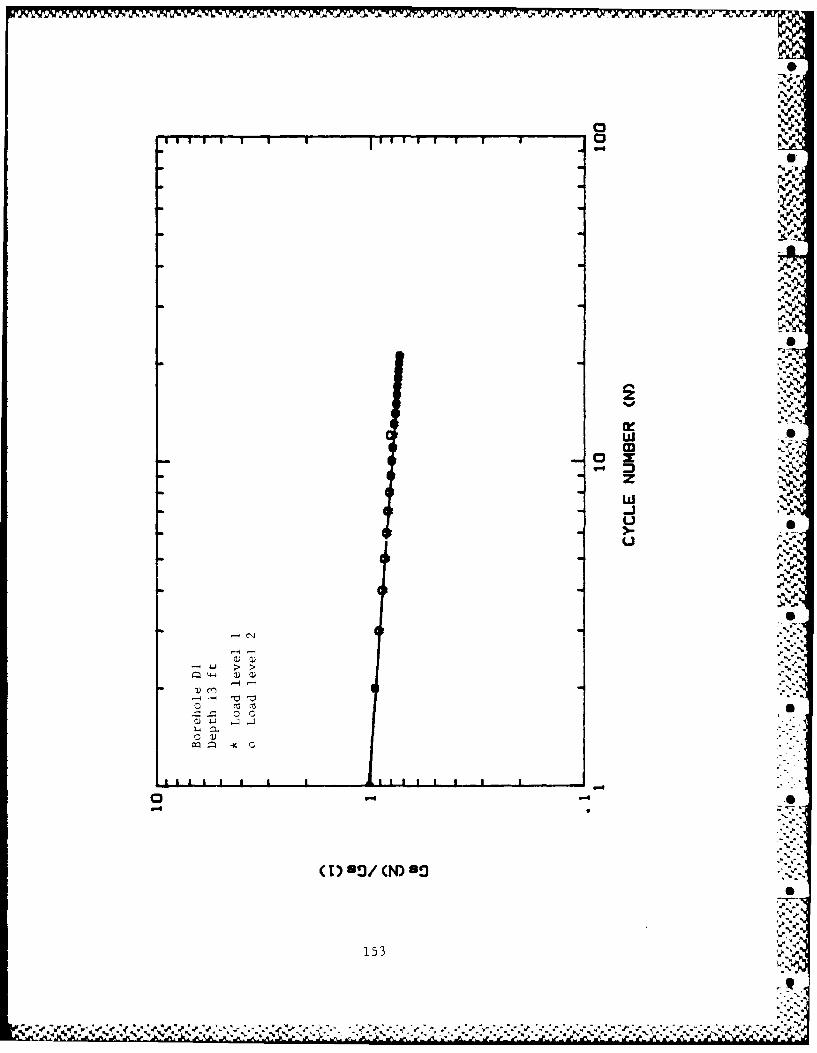
-4
*w*w
z
4-J >->cni
LL)
(1) GO (N) 9
153_
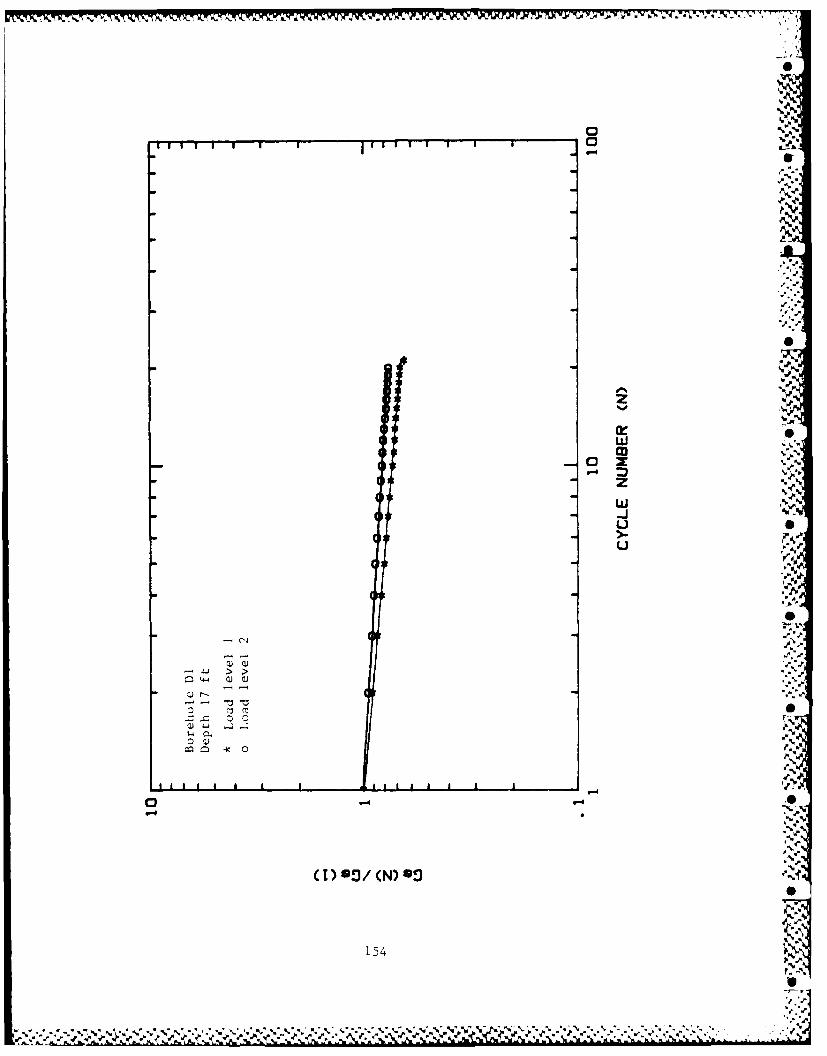
09 1 1 I I I 1 li i I I
0* .
mS
zw
*ai
w) a.
0I
-4.
,
154 'N...-
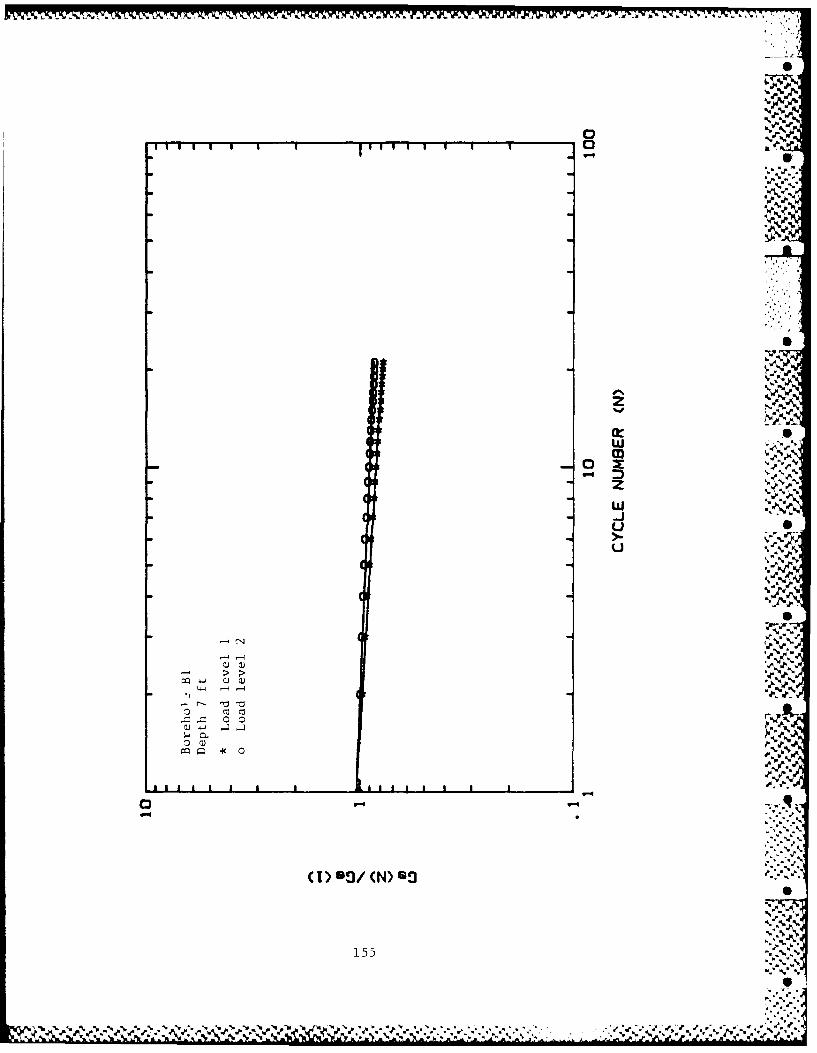
O b.O
:A.K K - , .J
-0
1 1 I I , m m i l I I I I a-.
%
w
-"o r
( ) m l(N) m
155 •.,-
."- %2m
W." ".- '_ , " ' ' " , , " " , .' " " -" i e . ' " " ..% e -.# '2 i c .-" . ' T , ; P 3 , L "". , ' " " , ' , ' .'2 " .. .€ ' .' . . " ' . '. " , .-" . " " ,

. , ,., ,,, , .. -. .,
.,. ., - " ,"; ... . " - .l ,, ,,...,, ,, - ,, , ,, v ,,,.-. 7 . , ,,.*, ..,. . ,.. .
,,,"%
I I ! !
0
,"-'4. . '. ,
--.. 4.
w S
,,.4-.,,.4% .
LIj
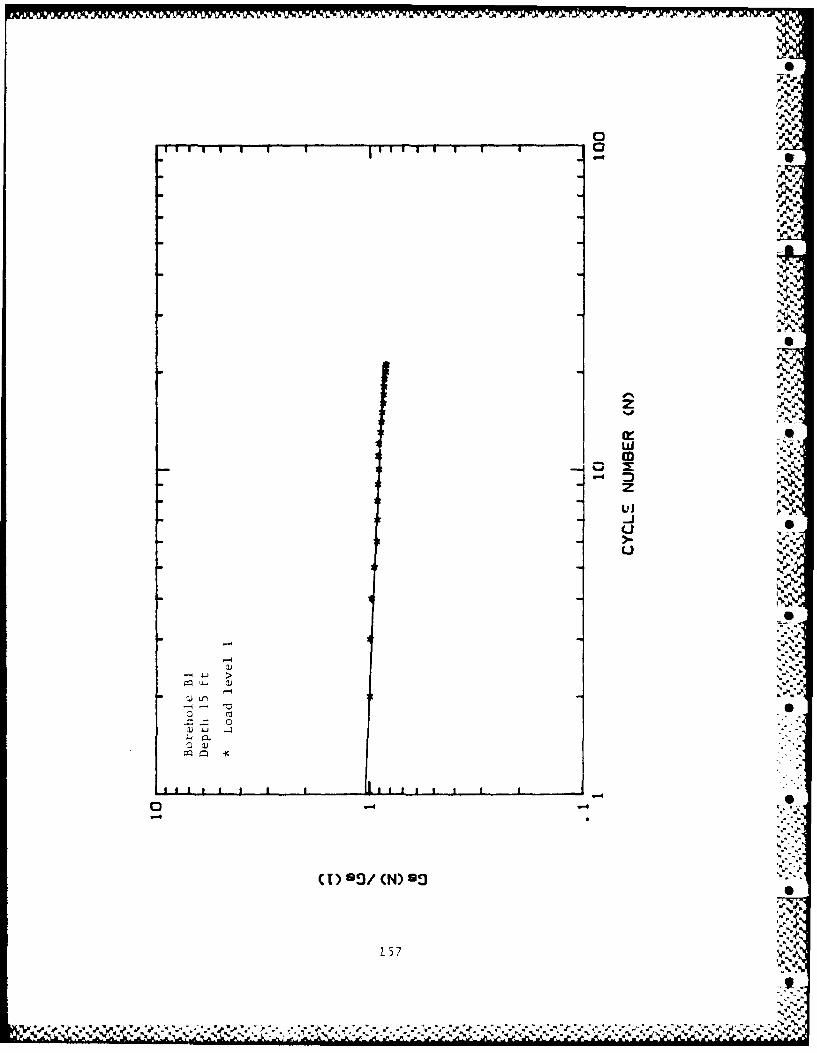
-P %
00
4.j.
rz -z
0.
157
'-t*
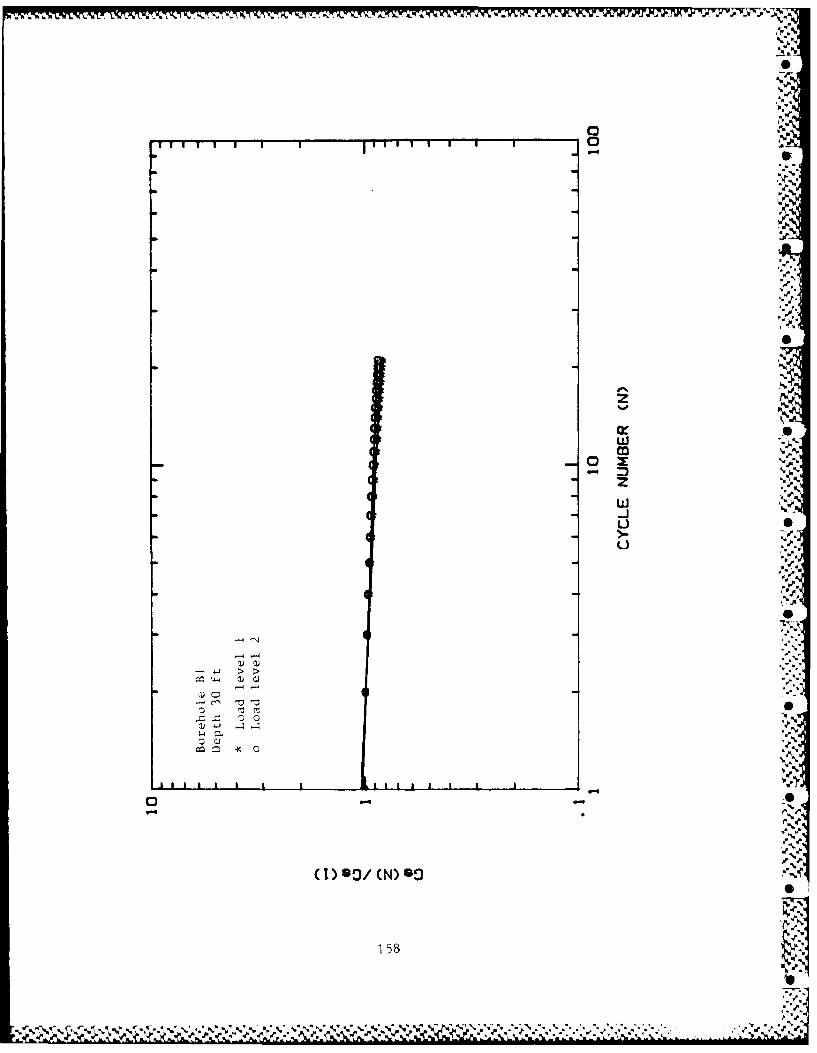
k. - - A. ~ - -- -a
0
o" 0
-
-jg
-' '
O •
LJ Q ',,
W.-J_.-,
0 '-a - -
-4-] I I it I I ! IL , I
'V'%
(tl)8 o CN) m O -'.
~~e58
1 5 8 ,/ ,,,
• ,."." .'',,' '*,,. ,,."-. ..', -r.• V ,.' .",,.""," .' '". %"v;"..' ''.',, .%.,,.., , . ' 6 ",',," .', - , Q' . '"-",,"/".' 2 '.- '- •.'. ,'"._V,-V'
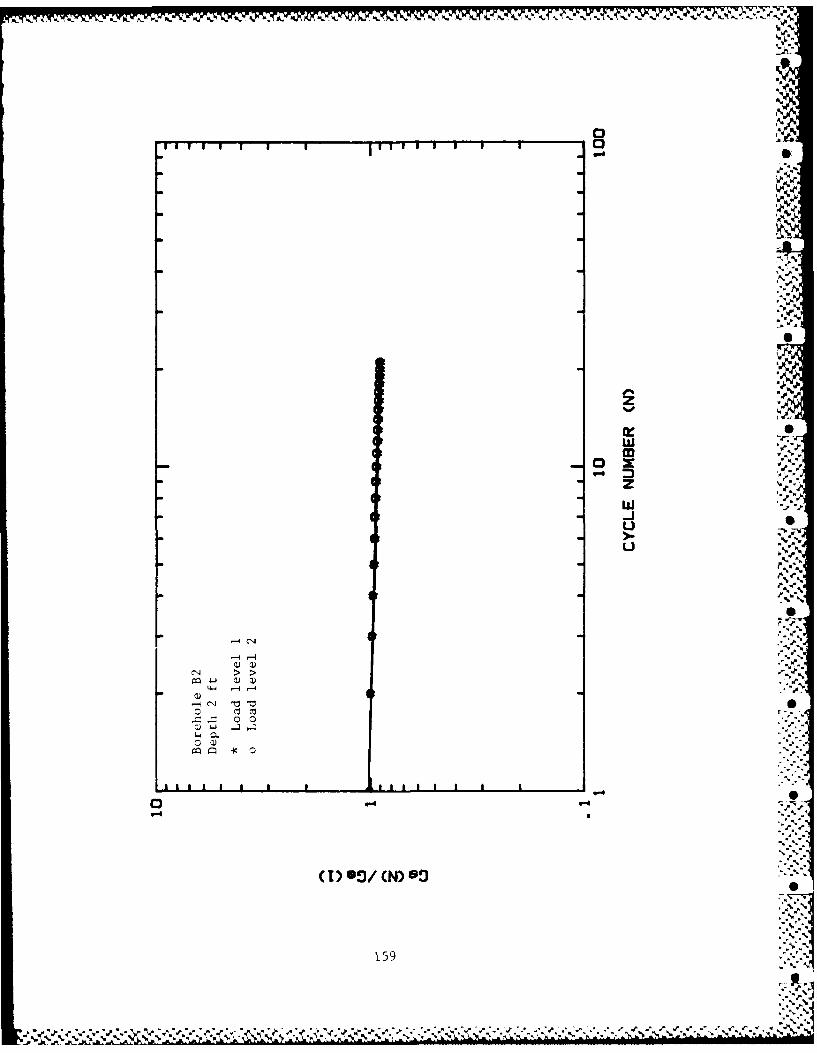
_ _ _ _ _ _ _ _ _ _ _ _ _ _ _ _ _ _ _ _ _ _ _ _ _ _
0
w
>) >
V ca
PQ 9= -KV
(1 O ()0
CNJ :~-:. 159

w ~ 0
z
w
0 0
0 Q2ccJ cl '
-PI
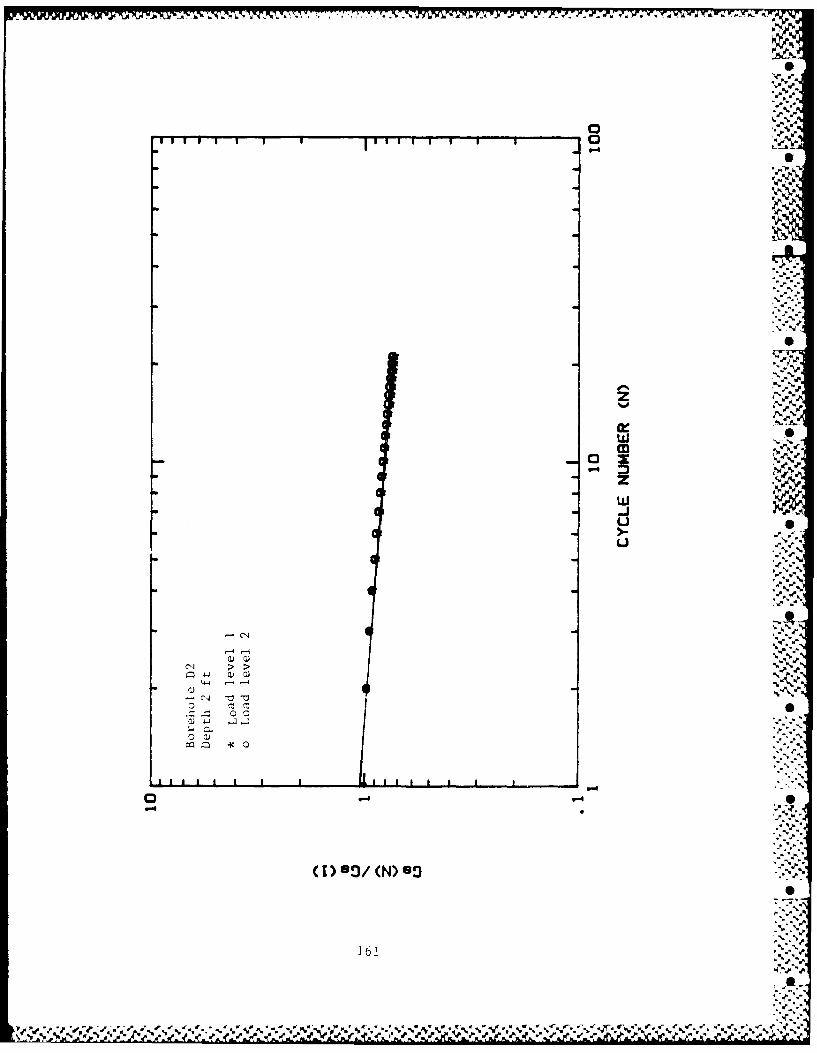
- - .. Ak '. l.* -A .C - - - - - - - - -
"'' ' ' ' ' ' I'' ' ' . ,
-v,%
•.,, .
", -. "
-. . :.:....
"o- ,V °
-
Z-...
161 ".,.-. ,
*:: .*,:
! " " " " v . _ "/ "" .. . "/ " " " " ".'."": - "__" ", ." ; "'" "_" i " .7 ''_"_ . . . '4

"% Ir
O
l.o
,%
--
:-p
oS ,
S.,
5,
% " " ", '% % . % % .. % . . ., .*'.t* '% %'-. " % -, % %"%."%"..' -%'. '% %'' P., t
APPENDIX D
CYCLIC DEGRADATION OF THE
PMT CYCLIC SHEAR MODULUS S
163
an I
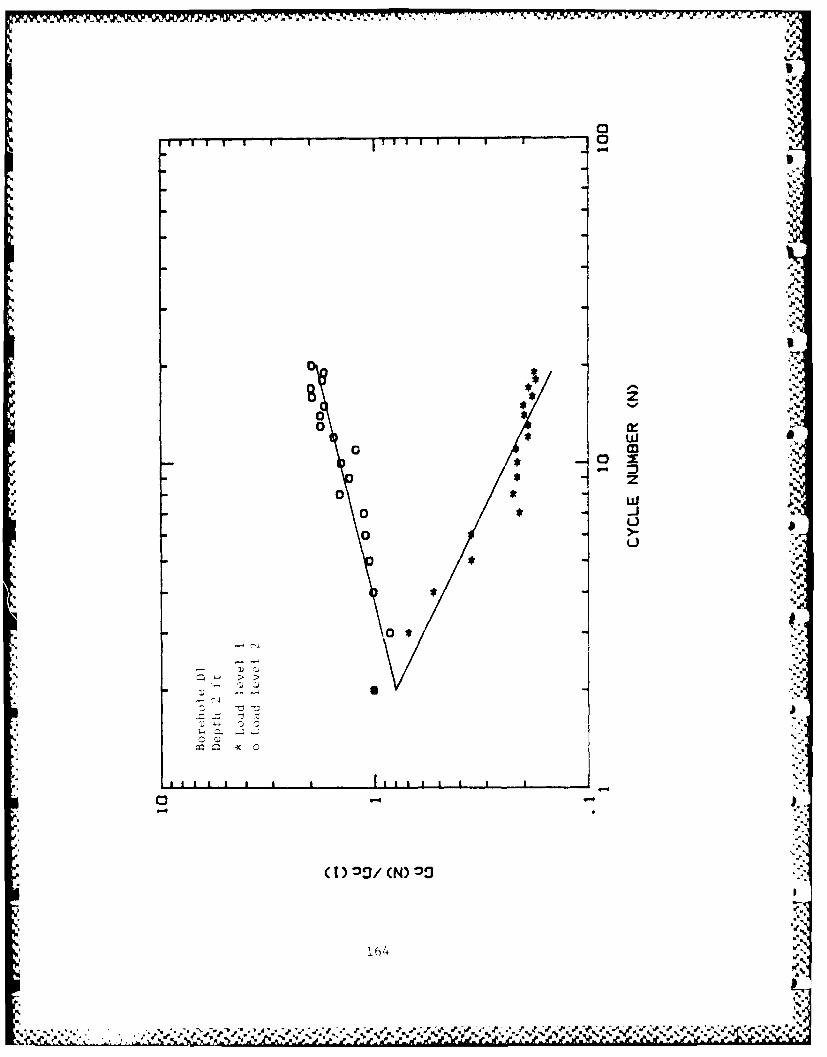
vAAv~wol. 797L br - -'- - -W
0V
00
0 5-
0 -1
0 >w
0
SF0 S
00
00LA%
*~ %5
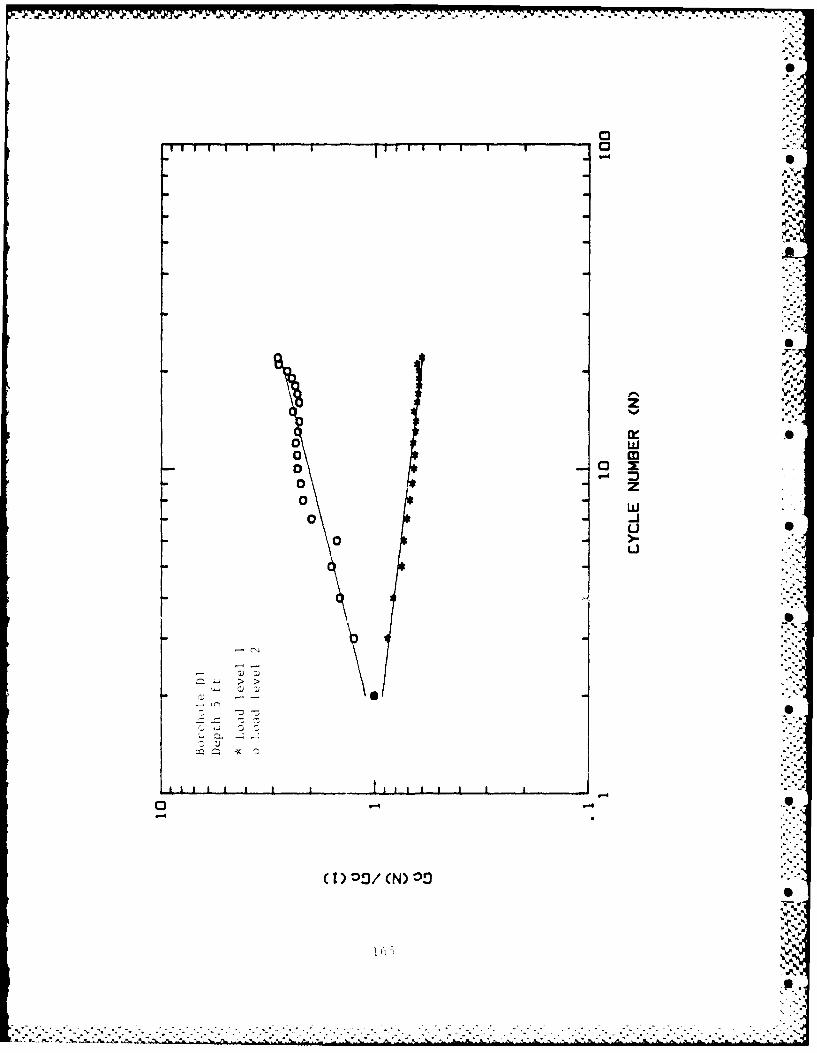
S
I 0
I C S.~. -,~-
Js-
'4'-Mw
S
,1'*
z'S
C wooa - ~
0 w0 -3
(-30
Li
r 1J 6/
- ~ .~
slam a . a
0 - 2
S
AVV...
V
p

- - s -
.p
Sil I I Ilii I I '"I
- Z
0 *,
* ..
-q-
-aw
a -00
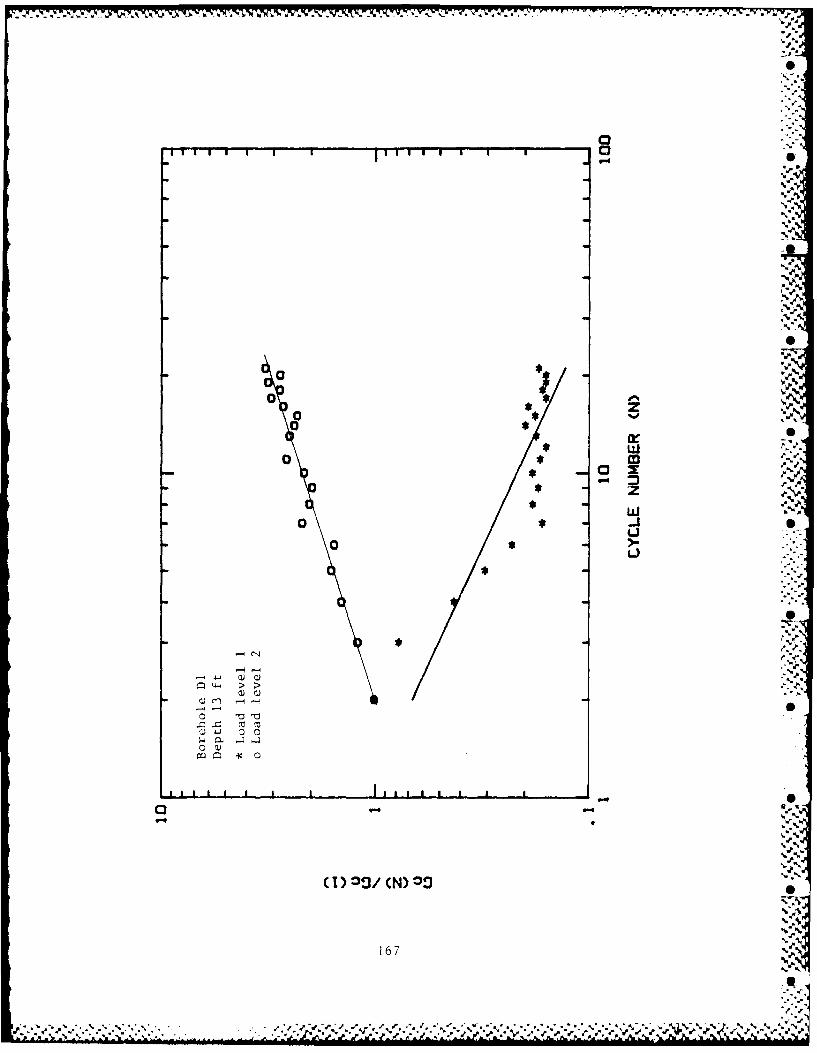
,, , , , , , " ' ' ' ' ' c
00
,5.-..
0) ,., .'.
5-S
0 -J
uS
5,.-. -.
o >
o * S
CD ..-,?!,
16 t% S,
-%
* z US
1 -
"'a'

V e
00
C3 -
16
z*V .w
_ o x UpU,.
O- ; -*1
-0 -I$
("-3*, U -4
I I i i 1 i I I I ,-
'U
a6
a * - •
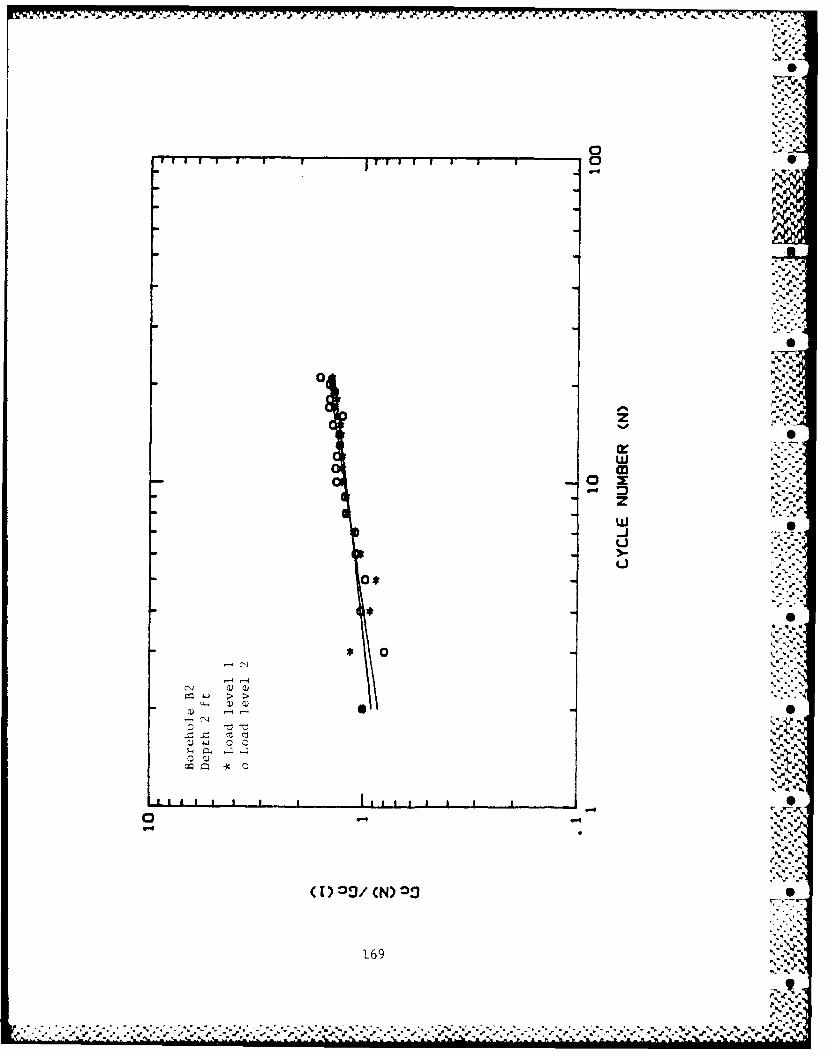
V. '
' ".-'
A I , U I I I I l l l i U I I I0 0
0-
• -, .", -.- ,
zS
w~
oca
zS
w
00
0-
> >
4z -x
16 9
U"'",'" -, . . ' " - n " t m " " ' " / .. .. .. i " . .. . . .I . . . . "'0* ' '

*~ * . * ~ ~ -- - I. V
a) 0 0
Liii L'. '
(1)03(N~n
170Q
........ - V
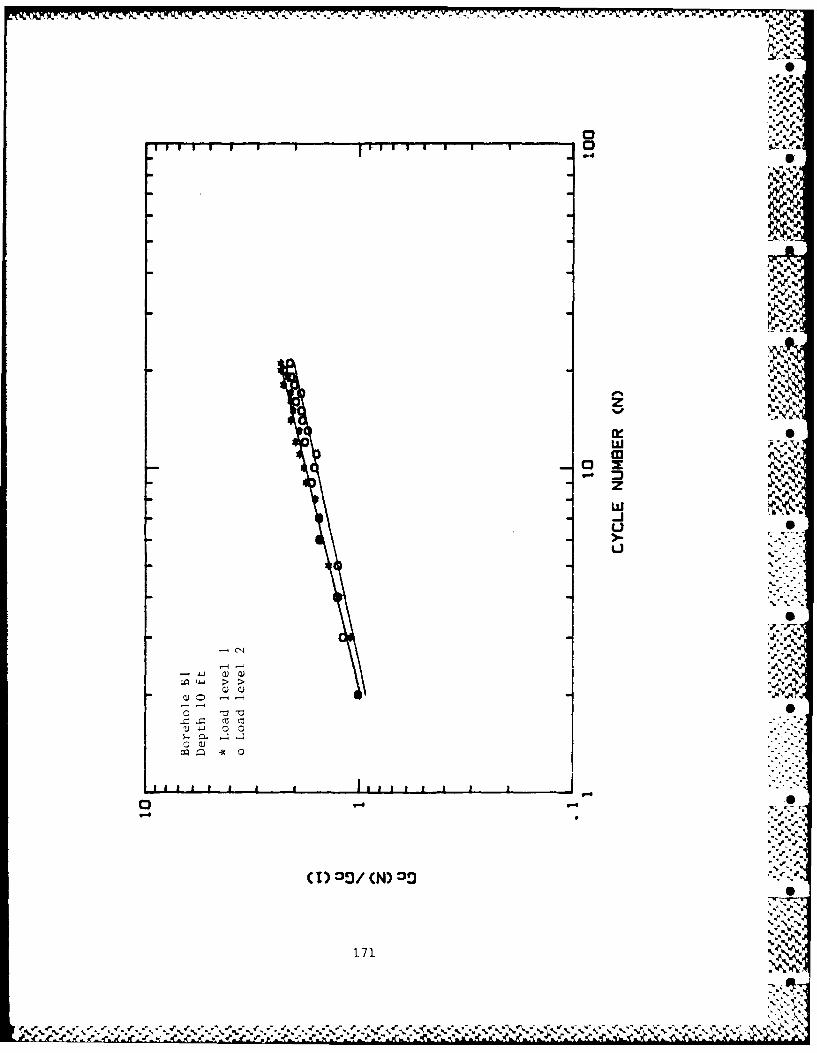
___ ___ ___ ___ ___ ___ _% d0
'.V4
le N
> >
4..j 0
WW 9-4
17101w

- -- A A .4 F . --- . - . . ~ d.~~~d t~eJt. 4 ..
_ _ _ _ _ _ _ _ _ _ _ _ _ _ o ~
.):.'.:
O-
* 4 .: S
* --S )" ". -
U S !
*72°''"
• °
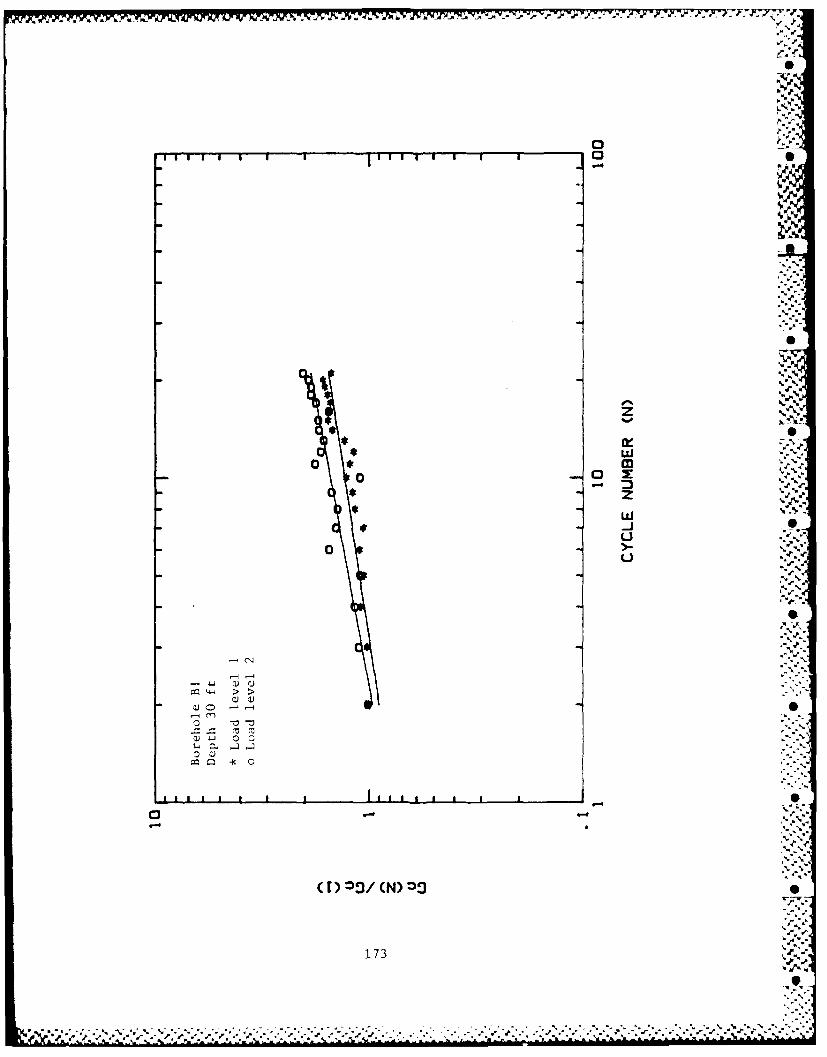
- .i - - - ~ - ~ -..---- ~ -. ~-- -. ,. - -p-.-- - -., J%~
~ .4~
S
.- 4*
*1.~ ~ -_________________________ 0liii I I I I jill. I I I I 0
- ;4q1
V
S
IZ A
* 0** w
0 *o 0 ~
* -
* z v*q....w* S
Uo
LI
0
- e~J
-~ ~4-~4.J ~J~J~ ~, >w~ ~ So -o-oW~-J 00
0.0~)
~ -~ 0
S-4
0 - ~. .. ~.
,1*
173~.
9

;-.....
*~m
551
U •
. -( " .. 5 , .o• .. .*;.
- , .,.".
.5, , L
oo
07 '% '
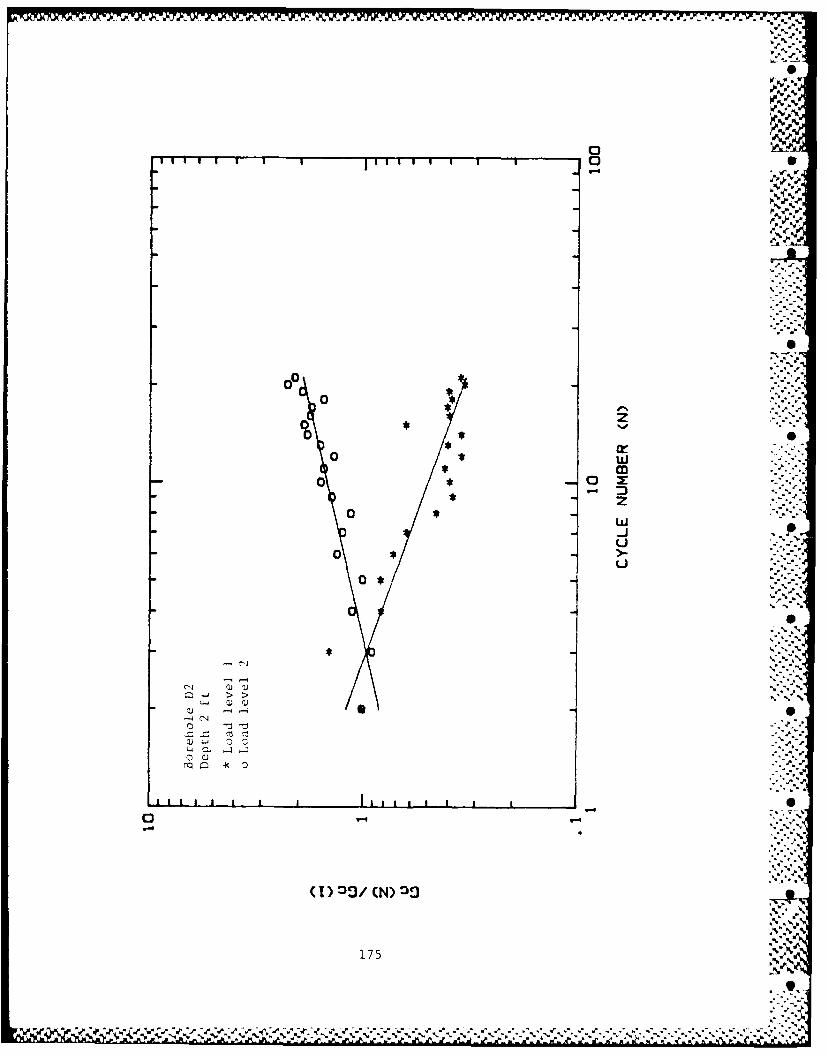
0- .
.1r-w
cr~
0 w/_ _ _ _ _ _ _ _ _ _ _ _ _ _ _ _ _ _ _ _ _ _ _ _ _ _ _ _ _ _ _ _ _ _ _ _ _ _C
>- >
4S
0
0
175