full-scale testing of sheathed cold-formed steel wall stud ... · pdf file1 full-scale testing...
TRANSCRIPT

1
Full-scale testing of sheathed cold-formed steel wall stud systems in axial compression
Vieira Jr., L. C. M1.; Schafer, B.W2.
Abstract
A series of twelve full-scale walls, cold-formed steel studs with different sheathing configurations, were tested under axial compression. This study concentrated on the impact of different types of sheathing being attached to the side of the wall, specifically bare (no sheathing), oriented strand board (OSB) or Gypsum (Gyp). Wall sheathing combinations for the two sides of the wall consisting of Bare-Bare, OSB-Bare, Gyp-Gyp, OSB-Gyp and OSB-OSB were all tested. Results revealed that the attachment of boards to the side of the wall can increase the axial strength of the wall by as much as 91%, for example, when comparing the case of Bare-Bare to that of OSB-OSB. However detrimental results were also observed, specifically the OSB-Bare walls had no post-buckling reserve as they failed in a dramatic flexural-torsional mode. In walls with symmetric sheathing (OSB-OSB and Gyp-Gyp), the observed failure mode of the stud was local buckling, and exhibited deformations essentially identical for the two sheathing types. However, for the case with asymmetric sheathing (OSB-Gyp) local buckling failure modes as well as other failure modes were observed in the studs.
1 Graduate Research Assistant, Department of Civil Engineering, Johns Hopkins University, Baltimore, MD, USA 2 Associate Professor and Chair, Department of Civil Engineering, Johns Hopkins University, Baltimore, MD, USA

2
1 Introduction
This paper provides a summary of recently completed experimental results, designed to provides insight on the axial behavior of sheathed cold-formed steel stud walls. The tests were completed in a new experimental apparatus designed for testing walls under multiple loading actions. The testing rig and control were developed as a part of this experimental program. A series of tests on cold-formed steel walls, with different sheathing configurations, tested in axial compression were completed. The walls are composed of a cold-formed steel frame fastened to sheathing. The sheathing is OSB, plywood and/or Gypsum and plays an important structural role in bracing the cold-formed steel studs. The walls were designed based on current design practice.
2 Background
Winter’s (1960) research into bracing systems for cold-formed steel structures, was the first to formalize the increase of stud capacity due to its connection to sheathing. In 1962 the AISI design code incorporated Winter’s design method, which focused on flexural buckling of the studs, and a companion experimental method for determining the lateral restraint stiffness of the connector and sheathing. Winter’s (1960) method required a check on the strength and rigidity of the connection, and details such as the maximum space between fasteners. The method covered only studs connected to both sides and with the same material on both sides. The requirements, even though rational, include arbitrary checks, such as considering the buckling length equal to twice the fastener spacing (known as the “2a” assumption) and only apply to flexural buckling.
Based on a significant amount of work examining sheathing as a shear diaphragm Simaan and Peköz (1976) developed a design method focusing on shear deformations in sheathing. The method was used from 1980 to 2004 by the AISI specification, and considers the contribution provided by the board shear stiffness to the flexural, torsional, or torsional-flexural buckling mode. The shear diaphragm action is translated to the stud via fasteners. The ability of fasteners in traditional materials to provide bracing support in the assumed manner

3
has been difficult to quantify or verify. As discussed in Schafer et al. (2008) “The abandonment of the method by AISI in 2004 was justified practically and theoretically”.
AISI (2007) defines a design methodology based essentially on Winter (1960) and therefore AISI (1962) and employs an unbraced length of 2 times the fastener spacing (the 2a assumption) as its key parameter. The method does not provide a design approach for asymmetric sheathing, nor does it explicitly consider the stiffness or strength of the fastener or sheathing material attached to the sides.
3 Multi-axis structural testing rig
The tests reported here were conducted in a new multi-axis structural testing rig (dubbed the Big Blue Baby, or BBB). The BBB has seven hydraulic actuators (50kips/actuator). The actuators concomitantly move a “cruciform” load beam, which is attached to the top of the specimen. The bottom of the specimen is fixed to a steel beam, which is connected to the floor. Four actuators are responsible for moving the load beam vertically, a fifth actuator can translate the beam horizontally applying a shear force to the wall, and the final two actuators are provided for lateral stability.
4 Cold-formed steel wall studs
4.1 Design
The studs used in the test are 362S162-68’s (50 ksi) (SSMA/ASTM nomenclature) throughout. Two types of sheathing are employed: OSB (7/16 in., rated 24/16, exposure 1) and Gypsum (½ in. Sheetrock). Number 6 screws (Simpson #6 x 1 5/8’’) were used to connect to the Gypsum boards and number 8 screws (Simpson #8 x 1 15/16’’) to connect to the OSB boards. The boards are connected to the studs every 6 inches at the edge studs and every 12 inches in the field studs. Complete design and construction details are shown in Vieira and Schafer (2009), and summarized in Figure 1. The wall is connected to the upper load beam and lower fixed beam of the BBB through ½ in. bolts through the track at every stud location. In

4
addition ½ in. plates are used below each stud to insure the wall board (sheathing) are never allowed to engage in direct bearing. This detail was shown in Shifferaw et al. (2009) to have a significant impact on axial bearing capacity and is an important consideration when comparing to experimental results of others.
Figure 1 – Wall detail with typical fastener schedule
4.2 Instrumentation
Position transducers and string pots were utilized to record supplemental displacements. The exact position transducer setup and location depended on the test and the previous data collected. Therefore, a record indicating where the position transducers (PT) were located was created for each test. Five string pots and eleven position transducers were installed in each test.
Four string pots were positioned on the top of the upper load beam and one was placed over the horizontal shear actuator. The string pot data is useful to confirm the actuator displacements and to determine deformations of the testing rig that connects the actuator to the beam.

5
To have a “fixed” reference point the string pots were connected to the ceiling of the lab (which supports a mezzanine area which sees little if any use and may be regarded as static), see Figure 2a. The PTs were grouped in different formations. Single PTs that measure the out-of-plane displacement of the wall, Figure 2b, or the displacement of the web (local buckling of the web), Figure 2c. There are also groups of three PTs that are able to capture eventual twisting, local and global buckling; one of the PTs is placed in the middle and the other two (edge) are placed right after the outside corner web and flange, Figure 2d. Also, groups of two PTs are similarly placed, but are only capable of capturing twisting and global buckling, Figure 2e. In some tests a webcam was placed close to the single PT that reads the displacement at the end of the stud, Figure 2c.
a) String Pot, checking actuator displacement
b) PT checking displacement out of the wall plane
c) PT checking local buckling at the end of stud and webcam
d) PT checking flexural, torsionaland local buckling
e) PT checking flexural and torsional buckling
Figure 2 – Typical instrumentation installed on walls

6
4.3 Steel properties
Stud and track sections where chosen randomly from the lot of material supplied for testing. After cutting the specimens they were immersed in hydrochloride acid, concentration of 15% per volume (85% distillated water and 15% hydrochloride acid) for 10 minutes. The hydrochloride bath removes the protective zinc coating. Material results are presented in Table 1. For the yield stress, the 0.2% offset method is recommended for the studs since their is no definite yield plateau observed in the tensile specimens; however, the steel used in the track has a definite yield plateau and the autographic method is most appropriate.
Table 1 – Steel properties
mean COV mean COV mean COV mean COVStud 55.54 0.011 56.6 0.009 78.88 0.009 0.19 0.163Track 70.70 0.000 69.1 0.012 78.02 0.007 0.24 0.001
fy (autographic method)
(ksi)fy (0.2% offset) (ksi) fu (ksi) Δ
u (in./in.)
5 Results and Discussion
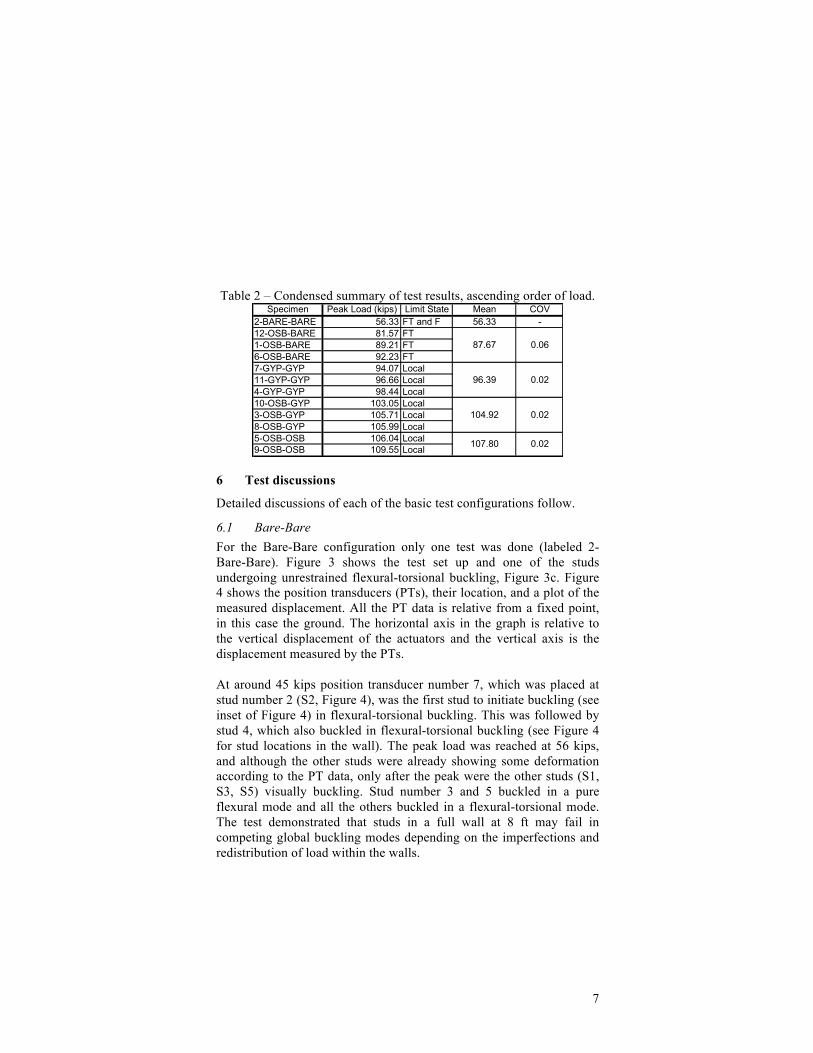
A condensed summary of the test results is provided in Table 2. As expected the ascending order of values for peak load is Bare-Bare, OSB-Bare, Gyp-Gyp, OSB-Gyp and OSB-OSB. The walls with Gypsum on both sides support more load than the walls with OSB board on only one side, increasing the peak load 10%. The attachment of boards on both sides, independently of which kind (a point discussed further in the next section), is experimentally observed to provide post-buckling reserve. If the wall has one side OSB and the other Gypsum, there is a boost in the peak load of 9% compared to the Gyp-Gyp walls, and if both sides are covered with OSB there is a boost of an additional 3% compared to the OSB-Gyp wall. This means that for the walls with sheathing on both sides strength varies 12% from the weakest (Gyp-Gyp) to the strongest (OSB-OSB), additionally relatively stable post-buckling and post-peak response is observed and the wall gradually loses its capacity to support the load under deformation controlled load application, unlike the OSB-Bare wall, which abruptly fails. It should be noted that in all cases there is a significant change in the peak load compared to the Bare-Bare wall.
7
Table 2 – Condensed summary of test results, ascending order of load. Specimen Peak Load (kips) Limit State Mean COV
2-BARE-BARE 56.33 FT and F 56.33 -12-OSB-BARE 81.57 FT1-OSB-BARE 89.21 FT6-OSB-BARE 92.23 FT7-GYP-GYP 94.07 Local11-GYP-GYP 96.66 Local4-GYP-GYP 98.44 Local10-OSB-GYP 103.05 Local3-OSB-GYP 105.71 Local8-OSB-GYP 105.99 Local5-OSB-OSB 106.04 Local9-OSB-OSB 109.55 Local
87.67
96.39
104.92
107.80
0.06
0.02
0.02
0.02
6 Test discussions
Detailed discussions of each of the basic test configurations follow.
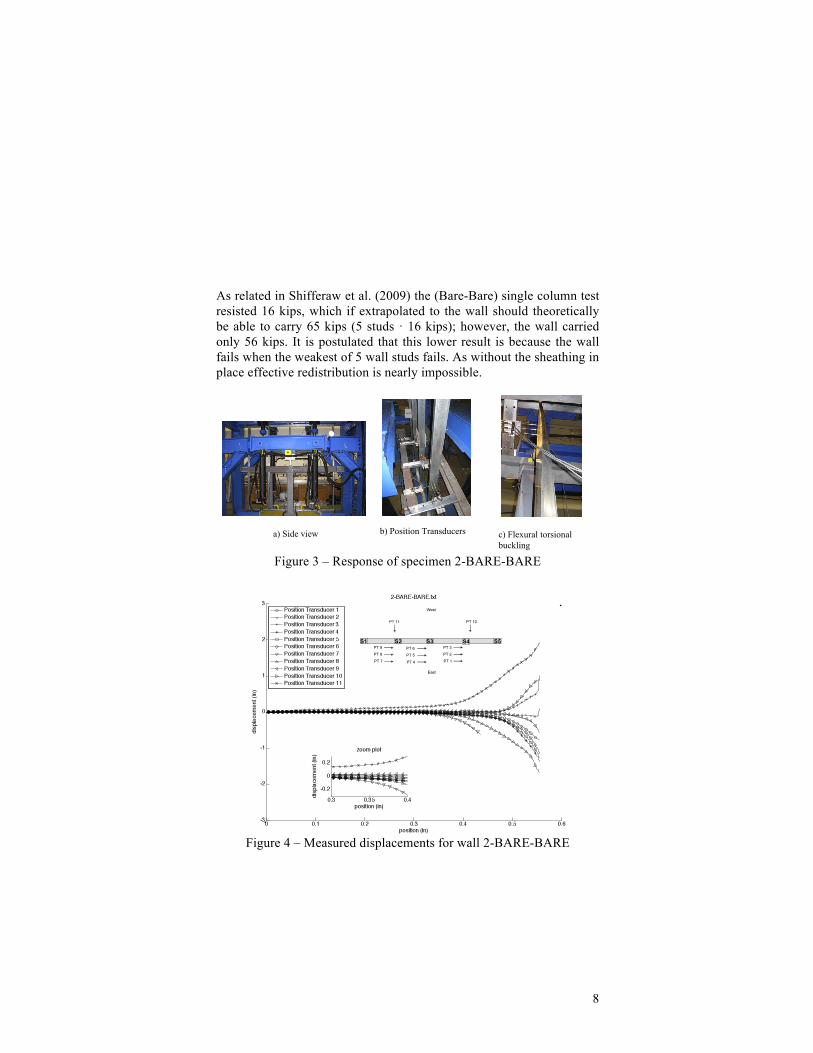
6.1 Bare-Bare For the Bare-Bare configuration only one test was done (labeled 2-Bare-Bare). Figure 3 shows the test set up and one of the studs undergoing unrestrained flexural-torsional buckling, Figure 3c. Figure 4 shows the position transducers (PTs), their location, and a plot of the measured displacement. All the PT data is relative from a fixed point, in this case the ground. The horizontal axis in the graph is relative to the vertical displacement of the actuators and the vertical axis is the displacement measured by the PTs.
At around 45 kips position transducer number 7, which was placed at stud number 2 (S2, Figure 4), was the first stud to initiate buckling (see inset of Figure 4) in flexural-torsional buckling. This was followed by stud 4, which also buckled in flexural-torsional buckling (see Figure 4 for stud locations in the wall). The peak load was reached at 56 kips, and although the other studs were already showing some deformation according to the PT data, only after the peak were the other studs (S1, S3, S5) visually buckling. Stud number 3 and 5 buckled in a pure flexural mode and all the others buckled in a flexural-torsional mode. The test demonstrated that studs in a full wall at 8 ft may fail in competing global buckling modes depending on the imperfections and redistribution of load within the walls.
8
As related in Shifferaw et al. (2009) the (Bare-Bare) single column test resisted 16 kips, which if extrapolated to the wall should theoretically be able to carry 65 kips (5 studs · 16 kips); however, the wall carried only 56 kips. It is postulated that this lower result is because the wall fails when the weakest of 5 wall studs fails. As without the sheathing in place effective redistribution is nearly impossible.
a) Side view b) Position Transducers c) Flexural torsionalbuckling
Figure 3 – Response of specimen 2-BARE-BARE
Figure 4 – Measured displacements for wall 2-BARE-BARE
9
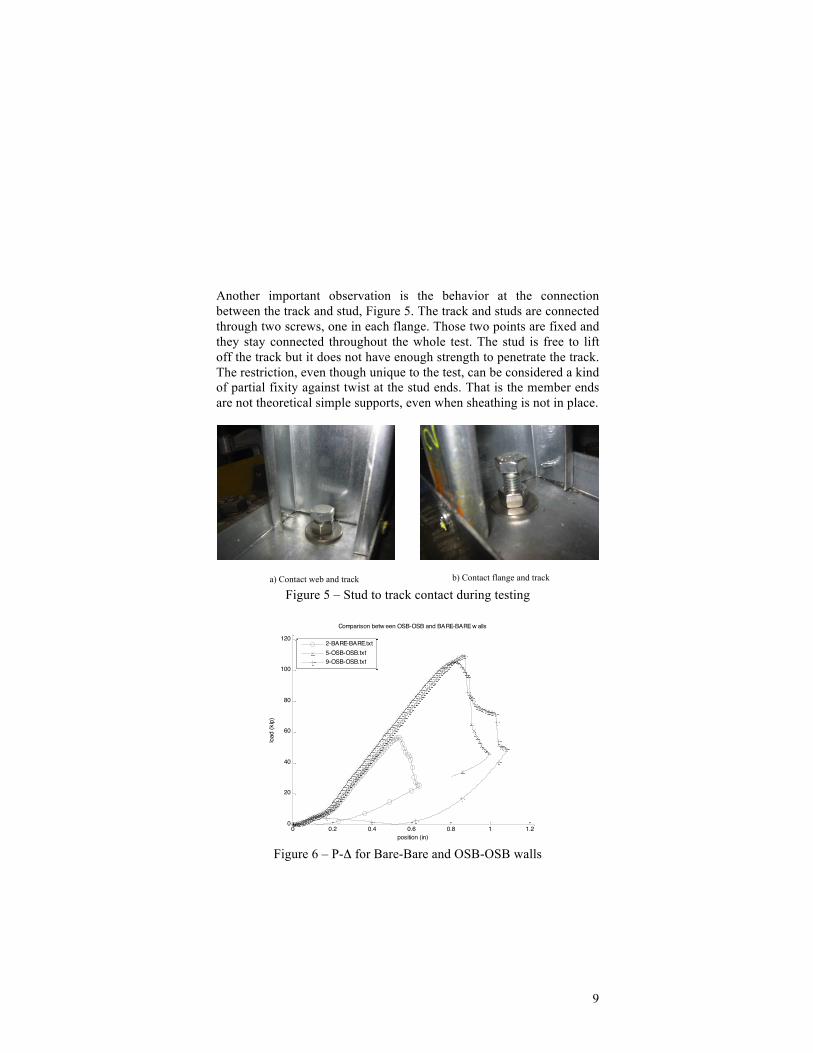
Another important observation is the behavior at the connection between the track and stud, Figure 5. The track and studs are connected through two screws, one in each flange. Those two points are fixed and they stay connected throughout the whole test. The stud is free to lift off the track but it does not have enough strength to penetrate the track. The restriction, even though unique to the test, can be considered a kind of partial fixity against twist at the stud ends. That is the member ends are not theoretical simple supports, even when sheathing is not in place.
a) Contact web and track b) Contact flange and track
Figure 5 – Stud to track contact during testing
0 0.2 0.4 0.6 0.8 1 1.20
20
40
60
80
100
120
position (in)
load
(kip
)
Comparison betw een OSB-OSB and BARE-BARE w alls
2-BARE-BARE.txt5-OSB-OSB.txt9-OSB-OSB.txt
Figure 6 – P-Δ for Bare-Bare and OSB-OSB walls
10
The Bare-Bare wall test also serves as a lower bound, and may be compared with the OSB-OSB upperbound as in Figure 6. The dramatic difference in the load carrying capacity, from the addition of the sheathing, is illustrated by Figure 6.
6.2 OSB-Bare
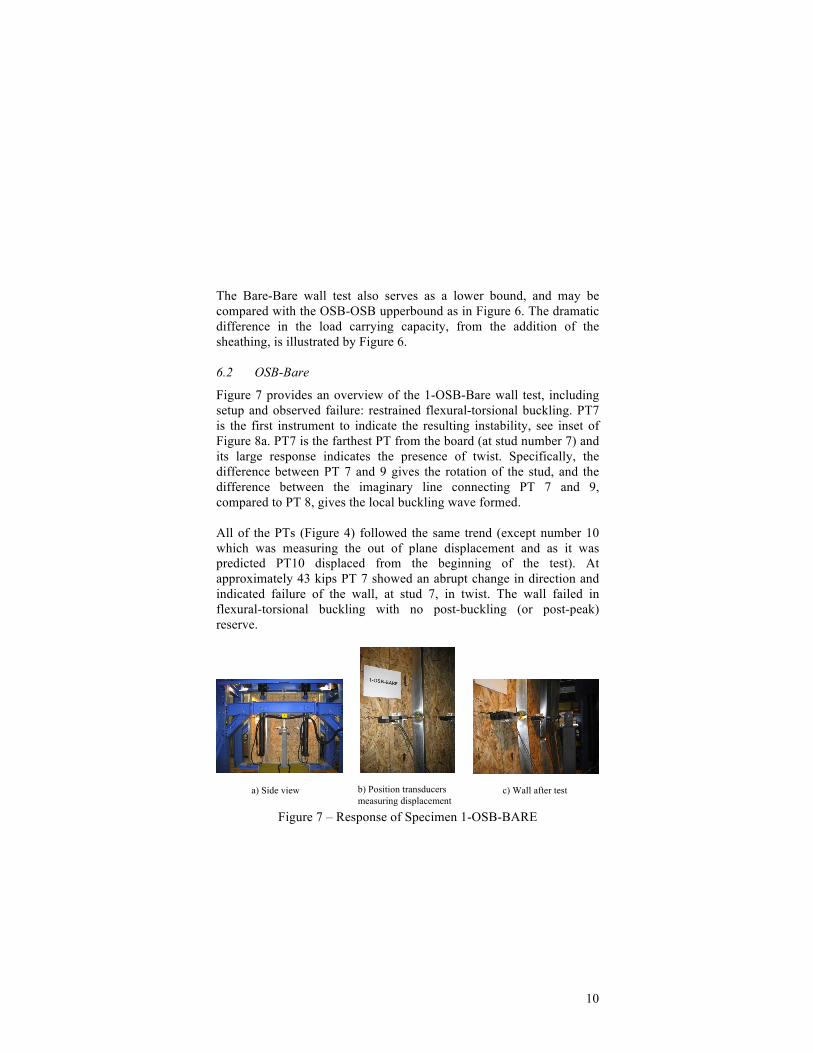
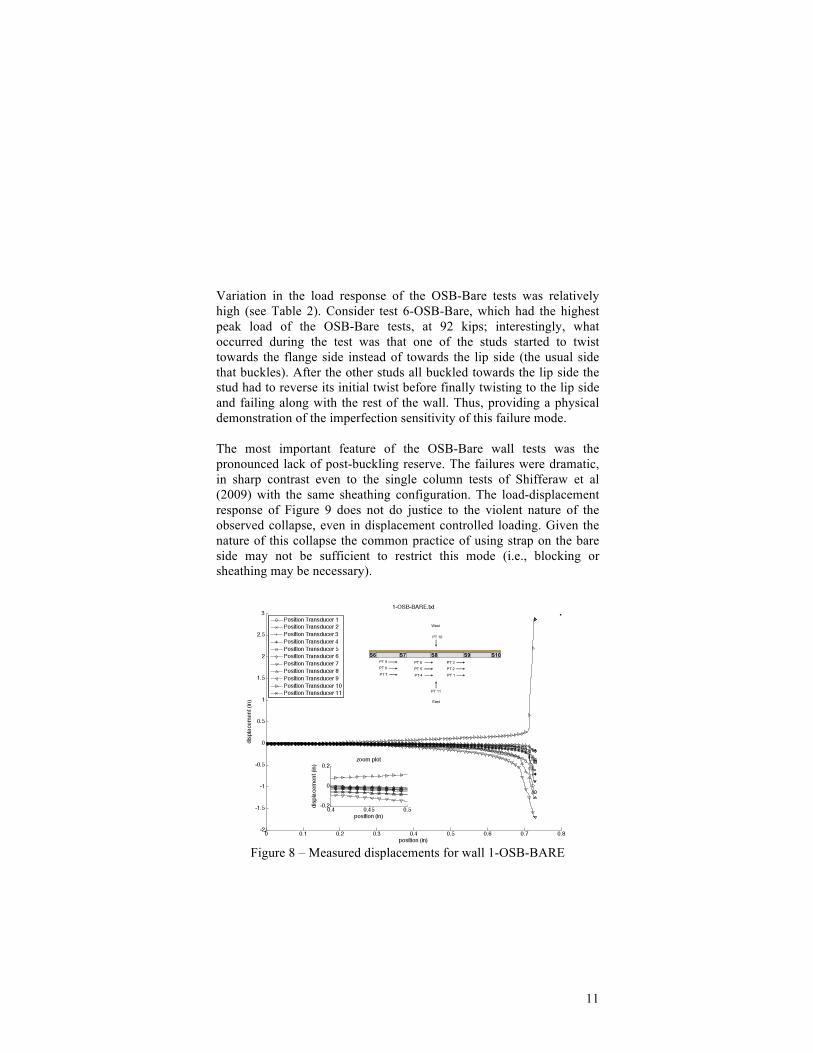
Figure 7 provides an overview of the 1-OSB-Bare wall test, including setup and observed failure: restrained flexural-torsional buckling. PT7 is the first instrument to indicate the resulting instability, see inset of Figure 8a. PT7 is the farthest PT from the board (at stud number 7) and its large response indicates the presence of twist. Specifically, the difference between PT 7 and 9 gives the rotation of the stud, and the difference between the imaginary line connecting PT 7 and 9, compared to PT 8, gives the local buckling wave formed.
All of the PTs (Figure 4) followed the same trend (except number 10 which was measuring the out of plane displacement and as it was predicted PT10 displaced from the beginning of the test). At approximately 43 kips PT 7 showed an abrupt change in direction and indicated failure of the wall, at stud 7, in twist. The wall failed in flexural-torsional buckling with no post-buckling (or post-peak) reserve.
a) Side view b) Position transducers measuring displacement
c) Wall after test
Figure 7 – Response of Specimen 1-OSB-BARE
11
Variation in the load response of the OSB-Bare tests was relatively high (see Table 2). Consider test 6-OSB-Bare, which had the highest peak load of the OSB-Bare tests, at 92 kips; interestingly, what occurred during the test was that one of the studs started to twist towards the flange side instead of towards the lip side (the usual side that buckles). After the other studs all buckled towards the lip side the stud had to reverse its initial twist before finally twisting to the lip side and failing along with the rest of the wall. Thus, providing a physical demonstration of the imperfection sensitivity of this failure mode.
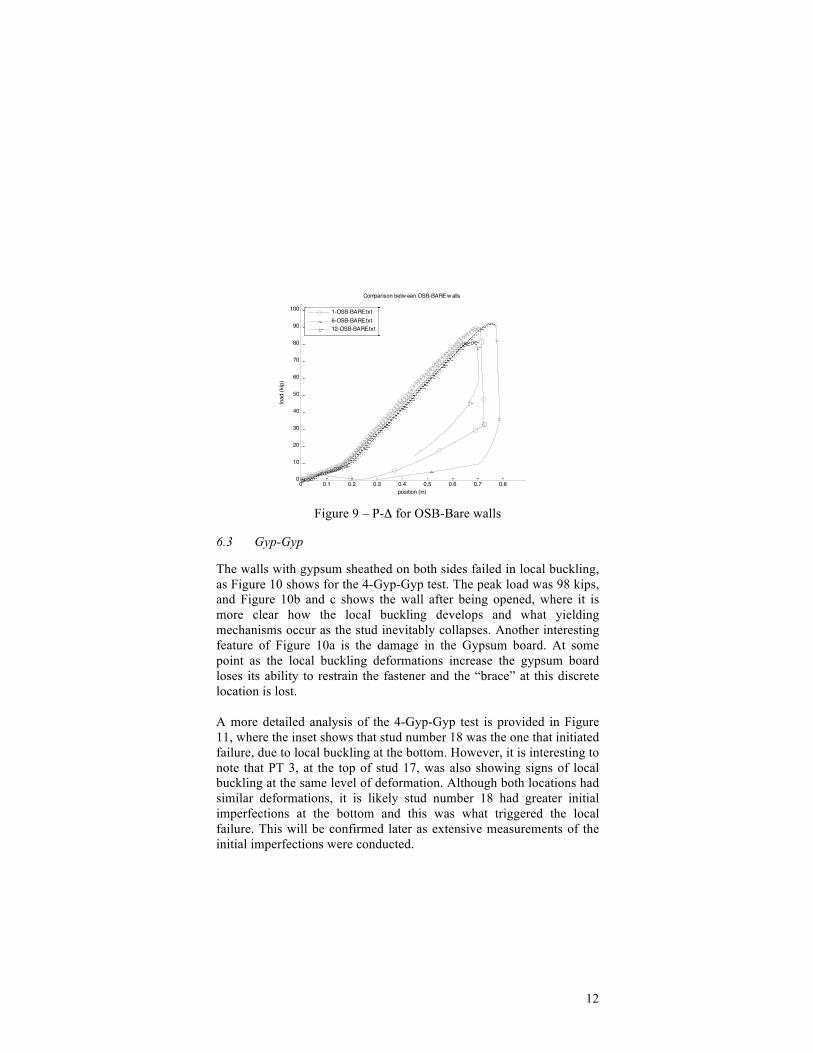
The most important feature of the OSB-Bare wall tests was the pronounced lack of post-buckling reserve. The failures were dramatic, in sharp contrast even to the single column tests of Shifferaw et al (2009) with the same sheathing configuration. The load-displacement response of Figure 9 does not do justice to the violent nature of the observed collapse, even in displacement controlled loading. Given the nature of this collapse the common practice of using strap on the bare side may not be sufficient to restrict this mode (i.e., blocking or sheathing may be necessary).
Figure 8 – Measured displacements for wall 1-OSB-BARE
12
0 0.1 0.2 0.3 0.4 0.5 0.6 0.7 0.80
10
20
30
40
50
60
70
80
90
100
position (in)
load
(kip
)
Comparison betw een OSB-BARE w alls
1-OSB-BARE.txt6-OSB-BARE.txt12-OSB-BARE.txt
Figure 9 – P-Δ for OSB-Bare walls
6.3 Gyp-Gyp
The walls with gypsum sheathed on both sides failed in local buckling, as Figure 10 shows for the 4-Gyp-Gyp test. The peak load was 98 kips, and Figure 10b and c shows the wall after being opened, where it is more clear how the local buckling develops and what yielding mechanisms occur as the stud inevitably collapses. Another interesting feature of Figure 10a is the damage in the Gypsum board. At some point as the local buckling deformations increase the gypsum board loses its ability to restrain the fastener and the “brace” at this discrete location is lost.
A more detailed analysis of the 4-Gyp-Gyp test is provided in Figure 11, where the inset shows that stud number 18 was the one that initiated failure, due to local buckling at the bottom. However, it is interesting to note that PT 3, at the top of stud 17, was also showing signs of local buckling at the same level of deformation. Although both locations had similar deformations, it is likely stud number 18 had greater initial imperfections at the bottom and this was what triggered the local failure. This will be confirmed later as extensive measurements of the initial imperfections were conducted.

13
a) Local buckling at the end b) Wall opened after the test c) Local buckling followed by distortional buckling
Figure 10 – Response of specimen 4-Gyp-Gyp
a) Position transducers plot
b) Location of position transducers, upper view
c) Location of position transducers, side view Figure 11 – Measured displacements for wall 4-Gyp-Gyp
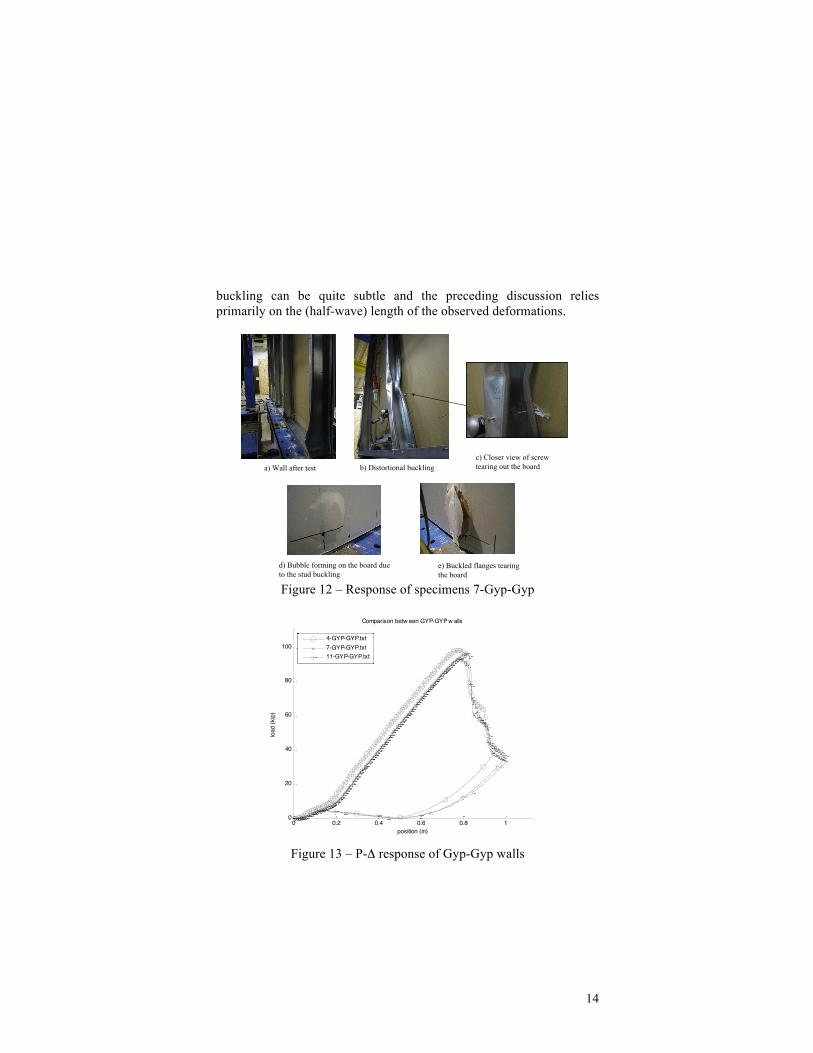
Although the gypsum sheathed tests were dominated by local buckling failures, Figure 12 which shows pictures after the 7-Gyp-Gyp test wall was opened, indicates distortional buckling occurred as well. It should be noted that every stud failed in local buckling at the ends except for the one stud which failed in distortional buckling. The observed damage in the gypsum board provides a clue to the developed buckling mode within, with local buckling (Figure 12d and e) leading to “bubbling” in the paper and loss of large divots of board, and distortional buckling (Figure 12c) being connected to pull-through of the fastener. The distinction between local buckling and distortional
14
buckling can be quite subtle and the preceding discussion relies primarily on the (half-wave) length of the observed deformations.
a) Wall after test b) Distortional bucklingc) Closer view of screw tearing out the board
d) Bubble forming on the board due to the stud buckling
e) Buckled flanges tearing the board
Figure 12 – Response of specimens 7-Gyp-Gyp
0 0.2 0.4 0.6 0.8 10
20
40
60
80
100
position (in)
load
(kip
)
Comparison betw een GYP-GYP w alls
4-GYP-GYP.txt7-GYP-GYP.txt11-GYP-GYP.txt
Figure 13 – P-Δ response of Gyp-Gyp walls

15
Local buckling failures were consistently observed at the member ends. It is postulated that the assembly of the walls, specifically squeezing the stud inside the track creates considerable “fabrication” initial imperfections at the ends, (as opposed to “manufacturing” imperfections) which lead to the failure at the ends. 6.4 OSB-Gyp
The walls sheathed with OSB on one side and Gypsum on the other present an interesting response: strength and global load-displacement of the wall is essentially the same, but observed limit states can vary, particularly in the post-buckling and post-peak regimes.
a) Side view b) Screw tearing out the board
c) Closer view of screw tearing out the board
d) Local buckling e) Wall opened after test Figure 14 – Response of specimen 3-OSB-Gyp
For example, Figure 14 shows the test set up and the failure mode for test 3-OSB-Gyp which failed in local buckling at 106 kips, but also exhibited flexural-torsional buckling in one of the field studs (stud

16
number 14, Figure 15c,) in the post-peak regime. Figure 14b and c show the cut in the Gypsum board formed by the fasteners and Figure 14e shows the wall after removing one side of sheathing, and the stud which failed in flexural-torsional buckling. (Note, the field studs have 12 in. fastener spacing while chord and center studs have 6 in. spacing). Also failing at 106 kips was test 8-OSB-Gyp which failed in local buckling and exhibited no asymmetry in the final response.
a) Position transducers plot
b) Location of position transducers, upper view
c) Location of position transducers, side view Figure 15 – Measured displacements for wall 3-OSB-Gyp
The wall test 10-OSB-Gyp also had a similar peak load to the others (103 kips vs. 106 kips) and failed in local buckling (at the top of the wall, see Figure 16). However, in one stud distortional buckling was also observed, Figure 16c, along with significant damage to the gypsum board, Figure 16d. The OSB board and Gypsum board restrain the stud with different stiffness (and strength) which led to the observed fastener tearing in the Gypsum board since the OSB was providing a higher stiffness (and strength) at the same location. The load versus position curve for all the tests are compared in Figure 17.

17
a) Buckled flanges tearing the board
b) Local buckling at the top
c) Local buckling followed by distortional buckling
d) Gypsum was torn out in order to restrain the stud
Figure 16 – Response of wall 10-OSB-Gyp
0 0.2 0.4 0.6 0.8 10
20
40
60
80
100
position (in)
load
(kip
)
Comparison betw een OSB-GYP w alls
3-OSB-GYP.txt8-OSB-GYP.txt10-OSB-GYP.txt
Figure 17 – P-Δ response for OSB-Gyp wall

18
6.5 OSB-OSB
The OSB-OSB tests fail in local buckling with stable post-buckling and post-peak collapse response, see Figure 6. For example, the peak load for the 5-OSB-OSB wall test was 106 kips and all studs failed in local buckling at the bottom. In Figure 18 the inset shows that PTs 10 and 9 were the first ones to capture the studs failing in local buckling, but stud 22 at the bottom (PT 10) was the one that showed larger displacements (this will be compared to measured initial imperfections in future work). Figure 19 shows the observed local buckling after removing the sheathing (for test 9-OSB-OSB).
The OSB-OSB tests carry 12% more load than the Gyp-Gyp tests even though the studs fail in the same limit state. This demonstrates (a) the sheathing carry axial load even though no direct bearing occurs, and (b) the stiffer OSB board can carry more than gypsum board. Although some load sharing (composite action) occurs, in the usual models (e.g. Winter 1960, or Simaan and Peköz 1976) it is presumed that the boards only provide elastic restraint and do not themselves contribute to the load carrying capacity.
a) Position transducers plot
b) Location of position transducers, upper view
c) Location of position transducers, side view Figure 18 – Measured displacements for wall 5-OSB-OSB

19
a) Yielding line on the web b) Yielding lines on the flange Figure 19 – Response of specimen 9-OSB-OSB
7 Future Research
Significant future work exists of which the primary next step is the development of high fidelity finite element models that allow for a direct exploration of the forces that develop in the fasteners. This will be used to explore the composite action, the demands that result from asymmetric sheathing, and as a supporting tool for bringing connection limit states along with stud limit states into the design process. A number of other questions such as how the load distributes, the impact of initial imperfection, and expected reliability will also be addressed. 8 Conclusions
Twelve full-scale tests of cold-formed steel stud walls with different sheathing configurations were completed in a new testing rig, as reported herein. The tests demonstrated the significant strength gains that may be achieved due to the presence of sheathing. Sheathing identical on both sides of the wall, either OSB or gypsum, are shown to beneficially change the limit state from global to local buckling and have stable post-buckling and post-peak response. However, the OSB sheathed walls do carry 12% higher load than the Gypsum sheathed walls, indicating that even though direct bearing is not allowed in the tests partial composite action even in the axial direction does occur.

20
Walls with dis-similar sheathing on the two sides may exhibit other, less desirable, behavior. At the extreme with OSB sheathing on one side of the wall only, the flexural-torsional failure mode that is observed is dramatic, has little post-peak reserve, high imperfection sensitivity, and is generally not a desirable mode of deformation. The work reported herein is part of a larger project that aims to propose a comprehensive and reliable design method for sheathing-braced design of wall studs.
9 Acknowledgments
The authors gratefully acknowledge AISI for funding, Simpson Strong-Tie for donating the fasteners, and Nickolay Logvinovsky, Lauren Thompson and Hannah Blum for all their help and determination during the lab tests. In addition, the work benefitted from the input of the AISI Committee on Framing Standards Project Monitoring Task Group chaired by Nabil Rahman with significant input from Don Allen, Roger Laboube, Sutton Stephens, and Tom Trestain.
10 References
AISI (1962). Light Gage Cold-Formed Steel Design Manual. American Iron and Steel Institute, New York, NY (now Washington, D.C.)
AISI (2004) North American Specification for the Design of Cold-Formed Steel Structural Members. American Iron and Steel Inst., Wash., D.C.
AISI (2007). North American Standard for Cold-Formed Steel Framing–Wall Stud Design. AISI-S211-07, Am. Iron and Steel Inst., Washington, D.C..
Miller, T., Peköz, T. (1994). “Behavior of Gypsum-Sheathed Cold-Formed Steel Wall Studs.” ASCE, Journal of Structural Eng. 120 (5) 1644-1650.
Shifferaw, Y., Vieira Jr, L. C. M., Schafer, B.W. (2009). “Compression Testing of Single Column Studs with Sheathing Configurations” AISI Progress Report. www.ce.jhu.edu/bschafer/sheathedwalls
Simaan, A. Peköz, T. (1976). “Diaphragm Braced Members and Design of Wall Studs.” ASCE, Journal of the Structural Division, 102 (ST1) 77-92.
Vieira Jr, L. C. M., Schafer, B.W. (2009). “Full-scale testing of sheathed cold-formed steel wall stud systems in axial compression” AISI Progress Report. www.ce.jhu.edu/bschafer/sheathedwalls
Winter, G. (1960). “Lateral Bracing of Beams and Columns.” ASCE Transactions, Paper No. 3044, per footnote “published in 1958 in the Journal of the Structural Division”.