full text: 977 kb - institute for research on poverty - university of
TRANSCRIPT

University of Wisconsin-Madison
Institute for Research on Poverty Discussion Papers
Richard V. Burkhauser Robert H. Haveman Barbara L. Wolfe
HOW PEOPLE WITH DISABILITIES FARE WHEN PUBLIC POLICIES CHANGE

Institute for Research on Poverty Discussion Paper no. 974-92
How People with Disabilities Fare When Public Policies Change
Richard V. Burkhauser Department of Economics
Metropolitan Studies Program The Maxwell School Syracuse University
Robert H. Haveman Department of Economics
La Follette Institute of Public Affairs Institute for Research on Poverty University of Wisconsin-Madison
Barbara L. Wolfe Departments of Economics and
Preventive Medicine Institute for Research on Poverty University of Wisconsin-Madison
June 1992
The research reported here was supported by a grant from the U.S. Department of Health and Human Services to the Institute for Research on Poverty. A first draft of this paper was presented at the National Council on Disability Symposium on Writing National Policies on Work Disabilities. Some of the work was done while Burkhauser was a Fellow at the Netherlands Institute for Advanced Study in the Humanities and Social Sciences. The authors thank Christopher Jencks for his comments on an earlier draft of this paper.

Abstract
Changes in public policy and in macroeconomic conditions have dramatically affected the
economic well-being of people with disabilities over the past two decades, both absolutely and relative
to people without disabilities. Using data from the Current Population Survey (1968-1988), we find
that the households of white or well-educated males with disabilities have fully recovered from the
program cuts and recession of the early 1980s. However, much of this recovery was due to
additional earnings by other household members. The households of males who are "doubly
handicappedn--nonwhite or poorly educated males with disabilities--have not recovered. We conclude
that the new mandates on business aimed at integrating people with disabilities into the workplace are
not likely to significantly benefit the doubly handicapped.

How People with Disabilities Fare When Public Policies Change
Too often public policy is seen as the quest for the magic bullet to cure social ills. But just as
Dr. Ehrlich's cure for syphilis did not fully insure society against the risks of sexual intercourse, it is
unlikely that any single policy initiative will achieve as much as its advocates hope or cause damage
to the extent its detractors fear. The last half-century of disability policy in the United States provides
ample evidence of the mixed success of magic bullets.
Spurred on by the aftermath of two world wars, rehabilitation policy dominated attempts by
the federal government to integrate those with physical or mental disabilities into the labor force.
Early on, transfer programs were limited to Workmen's Compensation and means-tested state
programs like Aid to the Aged, Blind, and Disabled. It was not until 1958 that Social Security
Disability Insurance @I) first became available, and even it, until 1960, was limited to those who
were at least fifty years old.
Seen as a part of the War on Poverty, disability policy radically changed in the 1960s and
1970s. In part, it sought to strengthen the social safety net for those not expected to work: disability
insurance benefits were dramatically increased, eligibility for DI was expanded, and the Supplemental
Security Income (SSI) program for the aged and the poor with disabilities was created. Disability
policy also intervened in the labor market by creating government-supported jobs for those who were
expected to work.' By the 1980s, however, persistently low economic growth, high inflation, and a
belief that the government was both overmanaging the economy and being too redistributive had led
to major changes in U.S. welfare policy in general, and in disability policy in particular.
Disability insurance eligibility rules were tightened in the late 1970s, and in the midst of the
recession of 198 1-82--the deepest since the Great Depression-disability insurance rolls actually fell.
All direct, government job-creation programs were also ended2 The magic policy bullet offered in
the place of this retrenchment in transfer and direct job-creation programs was economic growth.

2
The view was that a strong economy in which jobs were plentiful would make it easier for all those
willing to work to gain employment.
This strategy of reduced government involvement dominated the 1980s. But as we enter the
1990s, a new disability policy strategy appears to be emerging. Broadly defined, it attempts to
accommodate diversity in society through court-imposed antidiscrimination laws and cultural pressure
to end the definition of people by their limitations ("people first" language). The view that people
with disabilities have a legal right of access to government facilities flows out of the civil rights
movement of the 1960s, and was first firmly planted in policy by the Rehabilitation Act of 1973. The
Americans with Disabilities Act of 1990 is a significant extension of the accommodation principal into
the private ~ e c t o r . ~
In this paper we document the consequences of shifts in disability policy during the 1970s and
1980s by tracking the economic status of people with disabilities. What emerges is the paradoxical
result that the new disability policy strategy of the 1990s, aimed at accommodating interest groups
advocating programs for those with disabilities, is being implemented at the very time that the
diversity in economic status among those who are disabled is at its highest level in two decades. We
argue that those left furthest behind by policy retrenchment and economic growth in the 1980s are
those least likely to benefit from this new policy ~trategy.~
In what follows, we will not only explore the economic position of working-age men with
disabilities, but also seek to understand their response to dramatic changes in disability policy over the
past two decades. Changes in the generosity and accessibility of public disability transfer programs
have both direct and indirect impacts on family income.' The direct effect is through the change in
the level of program benefits received; the indirect effect operates through changes in the work and
labor earnings of spouses and other family members induced by program benefit changes.

3
The story that our analysis reveals is a mixed one. In 1967, the first year of our analysis, the
average family income of men with disabilities was about three-quarters that of men without
disabilities. Over the subsequent decade and a half, the relative well-being of these families first rose
substantially and then decreased steadily, reaching its nadir in the deep recession of 1981-82.
Reductions in the generosity and accessibility of public transfers were responsible for much of this
erosion.
With the economic recovery following the recession of the early 1980s, the families of men
with disabilities returned to their 1967 relative income level. However, this recovery had two unique
and troubling characteristics, particularly given the current thrust in government disability policy.
First, the income gains experienced by these families during the 1980s have come neither from the
increased work effort of men with disabilities nor from increases in disability insurance benefits, but
rather from earnings increases of their spouses and other family members. Second, the income
increases of the 1980s have been concentrated among those households with the greatest earnings
capacities.
The positive side of our story is that strong economic recovery greatly diminished the
economic losses associated with disability. By 1987 the average family income of high-school-
educated men without disabilities was only slightly higher than that of men with equivalent educations
but with disabilities. The negative side is that the families of men with disabilities who are poorly
educated andlor are members of racial minorities have not shared in the recovery and are now more
separated from the rest of society than at any point in the last two decades.
Using these developments as a base, we then discuss the new accommodation policy strategy
of the 1990s and its likely effects on the well-being of men with disabilities who are nonwhite or
poorly educated. We call such people the "doubly handicapped." In our view, neither economic
growth nor accommodation is likely to substantially improve their economic lot. A corollary of this

4
conclusion is that some combination of cash or in-kind transfers, public educationltraining programs,
and employment subsidies is required to efficiently secure an improvement in the well-being of these
most vulnerable people with disabilities.
We first present a brief review of trends in disability policy and economic performance over
the past quarter century. We then trace, from 1967 to 1987, changes in the family economic well-
being of males with disabilities, relating these changes to developments in both the performance of the
economy and in the public income transfer system. In conclusion we discuss the implications of
accommodation in the context of these trends.
TRENDS IN DISABILITY POLICY
As a percentage of all working-age people, those with disabilities have not changed greatly
over the past two decades. As reported in Appendix Table B.l, the prevalence rose from 10.5
percent in 1968 to around 11.0 percent in the first half of the 1 9 7 0 ~ ~ Since then it has declined
steadily and stood at a twodecade low of 8.9 percent in 1988. The prevalence of disabilities among
working-age men has been consistently greater than that among women.' But the pattern of
increasing prevalence in the 1970s, followed by a decline in the 1980s, was consistent for both
group^.^ Some of the reduced prevalence in recent years is caused by the increasing share of
younger persons in the working-age population.
The economic well-being of the working-age population with disabilities is heavily influenced
by developments in two key areas--the macroeconomy and public programs targeted on people with
disabilities. A brief look at economic and policy trends since the 1960s sets the stage for our
empirical appraisal.
Since 1967, the United States has experienced two complete business cycles. The late 1960s
and early 1970s witnessed strong economic growth, the benefits of which were widely distributed. All

5
of this was brought to a halt by a pair of oil crises, the first in 1973 and the second in 1976. The
mid-1970s were characterized by both rising prices and little if any real growth. A modest recovery
ensued in the late 1970s, but it was relatively anemic. At the end of the decade, the economy was
plagued with both persistent high unemployment and high inflation. This was the era of "stagflation."
Shortly after the election of President Reagan in 1980, inflation was purged from the economy
by the twists of tight monetary policy, lower taxes, increased military spending, and cutbacks in
social welfare spending. The deep recession of 1981-82 that resulted fell hardest on those workers
with the weakest attachment to the labor market. Once this recession ended, however, the nation
experienced its longest sustained period of economic growth in the twentieth century, lasting from
1983 until the end of the decade.
Reflecting the general prosperity, the 1960s and 1970s were a time of increasing social
welfare expenditures in the United States. Table 1 documents this pattern. Social welfare
expenditures as a share of GNP have risen steadily since 1960 and peaked at about 20 percent in the
late 1970s. After that time social policy entered a period of retrenchment, and this share fell through
about 1982, where it stabilized at about 18.4 percent.
The national commitment to the working-age population with disabilities is primarily
manifested in the Social Security Disability Insurance @I) and Supplemental Security Income (SSI)
program^.^ From the mid-1960s to the late 1970s, DI and SSI were characterized by rapid growth in
both the number of benefit recipients and in the level of expenditures on people with disabilities.
From 1968 to 1978, the number of recipients of public disability transfer programs as a percentage of
the employed work force grew from 9.3 percent to nearly 15 percent--a 7 percent annual growth rate
in this percentage. Over the same time period, expenditures for disability income support programs
grew from 5.8 percent of federal government spending to 8 percent, a 6.3 percent annual rate of
growth in this percentage. Simultaneously, the percentage of lost wage earnings made up by benefits

6
TABLE 1
Disability Policy Indicators
Total social welfare expenditures (billions)"
As a percentage of Gross National Product
Total DI expenditures (billions)
DI share of social welfare expenditures
DI recipients (thousands)
Veterans' Disability recipients (thousands)
SSI disabled recipients (thousands)
DI awards per 1,000 insured workers
Percentage of DI applicants awarded benefitsb
Overall poverty rate
$52.3
10.6%
$0.6
1.1%
455
- -
N.A.
4.5
.50
22.2
$145.9
14.7%
$3.1
2.1%
1,493
3,178
N.A.
4.8
.40
12.6 - -
Source: Social Security Bulletin. Annual Statistical Su~~lement 1989.
"Total social welfare expenditures include social insurance, public aid, health and medical programs, veterans' programs, housing, education, and other social welfare.
bPercentage of applicants receiving awards per 1,000 insured workers from the Office of the Actuary, Social Security Administration.
7
for the average worker--the average replacement rate--in the DI program rose from 33 percent to 47
percent.
Disability policy is often a component of a more general labor market policy in Western
industrialized economies. lo During recessions, disability rules tend to be loosened and disability
transfers tend to be seen as an alternative to long-term unemployment benefits for workers. This is
especially the case for workers with tenuous ties to the labor market-dder, less-skilled, less-educated
workers-who tend to be the most severely affected by economic downturns.
Until the late 1970s in the United States, DI administrators explicitly increased their use of
"vocational criteria" that included an applicant's age, skills, and education in making decisions on
acceptance into the program. The share of awards for musculoskeletal disorders (e.g., lower back
pain) grew substantially over the period. While vocational factors played some role in the eligibility
determination process from the very outset of the DI program, these factors began playing an
increasing role in the late 1960s: by 1975, over one-fourth of initial DI benefit awards were made on
the basis of these criteria. This administrative change, together with sharp increases in disability
benefits in the early 1970s in both the DI and the SSI programs, brought the U.S. disability system
into closer conformity with its European counterparts. The system became viewed as part of a
broader, countercyclical income support program.
By the late 1970s, numerous flags had been raised regarding the rapid expansion of the
disability income support system, and policymakers sought ways of restraining the growth of
recipients and expenditures. During the Carter administration, new regulations for reexamination of
existing recipients of DI benefits were put forward, and the Social Security Administration put out
word that the application of the rules for disability determination needed to be tightened up. By
1980, growth in both the rolls and in expenditures had begun to decrease.

8
After 1980, disability programs became both less generous and less accessible, consistent with
the general trend in social policy. The DI program was particularly hard hit, and its share of
shrinking overall social welfare expenditures fell from over 3.1 percent in 1980 to about 2.5 percent
by 1987. DI awards per thousand insured workers and the percentage of DI applicants awarded
benefits also fell over this period of retrenchment. All of this occurred in the face of rising national
poverty rates. Shortly after the election of President Reagan the reexamination rules proposed earlier
were imposed, and with a vengeance. Within a twenty-four-month period, some 838,000 recipients
were reexamined, and over 360,000 of them were cut from the rolls. Public income support for
workers with disabilities entered a severe retrenchment phase. However, because of the public outcry
over the benefit terminations, Congress passed legislation in 1984 that enabled about two-thirds of
those removed from the rolls to reclaim their benefits." Since the mid-1980s, benefit generosity and
accessibility have remained fairly constant, and growth in recipients and expenditures has been
modest.
In 1990 President Bush signed the Americans with Disabilities Act. Title I of the Act
incorporates the standards of discrimination set out in regulations implementing section 504 of the
Rehabilitation Act of 1973, but dramatically extends them to include all employers of fifteen or more
workers. Title I1 extends the Act to state and local governments. Title 111 covers access in places of
public accommodation such as restaurants, hotels, grocery stores, and similar establishments and
buses, and Title N covers telephone services and telecommunications.
Under Titles I and I1 of the Act employers must make "reasonable accommodations" to
workers with disabilities unless this would result in "undue hardship" on the operation of business.
The same general language guides establishments in Titles 111 and IV. Unlike government transfer
programs, this new social legislation will not be funded by the federal government but by employers,
f i m , and state and local governments instead. Compliance will be enforced by the courts.

9
HOW WORKING-AGE PEOPLE WITH DISABILITIES HAVE FARED
These brief descriptions of changes in both the state of the economy and shifts in policy set
the backdrop for assessing trends in the economic status of people with disabilities.
Economic Well-Beine of Men with and without Disabilities: 1967-1987
Tables 2 and 3 reveal the consequences of the trends in both economic conditions and
disability policy for the economic well-being of working-age men with disabilities and their families
over the past two decades. Rows 1 and 2 of Table 2 show the real wage earnings of men with
disabilities, both as dollar amounts and as a percentage of the income of men without disabilities.
Following general trends in earnings of working-age men in the early 1970s, the wage earnings of
men with disabilities increased from $15,000 to $18,800 (in 1987 dollars) between 1967 and 1972--
from 66 to 74 percent of the earnings of men without disabilities. In addition, real public income
transfers to the families of men with disabilities rose during this period of general expansion in
federal social welfare programs. Increases in these income sources together with other forms of
household income made this period one of substantial absolute and relative improvement for families
of men with disabilities. Over the five-year period, the real income of these families rose by 25
percent, reaching 80 percent of that of families of men without disabilities.
This 80 percent peak in relative income lasted through 1975, but then began to erode in line
with the performance of the economy. Following the slowdown of the early 1970s, the real wage
earnings of men with disabilities fell until 1981, both absolutely and relative to those of men without
disabilities. Until 1975, however, the decrease in wage earnings was offset by increases in transfer
income. After the mid-1970s, and extending into the early 1980s, both wage earnings and transfers
fell. By 1981, the real family income of men with disabilities was only two-thirds that of men
without disabilities.

10
TABLE 2
Family Economic Well-Being of Men with Disabilities Relative to Men without Disabilities, 1967-1987
(in 1987 dollars, in thousands)
Real Wage Earnings Amount
Relative to those without disabilities .66 .74 .66 .58 .51 .49
Real Transfers Amount
Relative to those without disabilities 3.7 3.2 3.2 3.8 3.3 4.1
Real Family Income Amount
Relative to those without disabilities .74 .80 .80 .73 .66 .75
Source: Authors' calculations based on Current Population Surveys, 1968- 1988.
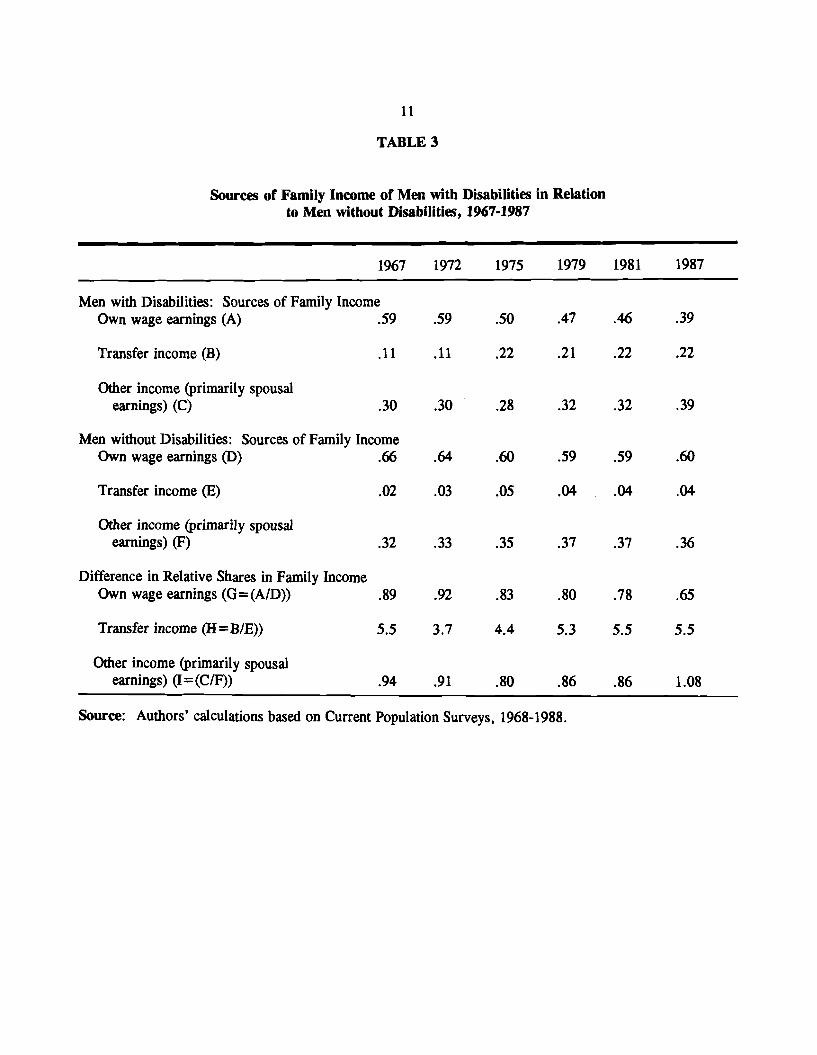
TABLE 3
Sources of Family Income of Men with Disabilities in Relation to Men without Disabilities, 1967-1987
Men with Disabilities: Sources of Family Income Own wage earnings (A) .59
Transfer income (B) . l l
Other income (primarily spousal earnings) (c) .30
Men without Disabilities: Sources of Family Income Own wage earnings @) .66
Transfer income Q .02
Other income (primarily spousal earnings) 03 .32
Difference in Relative Shares in Family Income Own wage earnings (G = (AID)) .89
Transfer income (H =B/E)) 5.5
Other income (primarily spousal earnings) (I = (CIF)) .94
Source: Authors' calculations based on Current Population Surveys, 1968-1988.
12
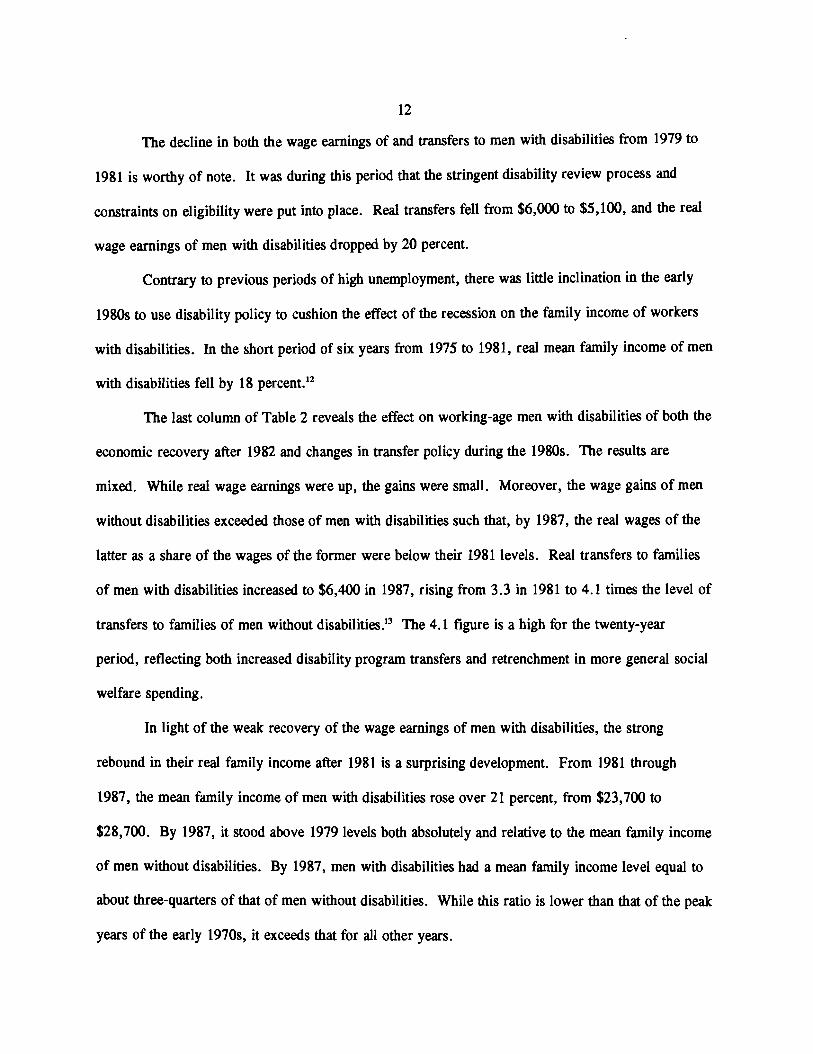
The decline in both the wage earnings of and transfers to men with disabilities from 1979 to
1981 is worthy of note. It was during this period that the stringent disability review process and
constraints on eligibility were put into place. Real transfers fell from $6,000 to $5,100, and the real
wage earnings of men with disabilities dropped by 20 percent.
Contrary to previous periods of high unemployment, there was little inclination in the early
1980s to use disability policy to cushion the effect of the recession on the family income of workers
with disabilities. In the short period of six years from 1975 to 1981, real mean family income of men
with disabilities fell by 18 percent.''
The last column of Table 2 reveals the effect on working-age men with disabilities of both the
economic recovery after 1982 and changes in transfer policy during the 1980s. The results are
mixed. While real wage earnings were up, the gains were small. Moreover, the wage gains of men
without disabilities exceeded those of men with disabilities such that, by 1987, the real wages of the
latter as a share of the wages of the former were below their 1981 levels. Real transfers to families
of men with disabilities increased to $6,400 in 1987, rising from 3.3 in 1981 to 4.1 times the level of
transfers to families of men without di~abilities?~ The 4.1 figure is a high for the twenty-year
period, reflecting both increased disability program transfers and retrenchment in more general social
welfare spending.
In light of the weak recovery of the wage earnings of men with disabilities, the strong
rebound in their real family income after 1981 is a surprising development. From 1981 through
1987, the mean family income of men with disabilities rose over 21 percent, from $23,700 to
$28,700. By 1987, it stood above 1979 levels both absolutely and relative to the mean family income
of men without disabilities. By 1987, men with disabilities had a mean family income level equal to
about three-quarters of that of men without disabilities. While this ratio is lower than that of the peak
years of the early 1970s, it exceeds that for all other years.

13
A twenty-year perspective is revealing. Although fluctuations occurred, the 14 percent
growth in the real family income of men with disabilities over the period 1967 to 1987 has exactly
tracked that of other families. But a substantial change in the composition of income in the two types
of families has occurred. Real wage earnings of men with disabilities have fallen by 25 percent.
While increases in real transfers offset this loss in the mid-1970~~ the major gain since then has come
from other family sources of income, in particular from the increased work effort of spouses. It is
this gain that has allowed families of working-age men with disabilities to keep pace over the last
decade, in particular during the recovery of the 1980s. The decline in work and earnings by men
with disabilities--and the offsetting rise in spousal work--can be seen even more clearly in Table 3.
From 1967 to 1972, the share of family income accounted for by the wage earnings of men with
disabilities ranged from 89 to 92 percent of that of men without disabilities. Over the next decade,
increased spousal work effort eroded the relative importance of male wage earnings in all families.
However, while the 1980s recovery saw a slight increase in the wage earnings of men without
disabilities (as a share of family income), this has not been the case for the earnings of men with
disabilities. Indeed, as row 1 shows, after 1972, the share of family income accounted for by the
earnings of men with disabilities dropped precipitously and was smaller in the six years after 1981
than in the previous six years. During the economic recovery of the 1980s, the responsibility for
supporting such families shifted from men to their spouses and other family members; no such shift
occurred in the families of men without disabilities.
Our twenty-year history that began with an increased commitment of government resources to
people in poverty and to those with disabilities ended with reductions in both. As a result, the
working-age population with disabilities, which had moved close to economic parity with the
population without disabilities during the early 1970s, began a slide in relative well-being that hit
bottom in the major recession of 1981. While the longest continuous recovery in U.S. history has

pulled the average family income of men with disabilities back to prerecession levels, it has done so
in a surprising way. Much of the gain has been through increased work effort, but not by men with
disabilities. In large part, the economic gains of families of men with disabilities are attributable to
the increased work effort of spouses and other family members, drawn into the labor market by the
recovery.
Com~arisons in Well-be in^ bv Education and Race: 1967-1987
While the results shown in Tables 2 and 3 are averages for males with and without disabilities
and for their families, they reveal little about trends for disaggregated groups within the two
categories. Appendix Tables B.2 and B.3 present detailed breakdowns of earnings and incomes (total,
and by source) for men with and without disabilities, distinguished by education level and race. The
patterns are complex; here we will summarize the main comparisons.
Com~arisons bv Education Level.
Earnings (see Panel I of Table B.2)--At the beginning of the period (1967), across all education groups, men with disabilities earned between 62 and 77 percent of what men without disabilities earned. These ratios rose somewhat in the early 1970s but fell thereafter. During the recession of 1981 all three education groups hit economic lows, earning between 29 and 64 percent of what their able-bodied counterparts earned. Recovery considerably improved the relative earnings of high school graduates and those with some postsecondary education, but by 1987 high school dropouts were still at a recession low of about 30 percent, well below the other two groups.
Family Income (see Panel I1 of Table B.2)-The ratios of the family income of males with disabilities to that of males without disabilities exceed the earnings ratios, reflecting the receipt of public transfer income and the earnings of spouses and other family members. In 1967, the ratios ranged from 78 to 88 percent. During the recession of 1981, they hit lows of 69 to 75 percent; but by 1987 the family income ratios of men with disabilities who were high school graduates or who had some postsecondary training had reached twenty-year highs of around 90 percent, while the ratios for high school dropouts remained near their recession low.
Income Sources (see Panels III-V of Table B.2)--From 1967 to 1987, the share of family income accounted for by the earnings of men with disabilities with low educations fell steadily, from 55 percent to 22 percent.
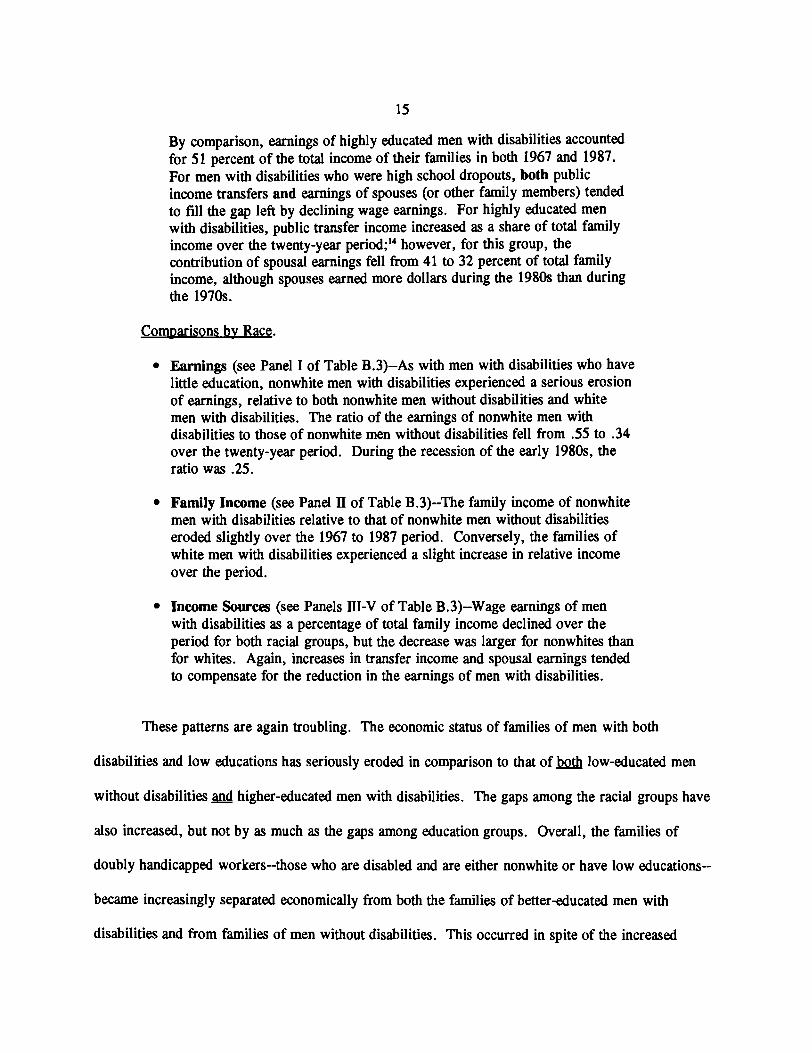
By comparison, earnings of highly educated men with disabilities accounted for 51 percent of the total income of their families in both 1967 and 1987. For men with disabilities who were high school dropouts, both public income transfers and earnings of spouses (or other family members) tended to fill the gap left by declining wage earnings. For highly educated men with disabilities, public transfer income increased as a share of total family income over the twenty-year period;14 however, for this group, the contribution of spousal earnings fell from 41 to 32 percent of total family income, although spouses earned more dollars during the 1980s than during the 1970s.
Com~arisons by Race.
Earnings (see Panel I of Table B.3)--As with men with disabilities who have little education, nonwhite men with disabilities experienced a serious erosion of earnings, relative to both nonwhite men without disabilities and white men with disabilities. The ratio of the earnings of nonwhite men with disabilities to those of nonwhite men without disabilities fell from .55 to .34 over the twenty-year period. During the recession of the early 1980s, the ratio was .25.
Family Income (see Panel I1 of Table B.3)--The family income of nonwhite men with disabilities relative to that of nonwhite men without disabilities eroded slightly over the 1967 to 1987 period. Conversely, the families of white men with disabilities experienced a slight increase in relative income over the period.
Income Sources (see Panels 111-V of Table B.3)--Wage earnings of men with disabilities as a percentage of total family income declined over the period for both racial groups, but the decrease was larger for nonwhites than for whites. Again, increases in transfer income and spousal earnings tended to compensate for the reduction in the earnings of men with disabilities.
These patterns are again troubling. The economic status of families of men with both
disabilities and low educations has seriously eroded in comparison to that of low-educated men
without disabilities and higher-educated men with disabilities. The gaps among the racial groups have
also increased, but not by as much as the gaps among education groups. Overall, the families of
doubly handicapped workers--those who are disabled and are either nonwhite or have low educations--
became increasingly separated economically from both the families of better-educated men with
disabilities and from families of men without disabilities. This occurred in spite of the increased

16
work effort and earnings of spouses of men with disabilities and increases in income from public
transfers for which they qualify.
Povertv Com~arisons during the 1980s
As Table 2 revealed, the families of men with disabilities have made substantial economic
progress since the recession year of 1981. Indeed, their gains have outstripped those of families of
men without disabilities during this period. By 1987, the family income gap between them, which
had reached its highest level in 1981, was smaller than in either 1979 or 1967. But the recovery-
driven narrowing of this overall gap camouflages quite different patterns at the tail end of the income
distribution.
In the aftermath of the 1981 recession, the aggregate poverty rate rose to 15.2 in 1983, its
highest level since 1965. As the recovery developed, poverty rates fell, but not as fast as they had in
previous periods of economic growth. By 1987, the national rate was still a relatively high 13.4
percent. Unfortunately no official government statistics track poverty rates for the disabled. The
Current Population Survey (CPS), however, does allow us to focus on the poverty population and the
risk that men with disabilities face of falling into poverty relative to men without disabilities. As
shown in Table 4, over the period 1983 to 1987 a larger proportion of the poor population became
disabled. The fraction of poor males who have disabilities increased from 14.4 to 16.9 percent, a 17
percent increase.
The remaining rows in Table 4 show the change over time in "relative poverty risk"--the
probability that a man with disabilities is in poverty relative to a man without disabilities but with the
same other characteristics. Overall, the poverty risk of men with disabilities rose from 137 percent
that of other men to 171 percent. But this increase in risk was not uniform. In 1983, males with
disabilities who dropped out of high school had a 26 percent greater chance of being poor than did
male high school dropouts without disabilities. Economic recovery exacerbated this difference in
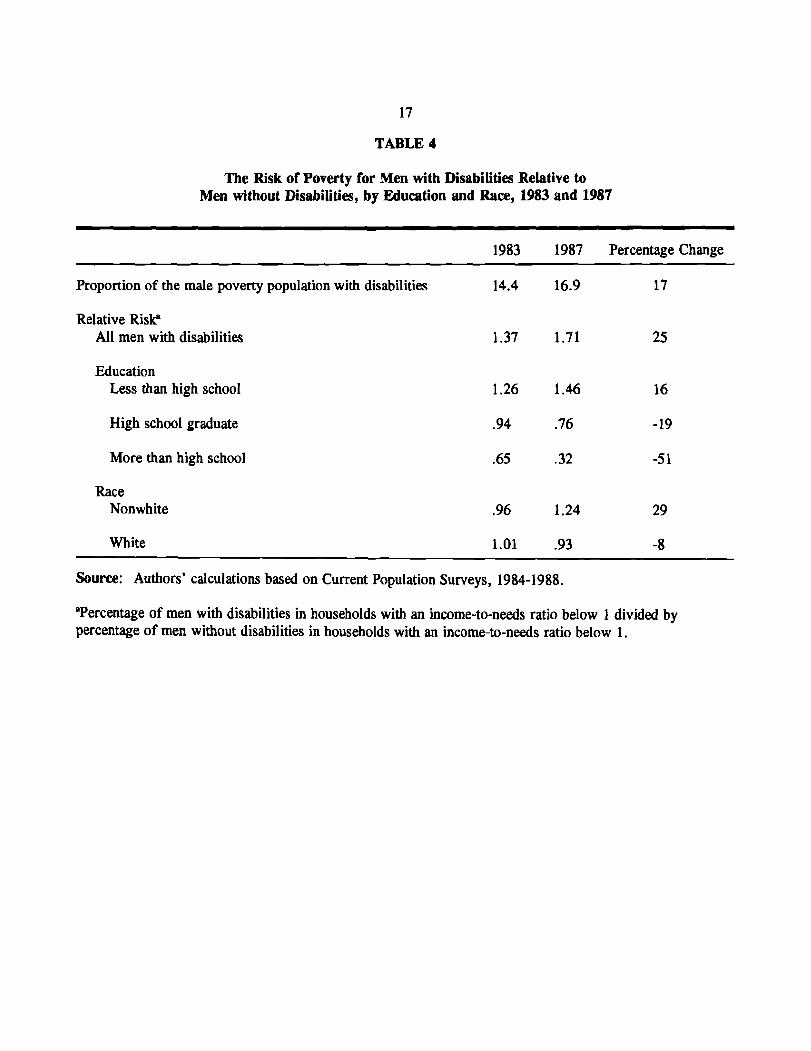
TABLE 4
The Risk of Poverty for Men with Disabilities Relative to Men without Disabilities, by Education and Race, 1983 and 1987
1983 1987 Percentage Change
Proportion of the male poverty population with disabilities 14.4 16.9 17
Relative RisP All men with disabilities
Education Less than high school
High school graduate .94 .76 -19
More than high school .65 .32 -5 1
Race Nonwhite
White 1.01 .93 -8
Source: Authors' calculations based on Current Population Surveys, 1984-1988.
'Percentage of men with disabilities in households with an income-to-needs ratio below 1 divided by percentage of men without disabilities in households with an income-to-needs ratio below 1.
18
poverty risk, increasing it by 16 percent. For better-educated males with disabilities, the recovery
had the opposite effect, reducing the relative risk of poverty by 19 percent for high school graduates
and by 51 percent for those with more than a high school degree. The recovery of the 1980s clearly
exacerbated the adverse effect of disabilities for those with low educations and, hence, weak market
skills.
This "pulling apart" phenomenon is also observed between whites and nonwhites. While
black males with disabilities had about the same probability of being poor as black males without
disabilities in 1983, by 1987 their relative risk of poverty had increased substantially--the ratio of
close to 100 had risen to 124. These shifts are consistent with the overall thrust of government policy
in the 1980s. In general, Reagan administration policy promoted economic growth as a means of
reducing poverty, while simultaneously restricting income support to only the truly needy. Economic
recovery did occur, and aggregate poverty was reduced. However, the rising tide of the recovery did
not raise all boats.
CONCLUSION AND POLICY IMPLICATIONS
We have examined a twodecade trend in the economic well-being of men with disabilities and
their families from a variety of perspectives: in terms of absolute earnings and income, of earnings
and other income sources as a share of family income, of the earnings and income of men with
disabilities relative to those without disabilities, and of the risk of poverty for men with disabilities
relative to those without disabilities. We have also examined trends in well-being for groups of
persons with disabilities, concentrating on what we have called the doubly handicapped--those with
disabilities who are either nonwhite or have low educations. We have attempted to relate these trends
to changes in both federal disability policy and the macroeconomic performance of the economy.

19
The past two decades have seen major swings in both federal disability policy and the
performance of the economy. The generosity and accessibility of income support policies toward
workers with disabilities increased from the mid-1960s until about 1976. Responding to rapid
increases in both expenditures and rolls, Congress and the White House acted to establish more
stringent periodic evaluation regulations and constrain benefit generosity. After the Reagan
administration imposed these regulations, eliminating thousands of recipients from the rolls, reaction--
and partial reinstatement--ensued. However, neither program accessibility nor benefit generosity have
attained the levels experienced in the mid-1970s.
The turmoil in disability policy has been matched by radical swings in macroeconomic
performance over the past two decades. Economic growth in the late 1960s came to an abrupt halt
with the oil price increases in 1973 and 1976. The increased generosity and accessibility of disability
income transfer programs cushioned these economic setbacks, and minimized the impact of the
recessions on disabled workers. During this period, the economic well-being of the disabled did not
fall markedly relative to those without disabilities.
Stagflation--low growth, rapid inflation--ensued until the late 1970s. With the goal of purging
inflation and stimulating growth, the Reagan administration precipitated a serious recession in 1981-
82, yet failed to design initiatives to cushion the blow. The family income of men with disabilities
thus fell substantially; at the depth of the recession, these families had 25 percent less real income
than they had a decade earlier.
Following the recession, the economy entered its longest sustained expansion, but the nature
of the gains to those with disabilities did not follow traditional lines. Wage earnings of men with
disabilities did not grow as one would have expected from the experience of previous expansions. In
absolute terms, they remained close to their recession levels, and fell relative to the earnings of men
without disabilities. Nevertheless the family income of men with disabilities did grow substantially

20
during this period, but the gains primarily came from the strong increase in the work effort and
earnings of others in the family, especially spouses.
The fall-off in the earnings of men with disabilities was not uniform among them, however.
Those with low levels of education and nonwhites accounted for most of the poor p e r f o m c e .
These doubly handicapped workers form a subgroup of persons with disabilities that the economy has
left behind. This group is now more concentrated at the bottom of the earnings distribution, and
composes an increasing share of the nation's poverty population.
These findings have important policy implications. First, unless a renewed effort is made to
provide training or workplace adjustments targeted on these doubly handicapped workers, it seems
doubtful that simple economic growth will return them to the work force. This conclusion has a
corollary--increasingly, the well-being of these disadvantaged workers will rest on the generosity and
availability of public income transfers or on the increased work effort and earnings of those with
whom they live. In the absence of any movement toward expansion of public income support, the
latter option seems the likely alternative.
Second, if this forecast is correct, those men who have both disabilities and few marketable
skills will become increasingly dependent on the work and earnings of other family members. The
resulting family stresses and feelings of dependency that will inevitably develop do not augur well for
the noneconomic well-being of these people and their families. It is likely that the public sector will
ultimately bear the burden of the resulting family stresses and disruptions through higher welfare
payments, health care payments, and other demands on related public services.
There is a third, and especially alarming, implication. The major thrust in disability policy
now appears to be the integration of people with disabilities into the mainstream of American life
through accommodating diversity--that is, provision of an environment for work and for daily
activities such as shopping or traveling that does not penalize the limitations of people with

2 1
disabilities. Such a policy may be justified solely on the grounds that it extends civil rights protection
to diverse groups. But unless the federal government changes its position and begins to fund this
effort, current accommodation policy is likely to be of most value only to people with disabilities who
are otherwise well-prepared to compete in the labor market or purchase goods and services in the
product market; it will do little good and may do harm to the doubly handicapped.
The Americans with Disabilities Act of 1990 requires employers to accommodate workers
with disabilities as long as it does not put an undue burden on the firm. But since the federal
government is not subsidizing this effort, simple mandates plus selective enforcement are left to do
the job. Such mandates may stimulate the employment of some people with disabilities via
"creaming" of those workers with the least-serious disabilities and with strong educations, training,
and marketable skills. Moreover, these workers are precisely the ones most likely to have the
negotiating strength and access to the legal system required to secure employer compliance with the
mandates. In the absence of federal support, however, the impact of the mandates on the doubly
handicapped is likely to be minimal. If the experience of other countries with mandates (e.g.,
Sweden and Germany) is relevant, then disabled workers with the fewest skills will face an even more
difficult time finding employment in recessionary times--when government intervention on their behalf
is most needed--than in prosperous times. (See Burkhauser and Hirvonen, 1989.)
If economic growth alone will fail to improve the well-being of the doubly handicapped, if
fiscal constraints limit income support measures, if the substitution of the work effort and earnings of
spouses and other family members for those of disabled workers leaves dysfunctional families in its
wake, and if employment quotas and mandates such as those embodied in accommodation legislation
are likely to be ineffective, what remains? Perhaps the final policy implication of our analysis, then,
is that no single magic bullet is likely to better the lives of all people with disabilities. But it is now
obvious that some new and more effective mix of direct transfers, job training, and employment

22
subsidies is necessary to begin returning the doubly handicapped to the economic mainstream, and
that it is to the design of such a strategy that the nation should now turn its attention.

23
Appendix A
The methodology used in this study to estimate the working-age population with disabilities
has been developed in Haveman and Wolfe (1990) and Wolfe and Haveman (1990). Our population
consists of men and women of working age who either (1) are receiving income from a program
targeted on people with disabilities, or (2) who work less than full-time and self-report that their work
reduction is due to health, or (3) both. The specific questions used in each year of our data are
reported in Table A. 1.
Ideally one would use a panel data set to follow the impact of public policy on a set of people
with disabilities. One problem with our cross-sectional data is, for instance, that it excludes the
institutionalized population. It is likely that certain groups of people with disabilities, particularly
those with mental disabilities, were less likely to be institutionalized in the 1980s then in previous
decades. Their inclusion in later-year cross-sections may understate the growth in economic well-
being of a fixed, noninstitutionalized population. A more general issue in tracking the economic well-
being of people with disabilities is the accuracy of self-reports. While this is a controversial issue,
our reported incidence of disabilities is close to those of other researchers using an alternative self-
report measure (Bemefield and McNeil, 1989). Furthermore, for our work, which compares
economic well-being over time, the most important point is to use a consistent definition of
disabilities. We are able to do so with our CPS data. (For a fuller discussion of measurement issues,
see Wolfe and Haveman [I9901 .)

TABLE A.l
Definitions Employed in Estimating the Size and Composition of the Working-Age Population with Disabilities
Year Program Participation Work Limitations
1968 1. Receives social security or railroad retirement benefits, 1. Employment status or is not in school, is between 19 and 59, and is not a major activity = unable widow with a dependent child; pl, receives social security, to work. is in school, and is between 23 and 59.
2. Receives welfarelpublic assistance, is not separated, 2. Work < 35 hours and widowed, or divorced, does not have dependent children, reason for part-time work and was either employed or out of the labor force or both = own illness or reason the entire year. for part-year work =
own illness.
3. Receives income from unemployment compensation, 3. Have job, but not workers' compensation, government employee pension, or working and reason not veterans* benefits; and (a) reports their major employment working is own illness. status is unable to work or (b) who report they are unable to work at all or only part-year due to illness; and they were never unemployed during the year and did not hold a government job.
4. Veterans' disability benefits: Receives unearned income from unemployment compensation, workers' compensation, government employee pension, or veterans* benefits; is a veteran; and was not unemployed, in school, or a government worker.
1. Receives social security or railroad retirement benefits, is 1. Employment status or not in school, is between 19 and 59, and is not a widow major activity = unable with a dependent child. Those 23 and over may be in to work. school.
2. Receives welfarelpublic assistance; is not separated, 2. Work < 35 hours and widowed, or divorced; does not have dependent children; reason for part-time and was employed or out of the labor force or both during work = own illness or the entire year. reason for part-year work
= own illness.
3. Receives workers* compensation. 3. Have job, but not working and reason not working is own illness.
4. Receives veterans' disability benefits, is a veteran, and is not in school.
(table continues)

TABLE A.l (continued)
Year Program Participation Work Limitations
1976, 1980, 1. Receives social security or railroad retirement benefits, is 1. Employment status or 1982, 1984, not in school, is between 19 and 59, and is not a widow major activity = unable
and 1988 with a dependent child. Those 23-59 may be in school. to work.
2. Receives SSI.
3. Receives workers' compensation.
2. Work < 35 hours and reason for part-time work = own illness or reason for part-year work = own illness.
3. Have job, but not working and reason not working is own illness.
4. Receives veterans' disability benefits, is a veteran, and is not in school.
Note: For any of the given years, any individual in the CPS who fits any of the definitions, be it under "Program Participation" or "Work Limitations," we considered to have disabilities. Definitions are numbered in no particular order.

TABLE B.l
Percentage of the Working-Age Population with Disabilities and Their Likelihood of Receiving Government Transfers
Male Female Total Percentage Percentage Percentage
Percentage with Receiving Percentage with Receiving Percentage with Receiving Year Disabilities Transfers Disabilities Transfers Disabilities Transfers
Source: Authors' calculations based on Current Population Surveys, 1968-1988.
Note: See appendix A and Table A. 1 for definitions of the disabled.

27
TABLE B.2
Family Economic Well-Being of Men with Disabilities Relative to Men without Disabilities, by Education, 1967-1987
I. Wage Earnings of Men with Disabilities Relative to Wage Earnings of Men without Disabilities Less than high school .62 .67 .36 .46 .29 .30
High school degree .77 .75 .65 .62 .44 .64
More than high school .69 .85 .93 .70 .64 .72
11. Family Income of Men with Disabilities Relative to Family Income of Men without Disabilities Less than high school .78 .81 .78 .75 .70 .71
High school degree .88 .84 .84 .76 .69 .9 1
More than high school .78 .83 .89 .79 .75 .89
111. Wage Earnings of Men with Disabilities as a Share of Their Family Income Less than high school .55 .53 .28 .37 .24 .22
High school degree .59 .59 .47 .47 .38 .41
More than high school .51 .64 .65 .54 .52 -51
IV. Transfers as a Share of Family Income of Men with Disabilities Less than high school .13 .16 .30 .29 .34 .36
High school degree .10 .10 .20 .21 .25 .18
More than high school .08 .W .16 .18 .10 .17
V. Other Income (Primarily Spousal Earnings) as a Share of Family Income of Men with Disabilities Less than high school .32 .31 .42 .34 .42 .42
High school degree .3 1 .3 1 .33 .32 .37 .41
More than high school .41 .27 .29 .28 .38 .32
Source: Authors' calculations based on Current Population Surveys, 1968-1988.

TABLE B.3
Family Economic Well-Being of Men with Disabilities Relative to Men without Disabilities, by Race, 1967-1987
I. Wage Earnings of Men with Disabilities Relative to Wage Earnings of Men without Disabilities Nonwhite .55 .53 .47 .47 .25 .34
White .64 .78 .67 .59 .46 .53
11. Family Income of Men with Disabilities Relative to Family Income of Men without Disabilities Nonwhite .68 .64 1.05 .76 .55 .65
White .75 .83 .77 .73 .68 .78
III. Wage Earnings of Men with Disabilities as a Share of Their Family Income Nonwhite -48 .49 .25 .32 .24 .29
White .57 .40 .53 .49 .41 .41
IV. Transfers as a Share of Family Income of Men with Disabilities Nonwhite .17 .19 .26 .30 .35 .24
White .10 .10 .20 .2 1 .20 .22
V. Other Income (Primarily Spousal Earnings) as a Share of Family Income of Men with Disabilities Nonwhite .35 .32 .39 .38 .41 .47
White .33 .30 .27 .30 .39 .37
Source: Authors' calculations based on Current Population Surveys, 1968-1988.

29
Endnotes
'For a fuller discussion of disability policy in the United States through the 1970s, see Burkhauser
and Haveman (1982).
?For a fuller discussion of the change in government disability policy in the early 1980s, see
Burkhauser and Hirvonen (1989).
3References to legally enforceable civil rights for people with disabilities can be traced at least
back to the 1920s but the most significant piece of federal legislation in this regard was the
Rehabilitation Act of 1973. The Americans with Disabilities Act of 1990 (ADA) has dramatically
expanded that Act. Here, we explore who is likely to benefit in a financial sense from the passage of
this Act, and indicate the incidence of the gains for diverse groups within the population with
disabilities, rather than the broader legal aspects of civil rights that are a part of the rationale for the
ADA.
41n this analysis, we concentrate on the wage earnings of men with disabilities and the economic
well-being of their families. But as we show in Appendix Table B. 1, 8 percent of the female
working-age population had disabilities in 1988, the most recent year of our data. Hence, disabilities
and their economic consequences are not restricted to males. Haveman and Wolfe (1987) report that
the earnings patterns for women with disabilities compared to women without disabilities differ from
the patterns for males with and without disabilities. The income sources of their families also differ
from those of men with and without disabilities. In particular, the contribution of spousal income to
total family income is higher for women with disabilities than for men with disabilities. This is so for
two reasons: first, fewer women with disabilities are covered by disability-related income transfer
programs, and second, husbands are more likely to work than wives, and their earnings when
30
working are likely to be higher. Over the period we have analyzed, the labor force participation rate
of women has increased substantially and the proportion of them who self-report disability conditions
has increased, as have their earnings as a proportion of family income. Detailed analysis of these
patterns is a topic for future research.
SThe public disability transfer system includes the Social Security Disability Insurance program,
Supplemental Security Income for the Disabled, Public Employees' Disability, Veterans' Disability,
and Workers' Compensation. In 1991, total expenditures on public programs targeted on persons
with disabilities totaled nearly $100 billion. This is about 10 percent of total federal, state, and local
expenditures on social welfare, or about 2.5 percent of the nation's personal income.
60Ur definition of the population of working-age people with disabilities is presented in Appendix
A, and includes both those who are receiving income from programs designed to assist such persons
and those who are working less than full-time and self-report that they are constrained in their ability
to work because of a health condition or impairment. For our analysis, we use microdata from the
Current Population Survey (CPS), an annual survey of over 50,000 American households.
'Given our definition of disability, the prevalence for women will be lower than that for men,
even though their level of "true" disability may equal that for men. While men and women are about
equally likely to receive SSI or Medicaid, women are less likely to receive DI benefits. Women who
have not established a sufficiently long work history to make them eligible for DI benefits will not be
observed as transfer program beneficiaries, and hence not included in the program participation
component of our definition.
'A recent report by the U.S. Bureau of the Census, Bennefield and McNeil (1989), presents
estimates of the disabled from 1981 through 1988, also using the CPS. Their disabled population is
made up of those persons less than age sixty-five who respond positively to the question "Do you
have a health problem or disability which prevents you from working or which limits the kind or

3 1
amount of work you can do" as well as those who report receiving SSI or Medicaid. The pattern over
time in the prevalence of disability by this definition is similar to that in Appendix Table B. 1, and the
prevalence rate for males presented in that report also exceeds that for females.
The Supplemental Security Income Program, begun in 1974, targets people with disabilities who
are also poor. Its predecessor was an amalgam of state-run programs consisting of Aid to the Aged,
Blind, and Disabled.
''See Haveman, Halberstadt, and Burkhauser (1984).
"See Weaver (1986).
'Wnlike several western European countries (e.g., Germany and Sweden), recent U.S. policy has
not used direct job creation or quotas to protect the incomes of disadvantaged workers in economic
downturns. While expansions of public jobs (Sweden) and quotas (Germany) were used in concert
with increases in income transfers in these countries during the recessions of the early 1980s, the
United States phased out the CETA program--the largest program of government-created jobs--and
restricted the generosity and accessibility of income support programs. The short-term hardships
caused by the resulting unemployment and income losses were viewed as the necessary price for a
more robust, supplydriven recovery that would yield longer-term gains for all workers.
'This increase would appear to be the result of congressional action curtailing the reevaluation
power that the Social Security Administration exercised so vigorously in the early 1980s.
' m e low share of family income accounted for by public transfers for the most highly educated
group of men with disabilities in 1981 (10 percent) is revealing. That group was the primary target
of the eligibility reviews of 1981--those disabled with some college education faced a higher hurdle in
demonstrating that they were "totally and permanently disabled" than did those with less education.
By 1987, most of those found ineligible were again reinstated, and this too is seen in the data.

References
Bennefield, Robert L. and McNeil, John M. 1989. "Labor Force Status and Other Characteristics of Persons with Work Disabilities, 1981 to 1988." Current Population Reports, Special Series No. 160, p. 23. U.S. Department of Commerce, Bureau of the Census, Washington, D.C.
Burkhauser, Richard V. and Haveman, Robert H. 1982. Disability and Work: 2he Economics of American Policy. Baltimore: Johns Hopkins University Press.
Burkhauser, Richard V. and Hirvonen, Petri. 1989. "United States Policy in a Time of Economic Crisis: A Comparison with Sweden and the Federal Republic of Germany." 2he Milbank Quarterly Vol. 67, Suppl. 2, Pt 1: 166-194.
Haveman, Robert H., Halberstadt, Victor, and Burkhauser, Richard V. 1984. Public Policy Toward Disabled Workers: A Cross-National Comparison of Economic Impacts. Ithaca, N.Y .: Cornell University Press.
Haveman, Robert H., and Wolfe, Barbara L. 1987. "The Disabled from 1962 to 1984: Trends in Number, Composition and Well-Being." Institute for Research on Poverty Special Report #44, University of Wisconsin-Madison.
1990. "The Economic Well-Being of the Disabled, 1962-1984." Journal of Human Resources Vol. 25, No. 1: 32-54.
U.S . Department of Health and Human Services. 1989. Annual Statistical Supplement of the Social Securiry Bulletin. Washington, D.C.
Weaver, Caroline L. 1986. "Social Security Disability Policy in the 1980s and Beyond." In Disability and the Labor Market: Economic Problems, Policy and Programs, ed. Monroe Berkowitz and M. Ann Hill. Ithaca, N.Y. : RLR Press, 2943.
Wolfe, Barbara L. and Haveman, Robert H. 1990. "Trends in the Prevalence of Disability 1962- 1984." 2he Milbank Quarterly, Vol. 68, No.1: 53-80.