full year 2018 results - investor.pandora.net
TRANSCRIPT

Full Year 2018 ResultsInvestor Presentation
1 | PANDORA INVESTOR PRESENTATION | FY 2018
2
Disclaimer
Certain statements in this presentation constitute forward-looking statements. Forward-looking statements are statements(other than statements of historical fact) relating to futureevents and our anticipated or planned financial and operationalperformance. The words “targets,” “believes,” “expects,”“aims,” “intends,” “plans,” “seeks,” “will,” “may,” “might,”“anticipates,” “would,” “could,” “should,” “continues,”“estimates” or similar expressions or the negatives thereof,identify certain of these forward-looking statements. Otherforward-looking statements can be identified in the context inwhich the statements are made. Forward-looking statementsinclude, among other things, statements addressing matterssuch as our future results of operations; our financial condition;our working capital, cash flows and capital expenditures; andour business strategy, plans and objectives for future operationsand events, including those relating to our ongoing operationaland strategic reviews, expansion into new markets, futureproduct launches, points of sale and production facilities; and
Although we believe that the expectations reflected in theseforward-looking statements are reasonable, such forward-looking statements involve known and unknown risks,uncertainties and other important factors that could cause ouractual results, performance or achievements or industry results,to differ materially from any future results, performance orachievements expressed or implied by such forward-lookingstatements. Such risks, uncertainties and other importantfactors include, among others: global and local economic
conditions; changes in market trends and end-consumerpreferences; fluctuations in the prices of raw materials, currencyexchange rates, and interest rates; our plans or objectives forfuture operations or products, including our ability to introducenew jewellery and non-jewellery products; our ability to expandin existing and new markets and risks associated with doingbusiness globally and, in particular, in emerging markets;competition from local, national and international companies inthe United States, Australia, Germany, the United Kingdom andother markets in which we operate; the protection andstrengthening of our intellectual property rights, includingpatents and trademarks; the future adequacy of our currentwarehousing, logistics and information technology operations;changes in Danish, E.U., Thai or other laws and regulations orany interpretation thereof, applicable to our business; increasesto our effective tax rate or other harm to our business as a resultof governmental review of our transfer pricing policies,conflicting taxation claims or changes in tax laws; and otherfactors referenced to in this presentation.
Should one or more of these risks or uncertainties materialise,or should any underlying assumptions prove to be incorrect, ouractual financial condition, cash flows or results of operationscould differ materially from that described herein as anticipated,believed, estimated or expected.
We do not intend, and do not assume any obligation, to updateany forward-looking statements contained herein, except as
may be required by law or the rules of Nasdaq Copenhagen. Allsubsequent written and oral forward-looking statementsattributable to us or to persons acting on our behalf areexpressly qualified in their entirety by the cautionary statementsreferred to above and contained elsewhere in this presentation.
| PANDORA INVESTOR PRESENTATION | FY 2018

3 | PANDORA INVESTOR PRESENTATION | FY 2018
Full year & Q4 2018 highlights
Programme NOW
Full year 2019 guidance
>
Agenda of today

4
Key highlights
| PANDORA INVESTOR PRESENTATION | FY 2018
Programme NOW to restore sustainable growth and support industry-leading margins
• A 2-year comprehensive roadmap with 4 major next steps
o Commercial reset
o Reignite a Passion for Pandora
o Reduce costs
o Implement new ways of working
2018 results within latest guidance
• 3% revenue growth in local currency and EBITDA margin of 32.5%
5
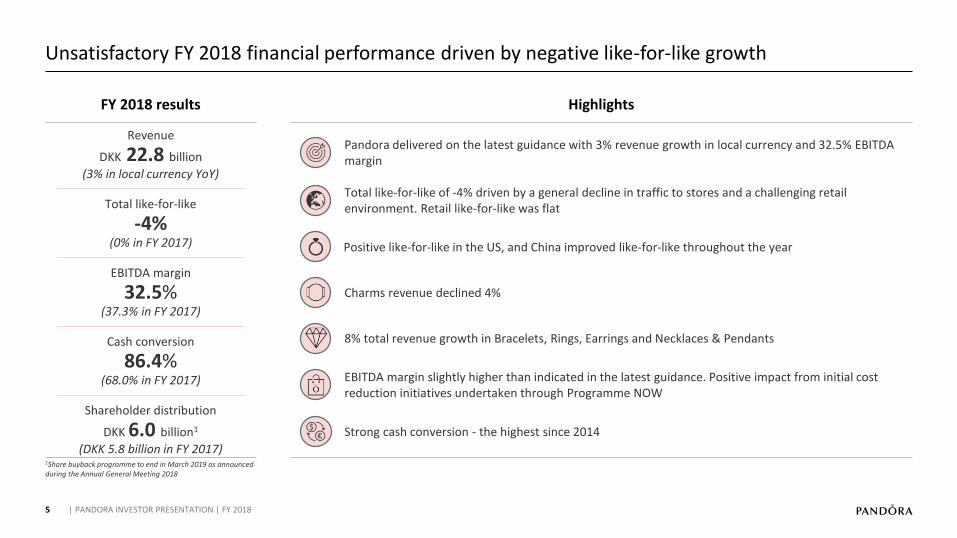
Unsatisfactory FY 2018 financial performance driven by negative like-for-like growth
Revenue
DKK 22.8 billion
(3% in local currency YoY)
EBITDA margin
32.5%(37.3% in FY 2017)
Total like-for-like
-4%(0% in FY 2017)
FY 2018 results Highlights
Cash conversion
86.4%(68.0% in FY 2017)
Shareholder distribution
DKK 6.0 billion1
(DKK 5.8 billion in FY 2017)1Share buyback programme to end in March 2019 as announced during the Annual General Meeting 2018
Total like-for-like of -4% driven by a general decline in traffic to stores and a challenging retail environment. Retail like-for-like was flat
Charms revenue declined 4%
Strong cash conversion - the highest since 2014
8% total revenue growth in Bracelets, Rings, Earrings and Necklaces & Pendants
EBITDA margin slightly higher than indicated in the latest guidance. Positive impact from initial cost reduction initiatives undertaken through Programme NOW
Pandora delivered on the latest guidance with 3% revenue growth in local currency and 32.5% EBITDA margin
Positive like-for-like in the US, and China improved like-for-like throughout the year
| PANDORA INVESTOR PRESENTATION | FY 2018
6
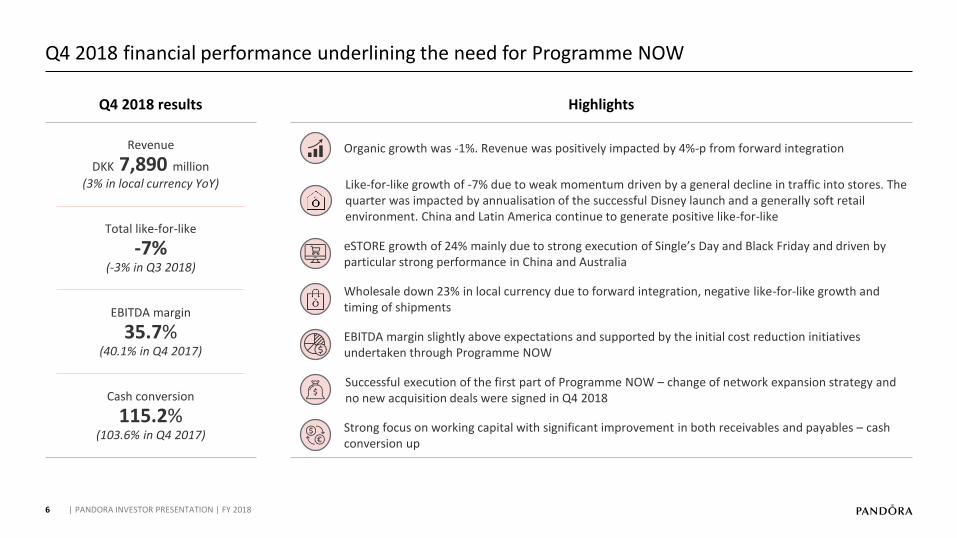
Q4 2018 financial performance underlining the need for Programme NOW
Revenue
DKK 7,890 million
(3% in local currency YoY)
EBITDA margin
35.7%(40.1% in Q4 2017)
Total like-for-like
-7%(-3% in Q3 2018)
Q4 2018 results Highlights
Cash conversion
115.2%(103.6% in Q4 2017)
Organic growth was -1%. Revenue was positively impacted by 4%-p from forward integration
Strong focus on working capital with significant improvement in both receivables and payables – cash conversion up
Wholesale down 23% in local currency due to forward integration, negative like-for-like growth and timing of shipments
Like-for-like growth of -7% due to weak momentum driven by a general decline in traffic into stores. The quarter was impacted by annualisation of the successful Disney launch and a generally soft retail environment. China and Latin America continue to generate positive like-for-like
eSTORE growth of 24% mainly due to strong execution of Single’s Day and Black Friday and driven by particular strong performance in China and Australia
EBITDA margin slightly above expectations and supported by the initial cost reduction initiatives undertaken through Programme NOW
Successful execution of the first part of Programme NOW – change of network expansion strategy and no new acquisition deals were signed in Q4 2018
| PANDORA INVESTOR PRESENTATION | FY 2018

7
Network expansion and acquisitions were the main contributors to 3% growth in Q4
CommentaryRevenue growth of 3% in local currency in Q4 2018
DKK million, %-p revenue growthForward integration contributed around 4%-p growth
• Primarily in EMEA, driven by Ireland, the UK and Italy
Organic growth of -1% impacted by negative like-for-like partly offset
by network expansion
• 259 new concept stores added to the network in the last 12 months
• Total like-for-like of -7% driven by a decrease in traffic across
markets
• Pandora continued to reduce the number of other points of sale –
revenue down 41% in Q4
~0.5%
Like-for-likeQ4 2017,reported revenue
~4%
Forward integration
FX Q4 2018,reported revenue
~-7%
~-1%
Network expansion
~6%
7,890
7,603
Q4 2018,Local
currency
Timing of shipments
& other
+3%
| PANDORA INVESTOR PRESENTATION | FY 2018
8
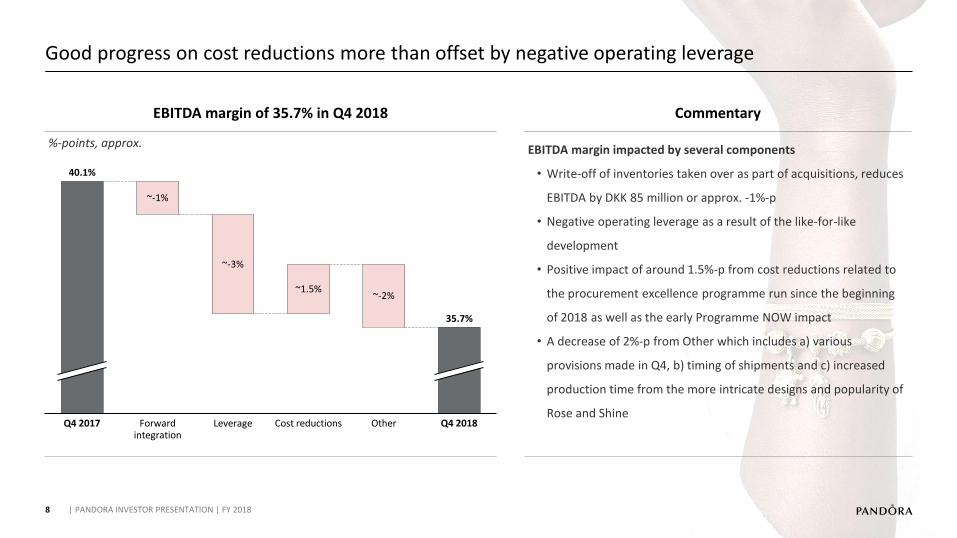
Good progress on cost reductions more than offset by negative operating leverage
Commentary
EBITDA margin impacted by several components
• Write-off of inventories taken over as part of acquisitions, reduces
EBITDA by DKK 85 million or approx. -1%-p
• Negative operating leverage as a result of the like-for-like
development
• Positive impact of around 1.5%-p from cost reductions related to
the procurement excellence programme run since the beginning
of 2018 as well as the early Programme NOW impact
• A decrease of 2%-p from Other which includes a) various
provisions made in Q4, b) timing of shipments and c) increased
production time from the more intricate designs and popularity of
Rose and Shine
EBITDA margin of 35.7% in Q4 2018
Q4 2017
35.7%
~-1%
Forward integration
~-3%
Leverage
~1.5%
Cost reductions
~-2%
Other Q4 2018
40.1%
%-points, approx.
| PANDORA INVESTOR PRESENTATION | FY 2018

9
Continued strong cash conversion – highest since 2014
Cash conversion
68.0%
86.4%
FY 2017 FY 2018
5.0%
6.1%
CAPEX(% of revenue)
0.6x
NIBD to EBITDA
0.8x
Strong cash conversion of 86% Commentary
• Strong cash conversion of 86% mainly attributable to the tightening of
supplier payment terms
• Payables improved significantly due to tighter payment policy
• Trade receivables down in line with the channel shift - DSO stable
compared with Q4 2017
• Inventories increased compared with Q4 2017 due to the addition
of 366 Pandora owned concept stores and a higher average cost
price per unit
• CAPEX in line with guidance of around 5% of revenue or DKK 1.1 billion
Working capital reduced by 2% of revenue
Working capital
13.1%11.2%
FY 2017 FY 2018
Trade payablesTrade receivables Inventories
12.0%
8.6%7.2% -7.4%
-9.9%
13.8%
%, last 12 months rolling revenue
| PANDORA INVESTOR PRESENTATION | FY 2018

10
Full year & Q4 2018 highlights
Programme NOW
Full year 2019 guidance
>
| PANDORA INVESTOR PRESENTATION | FY 2018
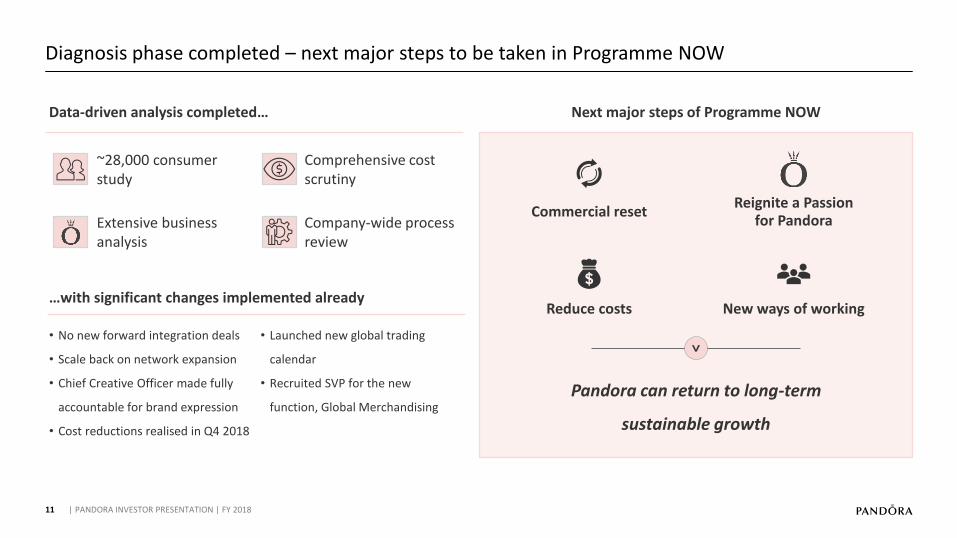
Pandora can return to long-term
sustainable growth
11
Diagnosis phase completed – next major steps to be taken in Programme NOW
~28,000 consumerstudy
Data-driven analysis completed…
…with significant changes implemented already
Extensive business analysis
Comprehensive cost scrutiny
Company-wide process review
Next major steps of Programme NOW
Commercial resetReignite a Passion
for Pandora
Reduce costs New ways of working
>• No new forward integration deals
• Scale back on network expansion
• Chief Creative Officer made fully
accountable for brand expression
• Cost reductions realised in Q4 2018
• Launched new global trading
calendar
• Recruited SVP for the new
function, Global Merchandising
| PANDORA INVESTOR PRESENTATION | FY 2018
12
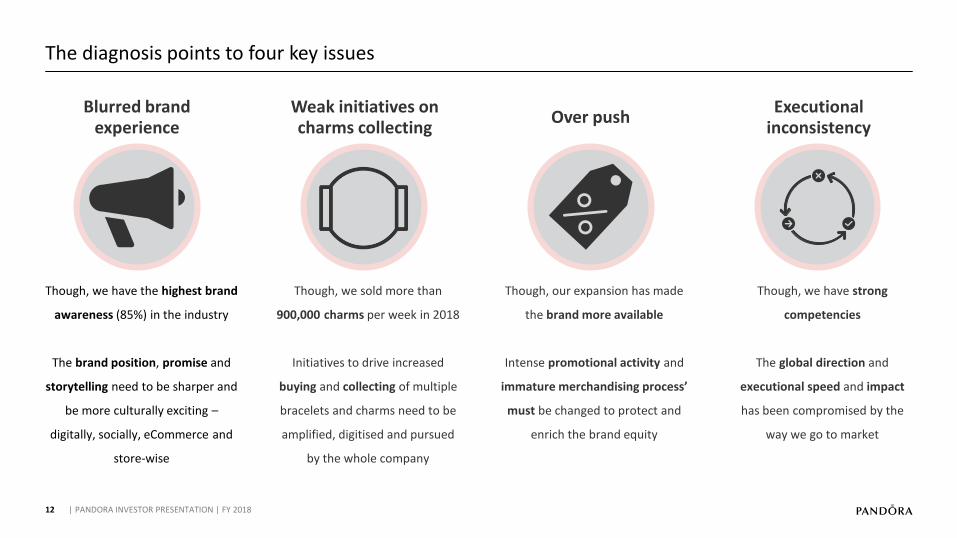
The diagnosis points to four key issues
Over pushBlurred brand
experienceExecutional
inconsistencyWeak initiatives oncharms collecting
Though, our expansion has made
the brand more available
Intense promotional activity and
immature merchandising process’
must be changed to protect and
enrich the brand equity
Though, we have the highest brand
awareness (85%) in the industry
The brand position, promise and
storytelling need to be sharper and
be more culturally exciting –
digitally, socially, eCommerce and
store-wise
Though, we sold more than
900,000 charms per week in 2018
Initiatives to drive increased
buying and collecting of multiple
bracelets and charms need to be
amplified, digitised and pursued
by the whole company
Though, we have strong
competencies
The global direction and
executional speed and impact
has been compromised by the
way we go to market
| PANDORA INVESTOR PRESENTATION | FY 2018
Note: A big thank you to all our consumers who let us use your personal pictures
13
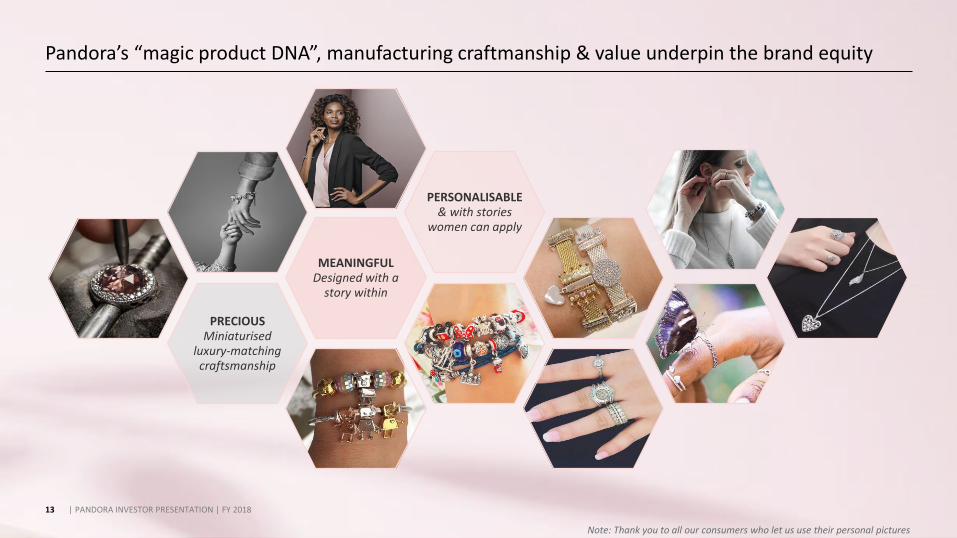
Pandora’s “magic product DNA”, manufacturing craftmanship & value underpin the brand equity
Note: Thank you to all our consumers who let us use their personal pictures
PRECIOUSMiniaturised
luxury-matching craftsmanship
MEANINGFULDesigned with a
story within
PERSONALISABLE& with stories
women can apply
| PANDORA INVESTOR PRESENTATION | FY 2018
14
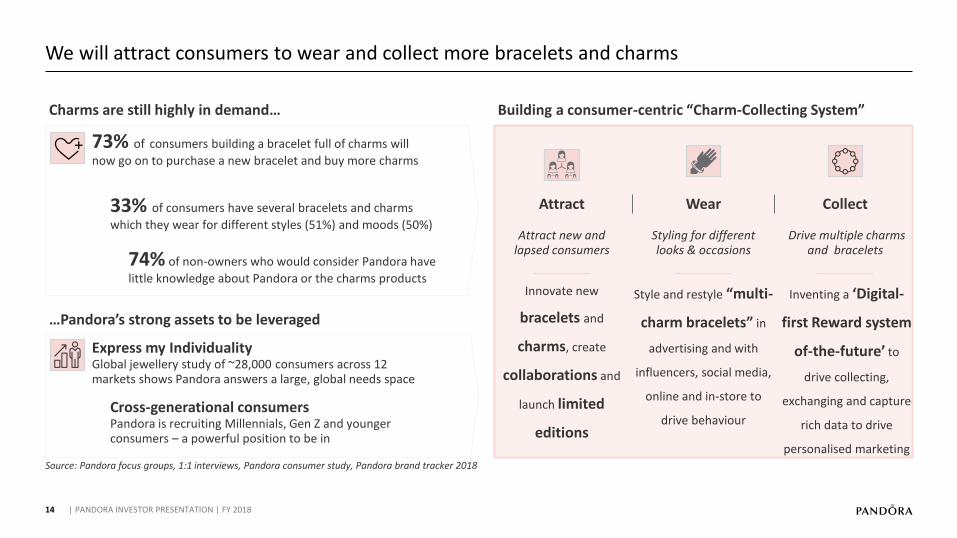
We will attract consumers to wear and collect more bracelets and charms
Source: Pandora focus groups, 1:1 interviews, Pandora consumer study, Pandora brand tracker 2018
Charms are still highly in demand… Building a consumer-centric “Charm-Collecting System”
73% of consumers building a bracelet full of charms will
now go on to purchase a new bracelet and buy more charms
33% of consumers have several bracelets and charms
which they wear for different styles (51%) and moods (50%)
Express my IndividualityGlobal jewellery study of ~28,000 consumers across 12 markets shows Pandora answers a large, global needs space
74% of non-owners who would consider Pandora have
little knowledge about Pandora or the charms products
Cross-generational consumersPandora is recruiting Millennials, Gen Z and younger consumers – a powerful position to be in
…Pandora’s strong assets to be leveraged
Style and restyle “multi-
charm bracelets” in
advertising and with
influencers, social media,
online and in-store to
drive behaviour
Inventing a ‘Digital-
first Reward system
of-the-future’ to
drive collecting,
exchanging and capture
rich data to drive
personalised marketing
Innovate new
bracelets and
charms, create
collaborations and
launch limited
editions
Attract new andlapsed consumers
Styling for different looks & occasions
Drive multiple charms and bracelets
Attract Wear Collect
| PANDORA INVESTOR PRESENTATION | FY 2018
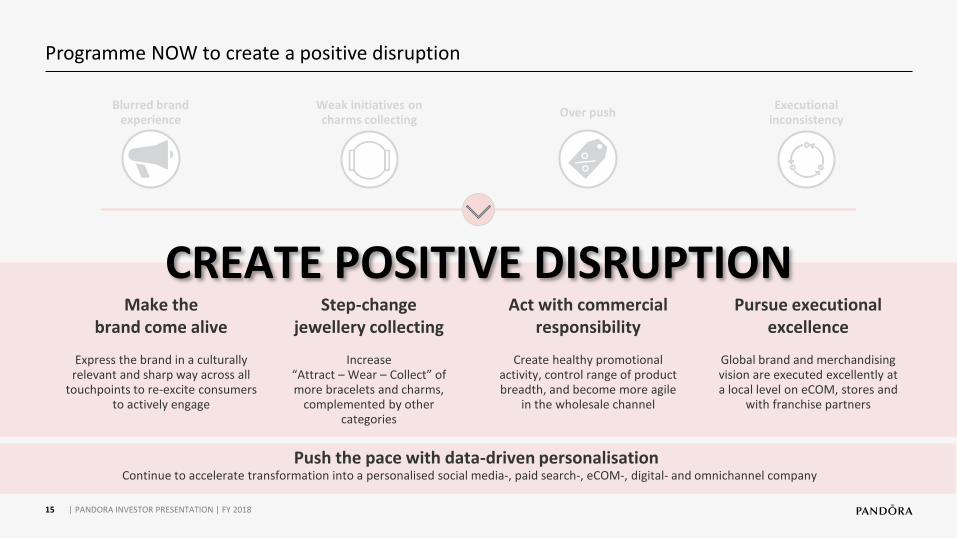
Make thebrand come alive
Express the brand in a culturally relevant and sharp way across all
touchpoints to re-excite consumers to actively engage
15
Programme NOW to create a positive disruption
Step-changejewellery collecting
Increase “Attract – Wear – Collect” of more bracelets and charms,
complemented by other categories
Act with commercial responsibility
Create healthy promotional activity, control range of product breadth, and become more agile
in the wholesale channel
Pursue executional excellence
Global brand and merchandising vision are executed excellently at a local level on eCOM, stores and
with franchise partners
Over pushBlurred brand
experienceExecutional
inconsistencyWeak initiatives oncharms collecting
CREATE POSITIVE DISRUPTION
Push the pace with data-driven personalisationContinue to accelerate transformation into a personalised social media-, paid search-, eCOM-, digital- and omnichannel company
| PANDORA INVESTOR PRESENTATION | FY 2018
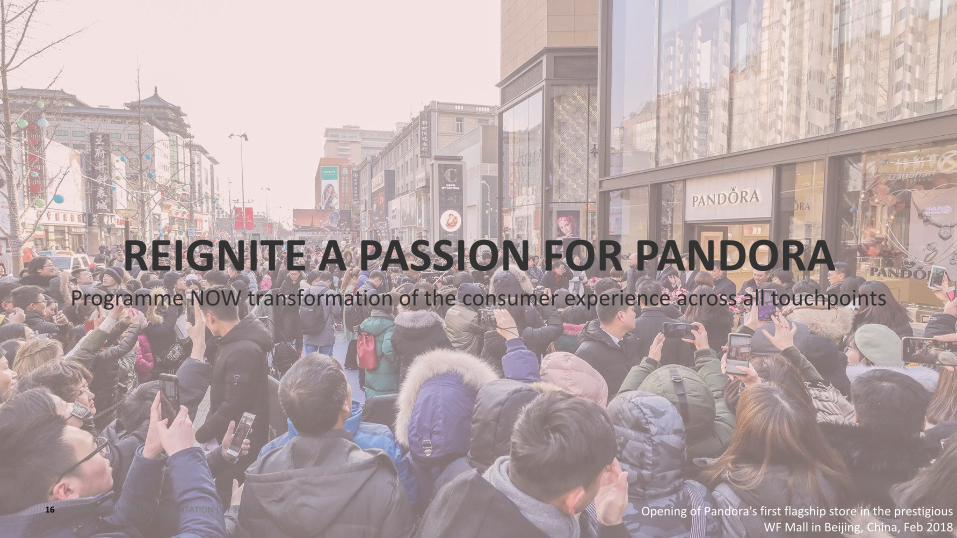
REIGNITE A PASSION FOR PANDORAProgramme NOW transformation of the consumer experience across all touchpoints
16 Opening of Pandora's first flagship store in the prestigious WF Mall in Beijing, China, Feb 2018
| PANDORA INVESTOR PRESENTATION | FY 2018
17
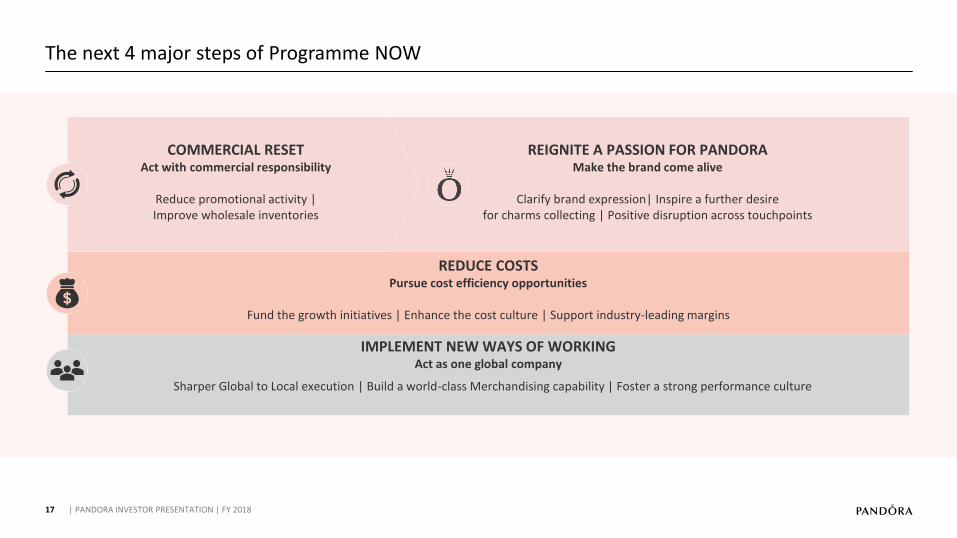
The next 4 major steps of Programme NOW
REIGNITE A PASSION FOR PANDORAMake the brand come alive
Clarify brand expression| Inspire a further desirefor charms collecting | Positive disruption across touchpoints
IMPLEMENT NEW WAYS OF WORKINGAct as one global company
Sharper Global to Local execution | Build a world-class Merchandising capability | Foster a strong performance culture
REDUCE COSTSPursue cost efficiency opportunities
Fund the growth initiatives | Enhance the cost culture | Support industry-leading margins
COMMERCIAL RESETAct with commercial responsibility
Reduce promotional activity | Improve wholesale inventories
| PANDORA INVESTOR PRESENTATION | FY 2018

18
A 2-year transformation journey
“BIGGER & BETTER”
Q4 2019
COMMERCIAL RESET
Today 2020
20TH ANNIVERSARY
COMMERCIAL RESET
REIGNITE A PASSION FOR PANDORA
REDUCE COSTS
IMPLEMENT NEW WAYS OF WORKING
| PANDORA INVESTOR PRESENTATION | FY 2018
19
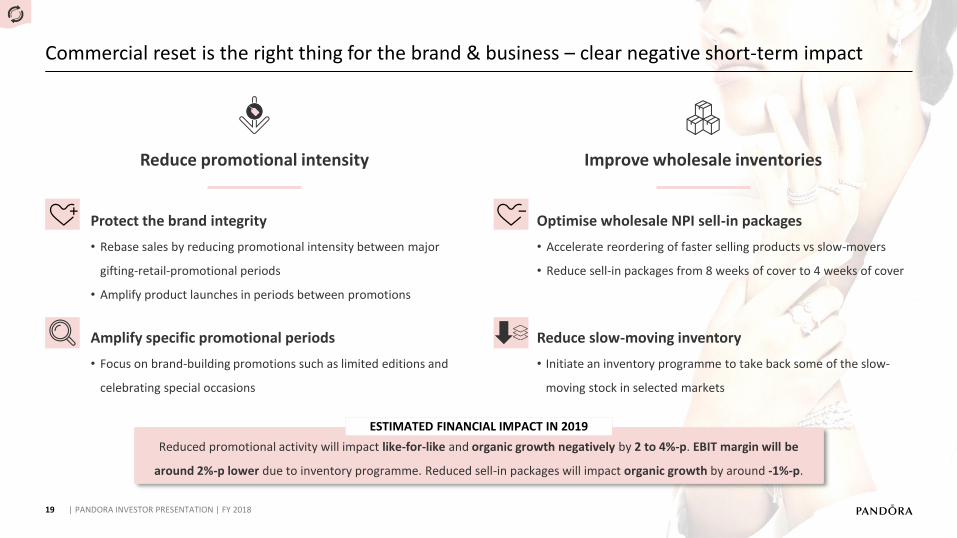
Commercial reset is the right thing for the brand & business – clear negative short-term impact
Protect the brand integrity
• Rebase sales by reducing promotional intensity between major
gifting-retail-promotional periods
• Amplify product launches in periods between promotions
Amplify specific promotional periods
• Focus on brand-building promotions such as limited editions and
celebrating special occasions
Reduce promotional intensity Improve wholesale inventories
Optimise wholesale NPI sell-in packages
• Accelerate reordering of faster selling products vs slow-movers
• Reduce sell-in packages from 8 weeks of cover to 4 weeks of cover
Reduce slow-moving inventory
• Initiate an inventory programme to take back some of the slow-
moving stock in selected markets
Reduced promotional activity will impact like-for-like and organic growth negatively by 2 to 4%-p. EBIT margin will be
around 2%-p lower due to inventory programme. Reduced sell-in packages will impact organic growth by around -1%-p.
ESTIMATED FINANCIAL IMPACT IN 2019
| PANDORA INVESTOR PRESENTATION | FY 2018

20
How the initiatives of Reignite a Passion for Pandora will unfold
WHERE WE ARE NOW HOW IT WILL UNFOLD TOWARDS CONSUMERSAREA
BRAND1• New brand promise, brand visual identity, digital and
communication being developedLaunch of new brand communication/social platform (both strategic and disruptive) towards the end of 2019
>
MEDIA MARKETING
3• Econometric modelling and personalisation testing to
validate elasticities and upper/lower funnel recruitment
Increase media spend to amplify content (Q4 2019) with progressively improved targeting of new/lapsed customers
>
STORES5• New store design in development to improve
merchandising, navigation and inspirationLaunch of new store design in pilot stores, for progressive roll-out
>
eCOMMERCE, DATA &
REWARD4
• Redesign of eCOM features and services, alongside US omnichannel roll-out - developing reward concept
An inspiring eCOM buying & brand experience with full omnichannel features and a reward concept to be piloted
>
PRODUCT2 • Development of products aligned with new brand promise alongside an assortment rationalising plan
Launch of a new charms bracelet platform strengthening entry price points and new products in each category
>
| PANDORA INVESTOR PRESENTATION | FY 2018
21
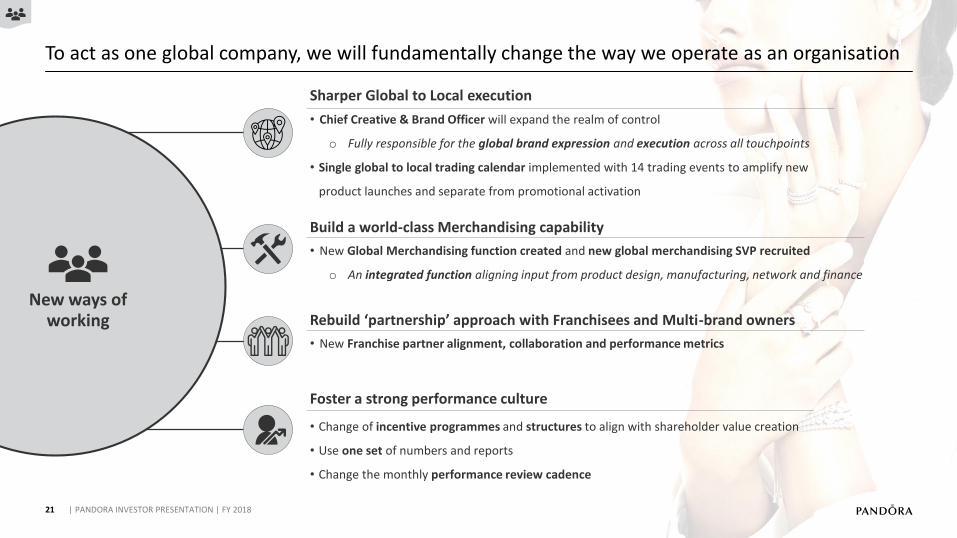
To act as one global company, we will fundamentally change the way we operate as an organisation
New ways of working
Sharper Global to Local execution
Build a world-class Merchandising capability
Foster a strong performance culture
• Chief Creative & Brand Officer will expand the realm of control
o Fully responsible for the global brand expression and execution across all touchpoints
• Single global to local trading calendar implemented with 14 trading events to amplify new
product launches and separate from promotional activation
• New Global Merchandising function created and new global merchandising SVP recruited
o An integrated function aligning input from product design, manufacturing, network and finance
• Change of incentive programmes and structures to align with shareholder value creation
• Use one set of numbers and reports
• Change the monthly performance review cadence
Rebuild ‘partnership’ approach with Franchisees and Multi-brand owners
• New Franchise partner alignment, collaboration and performance metrics
| PANDORA INVESTOR PRESENTATION | FY 2018

22
Significant cost reduction opportunities identified – DKK 1.2 billion or more than 5% of revenue
RUN RATE BY END 2020 (DKK billion)
0.3 to 0.4
0.25 to 0.35
0.1 to 0.2
0.2
COST LEVERS - examplesCOST CATEGORIES
Cost of sales
Retail expenses
Administrative expenses
IT
• Continuous improvement based on LEAN methods• New production techniques and re-engineering of existing products • Improve forecasting and thereby reduce re-melt costs• Reduce use of OEM/ODM suppliers and renegotiate contracts
• Optimise workforce planning and renegotiate lease agreements• Improve POS Material with focus on sustainability and customer experience• Reduce logistic cost per unit across both store and e-commerce channels
• Tighten travel policy • Right size support functions through a more global approach• Outsource selected functions and repetitive tasks to shared service centers
• Sourcing model - more insourcing and offshoring • Tendering of selected services• Global prioritisation and approach
Other 0.15 to 0.25
• Office footprint• Other employee expenses• Consultancy costs
| PANDORA INVESTOR PRESENTATION | FY 2018

23
What to expect in connection with the Q1 2019 announcement on 7 May, 2019
• Further deep-dive on the concrete future initiatives to
Reignite a Passion for Pandora
• Update on Programme NOW
• Initial impact from the Commercial reset
• Progress on the cost reductions and restructuring costs
incurred
| PANDORA INVESTOR PRESENTATION | FY 2018

24
Full year & Q4 2018 highlights
Programme NOW
Full year 2019 guidance>
| PANDORA INVESTOR PRESENTATION | FY 2018

25
Pandora changes guidance metrics to better align with value creation
1Organic growth is defined as total growth excl. impact from forward integration and M&A activities
Organic growth1
(previously total revenue growth in local currency)
EBIT margin(previously EBITDA margin)
• Strengthen focus on sustainable total like-for-like growth
• Exclude acquisitions from the core revenue KPI
• Focus on shareholder value creation
• Emphasise the focus on capital efficiency
• Improved transparency following the
implementation of IFRS 16
>
Change of guidance metrics is in effect as of today
| PANDORA INVESTOR PRESENTATION | FY 2018
26
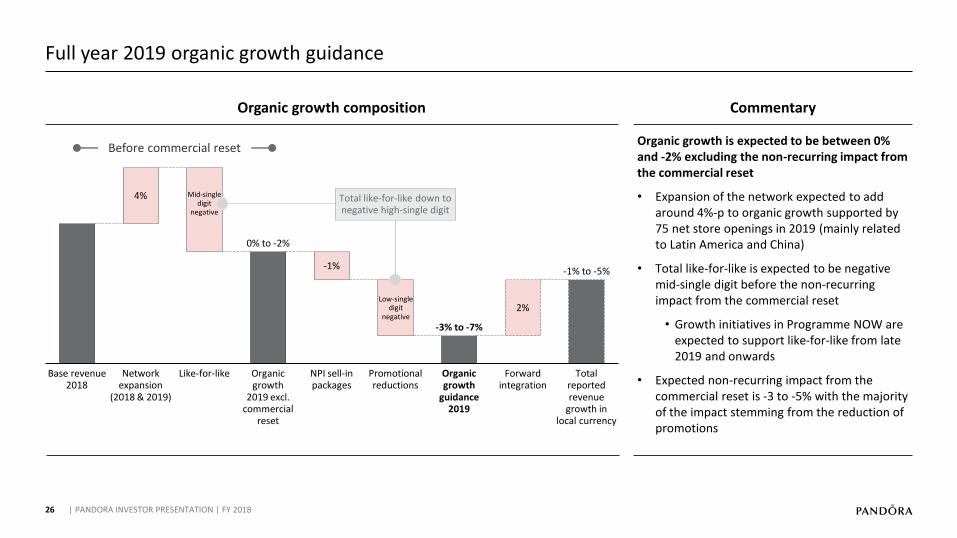
Full year 2019 organic growth guidance
Organic growth composition Commentary
Organic growth is expected to be between 0% and -2% excluding the non-recurring impact from the commercial reset
• Expansion of the network expected to add around 4%-p to organic growth supported by 75 net store openings in 2019 (mainly related to Latin America and China)
• Total like-for-like is expected to be negative mid-single digit before the non-recurring impact from the commercial reset
• Growth initiatives in Programme NOW are expected to support like-for-like from late 2019 and onwards
• Expected non-recurring impact from the commercial reset is -3 to -5% with the majority of the impact stemming from the reduction of promotions
Base revenue 2018
Organic growth
2019 excl. commercial
reset
4%
Promotional reductions
Network expansion
(2018 & 2019)
NPI sell-in packages
-3% to -7%
Like-for-like
-1%
Organic growth
guidance 2019
-1% to -5%
2%
Forward integration
Total reported revenue
growth in local currency
0% to -2%
Before commercial reset
Mid-single digit
negative
Low-single digit
negative
Total like-for-like down to negative high-single digit
| PANDORA INVESTOR PRESENTATION | FY 2018
27
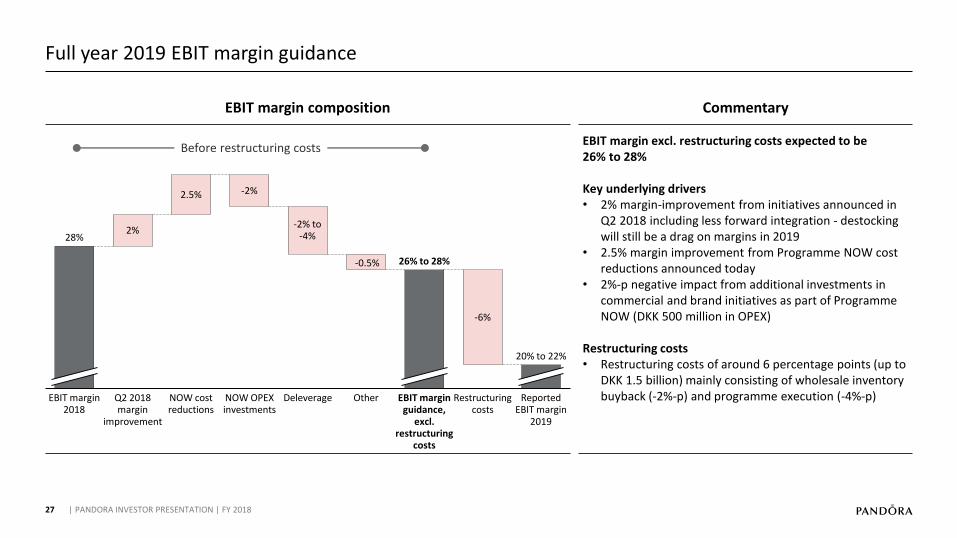
Full year 2019 EBIT margin guidance
EBIT margin composition Commentary
EBIT margin excl. restructuring costs expected to be26% to 28%
Key underlying drivers• 2% margin-improvement from initiatives announced in
Q2 2018 including less forward integration - destocking will still be a drag on margins in 2019
• 2.5% margin improvement from Programme NOW cost reductions announced today
• 2%-p negative impact from additional investments in commercial and brand initiatives as part of Programme NOW (DKK 500 million in OPEX)
Restructuring costs• Restructuring costs of around 6 percentage points (up to
DKK 1.5 billion) mainly consisting of wholesale inventory buyback (-2%-p) and programme execution (-4%-p)Restructuring
costsEBIT margin
2018EBIT margin
guidance, excl.
restructuring costs
28%
OtherDeleverageNOW OPEX investments
-2%
20% to 22%
NOW cost reductions
2.5%
Reported EBIT margin
2019
Q2 2018 margin
improvement
26% to 28%
2%
-6%
Before restructuring costs
-2% to-4%
-0.5%
| PANDORA INVESTOR PRESENTATION | FY 2018
28
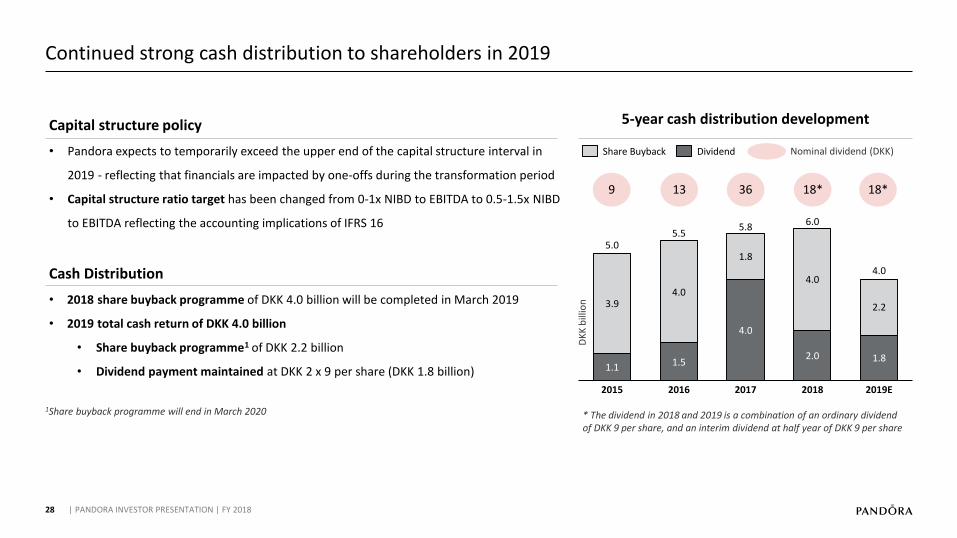
Continued strong cash distribution to shareholders in 2019
Capital structure policy
• Pandora expects to temporarily exceed the upper end of the capital structure interval in
2019 - reflecting that financials are impacted by one-offs during the transformation period
• Capital structure ratio target has been changed from 0-1x NIBD to EBITDA to 0.5-1.5x NIBD
to EBITDA reflecting the accounting implications of IFRS 16
Cash Distribution
• 2018 share buyback programme of DKK 4.0 billion will be completed in March 2019
• 2019 total cash return of DKK 4.0 billion
• Share buyback programme1 of DKK 2.2 billion
• Dividend payment maintained at DKK 2 x 9 per share (DKK 1.8 billion)
1Share buyback programme will end in March 2020
5-year cash distribution development
1.1 1.5
4.0
2.0 1.8
3.94.0
1.8
4.0
2.2
6.0
2015 20182016
5.8
2017 2019E
5.55.0
4.0
Share Buyback Dividend
9 13 36 18* 18*
Nominal dividend (DKK)
* The dividend in 2018 and 2019 is a combination of an ordinary dividend of DKK 9 per share, and an interim dividend at half year of DKK 9 per share
DK
K b
illio
n
| PANDORA INVESTOR PRESENTATION | FY 2018

29
The Pandora equity story: A turnaround opportunity with fundamentals intact
Pandora has strong assets to build on Return to sustainable growth and support industry-leading margins
Clear transformation
roadmap towards restoring
sustainable growth
Continued strong cash generation
during transformation
period
Attractive cash pay-out policy
Magic DNA of innovative products
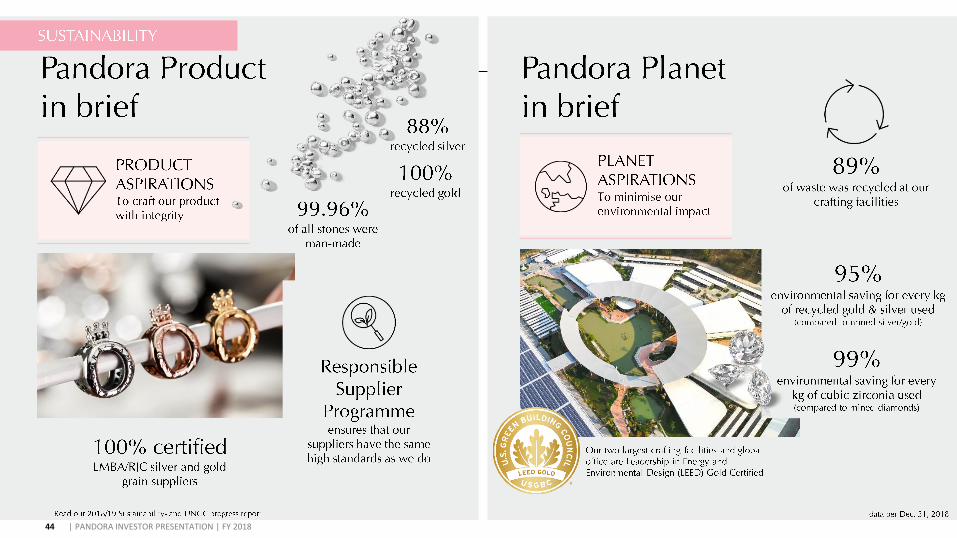
State-of-the art crafting facilities
Cross-generational brand with unmatched
recognition
Comprehensive global footprint across
touchpoints
Significant cost reduction potential
to be executed before the end of
2020
| PANDORA INVESTOR PRESENTATION | FY 2018

30
Q & A
| PANDORA INVESTOR PRESENTATION | FY 2018
31
APPENDIX
| PANDORA INVESTOR PRESENTATION | FY 2018

32
Pandora is the world’s most recognised jewellery brand
AIDED BRAND AWARENESS
JEWELLERY COMPANIES - AIDED BRAND AWARENESS
2010
36%
80%
67%
2011 2012 2013 2014 20182015 2016 2017
43%50%
83%
73%
63%
85%
77%71%
80%
64%
83% 85%
72%
63%
2017 20182017 20182017 20182017 2018
Source: Pandora Brand Tracker
| PANDORA INVESTOR PRESENTATION | FY 2018
33
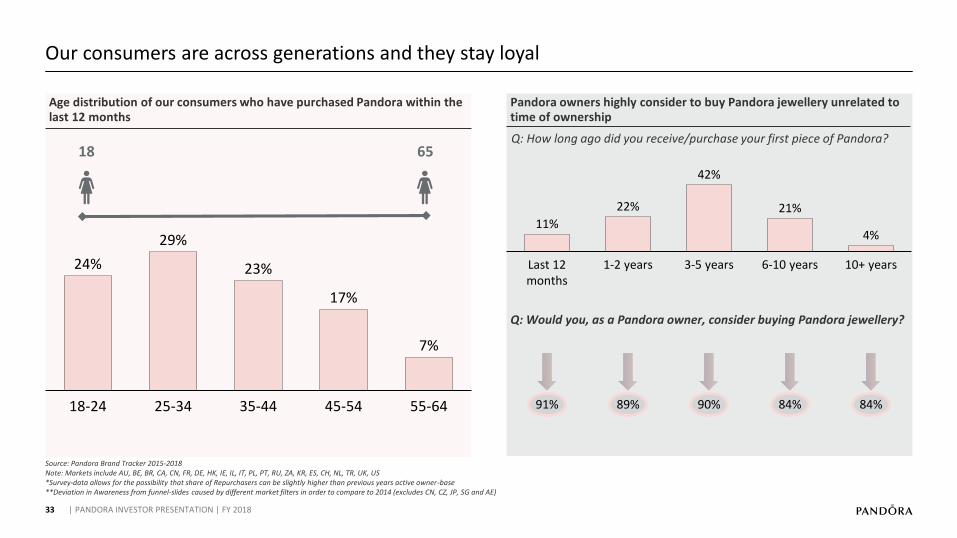
Our consumers are across generations and they stay loyal
10+ years
22%
Last 12 months
1-2 years 3-5 years 6-10 years
42%
11%4%
21%
Q: How long ago did you receive/purchase your first piece of Pandora?
Q: Would you, as a Pandora owner, consider buying Pandora jewellery?
84%89%91% 90% 84%
Pandora owners highly consider to buy Pandora jewellery unrelated to time of ownership
Source: Pandora Brand Tracker 2015-2018Note: Markets include AU, BE, BR, CA, CN, FR, DE, HK, IE, IL, IT, PL, PT, RU, ZA, KR, ES, CH, NL, TR, UK, US*Survey-data allows for the possibility that share of Repurchasers can be slightly higher than previous years active owner-base**Deviation in Awareness from funnel-slides caused by different market filters in order to compare to 2014 (excludes CN, CZ, JP, SG and AE)
55-6418-24
24%
25-34 45-54
23%
29%
35-44
17%
7%
18 65
Age distribution of our consumers who have purchased Pandora within the last 12 months
| PANDORA INVESTOR PRESENTATION | FY 2018
34
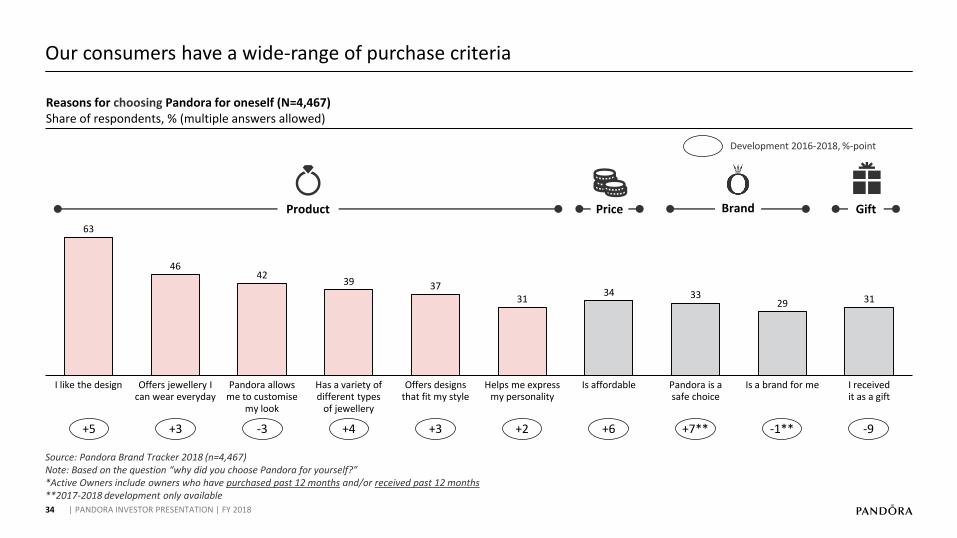
Our consumers have a wide-range of purchase criteria
63
4642
39 3731
34 3329 31
Is affordablePandora allows me to customise
my look
Offers jewellery I can wear everyday
I received it as a gift
I like the design Has a variety of different types
of jewellery
Pandora is a safe choice
Offers designs that fit my style
Helps me express my personality
Is a brand for me
Product Price Brand Gift
+5 +3 -3 +4 +3 +2 +6 +7** -1** -9
Development 2016-2018, %-point
Source: Pandora Brand Tracker 2018 (n=4,467)Note: Based on the question “why did you choose Pandora for yourself?”*Active Owners include owners who have purchased past 12 months and/or received past 12 months**2017-2018 development only available
Reasons for choosing Pandora for oneself (N=4,467)Share of respondents, % (multiple answers allowed)
| PANDORA INVESTOR PRESENTATION | FY 2018
35
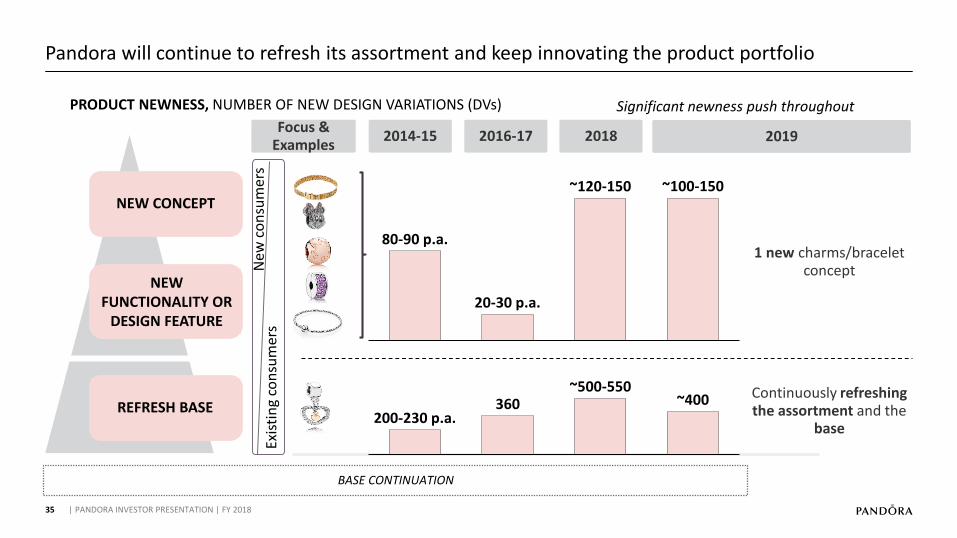
Pandora will continue to refresh its assortment and keep innovating the product portfolio
BASE CONTINUATION
NEW CONCEPT
NEW FUNCTIONALITY OR
DESIGN FEATURE
REFRESH BASE
2014-15 2016-17
PRODUCT NEWNESS, NUMBER OF NEW DESIGN VARIATIONS (DVs)
2018
80-90 p.a.
20-30 p.a.
~120-150 ~100-150
360200-230 p.a.
~500-550~400
Significant newness push throughout
Focus & Examples
Pic Sell-out % Pic Sell-out % Pic Sell-out % Pic Sell-out % Pic Sell-out %
1 17,6% 14,1% 14,4% 15,6% 18,4%
2 16,4% 13,7% 14,4% 11,2% 11,9%
3 16,3% 11,7% 10,6% 10,0% 9,6%
4 9,8% 10,8% 9,0% 9,0% 9,1%
5 9,5% 8,8% 8,2% 8,7% 8,9%
6 8,8% 7,9% 7,5% 8,7% 7,0%
7 8,5% 6,9% 6,3% 8,4% 6,7%
8 5,8% 5,9% 5,4% 8,2% 6,5%
9 4,4% 5,8% 5,1% 7,5% 4,8%
10 3,0% 5,3% 5,1% 3,8% 4,8%
Valentine's 2017Valentine's 2016Valentine's 2015Valentine's 2014Valentine's 2013
727 N/A
10
926 +37% 1208 -13% 1506 -7% 1462 -8%
13 171314
New
co
nsu
mer
sEx
isti
ng
con
sum
ers
2019
1 new charms/bracelet concept
Continuously refreshing the assortment and the
base
| PANDORA INVESTOR PRESENTATION | FY 2018

36
Pandora’s online business & presence
ONLINE PLATFORMSeSTORE DEVELOPMENT
24%REVENUE
GROWTH IN LC IN Q4 ‘18
13%REVENUE SHARE OF
GROUP REVENUE IN Q4 ‘18
20MARKETS
SINGLEDIGIT RETURN RATES
STRONG PROFITABILITY
DKK million
69 92 98
373
187 190 141
527
304 298 264
812
438 447 400
0
1
2
3
4
5
6
7
8
9
10
11
12
13
0
100
200
300
400
500
600
700
800
900
1,000
1,100
%
Q1 2015
7%
8%
3%
Q2 2015
3%
Q3 2015
Q4 2015
4%
Q1 2016
Q4 2018
4%
Q2 2016
3%
Q2 2017
2%
1,019
Q4 2016
6% 6%
Q1 2017
5%
Q3 2017
9%
11%
Q4 2017
Q1 2018
9%
Q2 2018
8%
Q3 2018
13%
Q3 2016
eSTORE revenueeSTORE % of Group Revenue Pandora eSTOREs available in 20 countries across all regions, incl. China (own and Tmall distribution), Australia, Hong Kong, Italy, the UK, the US etc.
More than 237 million visits on the Pandora eSTORE in 2018
More than 13 million Pandora club members worldwide
14.9 million Facebook followers
5.7 million followers on Instagram
| PANDORA INVESTOR PRESENTATION | FY 2018

37
Revenue development by sales channel and by product category
DKK million Q4 2018Growth, Q4/Q4,
LC
Q4 2018 share of revenue
FY 2018Growth, FY/FY,
LC
FY 2018 share of revenue
Pandora owned retail 4,930 28% 63% 12,895 35% 57%
- of which Pandora owned concept stores
4,727 31% 60% 12,269 36% 54%
- of which eSTORE 1,019 24% 13% 2,304 39% 10%
Wholesale 2,669 -23% 34% 8,633 -23% 38%
- of which franchise concept stores 1,614 -25% 21% 5,010 -23% 22%
Third-party distribution 291 -10% 4% 1,278 -15% 6%
Total revenue 7,890 3% 100% 22,806 3% 100%
DKK million Q4 2018GrowthQ4/Q4,
LC
Q4 2018 share of revenue
FY 2018Growth, FY/FY,
LC
Share ofrevenue FY
2018
Charms 4,081 -3% 52% 12,126 -4% 53%
Bracelets 1,584 18% 20% 4,393 13% 19%
Rings 1,078 4% 14% 3,168 3% 14%
Earrings 573 10% 7% 1,486 7% 7%
Necklaces & Pendants 574 14% 7% 1,633 27% 7%
Total revenue 7,890 3% 100% 22,806 3% 100%
Sales channeldevelopment
Product category
development
| PANDORA INVESTOR PRESENTATION | FY 2018
38
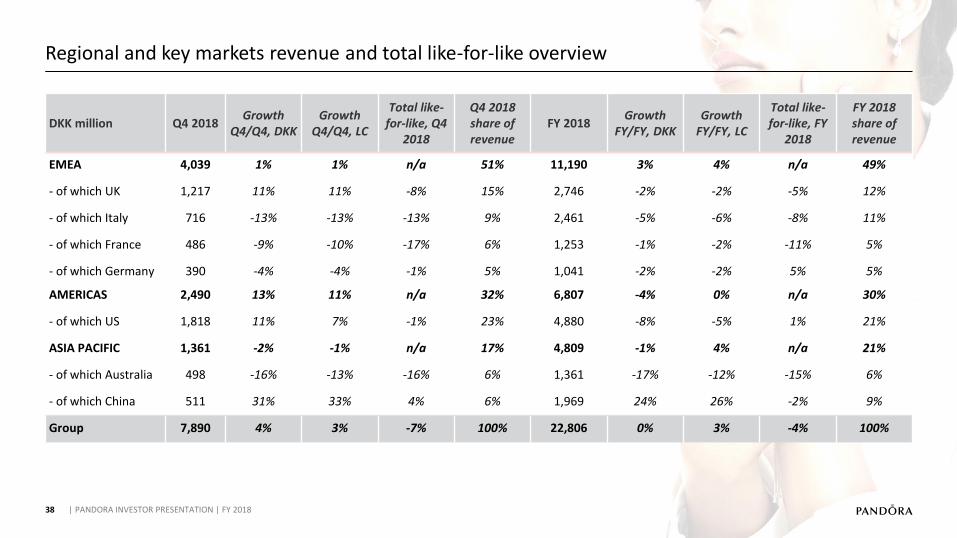
Regional and key markets revenue and total like-for-like overview
DKK million Q4 2018Growth
Q4/Q4, DKKGrowth
Q4/Q4, LC
Total like-for-like, Q4
2018
Q4 2018 share of revenue
FY 2018Growth
FY/FY, DKKGrowth
FY/FY, LC
Total like-for-like, FY
2018
FY 2018 share of revenue
EMEA 4,039 1% 1% n/a 51% 11,190 3% 4% n/a 49%
- of which UK 1,217 11% 11% -8% 15% 2,746 -2% -2% -5% 12%
- of which Italy 716 -13% -13% -13% 9% 2,461 -5% -6% -8% 11%
- of which France 486 -9% -10% -17% 6% 1,253 -1% -2% -11% 5%
- of which Germany 390 -4% -4% -1% 5% 1,041 -2% -2% 5% 5%
AMERICAS 2,490 13% 11% n/a 32% 6,807 -4% 0% n/a 30%
- of which US 1,818 11% 7% -1% 23% 4,880 -8% -5% 1% 21%
ASIA PACIFIC 1,361 -2% -1% n/a 17% 4,809 -1% 4% n/a 21%
- of which Australia 498 -16% -13% -16% 6% 1,361 -17% -12% -15% 6%
- of which China 511 31% 33% 4% 6% 1,969 24% 26% -2% 9%
Group 7,890 4% 3% -7% 100% 22,806 0% 3% -4% 100%
| PANDORA INVESTOR PRESENTATION | FY 2018
39
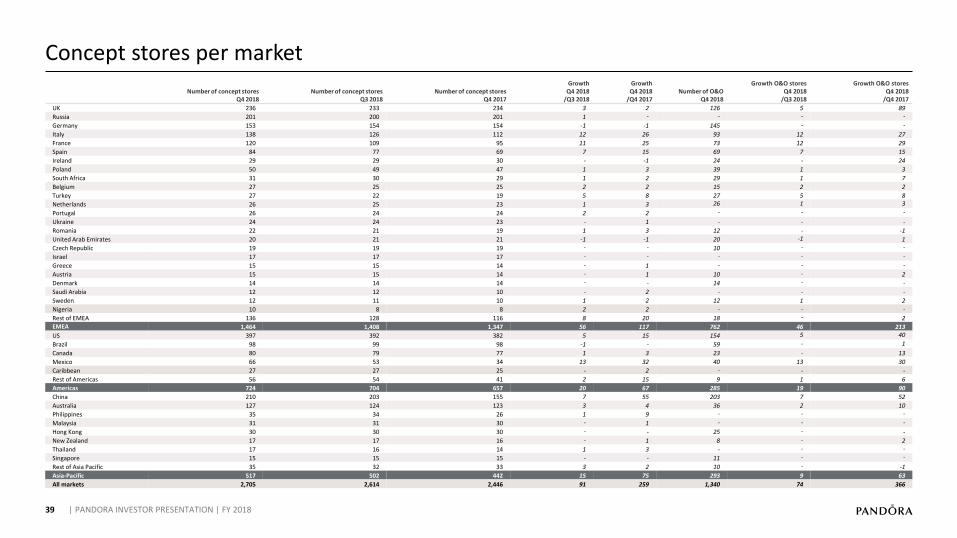
Concept stores per market
Number of concept stores Q4 2018
Number of concept stores Q3 2018
Number of concept storesQ4 2017
GrowthQ4 2018
/Q3 2018
Growth Q4 2018
/Q4 2017Number of O&O
Q4 2018
Growth O&O storesQ4 2018
/Q3 2018
Growth O&O storesQ4 2018
/Q4 2017
UK 236 233 234 3 2 126 5 89
Russia 201 200 201 1 - - - -
Germany 153 154 154 -1 -1 145 - -
Italy 138 126 112 12 26 93 12 27
France 120 109 95 11 25 73 12 29
Spain 84 77 69 7 15 69 7 15
Ireland 29 29 30 - -1 24 - 24
Poland 50 49 47 1 3 39 1 3
South Africa 31 30 29 1 2 29 1 7
Belgium 27 25 25 2 2 15 2 2
Turkey 27 22 19 5 8 27 5 8
Netherlands 26 25 23 1 3 26 1 3
Portugal 26 24 24 2 2 - - -
Ukraine 24 24 23 - 1 - - -
Romania 22 21 19 1 3 12 - -1
United Arab Emirates 20 21 21 -1 -1 20 -1 1
Czech Republic 19 19 19 - - 10 - -
Israel 17 17 17 - - - - -
Greece 15 15 14 - 1 - - -
Austria 15 15 14 - 1 10 - 2
Denmark 14 14 14 - - 14 - -
Saudi Arabia 12 12 10 - 2 - - -
Sweden 12 11 10 1 2 12 1 2
Nigeria 10 8 8 2 2 - - -
Rest of EMEA 136 128 116 8 20 18 - 2EMEA 1,464 1,408 1,347 56 117 762 46 213
US 397 392 382 5 15 154 5 40
Brazil 98 99 98 -1 - 59 - 1
Canada 80 79 77 1 3 23 - 13
Mexico 66 53 34 13 32 40 13 30
Caribbean 27 27 25 - 2 - - -
Rest of Americas 56 54 41 2 15 9 1 6
Americas 724 704 657 20 67 285 19 90
China 210 203 155 7 55 203 7 52
Australia 127 124 123 3 4 36 2 10
Philippines 35 34 26 1 9 - - -
Malaysia 31 31 30 - 1 - - -
Hong Kong 30 30 30 - - 25 - -
New Zealand 17 17 16 - 1 8 - 2
Thailand 17 16 14 1 3 - - -
Singapore 15 15 15 - - 11 - -
Rest of Asia Pacific 35 32 33 3 2 10 - -1
Asia-Pacific 517 502 442 15 75 293 9 63
All markets 2,705 2,614 2,446 91 259 1,340 74 366
| PANDORA INVESTOR PRESENTATION | FY 2018

40
Working capital and cash management
DKK million Q4 2018 Q3 2018 Q2 2018 Q1 2018 Q4 2017
Inventory 3,158 3,737 3,068 2,810 2,729
- Share of revenue (last 12 months) 13.8% 16.6% 13.5% 12.4% 12.0%
Trade receivables 1,650 1,806 1,337 1,850 1,954
- Share of revenue (last 12 months) 7.2% 8.0% 5.9% 8.1% 8.6%
Trade payables -2,253 -1,847 -1,271 -1,349 -1,695
- Share of revenue (last 12 months) -9.9% -8.2% -5.6% -5.9% -7.4%
Operating working capital 2,555 3,696 3,134 3,311 2,988
- Share of revenue (last 12 months) 11.2% 16.4% 13.8% 14.6% 13.1%
Free cash flow 2,911 1,059 1,149 439 2,919
CAPEX 324 265 296 244 502
% of revenue 4% 5% 6% 5% 7%
NIBD to EBITDA (last 12 months) 0.8x 1.0x 0.8x 0.7x 0.6x
Selected KPIs
Days Sales of Inventory- last 6 months of COGS (183 days)
168 267 232 167 157
Days Sales of Outstanding- last 3 months of wholesale and 3rd party distribution revenue (90 days)
50 68 59 66 47
| PANDORA INVESTOR PRESENTATION | FY 2018

41
Hedging policy and raw materials share of production costs
COMMODITY HEDGING POLICY RAW MATERIAL SHARE OF COST OF GOODS SOLD
100%
90%
80%
70%
60%
50%
40%
30%
20%
10%Q4 Q1 Q2 Q3 Q4 Q1 Q2 Q3 Q4 Q1 Q2 Q3
HedgedInventory
lead timeExposureRealised
• Pandora hedging policy is to hedge approximately 100%, 80%, 60% and 40%, respectively, of expected gold and silver consumption in the following four quarters
• For calendar 2019, hedging of expected purchases of silver have been increased to 85%, equivalent to 100% hedging of the cost of goods related to silver due to time lag effect from inventory
46%36% 30% 27% 24% 24%
15%14%
11% 10% 9% 8%
14%14%
14%12%
9% 9%
25%36% 45% 51% 58% 59%
20152013 2014 2016 20182017
Other* Other raw materials SilverGold
• Other in 2018 consists of ~40% labour, ~30% cost to third-party set-ups (i.e. plating) and ~30% licence, customs, re-melt and minor provisions
| PANDORA INVESTOR PRESENTATION | FY 2018
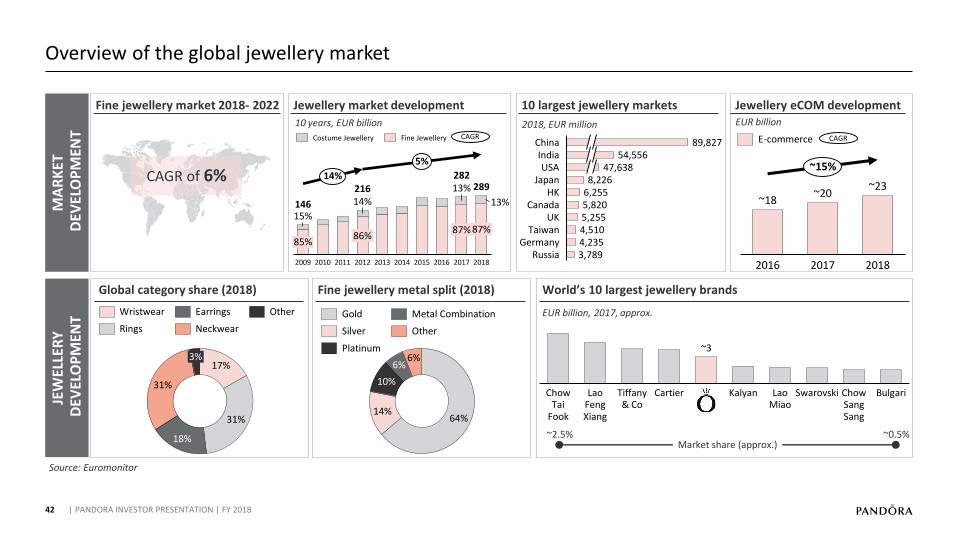
Jewellery eCOM development
World’s 10 largest jewellery brandsFine jewellery metal split (2018)Global category share (2018)
10 largest jewellery markets
42
17%
31%
18%
31%
3%
Wristwear
Rings Neckwear
OtherEarrings
Fine jewellery market 2018- 2022
CAGR of 6%
Jewellery market development
15%
85%
20112009 2010
14%
2016
86%
2012 2013 20182014 2015
13%
87%
2017
13%
87%
146
216
282289
14%
5%
Costume Jewellery Fine Jewellery CAGR
6,2555,8205,2554,5104,2353,789
USA
ChinaIndia
JapanHK
CanadaUK
TaiwanGermany
Russia
89,82754,556
47,6388,226
MA
RK
ETD
EVEL
OP
MEN
TJE
WEL
LER
YD
EVEL
OP
MEN
T
64%14%
10%
6%6%
Gold
Silver Other
Platinum
Metal Combination
Tiffany & Co
Chow Tai
Fook
KalyanLao Feng Xiang
Cartier Lao Miao
Swarovski Chow Sang Sang
Bulgari
~3
20172016 2018
~18~20
~23
~15%
E-commerce CAGR
10 years, EUR billion 2018, EUR million EUR billion
EUR billion, 2017, approx.
Market share (approx.)~2.5% ~0.5%
Source: Euromonitor
Overview of the global jewellery market
| PANDORA INVESTOR PRESENTATION | FY 2018
43 | PANDORA INVESTOR PRESENTATION | FY 2018
44 | PANDORA INVESTOR PRESENTATION | FY 2018
45
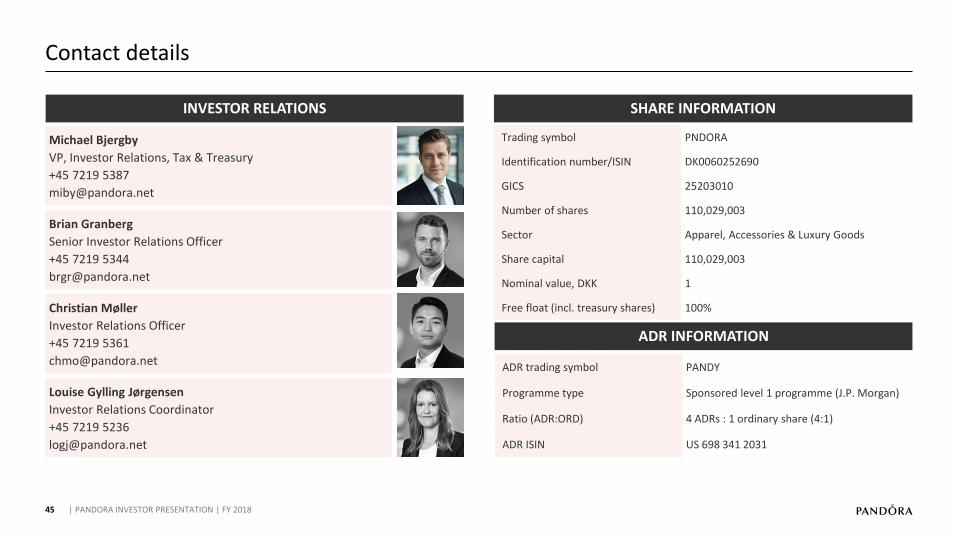
Contact details
| PANDORA INVESTOR PRESENTATION | FY 2018
SHARE INFORMATIONINVESTOR RELATIONS
Trading symbol PNDORA
Identification number/ISIN DK0060252690
GICS 25203010
Number of shares 110,029,003
Sector Apparel, Accessories & Luxury Goods
Share capital 110,029,003
Nominal value, DKK 1
Free float (incl. treasury shares) 100%
Louise Gylling Jørgensen
Investor Relations Coordinator
+45 7219 5236
ADR INFORMATION
ADR trading symbol PANDY
Programme type Sponsored level 1 programme (J.P. Morgan)
Ratio (ADR:ORD) 4 ADRs : 1 ordinary share (4:1)
ADR ISIN US 698 341 2031
Christian Møller
Investor Relations Officer
+45 7219 5361
Brian Granberg
Senior Investor Relations Officer
+45 7219 5344
Michael Bjergby
VP, Investor Relations, Tax & Treasury
+45 7219 5387