full-year results fiscal year 2014/15 of the barry callebaut group - analyst conference slides
TRANSCRIPT
Analysts Conference
November 4, 2015
Full Year Results 2014/15
November 4, 2015

Certain statements in this presentation regarding the business of Barry Callebaut are of a forward-
looking nature and are therefore based on management’s current assumptions about future
developments. Such forward-looking statements are intended to be identified by words such as
“believe,” “estimate,” “intend,” “may,” “will,” “expect,” and “project” and similar expressions as
they relate to the company. Forward-looking statements involve certain risks and uncertainties
because they relate to future events.
Actual results may vary materially from those targeted, expected or projected due to several
factors. The factors that may affect Barry Callebaut’s future financial results are discussed in the
Letter to Investors as well as in the Annual Report 2014/15. Such factors are, among others,
general economic conditions, foreign exchange fluctuations, competitive product and pricing
pressures as well as changes in tax regimes and regulatory developments. The reader is cautioned
to not unduly rely on these forward-looking statements that are accurate only as of today, Nov 4,
2015. Barry Callebaut does not undertake to publish any update or revision of any forward-looking
statements.
Cautionary note
Page 2 November 4, 2015 Analysts Conference
FY Results 2014/15
� First impressions & Highlights FY 2014/15 - CEO Antoine de Saint-Affrique
� Performance FY 2014/15 - CFO Victor Balli
� The way forward - CEO Antoine de Saint-Affrique
� Questions & Answers session - CEO & CFO
Agenda
November 4, 2015 Analysts ConferencePage 3

November 4, 2015
First impressions & Highlights FY 2014/15 - CEO Antoine de Saint-Affrique

Unique focus
and
deep expertise
People
Values
Performance
Balancing
the short
and long-term
My first impressions
November 4, 2015 Analysts ConferencePage 5
Disciplined
Innovative
Entrepreneurial

FY results 2014/15
The new normal: volatile & complex
A view on the market
November 4, 2015 Analysts ConferencePage 6
A world of new opportunities
• Consumer driven
• Premiumization,
personalization, taste,
clean/clear labels, snacking
• Sustainability & traceability
• Customer centric
• Innovate with & for customers
• New types of customers
• Currencies and economic growth
• Raw materials
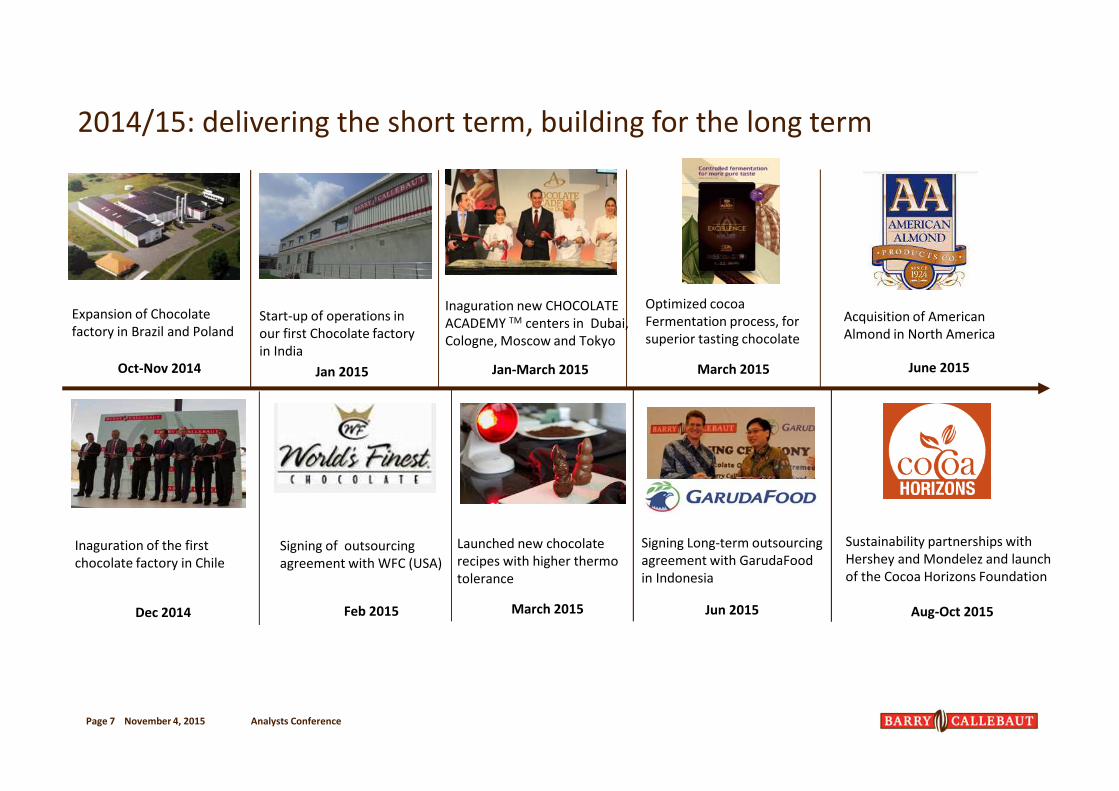
2014/15: delivering the short term, building for the long term
November 4, 2015 Analysts ConferencePage 7
Expansion of Chocolate
factory in Brazil and Poland
Oct-Nov 2014
Inaguration of the first
chocolate factory in Chile
Dec 2014
Signing of outsourcing
agreement with WFC (USA)
Feb 2015
Optimized cocoa
Fermentation process, for
superior tasting chocolate
March 2015
Start-up of operations in
our first Chocolate factory
in India
Jan 2015
Inaguration new CHOCOLATE
ACADEMY TM centers in Dubai,
Cologne, Moscow and Tokyo
Jan-March 2015
Signing Long-term outsourcing
agreement with GarudaFood
in Indonesia
Jun 2015
Acquisition of American
Almond in North America
June 2015
Sustainability partnerships with
Hershey and Mondelez and launch
of the Cocoa Horizons Foundation
Aug-Oct 2015
Launched new chocolate
recipes with higher thermo
tolerance
March 2015
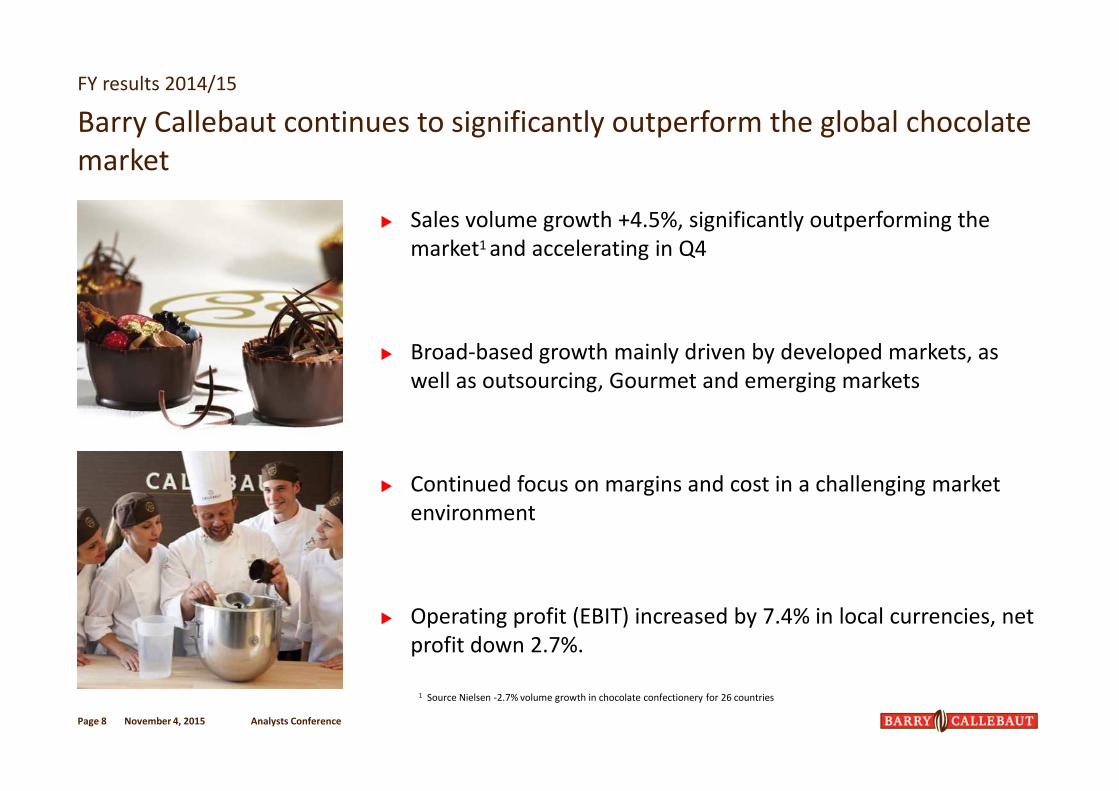
� Sales volume growth +4.5%, significantly outperforming the
market1 and accelerating in Q4
� Broad-based growth mainly driven by developed markets, as
well as outsourcing, Gourmet and emerging markets
� Continued focus on margins and cost in a challenging market
environment
� Operating profit (EBIT) increased by 7.4% in local currencies, net
profit down 2.7%.
FY results 2014/15
Barry Callebaut continues to significantly outperform the global chocolate
market
November 4, 2015 Analysts ConferencePage 8
1 Source Nielsen -2.7% volume growth in chocolate confectionery for 26 countries

November 4, 2015
Performance FY 2014/15 – CFO Victor Balli
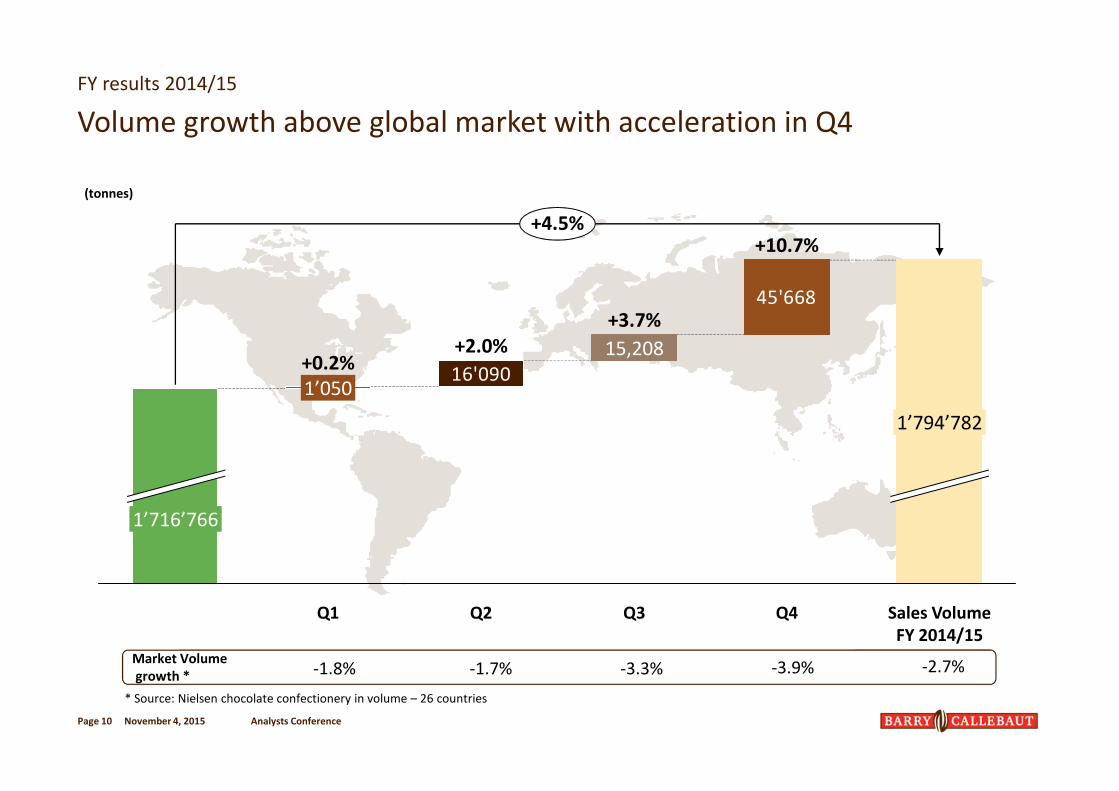
FY results 2014/15
Volume growth above global market with acceleration in Q4
November 4, 2015 Analysts ConferencePage 10
45'668
16'090
Sales Volume
FY 2014/15
+4.5%
1’794’782
Q4
+10.7%
Q3
+3.7%
15,208
Q2
+2.0%
Q1
+0.2%
1’050
1’716’766
(tonnes)
Market Volume
growth * -1.8% -1.7% -3.3% -2.7%-3.9%
* Source: Nielsen chocolate confectionery in volume – 26 countries

Emerging Markets Long-term outsourcing &
Strategic Partnerships
Gourmet & Specialties
FY results 2014/15
... and with positive contribution from our key growth drivers
November 4, 2015 Analysts ConferencePage 11
33%
Volume growth
FY 2014/15
%
of total Group
Sales Volume
CAGR 5 year
Volume
32%10%
+6.0% vs prior year+5.1% vs prior year +6.6% vs prior year
+6.5 %+17.3% +16.5%

Solid volume growth gaining momentum, strong profit improvement in
local currencies
FY results 2014/15
Group performance
(In CHF mio.)
FY 2014/15
(in CHF)
% vs prior year
(in CHF)
% vs prior year
in local
currencies
Sales Volume Total
(in tonnes)
1,794,782 +4.5%
Sales Revenue 6,241.9 +6.4% +12.1%
Gross Profit 846.8 -1.7% +4.8%
EBIT TotalEBIT per tonne
414.8
231.1
-0.3%-4.7%
+7.4%+2.9%
Net profit for the year 239.9 -5.9% -2.7%
November 4, 2015 Analysts ConferencePage 12

Volume
growth
Page 13
+3.9% +4.7% +7.2% +5.1%
25%
4%
28%
Europe Americas Asia Pacific Global Cocoa
42%
26%
4%
28%
FY results 2014/15
Good performance in developed regions
EBIT
growth in
local currencies
+19.7% -0.3% +5.9% -33.7%
EBIT
growth in CHF +8.1% +3.3% -0.4% -42.4%
November 4, 2015 Analysts Conference
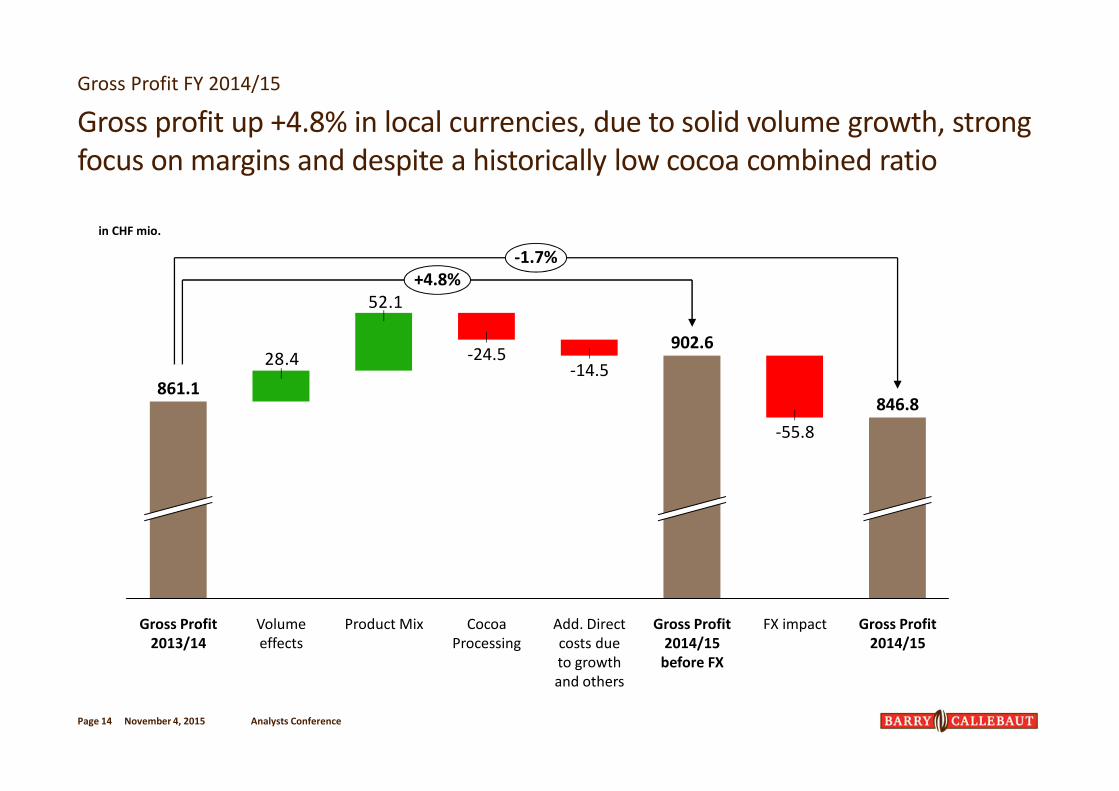
Gross Profit FY 2014/15
Page 14
in CHF mio.
Gross profit up +4.8% in local currencies, due to solid volume growth, strong
focus on margins and despite a historically low cocoa combined ratio
November 4, 2015 Analysts Conference
52.1
28.4
Gross Profit
2013/14
-24.5
861.1
Volume
effects
Cocoa
Processing
Add. Direct
costs due
to growth
and others
-14.5
Gross Profit
2014/15
before FX
-55.8
FX impact
902.6
846.8
Gross Profit
2014/15
-1.7%
+4.8%
Product Mix
0.0
1.0
2.0
3.0
4.0
Oct-07 Oct-08 Oct-09 Oct-10 Oct-11 Oct-12 Oct-13 Oct-14 Oct-15
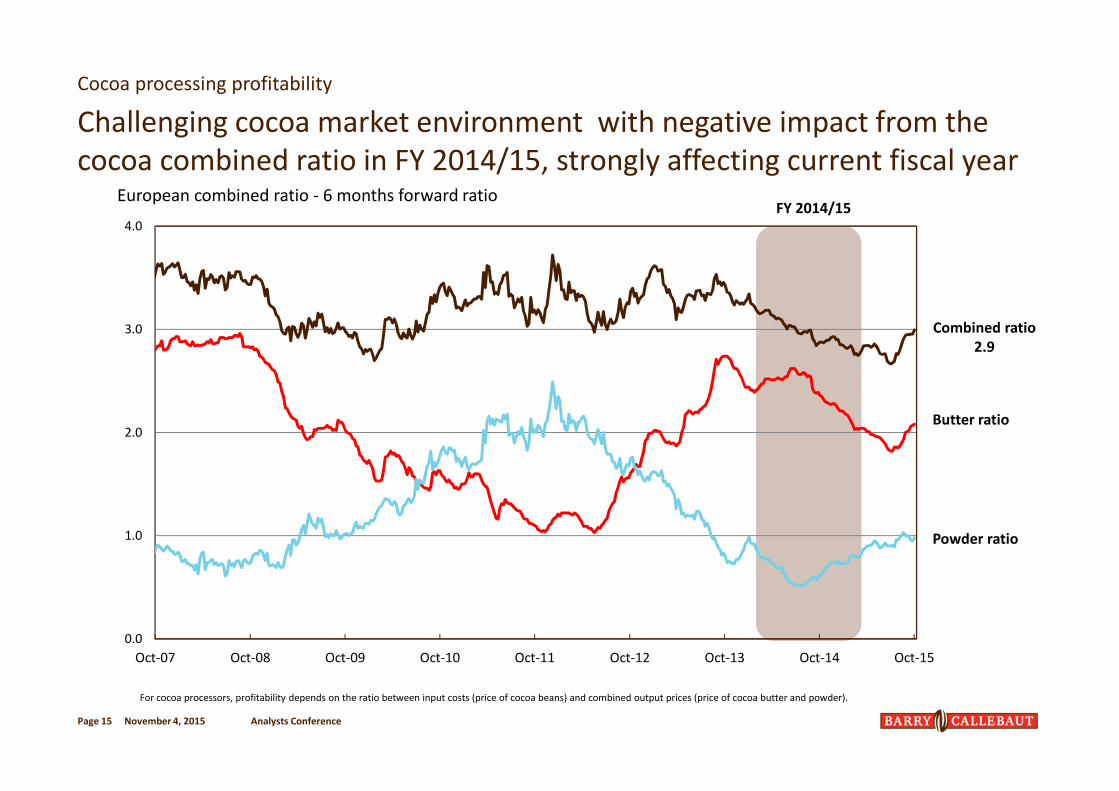
Challenging cocoa market environment with negative impact from the
cocoa combined ratio in FY 2014/15, strongly affecting current fiscal year
Cocoa processing profitability
European combined ratio - 6 months forward ratio
For cocoa processors, profitability depends on the ratio between input costs (price of cocoa beans) and combined output prices (price of cocoa butter and powder).
November 4, 2015 Analysts ConferencePage 15
Combined ratio
2.9
Butter ratio
Powder ratio
FY 2014/15
Analysts ConferencePage 16
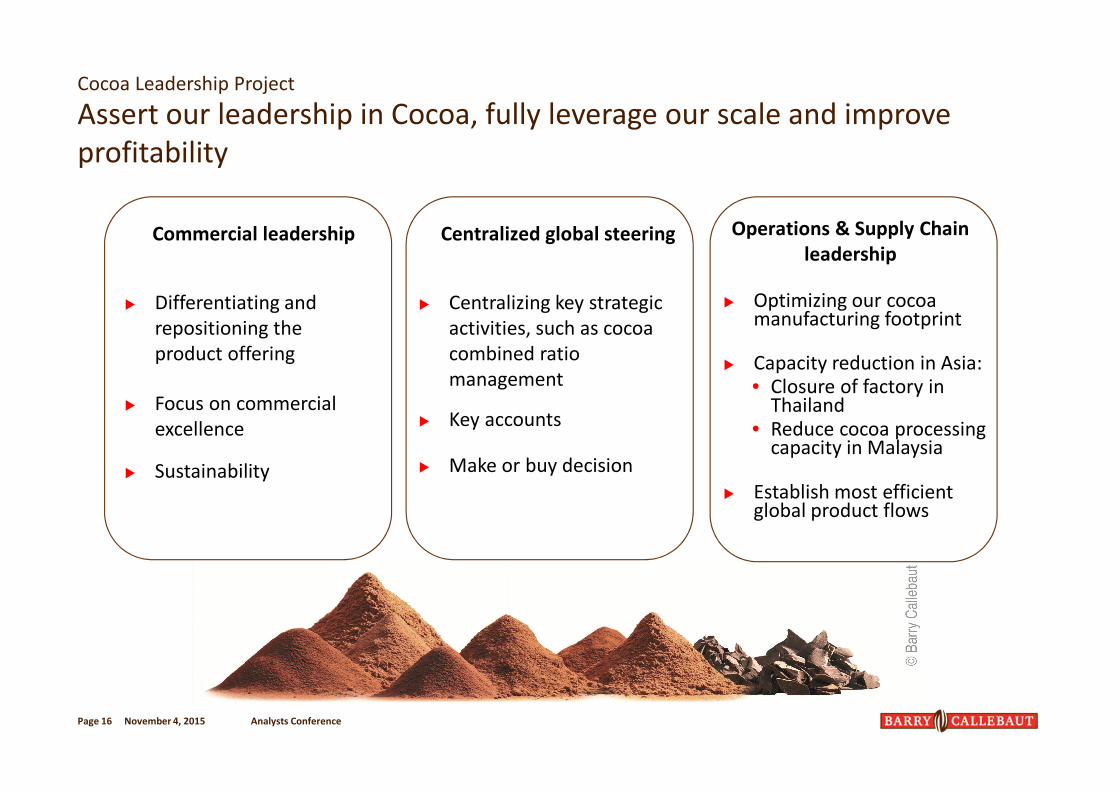
Operations & Supply Chain
leadershipCommercial leadership Centralized global steering
Assert our leadership in Cocoa, fully leverage our scale and improve
profitability
Cocoa Leadership Project
November 4, 2015
� Differentiating and
repositioning the
product offering
� Focus on commercial
excellence
� Sustainability
� Centralizing key strategic
activities, such as cocoa
combined ratio
management
� Key accounts
� Make or buy decision
� Optimizing our cocoa manufacturing footprint
� Capacity reduction in Asia:• Closure of factory in
Thailand
• Reduce cocoa processing capacity in Malaysia
� Establish most efficient global product flows
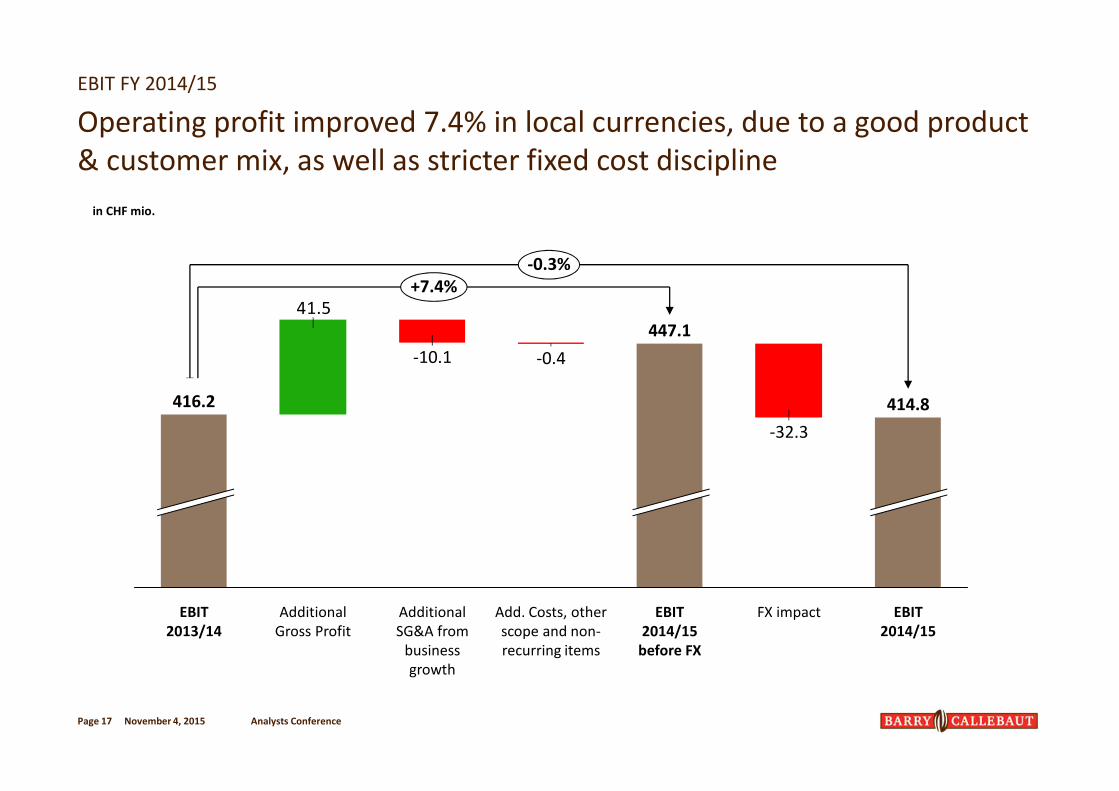
EBIT FY 2014/15
Operating profit improved 7.4% in local currencies, due to a good product
& customer mix, as well as stricter fixed cost discipline
Page 17
in CHF mio.
November 4, 2015 Analysts Conference
41.5
414.8
+7.4%
-0.3%
EBIT
2014/15
FX impact
447.1
-0.4
Add. Costs, other
scope and non-
recurring items
-32.3
EBIT
2014/15
before FX
Additional
SG&A from
business
growth
-10.1
Additional
Gross Profit
EBIT
2013/14
416.2
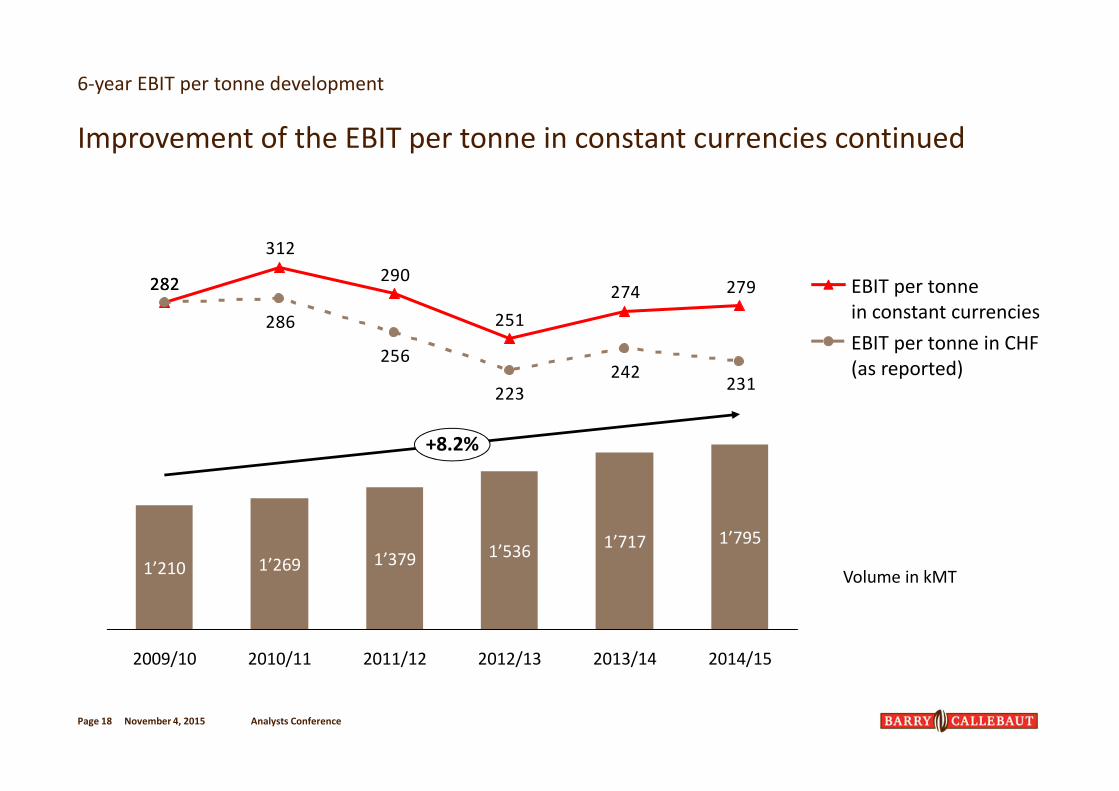
279274
251
290
312
282
231242
223
256
286
282
+8.2%
2014/15
1’795
2013/14
1’717
2012/13
1’536
2011/12
1’379
2010/11
1’269
2009/10
1’210Volume in kMT
Page 18
EBIT per tonne
in constant currencies
EBIT per tonne in CHF
(as reported)
6-year EBIT per tonne development
Improvement of the EBIT per tonne in constant currencies continued
November 4, 2015 Analysts Conference
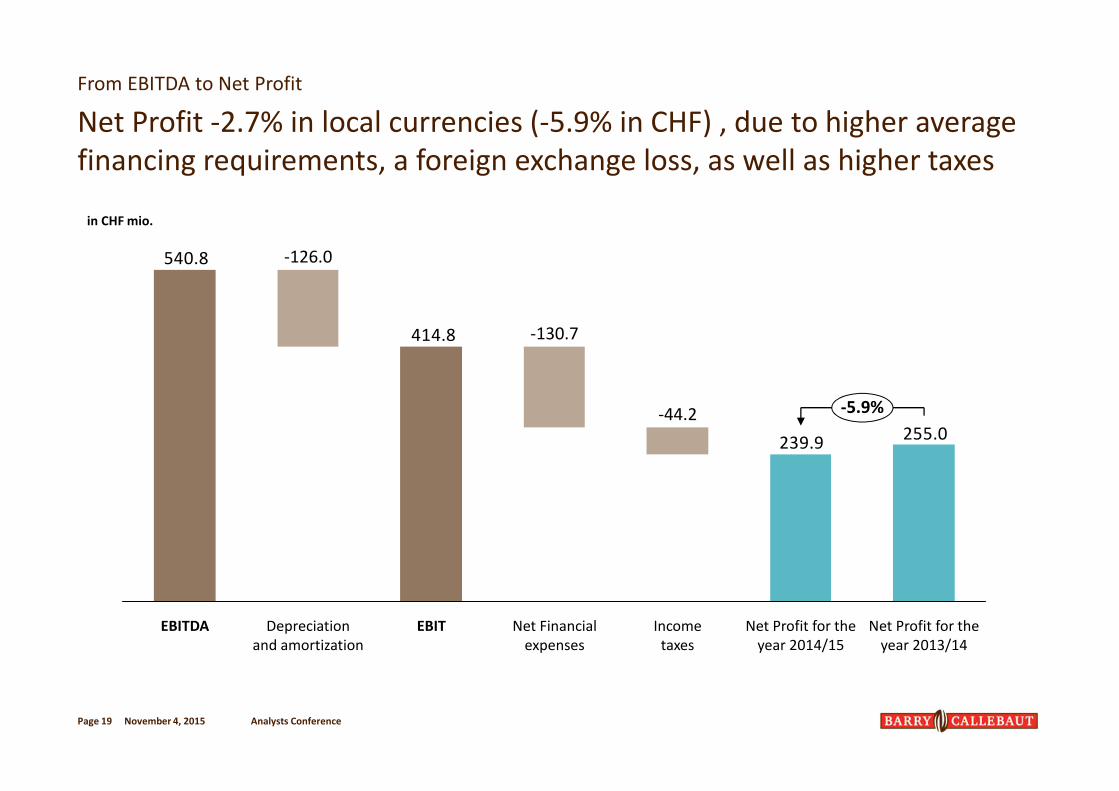
From EBITDA to Net Profit
Net Profit -2.7% in local currencies (-5.9% in CHF) , due to higher average
financing requirements, a foreign exchange loss, as well as higher taxes
Page 19
255.0239.9
414.8
540.8
Net Financial
expenses
-130.7
EBITDepreciation
and amortization
-126.0
Net Profit for the
year 2013/14
-5.9%
Net Profit for the
year 2014/15
Income
taxes
-44.2
EBITDA
in CHF mio.
November 4, 2015 Analysts Conference
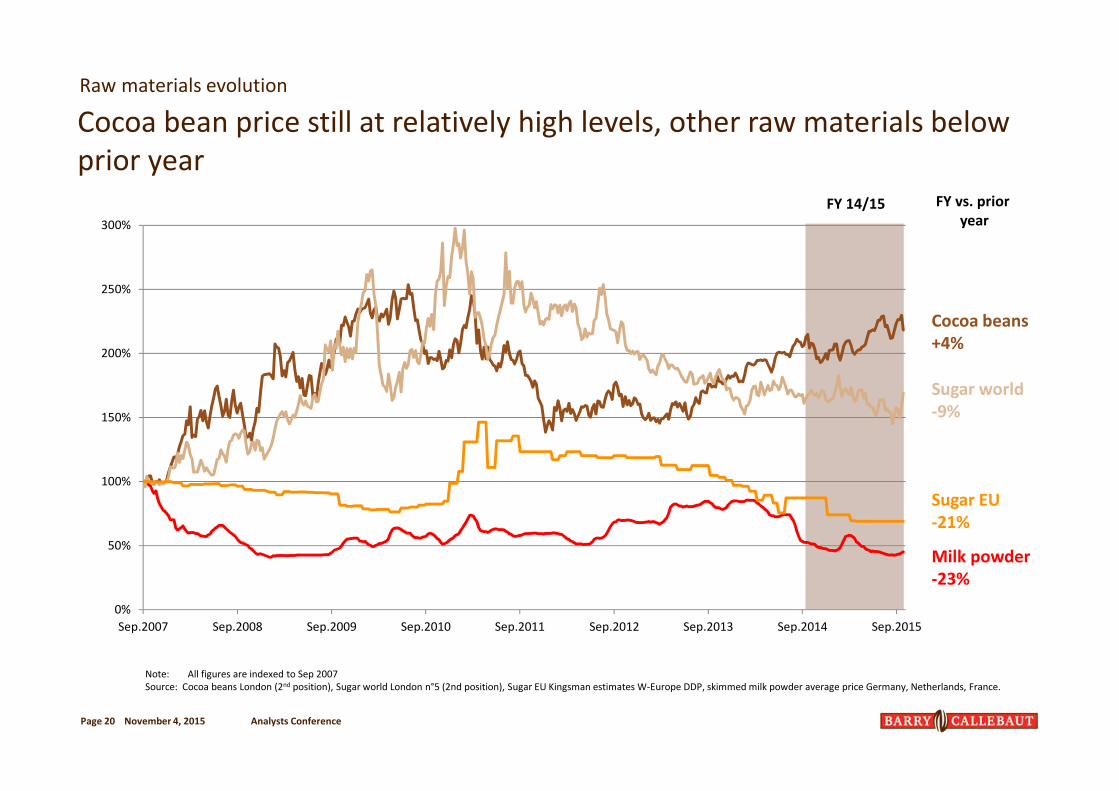
0%
50%
100%
150%
200%
250%
300%
Sep.2007 Sep.2008 Sep.2009 Sep.2010 Sep.2011 Sep.2012 Sep.2013 Sep.2014 Sep.2015
Cocoa bean price still at relatively high levels, other raw materials below
prior year
Raw materials evolution
Cocoa beans
+4%
Milk powder
-23%
Sugar EU
-21%
Sugar world
-9%
Page 20
FY 14/15 FY vs. prior
year
November 4, 2015 Analysts Conference
Note: All figures are indexed to Sep 2007
Source: Cocoa beans London (2nd position), Sugar world London n°5 (2nd position), Sugar EU Kingsman estimates W-Europe DDP, skimmed milk powder average price Germany, Netherlands, France.

November 4, 2015 Analysts ConferencePage 21
Receivables Stocks Payables
-8.7%
Net
Working
Capital
Aug 15
1’530
-36
-170
Price impact
and
operational
improvements
-114
Others and
FX impacts
Growth
impact
Growth
impact
-111
Operational
Improvement
+80
Price and
operational
impact
+170
Growth
impact
+35
Net
Working
Capital
Aug 14
1’675
in CHF mio.
Working Capital below prior year as a result of reduction in inventories
and positive currencies effect
Net Working Capital
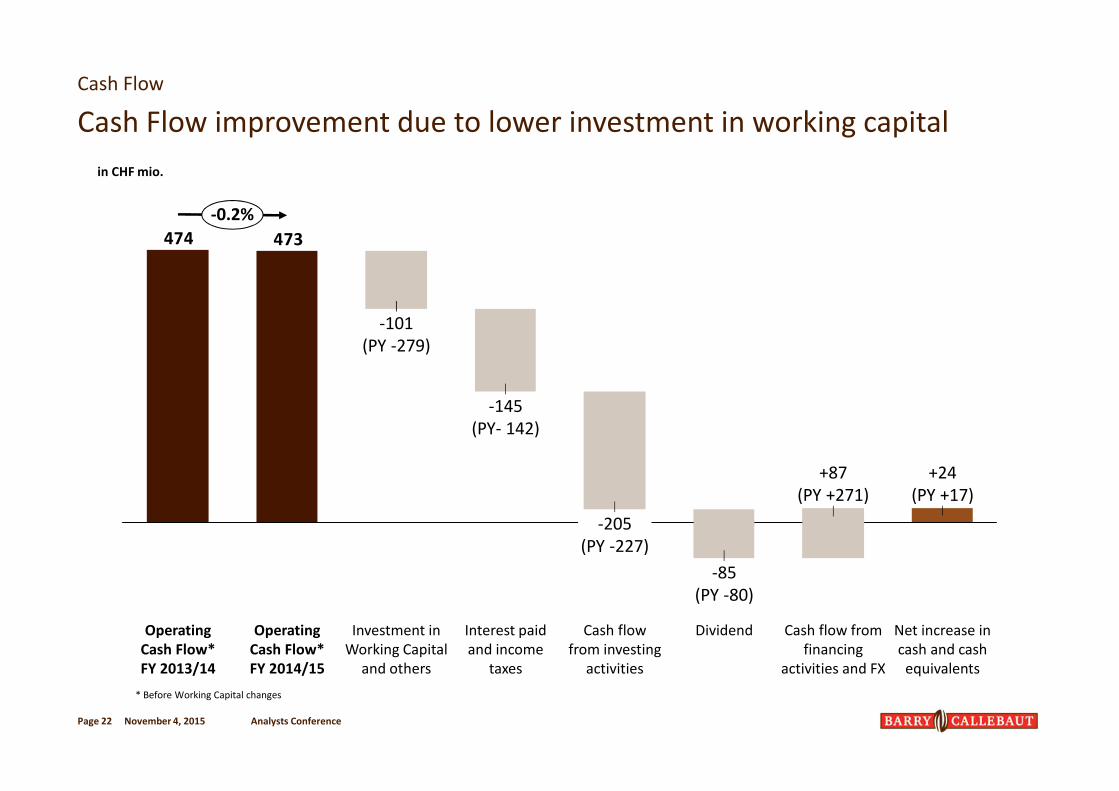
Cash Flow
Cash Flow improvement due to lower investment in working capital
November 4, 2015 Analysts Conference
* Before Working Capital changes
in CHF mio.
Page 22
473474
Net increase in
cash and cash
equivalents
-0.2%
+24
(PY +17)
Cash flow from
financing
activities and FX
+87
(PY +271)
Dividend
-85
(PY -80)
Cash flow
from investing
activities
-205
(PY -227)
Interest paid
and income
taxes
-145
(PY- 142)
Investment in
Working Capital
and others
-101
(PY -279)
Operating
Cash Flow*
FY 2014/15
Operating
Cash Flow*
FY 2013/14

Deleveraging of the company and improvement of key financial ratios
remain a high priority
Balance Sheet & key ratios
November 4, 2015 Analysts ConferencePage 23
Aug 15 Aug 14
Total Assets [CHF m] 5'429.4 5'167.5
Net Working Capital [CHF m] 1'529.7 1'674.6
Non-Current Assets [CHF m] 2'185.5 2'175.6
Net Debt [CHF m] 1'728.0 1'803.5
Shareholders' Equity [CHF m] 1'772.8 1'790.7
Debt/Equity ratio 97.5% 100.7%
Solvency ratio 32.7% 34.7%
Net debt / EBITDA 3.2x 3.4x
Interest cover ratio 4.1x 4.5x
ROIC 9.8% 10.5%
ROE 13.5% 14.7%
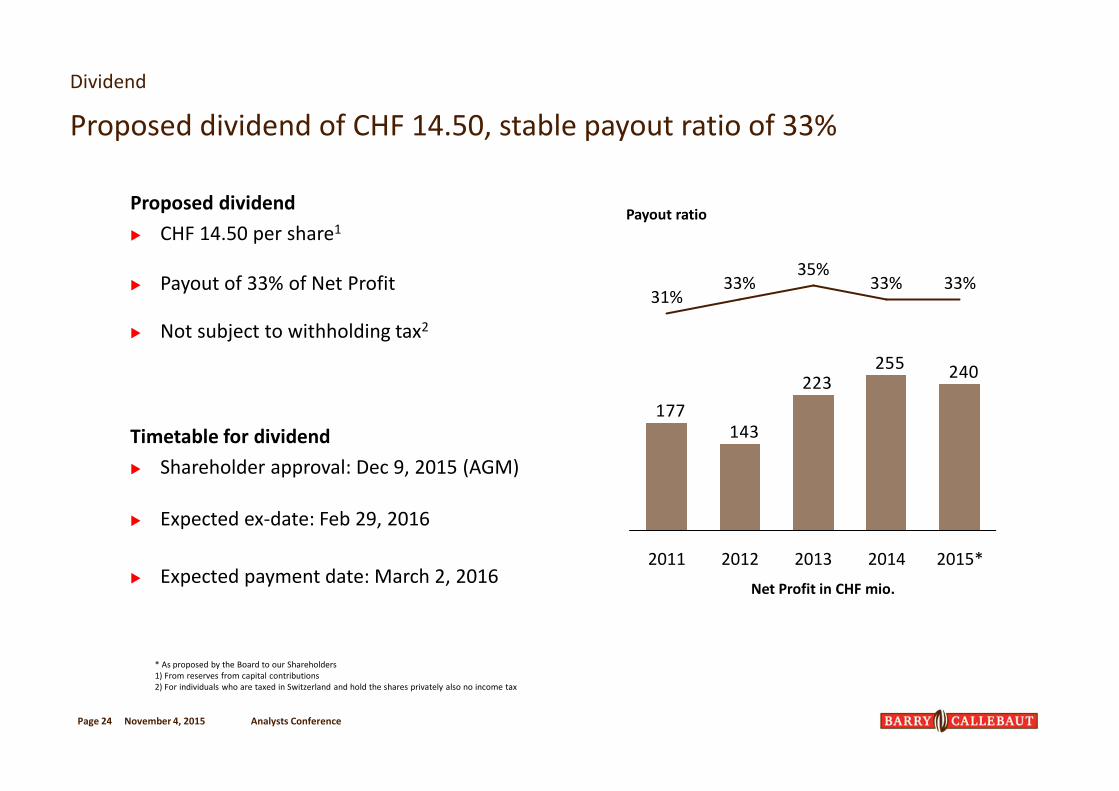
Proposed dividend of CHF 14.50, stable payout ratio of 33%
Proposed dividend
� CHF 14.50 per share1
� Payout of 33% of Net Profit
� Not subject to withholding tax2
Timetable for dividend
� Shareholder approval: Dec 9, 2015 (AGM)
� Expected ex-date: Feb 29, 2016
� Expected payment date: March 2, 2016
Dividend
November 4, 2015 Analysts ConferencePage 24
240255
223
143177
35%
2014
33%
2012
33%
2013 2015*
33%
2011
31%
Payout ratio
Net Profit in CHF mio.
* As proposed by the Board to our Shareholders
1) From reserves from capital contributions
2) For individuals who are taxed in Switzerland and hold the shares privately also no income tax

5-year development
Long-term and continued strong volume and EBIT growth in a capital
intensive business
November 4, 2015 Analysts ConferencePage 25
14/15
CAGR +9.1%
13/1412/1311/1210/11 14/1512/13 13/1410/11 11/12
CAGR +7.9%
BC Group
Currency effects
(cumulated)
Sales Volume EBIT
14/15
CAGR +14.6%
10/11 11/12 13/1412/13
Net Working Capital
14/15
CAGR +14.6%
11/12 13/1412/1310/11
CAPEX

November 4, 2015
The way forward – CEO Antoine de Saint-Affrique
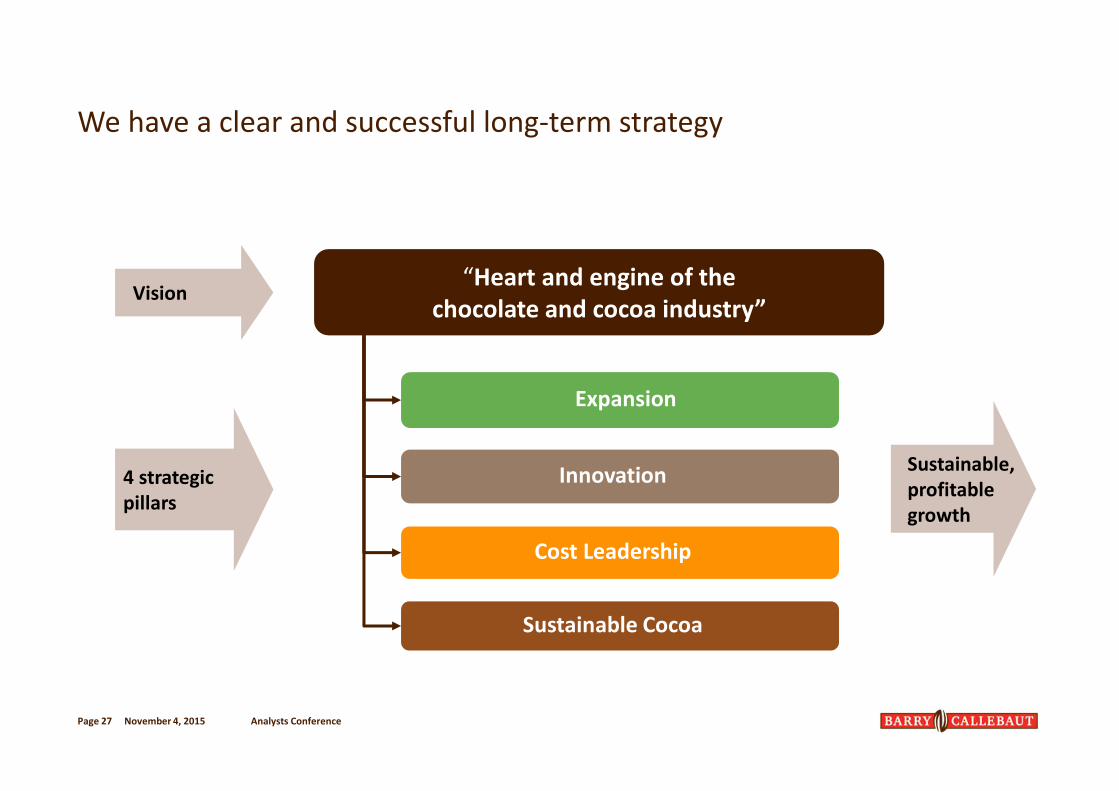
We have a clear and successful long-term strategy
November 4, 2015 Analysts ConferencePage 27
Vision
4 strategic
pillars
Sustainable,
profitable
growth
Expansion
Innovation
Cost Leadership
Sustainable Cocoa
“Heart and engine of the
chocolate and cocoa industry”
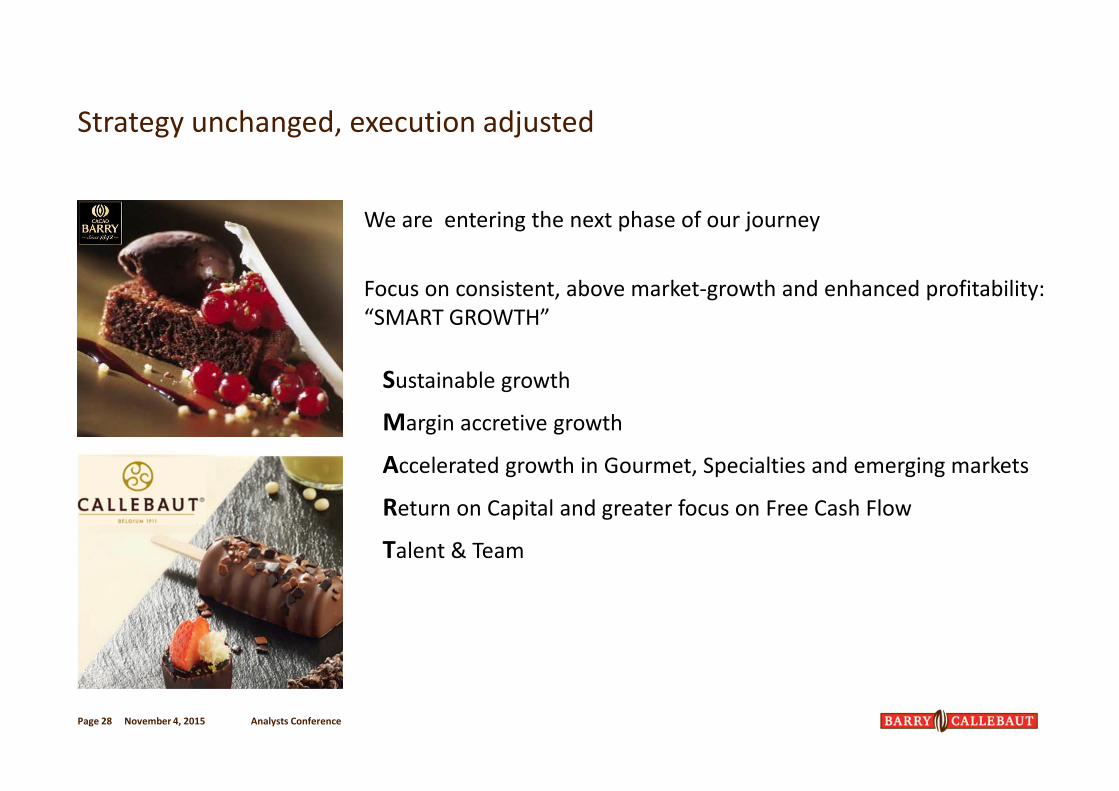
We are entering the next phase of our journey
Focus on consistent, above market-growth and enhanced profitability:
“SMART GROWTH”
Sustainable growth
Margin accretive growth
Accelerated growth in Gourmet, Specialties and emerging markets
Return on Capital and greater focus on Free Cash Flow
Talent & Team
Strategy unchanged, execution adjusted
November 4, 2015 Analysts ConferencePage 28

Expansion: Accelerate Gourmet, Specialties and Emerging Markets
Analysts Conference
Further drive
Gourmet & Specialties
Further leverage
Outsourcing & strategic
partnerships
Further expand in
Emerging markets
November 4, 2015Page 29
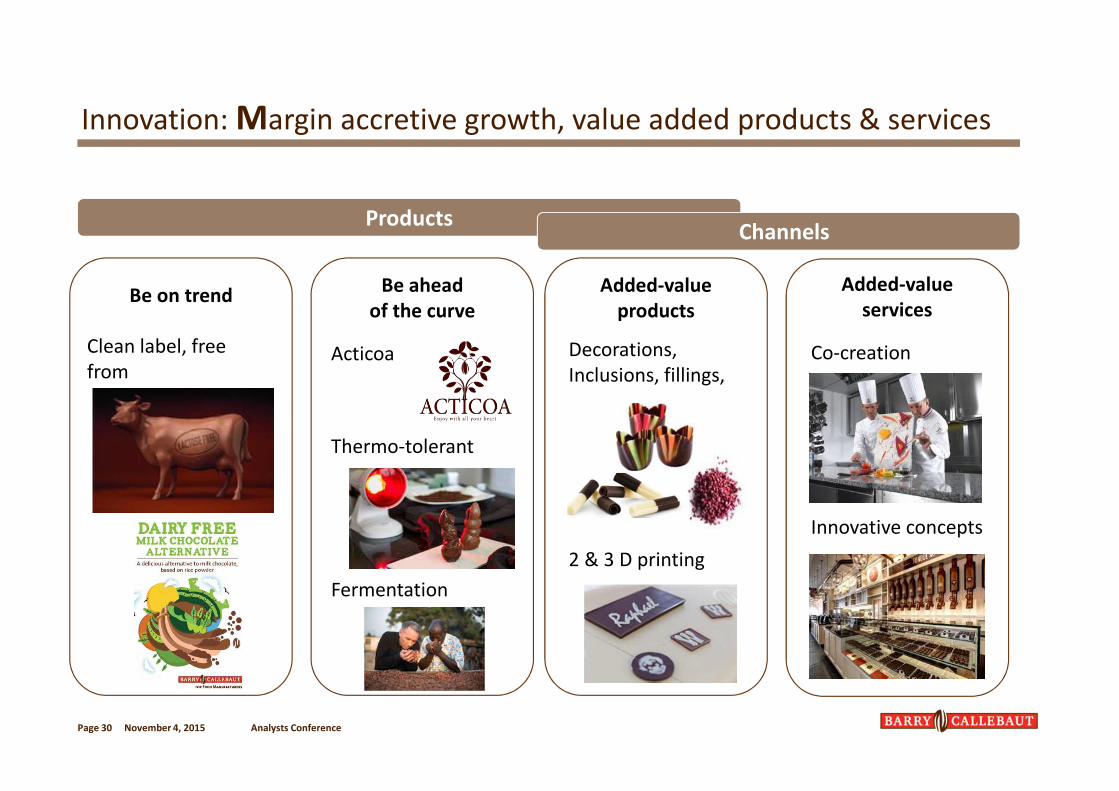
November 4, 2015 Analysts ConferencePage 30
Be on trendBe ahead
of the curve
Added-value
products
Added-value
services
ProductsChannels
ActicoaClean label, free
fromDecorations,
Inclusions, fillings,
Thermo-tolerant
Co-creation
Innovation: Margin accretive growth, value added products & services
Fermentation
2 & 3 D printing
Innovative concepts
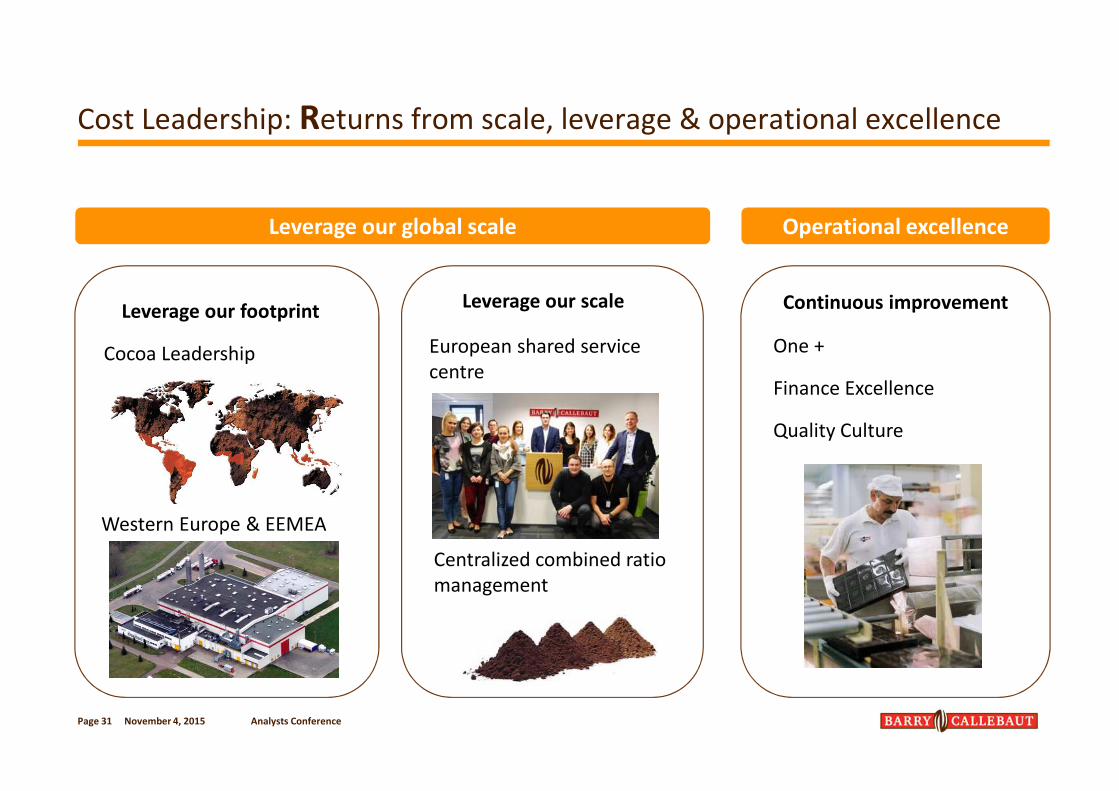
November 4, 2015 Analysts ConferencePage 31
Cost Leadership: Returns from scale, leverage & operational excellence
Leverage our global scale Operational excellence
Leverage our footprintLeverage our scale
European shared service
centreCocoa Leadership
Continuous improvement
One +
Finance Excellence
Quality Culture
Centralized combined ratio
management
Western Europe & EEMEA
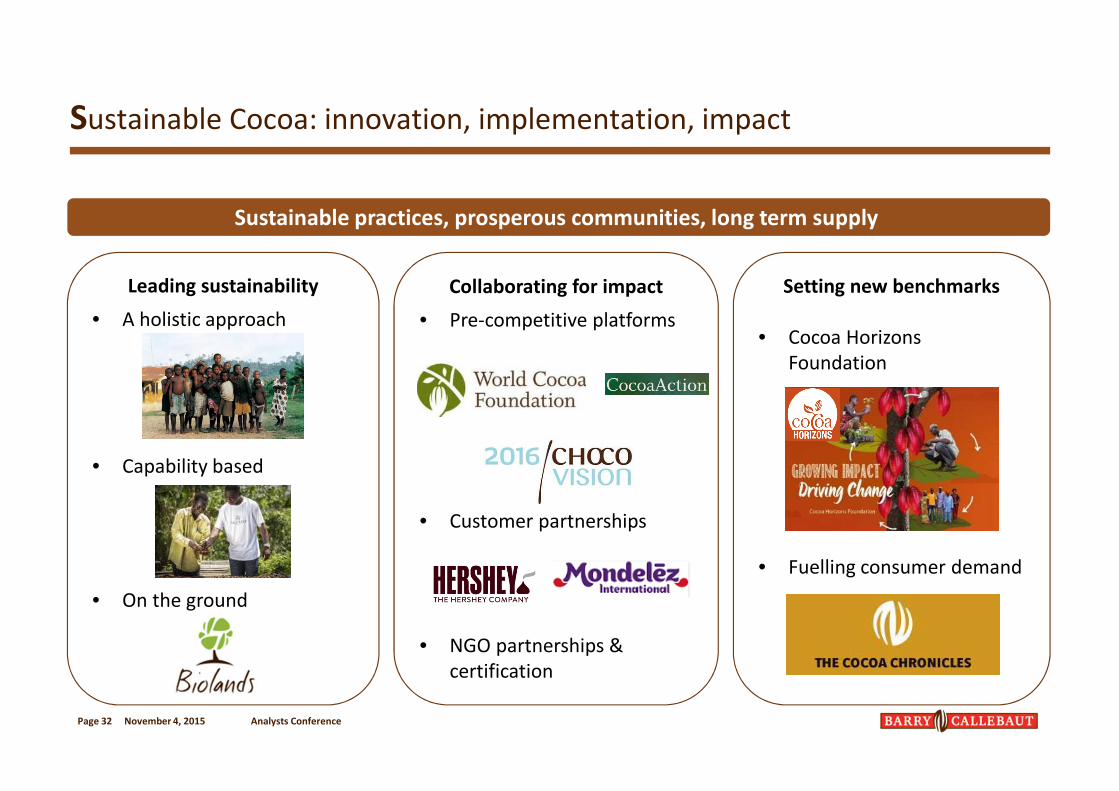
Setting new benchmarks
• Cocoa Horizons
Foundation
• Fuelling consumer demand
Analysts ConferencePage 32
Leading sustainability
• A holistic approach
• Capability based
• On the ground
Collaborating for impact
• Pre-competitive platforms
• Customer partnerships
• NGO partnerships &
certification
Sustainable practices, prosperous communities, long term supply
Sustainable Cocoa: innovation, implementation, impact
November 4, 2015

Outlook
Strive for smart balance between consistent, above-market volume growth
and enhanced profitability
November 4, 2015 Analysts ConferencePage 33
Mid-term guidance (until 2017/18)
We will strike a balance between volume growth and enhanced
profitability as well as free cash flow generation: “smart growth”
� Average volume growth 4-6%
� EBIT growth on average above volume growth1
Outlook
� Challenging fiscal year 2015/16 due to the current cocoa
products market, which will temporarily affect our profitability
1 In local currencies and barring any major unforeseen events

Thank you
November 4, 2015 Analysts ConferencePage 34